Towards Integrated Estuarine Management
|
|
|
- Alexandrina Jenkins
- 10 years ago
- Views:
Transcription
1 Towards Integrated Estuarine Management
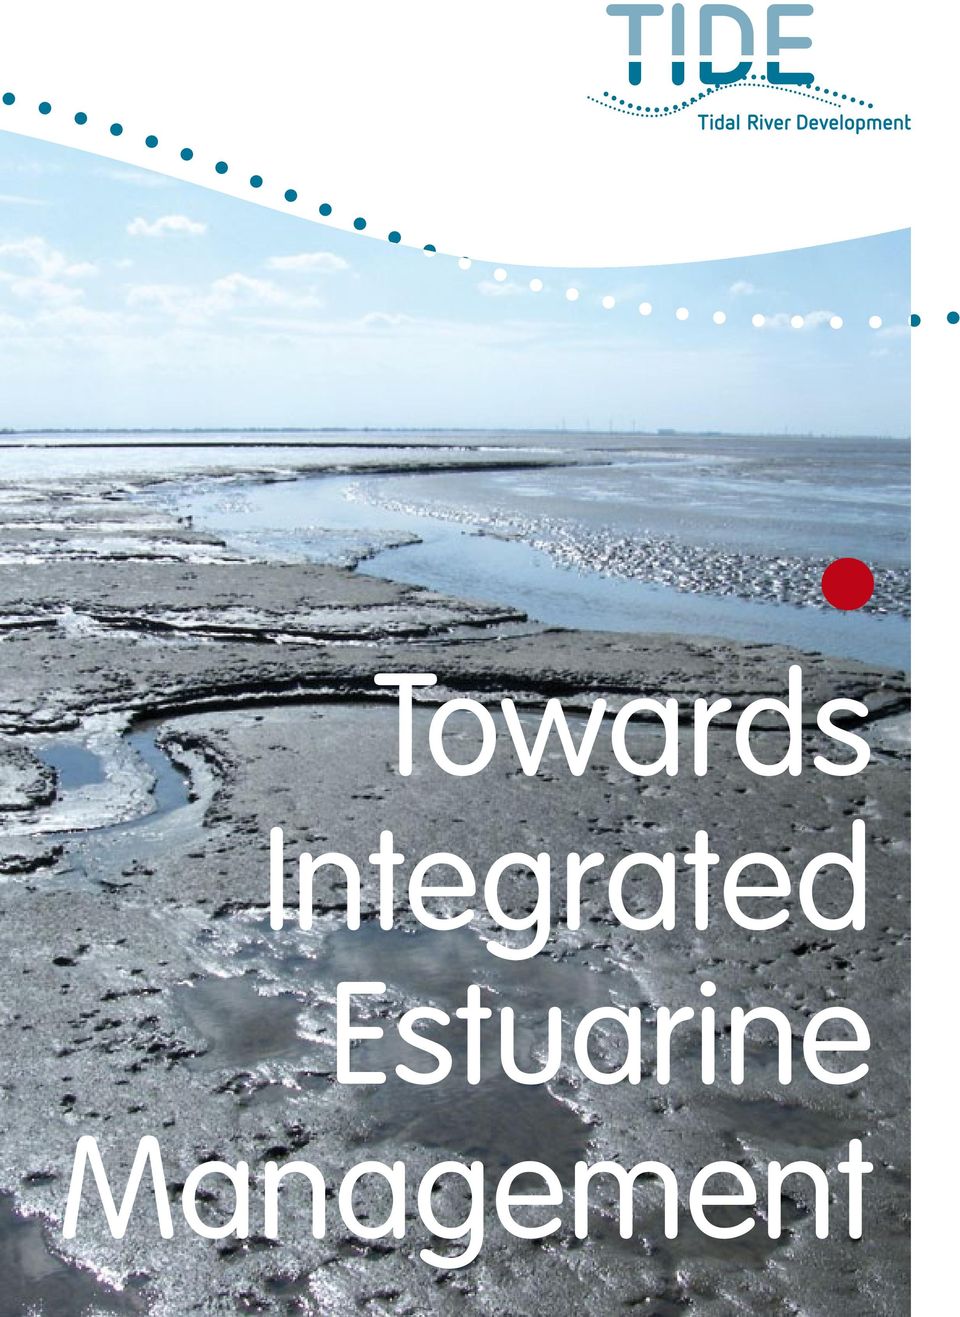
2 Towards Integrated Estuarine Management March 2013

3 2 Table of Contents Table of Contents 3 Table of Contents 1 Introduction Why TIDE?... 6 TIDE Messages... 8 The four TIDE Estuaries Zonation...12 Historical Evolution...13 Estuary Functioning Hydro-geomorphology...20 Filtering Functions...22 Primary Production...23 Dissolved Oxygen Levels...24 Habitats & Bird Distribution Management initiatives and governance...49 The Legal Framework...50 Implementation of EU Directives...51 SWOT Analysis Environmental Assessment...53 Management measures Management Measures...58 Evaluation of Measures...59 Achieving Natura 2000/WFD Requirements...60 Delivery of Ecosystem Services...60 Managed Realignment Measures...62 Aspects related to Sedimentation, Site Selection and Design of Management Measures...64 Recommendations Ecosystem Services...29 Ecosystem Services in relation to Structure and Functioning...30 The TIDE Importance Score of Ecosystem Services...32 Service Demands...34 Service Supply...34 The Ecosystem Services in Detail...35 Biodiversity...35 Water and Air Quality Regulation Services...35 Water and Sediment Quantity Regulating Services Cultural Services...36 Important Habitats and Zones for Delivery of Ecosystem Services...36 Valuation & Application Monitoring...67 Types of Monitoring...68 Opportunities for Standardisation...69 The Pyramid Approach of Monitoring...70 TIDE Toolbox Uses and Conflicts...39 The Confl ict Matrix Approach...40 Human Uses...41 Confl icting Uses and Users in the TIDE Estuaries...43 Mechanisms of Resolving Confl icts...46 Imprint...76

4 Introduction Introduction Why TIDE? TIDE Messages TIDE

5 6 Introduction Introduction 7 Introduction These common challenges led to the EU INTERREG IV B project TIDE (Tidal River Development). TIDE addresses the necessary ingredients for a sustainable estuarine management strategy. The complexity of estuaries requires integrated management which is fundamental to achieving the Ecosystem Approach. This project has applied the concept of Ecosystem Services as a central element of an integrated management. This approach aims to preserve the natural functioning of the system whilst recognising humans as an integral component of the ecosystem. 1 Different uses: Port of Hamburg, Elbe HPA Protected birds and fi shes: Common snipe, Freshwater lamprey. IBP Elbe Estuary Why TIDE? Estuaries are amongst the most socio-economically and ecologically important environments which support large urban, agricultural and industrial areas both surrounding the estuaries and in their catchments. They are the sites of many major cities and ports worldwide and have a high economic value for food production and recreation as well as nutrient and contaminant recycling. They are also important as nursery areas for many marine fi shes and overwintering areas for waterbirds. However, because of these often competing and confl icting uses and users, estuaries and their management face many challenges. Hence, the management of estuaries and their catchments has to ensure that their natural characteristics are protected and maintained, whilst at the same time ensuring the present and future delivery of ecosystem services and benefi ts required by society. In particular, valuable, productive and safe living and recreational space has to be safeguarded. This big idea is termed the Ecosystem Approach as defined by the global Convention on Biological Diversity. The Ecosystem Approach is a strategy for the integrated management of land, water and living resources that promotes conservation and sustainable use in an equitable way. It is based on the application of appropriate scientifi c methodologies focused on levels of biological organisation which encompass the essential processes, functions and interactions among organisms and their environment. It recognises that humans, with their cultural diversity, are an integral component of ecosystems. The four estuaries Elbe, Humber, Scheldt and Weser in the North Sea Region face similar challenges: They all support major cities and ports, are important shipping channels, have large catchments containing industry and agriculture, and have similar physical characteristics in being coastal plain estuaries with high tidal infl uence and high sediment transport. At the same time, they are conservation-designated Natura 2000 sites protected by EU legislation because of their habitats, large fi sh nursery areas and large populations of overwintering waterbirds. As a result, the management of these systems is extremely challenging as it has to consider the different estuary functions, stakeholder and resident interests, and the implementation of the national and European legislative framework. As such, there are many types of existing (often sectoral) estuarine management plans. In order to be sustainable, the management of these dynamic and complex environments should lead to triple wins for ecology, economy and society. TIDE has brought together relevant interdisciplinary scientifi c expertise and partners of various institutions related to estuarine science and management. TIDE has provided knowledge on estuarine functioning and the delivery of ecosystem services which in turn can provide societal benefi ts. Governance structures and related aspects of communication and public participation have been evaluated and restoration and management measures indicated as necessary. TIDE has also carried out an inter-estuarine comparison of most of these aspects showing how the different aspects of integrated management relate to each other. TIDE partners established and involved Regional Working Groups (RWGs) in particular activities such as determining the demand for ecosystem services, or using expert judgement to determine estuarine-specifi c confl ict matrices. TIDE Approach ECOLOGY influence MEASURES result in Collection of intervention examples Feasibility studies and evaluation of new pilot measures Comparison of dredging and relocation strategies Comparative analysis of management of uncertainties in Environmental Impact Assessments ECONOMY ESTUARY FUNCTIONS Description of historical changes Interestuary comparison of geomorphology, hydrodynamics and ecology Interestuary comparison of monitoring schemes ECOSYSTEM SERVICES Inventory and description Increased understanding solutions, best practices Examples, for decision makers TIDE REPORTS & TOOLBOX implements Recommendations promotes public acceptance provide Different uses: recreation & shipping (Weser). Nowara SOCIETY SOCIETAL BENEFITS Estuary-specific definition enable ESTUARY USES Analysis of uses Analysis of conflicts and synergies between the uses develops require GOVERNANCE SWOT analysis of management plans Development of generic and site-specific management plans COMMUNICATION Development of public communication concept Yellow boxes refer to general processes taking place in the ecological, economical and societal realms of an estuary and the arrows point to the inter-relations between them. White boxes refer to the activities to be conducted by the TIDE project in the framework of these various processes.

6 8 Introduction Introduction 9 1 Tegeler Plate Unterweser NLWKN The success of any management strategy and measure depends on whether its outcome is monitored appropriately, i.e. the right amount of the right parameters at the right location. The monitoring may be for operational reasons, e.g. to ensure a navigational route remains open or that industries comply with licences to operate in an environmentally safe manner, or merely to determine the overall health of the system, e.g. whether or not the ecology is in Favourable Conservation Status or Good Ecological Status according to respective European Directives. It is important that monitoring programmes are cost-effective and fit-for-purpose and should be integrated so that they not only allow evaluation of a management strategy or operational objective, but also allow a true understanding of the functioning and development of the whole estuarine system. All data should also be maintained in a common and widely-available database. TIDE has shown that the successful implementation of management plans and measures requires an appropriate communication strategy, or at least providing substantial knowledge, in order to be accepted by the public and stakeholders. TIDE Messages In recorded history, estuaries have had to accommodate both natural events and human demands such as space for settlement, agricultural and industrial land use, and supporting ports and navigation. This, together with a complicated governance framework, has resulted in a system of multiple uses which have often led to multiple confl icts. Here we provide the main results of TIDE addressing those challenges and giving our conclusions and recommendations. Successful management and governance requires us to: understand the dynamics and functioning of estuaries in relation to both natural and anthropogenic features, and to pass on this knowledge to estuarine managers. The TIDE project has shown that whilst the four estuaries differ from each other, they also have in common certain basic processes, structures and demands. The TIDE studies have shown that different estuarine zones may have different functions, ecology and human uses. However, estuarine managers must consider the system as a whole when decisions have to be taken or management measures implemented; this will then achieve the most sustainable outcome and avoid confl icts between different uses. For example, adopting a Natura 2000 management plan which recognises the demands of society is already approaching a holistic approach. As estuaries are dynamic systems, they need an adaptive management approach which accommodates natural development and anthropogenic demands and changes. TIDE emphasises that any management which cannot accommodate such changes will eventually either be costly or may not succeed. An appropriate communication strategy should include: indicating the technical basis for any decisions; involving the concerned parties as early as possible; considering regional differences; increasing awareness of existing confl icts between various uses fi nding synergies, and adapting the communication and its language to the targeted audience and the media used. However, we not only have to reach out to those with an interest but they should participate in the process to achieve the maximum possible acceptance of management plans and anticipated projects. An integrated management approach should: apply the Ecosystem Approach; use the ecosystem services approach to measure and communicate changes which can deliver societal benefits; accumulate and share knowledge of estuary structure and functioning; use best practice from similar cases; follow a holistic approach consider the system as a whole; practice adaptive management; employ an appropriate and adaptive monitoring strategy, and apply an appropriate communication strategy. Summary

7 The four TIDE Estuaries 11 2 The four TIDE Estuaries 2 Zonation Historical Evolution Brockmann Consult, Common Wadden Sea Secretariat, 2003

8 12 The four TIDE Estuaries The four TIDE Estuaries 13 The four TIDE Estuaries The TIDE zonation is based on the Venice system which is related to different salinity levels extending from the freshwater (limnetic) zone to the polyhaline (euhaline) zone at the mouth of the estuary. Therefore salinity calculations were based on the median values of chlorinity for a 6 year period ( ). The innermost limit of each TIDE estuary was the place of furthest tidal penetration. This allowed a better comparison between the four estuaries. Zonation The TIDE estuaries (Scheldt, Elbe, Weser and Humber) were directly compared to learn more about their functioning, governance and management measures. To ensure this was a valid exercise, comparable zones within the estuaries were considered. However, although management related for example to the Water Framework Directive, Natura 2000 Directives, macrocells concept (OMES) or spatial planning, already uses different zones, TIDE used its own modifi ed zonation approach. TIDE zonation Humber estuary Elbe estuary 2 Selected examples of existing zonation Weser estuary Scheldt estuary Humber estuary Elbe estuary Polyhaline Mesohaline Oligohaline Freshwater 3 Freshwater 2 Freshwater 1 Scheldt estuary Weser estuary Historical Evolution Estuaries are very dynamic systems and have changed greatly during geological time, particularly over the last 3 centuries through both natural events as well as anthropogenic activities. Estuarine environments have been modifi ed and managed by Man throughout human history particularly in relation to protecting the landscape from
 were directly compared to learn more about their functioning, governance and management measures.")
9 14 The four TIDE Estuaries The four TIDE Estuaries 15 fl ooding and erosion, to claim wetlands for agriculture and habitation (previously called reclamation ), and to allow and maintain navigation. In addition, North Sea estuaries have changed as the result of isostatic rebound, the adjustment of the Earth s surface in recovering from the last Ice Age, such that sea-level may apparently be rising because parts of eastern England, the Netherlands and the German Wadden Coast are sinking. Each natural and human action has therefore changed the hydrogeomorphology of the estuaries the water movements, the underlying geology and sedimentology, and the shape of the estuaries. In particular, navigation became more important because the settlements developed into prosperous trading places reliant on these shipping routes. Spatial changes within the TIDE estuaries (%) relative changes [%] th century Overall areas of considered mid 20th century recent Elbe Weser Humber Scheldt 2 We have modifi ed the hydrogeomorphology of estuaries by: straightening and deepening; building dykes; claiming land for agriculture and habitation; protecting shorelines, and isolating/cutting-off tributaries and side channels. The loss of estuarine areas, as well as different types of habitats can be related to several anthropogenic impacts. In some estuaries, the isolation of tributaries from the main estuary can be considered as the primary cause of loss. Similarly, dyke construction (either for land-claim or for fl ood protection), reduces marsh area under tidal action. The increased tidal penetration into the freshwater zones may have both increased tidal fl ats and the amount of subtidal habitats in both deep as well as shallow water areas. However, these effects may have been confounded by the straightening of watercourses and by coastal squeeze where rising water levels are prevented from naturally creating new intertidal areas due to coastal defences. relative changes [%] relative changes [%] th century Freshwater zones mid 20th century Mesohaline zones recent relative changes [%] relative changes [%] th century Oligohaline zones mid 20th century Polyhaline zones recent Meanders Scheldt Dauchy In hydrogeomorphological terms, such a change has reduced the resilience of estuaries to cope with further change in turn requiring further management measures. These changes have partly led to higher current velocities and further upstream penetration of the tides. To protect the catchment from those changes, higher dykes and weirs to cut off the tidal infl uence have been constructed. These management measures further altered the hydrological characteristics, leading to higher current velocities and in changes to sedimentation and erosion patterns. Subsequently, new measures were required such as stabilising the new estuary beds with shoreline structures, groynes and training walls and, where ports had been built in accreting and turbid areas, intensifi ed maintenance dredging th century mid 20th century It is notable that the estuaries generally show the highest losses of area in the inner freshwater and oligohaline zones. In the meso- and polyhaline zones (the more seaward parts of the estuaries) less area has been lost with approximately similar losses and gains. In total, across all salinity zones, the Elbe, Weser and Scheldt show decreases of between 5 >30% of their area. recent th century mid 20th century recent Mudfl at Silinski Analysis of change in TIDE estuaries TIDE analysed the evolution of the four estuaries in three time steps: (1) to the end of 19th century, (2) to the mid of 20th century, and (3) in recent times. This allowed a comparison of the overall sizes of the estuaries, the areas relating to a particular salinity zone (see TIDE zonation), and different habitats within these zones. Whilst the overall size of the Humber was greatly reduced during the 18 th and 19 th Century through land-claim for agriculture and port developments, more recently it has remained relatively stable. Highest losses had occurred in the oligohaline zone. In the Scheldt, over half of the freshwater area has disappeared, whilst in the mesohaline zone the loss is less than 20%. In the Elbe, 16% of the area has been lost in the last century, most of it in the freshwater zone. In contrast, the polyhaline zone has remained stable.

10 16 The four TIDE Estuaries The four TIDE Estuaries 17 Development of the tidal range in the Elbe and the Scheldt during the last century The Weser shows a total loss of 4% in overall area, with one third of this in the freshwater zone. No substantial change was observed in the polyhaline zone. The anthropogenic infl uence on the hydromorphological characteristics has changed habitat distributions in the estuaries. For example, at the end of the 19th century the Weser was a braided stream whereas it is now characterised by a deep fairway and increased intertidal areas. Tidal range (m) Glückstadt Hamburg Distance to Cuxhaven (km) 2 Changing habitat distribution in the Weser estuary at Harrier Sand End of 19th century recent 5, E E E E 5 4, N N 4 Tidal range (m) 3, N N 2,5 Deep Water Habitat Slope Habitat Shallow Water Habitat Tidal Flat Habitat Distance to Vlissingen (km) N N Marsh Habitat Summer Polder Stagnant Water Habitat One of the many infl uences on the characteristics of the estuary bed habitat is the tidal range (the difference between mean high- and mean low water) which has increased at particular locations for example Harrier Sand from 2m in the 19 th century to the present 4m. The Elbe and Scheldt estuaries showed a similar development to that of the Weser, with the greatest change in tidal range in the inner estuary during the last century, e.g. in the harbour area of the city of Hamburg. The tidal range in this area can be explained by the anthropogenic changes discussed above, the lack of a buffer area such as intertidal fl ats, and the sudden decrease of water depth upstream of the harbour. These changes in hydromorphological features and in the abundance, quality and distribution of certain habitats in turn affect the estuarine ecological functioning. The fl ora and fauna depend on the presence and extent of different habitats and related environmental conditions which are the result of the hydrology, especially currents, tides and water residence times as well as the sedimentology, the erosion and deposition cycles and the position and extent of the turbidity maximum zone. The four TIDE Estuaries TIDE created its own consistent zonation approach for comparing the estuaries. All estuaries show highest losses of area in the inner estuary. The loss of estuarine area can be related to several anthropogenic impacts, e.g. isolation of tributaries, dyke construction, straightening and deepening. Changes in hydromorphological features have changed the abundance and distribution of certain habitats which area important for ecological functioning of the system. Summary

11 Estuary Functioning Estuary Functioning Hydro-geomorphology Filtering Functions Primary Production Dissolved Oxygen Levels Habitats & Bird Distribution HPA

12 20 Estuary Functioning Estuary Functioning 21 Estuary Functioning A fundamental knowledge of the physics, chemistry and biology of the system is required to effect successful and sustainable estuarine management. Comparisons in the fundamental scientifi c understanding between different estuaries can deliver new insights for estuarine management. TIDE has compared the system functioning of the four estuaries to show their similarities and differences. For example, this includes ecological processes such as primary production or the distribution of habitats which infl uence the occurrence of overwintering birds or nursery stages of fi shes. Hydro-geomorphology As ecological processes and habitat distribution are controlled by hydro-geomorphological variables, we need to extensively study the hydrology, morphology and ecology and their interactions. An understanding of hydrogeomorphology has required data on widely-used parameters such as: The hydrogeomorphological characteristics showed a high variability between and within systems. All estuaries showed tidal amplifi cation (i.e. the tidal range increased together with its consequences) with a progression upstream in relation to morphological changes. This was more pronounced in the Scheldt, resulting in a maximal tidal range (TR, the difference between high and low tide) approximately halfway along the estuarine longitudinal distance. An important outcome of TIDE is that by analysing both the convergence (the degree of narrowing of the river bed), and the friction (the intrinsic resistance of the system against water movements), new basic insights were obtained to diagnose the causes of tidal amplifi cation and damping. The Elbe combined low convergence with low friction, whilst the Humber was characterised by a large degree of convergence but also a large degree of friction. This created new insights such as tidal damping in an estuary became important once the estuary depth (as the cross-section averaged depth at low water) became lower than m. Of the four estuaries, the Elbe is the only one in which tidal damping occurs within the estuarine mouth. Together with the relative low degree of estuarine convergence between the mouth and the city of Hamburg (meaning that the estuary is not as narrow in this section), this partly explains why the Elbe tidal range (below 4m) is the smallest of all TIDE estuaries. The Humber is unusual in that the city of Kingston-Upon-Hull is situated at the transition between tidal amplifi cation and (extreme) damping, resulting in a tidal range maximum. The Weser shows moderate hydrological gradients, whilst the Scheldt shows maximum tidal amplifi cation (explaining the large tidal range of more than 5m), thus indicating the greatest need for ecosystem regulating services to help reduce the strength of the estuarine hydraulic dynamics. 3 Brackish Creek Herman riverine discharge, topography/bathymetry (drying areas, depth and other shape aspects of the system), tidal amplitude, current velocities, residence times, suspended matter, and habitat distribution. In addition, some specifi c techniques (e.g. the cubage technique calculating fl ow velocities based on topo-bathymetric data and water levels, and the Dalrymple energy concept calculating energy terms based on water levels and fl ow velocities), were used to compare the driving forces behind the tidal amplitude (amplifi cation or damping) and the energy distribution. This new knowledge allowed the basic description of the TIDE estuaries to be updated. The relative amount of convergence and friction for the TIDE estuaries Damping ELBE WESER HUMBER 3,3 m SCHELDT CONVERGENCE FRICTION HUMBER WESER SCHELDT ELBE 7 7,5 m The relative amount of convergence (or narrowing) and friction (or resistance against water movement) for the TIDE estuaries, two main factors determining if an estuary is damping or amplifying the tide. The numbers indicate the water depth at low tide on the location where friction occurred most. Amplification

13 22 Estuary Functioning Estuary Functioning 23 Values and ranking of the 4 TIDE estuaries for a selection of hydro-geomorphological parameters Elbe Weser Humber Scheldt Maximum tidal range (mean tide) [m] 3,6 4,1 5 5,5 Tidal amplifi cation Maximum TRx/TR0 (0 = mouth, x distance x until the mouth) 1,3 1,1 1,15 1,4 Maximum tidal range gradient [cm/km] 2,2 2 3,2 3 Tidal damping Minimum tidal range gradient [cm/km] -5,5-0,8-7,5-7,5 Maximum fl ood current [m/s] 1,3 1,3 1,9 1,5 Tidal asymmetry at the upstream border 1,6 1,4-1,7 Yearly gain or loss of nutrients for each estuary NO3 Nitrate PO4 Phosphate Total freshwater discharge (mean) [m³/s] Residence time of the water [days] High discharge Mean discharge Low discharge Maximum difference in salinity between winter and summer Estuary volume [billion m³] 1,45 0,4 0,94 2,85 Estuary surface [ha] Relative subtidal deep area [%] Relative intertidal fl at area [%] Relative marsh area [%] Filtering Functions The oxygen concentrations in all estuaries were suffi ciently high to support a normal estuarine food web, consisting of primary producers such as micro- and macro-algae, which are grazed by secondary producers, e.g. zooplankton and macrozoobenthos, serving as food for the higher trophic levels (fi sh, birds). As oxygen conditions have improved in all estuaries in recent decades, the dominant form of nitrogen has changed from ammonia towards nitrate. In general, a decrease in concentrations of both nitrogen and phosphorus has occurred. The biogeochemical removal of nutrients within the estuary, the so called fi lter function of estuaries, was studied by comparing measured concentrations of nutrients with the theoretical expected concentrations along the salinity gradient. In this way, gains (production in the estuary) or losses along the longitudinal gradient were calculated. The Scheldt was characterised by the conservative behaviour of nitrate and removal of ammonium in the oligohaline zone, whilst the Elbe showed a notable gain in nitrate in the oligohaline and freshwater zone and losses downstream; this indicates that the Elbe had a relative lower capacity to improve water quality (in this case nitrogen), compared to the other estuaries. It is of note that despite the high oxygen content, the Humber showed a high removal of nitrate in the mesohaline zone, preceded by large increases in the upper parts. As the Humber was naturally the most turbid of all the estuaries (with suspended sediment concentrations normally c. 5g/l, this indicated the role of suspended matter in the fi lter function. The Humber also showed the highest phosphate release fw Yearly gain (+) or loss (-) of nutrients (in tons per year and per km estuarine length) for each estuary; fw = freshwater zone, o = oligohaline zone, m = mesohaline or brackish zone, p = polyhaline or saline zone; NO3 = nitrate, PO4 = phosphate, DSi = dissolved silica Primary Production o m p fw o m p fw o m Elbe Humber Scheldt Estuaries are characterised by a high production of organic matter within the system (autochthonous production), although there is also a large import from outside the estuary both upstream from the catchment and downstream from the sea (allochthonous production). In some areas, the in-situ primary production determines the carrying capacity of the food web, hence of the food provisioning ecosystem services. Aquatic primary production was highest in the Scheldt, a recent consequence of restoration efforts, with the treatment of the wastewater of Brussels a major element. In contrast, the Humber is naturally so turbid that the food chain depends mostly upon detritus from the catchment, the adjacent wetlands and human-derived inputs, resuspended microphytobenthos (the sediment microalgae), and local benthic production on tidal fl ats, the light-exposed sites, thus emphasising the importance of intertidal habitats in this estuary. Despite this, the Humber has the lowest relative area of intertidal habitats mudfl ats and marshes together cover approximately a quarter of the total system surface; an example where the interestuarine comparison revealed a case of high demand versus low offer of an estuarine function. Compared to the Scheldt, the Elbe estuary is in general deeper, more turbid and has a shorter residence time, which together explain its relatively low primary production. Consequently, the fi lter function of the Elbe estuary is reduced, thus explaining the important release of dissolved silica, a crucial element in the food web. The Weser potentially has a high primary production capacity. p DSi Dissolved silica 3
![gradient [cm/km] -5,5-0,8-7,5-7,5 Maximum fl ood current [m/s] 1,3 1,3 1,9 1,5 Tidal asymmetry at the upstream border 1,6 1,4-1,7 Yearly gain or loss of nutrients for each estuary 200 150 100 50 0-50](/docs-images/45/3171572/images/page_13.jpg "NO3 Nitrate PO4 Phosphate Total freshwater discharge (mean) [m³/s] 722 331 209 107 Residence time of the water [days] High discharge 16 7 13 50 Mean discharge 29 11 27 92 Low discharge 63 27 69 247")
14 24 Estuary Functioning Estuary Functioning 25 Dissolved Oxygen Levels Many estuaries naturally have low dissolved oxygen levels (termed a DO sag) especially in the turbidity maximum zone, because of the high oxygen demand by the detritus and suspended sediment there, and during the summer months because of intense microbial activity. Part of that DO sag is attributable to freshwater microalgae dying once they reach brackish conditions. Historically in many estuaries, that natural DO sag has been exacerbated by human organic inputs either from the catchment or surrounding cities and industries. In the Elbe the occurrence of a large local summer oxygen sag in the freshwater zone, just downstream from Hamburg remains a major management issue as it is a barrier to fi sh migration. This oxygen sag appears in a transition zone of changing hydromorphological characteristics and gives a pronounced transition between river dominance and tidal dominance. The Elbe estuary thus acts as many estuaries in receiving organic matter and nutrients from the catchment and other sources, having high free-living and attached microbial populations which create an oxygen demand by using the carbon and nutrient load, while the microalgae are limited by the turbid, light-limited conditions in the water column. The addition of less turbid shallow water areas, containing oxygenated water may locally import oxygen into the turbidity maximum/do sag zone and provide a better environment for algal primary production. Habitats & Bird Distribution Mean density of waders and wildfowl in the salinity zones within the Elbe Wildfowl mean density (ind/km2) Elbe (NDS) mean density (ind/km2) Weser mean density (ind/km2) Elbe (SH) mean density (ind/km2) Humber Eider Common Scoter Scaup Pochard Canada Goose Pink-footed Goose Whooper Swan Bewick s Swan Bean Goose Tufted Duck Gadwall Shoveler Pintail Brent Goose White-fronted Goose (European) Teal Greylag Goose Mallard Wigeon Barnacle Goose Shelduck 3 The estuarine hydrogeomorphological characteristics indirectly affect the distributions of higher predators as they determine the extent of intertidal mudfl ats and marsh habitats. In particular, intertidal mudfl ats are important feeding areas for waders and juvenile fi shes as is marsh for wildfowl and as refuge areas for fi shes. Waders mean density (ind/km2) mean density (ind/km2) Greylag Goose APA The distribution of waterbirds in estuarine habitats and the identifi cation of the main factors affecting bird habitat use have been investigated using a statistical approach combining high tide bird count data with a series of environmental characterising variables (including natural habitat area, water quality parameters and indicators of anthropogenic disturbance). This has given the habitat requirements for different bird species although it is based on waterbird usage data from around high tide, a period when birds may be predominantly roosting and almost certainly not using optimal foraging areas, although the environmental variables include habitat provision at low water. Whilst the results are therefore effectively for high tide roosting/loafi ng activity, assuming most species will not move a great distance from preferred feeding areas, there are similar conclusions for foraging activity. Although TIDE only quantifi ed the value of habitats available within the estuary at a small spatial scale (i.e., within an average area of 6km 2 around roosting sites), the analysis suggested that habitat availability on a wider spatial scale (i.e. areas adjacent to the estuary) can also increase roosting potential in certain estuarine areas by providing additional bird feeding grounds. This has been observed, for example, with waders in the polyhaline zones of the Elbe, due to the presence of extensive mudfl ats in adjacent marine areas (presumably with a diurnal migration of waders to and from preferred roost and foraging areas), or with wildfowl in the oligohaline zone of the Humber, due to the presence of adjacent inland habitats. Elbe (NDS) mean density (ind/km2) Weser Elbe (SH) mean density (ind/km2) Ruff Whimbrel Curlew Sandpiper Greenshank Spotted Redshank Turnstone Black-tailed Godwit Avocet Redshank Ringed Plover Sanderling Bar-tailed Godwit Lapwing Golden Plover Knot Grey Plover Curlew Oystercatcher Dunlin Mean density (ind.km-2) of waders and wildfowl in the salinity zones within the Elbe (E; NDS=southern bank, SH=northern bank), Weser (W) and Humber (H, northern bank) estuaries. Humber

15 26 Estuary Functioning Estuary Functioning 27 Importantly, the analysis also indicated that larger estuarine habitats appear to support greater waterbird densities compared to smaller habitat areas, especially for generalist feeders (i.e., species such as Dunlin and Redshank that are able to take advantage of a wider range of food prey). This may be due to the higher diversity of resources associated with greater mudfl at extent benefi ting the aggregation of these generalist feeders. In turn, this is less evident for specialist feeders, such as Bar-tailed Godwit, which are more likely to depend on the distribution of specifi c prey species, a factor that might be more relevant at a smaller spatial scale (i.e., within a mudfl at) hence resulting in a negative relationship between Bar-tailed Godwit density and total intertidal habitat area. Estuary Functioning In general the four estuaries show usual hydro-geomorphological and ecological estuarine characteristics, but there is a high variability between and within systems. The intercomparison indicated: the cubage technique and the Dalrymple energy concept were applied to compare the driving forces behind the tidal amplitude; Summary all estuaries showed tidal amplification with a progression upstream in relation with morphological changes although the Scheldt has the highest tidal amplification and tidal range; 3 Black-tailed godwit APA Our analysis also suggests that lower waterbird densities generally occur in locations where natural estuarine habitat area is smaller. This reduced habitat availability is often the result of the natural variability in the estuarine morphology (e.g. narrower mudfl ats present in the freshwater zone compared to the estuarine meso- and polyhaline zones) or the presence of anthropogenic developments and land-claim (e.g. smaller mudfl at areas in the mesohaline zone of the Humber or in the freshwater and oligohaline zone of the Elbe). As such, the availability of natural estuarine habitats mainly determines the density of waders and wildfowl within the estuarine system, especially in the Weser and Humber. Water quality characteristics such as the salinity gradient, nutrient levels and organic enrichment are also important in affecting species distribution, especially in the Elbe. The salinity gradient was the most important factor affecting bird density as a whole in the Elbe, particularly for Dunlin, although this effect is more likely to be related to other factors that are correlated with the salinity gradient in the estuary rather than to an effect of salinity itself. These factors include the distribution and availability of feeding habitats and food resources (as indicated by longitudinal changes in benthic invertebrate communities) along the estuarine gradient. The lesser anthropogenic disturbance in outer estuary sands/remote islands may also contribute to the higher bird density observed in the polyhaline zone of the Elbe. The positive relationship between intertidal habitat area and waterbird density is potentially important for estuarine management, as it suggests that the fragmentation of intertidal habitat from a range of anthropogenic activities, as well as the effective reduction in the width of mudfl at from coastal squeeze, may result in reduced waterbird usage density, Furthermore, compensatory measures such as managed realignment resulting from intertidal development offsetting may need to consider the delivery of suffi cient area to accommodate fragmentation effects of the land-claim e.g. an increase in the offset area compensation ratio. the Weser has the the shortest residence time and most intertidal flat and marsh area; the Elbe combines low convergence with low friction, while the Humber has a large degree of convergence but also a large degree of friction; the Elbe has a relative lower capacity to improve water quality (in this case nitrogen), compared to the other estuaries; the Humber had the highest phosphate release, was the most turbid of all the estuaries (with suspended sediment concentrations normally ca. 5 g/l), and consequently a higher filter function; aquatic primary production is highest in the Scheldt; a major issue on the Elbe is a local oxygen sag in the freshwater zone; the Humber is so turbid that the food chain depends mostly upon detritus from the catchment, the adjacent wetlands and human-derived inputs; bird abundances are determined by habitat availability (Weser, Humber), water quality (Elbe) or by the presence of anthropogenic developments and land-claim (Humber, Elbe); waterbird density increased together with intertidal area, this has implications for estuarine management and habitat loss/compensation ratios. These findings are reflected in the diversity of management practices which in turn are often related to protecting and enhancing the range of habitats. This is especially important as the abundance and distribution of habitats is closely related to the delivery of ecosystem services.

16 Ecosystem Services Ecosystem Services Ecosystem Services in relation to Structure and Functioning The TIDE Importance Score of Ecosystem Services The Ecosystem Services in Detail Important Habitats and Zones for Delivery of Ecosystem Services Valuation and Application NLWKN

17 30 Ecosystem Services Ecosystem Services 31 Ecosystem Services The pathway from ecosystem structures and processes to human well being Ecosystems and biodiversity Human well being Ecosystem Services in relation to Structure and Functioning Human health and well-being depends entirely, albeit often indirectly, upon the provision of natural resources (MA, 2005: Millennium Ecosystem Assessment Ecosystems and Human Well-being: Synthesis.) and society can take benefi ts from many resources and processes, termed ecosystem services, that are supplied by natural ecosystems. Structures and processes Marsh creeks Functions Nursery function Ecosystem services B e n e fi t s (Economic) Value Ecosystem services (ES) result from: ecosystem functions (for example, primary production, nutrient cycling, hydrodynamic conditions); Sedimentation and erosion Fish production Food production: Fish Nutrition biophysical processes (such as plant nutrient uptake, photosynthesis, mineral weathering, sedimentation, tidal pumping); Aeration Zooplankton production 4 structure such as the collection of habitats and species. In essence, the ecosystem contains the physico-chemical and ecological processes which in turn allow ecosystem services to be produced and which again in turn are used by society after the addition of complementary assets and human capital. For example, the appropriate water conditions and sediment will support invertebrates which in turn provide fi sh food. Society can then exploit those fi shes but only if it provides the means (using skills, energy, money) of catching them. The benefi t Nutrition depends on the service Food provision, fi sheries which in turn depends on the function of a viable fi sh population production; in turn the latter depends on other functions such as primary production, nutrient cycling, oxygen production and the presence of suitable habitats. Residence time Water turbidity Nutrients Primary production The pathway from ecosystem structures and processes to human well being (after TEEB), with an example of the service Food production : fi sh, showing some ecosystem factors that eventually determine the human benefi t Nutrition To deliver these services in a certain quantity requires an adequate ecological structure (amount, diversity) and functioning (rate processes such a primary production) of the respective habitats as well as suitable hydrodynamics such as the fl ooding frequency. Each of these factors is governed by hydromorphological features which in most estuaries are infl uenced by natural or anthropogenic factors. In addition to describing and understanding the underlying ecosystem processes, ecosystem services are increasingly being valued allowing us to integrate the economic value of our ecosystems in management choices, which are mainly based on economic aspects. TIDE has quantifi ed the services in order to relate the complexity of estuarine functioning to society s use and the management of the estuaries. Hence, ecosystem services bridge ecology, economy and social sciences. Resting geese and ducks HPA The ecosystem services are separated into: Provisioning services, as the products we derive from ecosystems i.e. food, building material, fi bre, water, etc.;
 Value Ecosystem services (ES) result from: ecosystem functions (for example, primary")
18 32 Ecosystem Services Ecosystem Services 33 Importance of Ecosystem services in the TIDE estuaries with margins of variance Regulating services, as the benefi ts obtained from the regulation of ecosystem processes, such as air quality and climate regulation, natural hazard regulation; Habitat services, e.g. formation and maintaining of habitats and gene pool; Cultural services are the nonmaterial benefi ts people obtain from nature (aesthetic, spiritual, educational and recreational). Erosion and sedimentation regulation by biological mediation Climate regulation: Carbon sequestration and burial Regulation extreme events or disturbance: Wave reduction very low Importance very high Information for cognitive development Inspiration for culture, art and design Food: Animals Aesthetic information Regulation extreme events or disturbance: Water current reduction Water quality regulation: transport of polutants and excess nutriënts 4 Provisioning ecosystem service Provision of food HPA Cultural ecosystem service Opportunities for recreation & tourism Kieler Institut für Landschaftsökologie Opportunities for recreation & tourism Water quality regulation: reduction of excess loads coming from the catchment The TIDE Importance Score of Ecosystem Services Ecosystem services are valued by the balance between: a societal demand, i.e. the benefi ts which are obtained, a supply, i.e. the functioning of the system structures and processes. Regulation extreme events or disturbance: Flood water storage Water quantity regulation: landscape maintenance Water for industrial use Water quantity regulation: dissipation of tidal and river energy A list created by the project TEEB (The Economics of Ecosystems and Biodiversity) was used by the 4 Regional Working Groups to determine the ES demand in the TIDE estuaries. This survey led to a list of 20 ES which were considered to be the most important in the four estuaries. Erosion and sedimentation regulation by water bodies Water quantity regulation: drainage of river water Biodiversity Water quantity regulation: transportation Water for navigation Importance of Ecosystem services in the TIDE estuaries with margins of variance; standard errors (light blue) and standard deviation (white)

19 34 Ecosystem Services Ecosystem Services 35 Table Ecosystem service supply Service Demands Of the 10 services with the highest demand, 7 were regulating for hydro-geomorphologic aspects and two were directly linked with navigational or industrial use of water. Except for water, there was a relatively lower demand for provisioning services (e.g. food, building materials) even though estuaries are amongst the most productive ecosystems worldwide. The low ranking of local production may be due to the fact that society is now more globally-oriented and provisioning goods and services such as food and building materials can be imported from elsewhere. As a consequence, services such as transportation are more important whereas provisioning services have declined over time due to habitat loss and pollution. With increasing urbanisation and industrialisation, regulating services have become more important especially because of increased fl ooding and pollution. Service Supply The service supplies, as derived from the underlying estuarine functioning, have been ranked for all estuaries. Elbe Weser Humber Scheldt Mean high water level Safety, drainage Tidal range Safety, drainage Tidal energy fl ux Energy dissipation Tidal amplifi cation Tidal damping Maximum fl ood current Erosion, sediment transport Tidal asymmetry at the upstream border 2 3? 1 Sediment transport Freshwater discharge Drainage, transport River energy fl ux Drainage, transport Residence time of the water Water quality, primary production Difference in salinity between winter and summer Estuary volume Estuary surface Relative subtidal deep area Navigation Relative intertidal fl at area Food production, friction Relative marsh area Diversity, dike protection, sedimentation Ecosystem service supply (related benefi ts, description, ranking of supply amount for the four TIDE estuaries; from 1 = estuary providing the highest supply to 4 = lowest supply, and locations or factors determining the occurrence of the service The Ecosystem Services in Detail Biodiversity In contrast with services related to water and air quality regulation, the demand for biodiversity was ranked very high, although estuaries host few endemic species. They act as a nursery for several species of fi sh and crustaceans, as migration routes for fi sh, overwintering and staging areas for migratory birds, and provide shelter against predators; hence we take the view that biodiversity is both the amount and types of organisms. All of these functions depend strongly upon water and habitat quality and quantity/availability. The perceived importance of biodiversity centres on the crucial role of estuaries in the life cycle of key species which is refl ected in the fact that European national and environmental protection laws require a certain ecological status. Water and Air Quality Regulation Services Due to urbanisation and industrialisation, water quality has been a concern for many decades and hence water regulation services are very important. Tidal marshes act as aeration sources for estuaries and, for example, the anabranches near the oxygen depletion zone of the Elbe are important to provide suffi cient oxygen to restore fi sh migration routes. However, as the oxygen concentrations of all TIDE estuaries have either recovered or are relatively high, the demand and supply of the aerating service are suffi cient within these estuaries. Nitrogen retention has been infl uenced by a decreased supply and the supply of dissolved silica by tidal marshes is an underestimated service as it was only documented for the Scheldt. Dissolved silica is pivotal between eutrophication and animal food production. It is released by marshes during the summer, when the uptake by primary producers in the water column is highest. In general, the importance of water quality regulation services and also air regulating services (gas emissions) depend on concentrations and loads, especially those from the catchment. Hence the sustainable functioning of the estuaries cannot be separated from the sustainable functioning of the freshwater catchments. The air regulating service related with global warming may be less important as the effect of enhanced methane emissions a more severe greenhouse gas that CO2 counters the carbon burial through sedimentation. Water and Sediment Quantity Regulating Services Whereas water and air quality regulating services of estuaries are also related to services in the catchment or elsewhere, water quantity regulating services are more strictly related to intrinsic estuarine features. The estuarine hydro-geomorphology determines the potential for navigation, the fl ooding risk and the habitat quality, hence biodiversity. The TIDE project indicated that different water or sediment regulating services had high rankings because of their demand: Water quantity regulation: dissipation of tidal and river energy: As the morphology of estuaries has increasingly been altered together with the relative infl uence of river and tidal features, there are repercussions for e.g. fl ood protection, dyke abrasion, and habitat deterioration. Therefore it is important for managers to know where are the opportunities to restore these dynamics, for example by dissipation of 4

20 36 Ecosystem Services Ecosystem Services 37 energy and reducing water level and velocity. As shown in TIDE using the Dalrymple approach, river energy was dissipated most in the Elbe, and tidal energy dissipation was maximal in the Humber and the Scheldt due to specifi c morphological characteristics. Water quantity regulation: transportation Water quantity for shipping is a result not only of the depth of the fairway, docks etc. but also of river discharge and tidal characteristics. Higher values of this service mean that less dredging is necessary. However, that under a given type of hydrogeomorphology the estuary will be in an equilibrium and anthropogenic actions, such as building ports, will disturb it from that equilibrium thus requiring management actions to maintain human uses. Water quantity regulation: drainage of river water High tides will restrict catchment drainage and increase upstream water retention. The Dalrymple approach showed, for example, that the Weser was the only system where river dominance could extend as far as downstream as Bremerhaven, near the estuarine mouth,, illustrating the importance here for the drainage service. Erosion and sedimentation: regulation by water bodies Estuaries have strong and weak water movements which respectively cause erosion and deposition of bed sediments, thus termed erosion-deposition cycles. These respectively occur on a daily basis (with fl ood/ebb tides and slack water), a weekly basis (with spring and neap tides), on a lunar basis, and seasonally (with equinoctial and inter-equinoctial periods and with wet and dry periods). Human activities disturb this equilibrium potentially affecting navigation, safety and habitats. Loss of tidal marshes in front of a dyke due to erosion may exacerbate the erosion and increase maintenance costs. Cultural Services The supply of cultural services (tourism, aesthetic and cultural inspiration, and spiritual and cognitive experience) is very diffi cult to estimate but TIDE has shown that these aspects are valued. This increases the recognition of estuaries as essential for the quality of (human) life and wealth creation. The Tidal Elbe a people s perspective results of 812 street interviews along the Elbe estuary: 52% of interviewed residents use the Elbe for recreational activities at the shore 25% of interviewed residents use the Elbe for water sports and swimming Important Habitats and Zones for the Delivery of Ecosystem Services The delivery of ecosystem services is spatially variable among habitats and between different systems, and in time showing large seasonal variability. The service supplied by habitats is comparable among the TIDE estuaries as a whole, and most service supplies are also similar along the salinity gradient. Many services, essential for regulation and support of the estuarine system, are provided by habitats with lower direct provisioning service supplies, such as marshes, mudfl ats and shallow water habitats. Steep intertidal habitats, where ecological functioning is hampered, provide the least ecosystem services. Valuation and Application The complexity of estuaries requires that an integrated management approach will have the best chance of success when based on the Ecosystem Service Approach and aimed at preserving the natural functioning of the system and recognising humans as an integral component of the ecosystem. The TIDE project importantly used the ecosystem service approach as a common denominator between the economic, ecological and social system. As such it has increased our understanding on how we depend on the delivery of these services on the one hand and on the functioning of the system delivering the services on the other hand. It was not the aim of TIDE to value the services for the different estuaries but a guideline was developed to allow the economic valuation of the ecosystem services. For this purpose we compiled a database of values of the different processes and functions. Ecosystem Services The ecosystem contains the physico-chemical and ecological processes which in turn allow ecosystem services to be produced and which again in turn are used by society after the addition of complementary assets and human capital. The ES water for navigation, water quantity regulation (transportation) and biodiversity were considered to be the most important ES in the TIDE estuaries. The delivery of ecosystem services is spatially variable among habitats and between different systems, and in time showing large seasonal variability. Of the 10 services with the highest demand, 7 were regulating for hydro-geomorphologic aspects and two were directly linked with nautical or industrial use of water. The complexity of estuaries requires that an integrated management approach based on the Ecosystem Service Approach will provide the best chances for successfully managing estuaries. That management must be aimed at preserving the natural functioning of the system whilst recognising humans as integral component of the ecosystem. Summary 4

21 Uses and Confl icts 39 5 Uses and Confl icts 5 The Confl ict Matrix Approach Human Uses Confl icting Uses and Users in the TIDE Estuaries IECS
22 40 Uses and Confl icts Uses and Confl icts 41 Human Uses Uses and Confl icts The Conflict Matrix Approach North-west European estuaries are multi-user environments requiring appropriate management to ensure the best use of resources amongst the various legitimate stakeholders. As this varies along an estuary, severe and less-severe confl icts between users will occur at particular areas and so management actions need to refl ect this variability. Estuarine managers and planners therefore need information on the main areas of spatial and sectoral uses and confl icts within their estuary for the targeting of resources, as well as information on appropriate tools needed to address these problems. The TIDE project has demonstrated the value of confl ict matrices for the initial determination of such issues for each of the management zones of each estuary including information on: the amount of each use or user activity within each estuarine zone; the likely considered level of confl ict between two users/use, and the severity of the actual confl ict between two users/uses. The confl ict matrices employ a simple approach based around a series of standard human uses/users that are considered to be generic across north-west European estuaries. The matrices are designed for completion at an estuary level and to include the anticipated level of generic conflict between two users/uses and the actual level of each use in each estuarine zone, these being combined to produce an actual conflict score for each zone of an estuary. We consider this to be a valuable tool for the initial assessment of potential user confl ict, spatial extent, severity and management focus. The tool is also a useful, transparent medium to inform stakeholders of the basis for management options and decisions. The confl ict analysis was undertaken for the four TIDE estuaries through estuary-specifi c Regional Working Groups (RWGs). These groups included experts representing the main areas of estuarine use, e.g. nature conservation management, fl ood risk protection, the ports industry, navigation, and other important user groups including the diverse recreational user community, fi sheries and the scientifi c community. We therefore recommend the formation of a RWG to aid this process, as not only is sectoral bias reduced, but such a group may also be of value as a forum for wider issue raising and alliance building between disparate and sometimes confl icting groups. However, we emphasise that this procedure uses expert opinion and as such can still be subject to bias or perception and it also relies heavily on the composition of the RWG the confl ict matrix will refl ect any RWG more heavily dominated by one sector or another. We therefore emphasise that this is aimed at providing a high level management tool, rather than a detailed empirical output hence we note the limitations in using this for the four TIDE estuaries. Initial RWG management focus was established for each of the TIDE estuaries through the ranking of human uses (high, moderate or low). Whilst the RWGs for most estuaries identifi ed the provision of Transport & Accessibility, Ecological Function & Diversity and Flood Protection & Assimilative Capacity as being of high importance, for the Humber, Transport & Accessibility was ranked as being of moderate importance. Across all of the estuaries, however, Recreation & Social Use were ranked as being of moderate importance. This ranking process also indicated systemic variations in the way in which individual estuary RWGs would score user confl icts within the main matrices, and any associated inter-estuarine or inter-user bias. The completed confl ict matrices identify the Scheldt as having the greatest level of human use, and the Elbe the lowest (c. 25% lower than that of the Scheldt). Across the TIDE estuaries, the mesohaline zone supported the greatest level of uses, with the polyhaline zone featuring the lowest level. The Elbe and the Weser recorded their highest individual use levels in the freshwater zone, the Scheldt in the oligohaline and the Humber in the mesohaline zone. This variation in human use concentration between the salinity zones of the TIDE estuaries shows the need for estuary specifi c management, targeted at specifi c spatial and sectoral areas. Summary of usage scores for each estuary zone and for TIDE estuaries Limnetic Humber Elbe Scheldt Weser Total Zone Oligohaline Humber Elbe Scheldt Weser Total Zone Mesohaline Humber Elbe Scheldt Weser Total Zone Polyhaline Humber Elbe Scheldt Weser Total Zone Total Estuary Humber Elbe Scheldt Weser In assessing the similarities and differences in uses and issues between salinity zones across all TIDE estuaries, the most important uses/issues identifi ed from the freshwater zone were fl ood protection, recreation, channel stabilisation and residential housing, with the oligohaline zones featuring similar key uses (fl ood protection, recreation and channel stabilisation) as well as conservation protection. The mesohaline zone was also identifi ed as important for conservation protection and fl ood protection, but with increased importance for vessel movement and capital dredging, this zone supported the 5
23 42 Uses and Confl icts Uses and Confl icts 43 Summary of usage for the TIDE estuaries per zone highest level of overall use across the TIDE estuaries. Although the polyhaline zone had a lower level of human use across the estuaries, it was identifi ed as being important for a range of uses including conservation protection, fl ood protection, vessel movement, capital dredging and maintenance dredging; the Humber identifi ed this zone as having the highest level of use. Freshwater Mesohaline Human Use Humber Elbe Scheldt Weser Total Humber Elbe Scheldt Weser Total Landscape High value landscape feature Conservation Protected area adjacent to system Conservation Protected subtidal area Conservation Protected intertidal area Archaeology Archaeology/History protected site Access (e.g. Disturbance) Recreational access on water Access (e.g. Disturbance) Recreational access on the banks & intertidal Access (e.g. Disturbance) Commercial Flood/coast protection Defence set-back Flood/coast protection Flood bank (dyke/gabbion/wall) Navigation Channel stabilisation Navigation Capital dredging Navigation Maintenance dredging Navigation Vessel movement Ports & Harbours Port land claim (intertidal/subtidal) Ports & Harbours Port related activity adjacent to system Ports & Harbours Port activity on the intertidal/subtidal area Infrastructure Infrastructure on bed or in water column Industry Tidal/current energy device Industry Water abstraction Industry Aggregate extraction Industry Industrial discharge Industry Industrial activity adjacent to system Agriculture Water abstraction Agriculture Agricultural run-off Biological Extraction Commercial (e.g. fish & shellfish) Biological Extraction Recreational Biological Extraction Wildfowling Residential Waste water discharge Residential Housing adjacent to system Residential Drinking water abstraction Conflicting Uses and Users in the TIDE Estuaries Whilst many north-west European estuarine management user issues are to some extent generic, there are estuary specifi c variations, both in the user interactions, but also the severity. It is also evident that synergisms exist between several uses as shown by the confl ict matrices applied to the TIDE estuaries. Elbe Estuary: For instance, the main use/issue of importance identifi ed by the Elbe RWG was in relation to Transport and Accessibility. The associated confl ict matrices indicate that the main management problems are associated with the provision of safe navigation requirements from the estuary mouth to the port of Hamburg, with the most highly-scored confl icts from this use occurring with Natura 2000 requirements. Similarly, the need to meet the requirements of the Natura 2000 Directives is potentially in high confl ict with the need to maintain safe navigation along this part of the estuary. Weser Estuary: Flood protection was identifi ed as a key requirement by the Weser RWG, but transport and biodiversity (conservation protection) rated almost as highly. This refl ects both the need to maintain deep navigable access to the port of Bremen, but with substantial issues relating to Natura 2000 requirements and tidal range along the estuary. The highest confl ict interactions related to the impacts of conservation protection in the subtidal zone on navigation requirements as well as the converse channel stabilisation and navigation needs affecting Natura 2000 protection in the intertidal and subtidal zones. The need to provide fl ood protection was also recorded as confl icting with Natura 2000 protection in the intertidal zone. Scheldt Estuary: The broad provision of ecological function and diversity was identifi ed as being of greatest importance by the Scheldt RWG but closely followed by Flood Protection & Assimilative Capacity and Transport & Accessibility. However, whilst fewer severe confl ict issues were identifi ed for the Scheldt as a whole than for the other TIDE estuaries, specifi c confl icts were recorded in the outer estuary between dredging needs and protection of the subtidal habitat. Similarly, high level confl icts increase around the port of Antwerp to include Natura 2000 site protection on specifi c fl ood protection measures (managed realignment), port activity, industry, recreation and housing provision, as well as confl icts resulting from managed realignment on conservation protection in sites adjacent to the estuary and housing provision. However, notably, a number of positive synergisms between users were also identifi ed, more than for the other TIDE estuaries. 5 Total Usage / Estuary Highest number of uses is marked in orange
24 44 Uses and Confl icts Uses and Confl icts 45 Summary of use confl icts for all TIDE estuaries Confl ict matrices for each salinity zone of the Elbe. Matrices show only high intensity confl icts and benefi ts The average confl ict scores across all zones and all TIDE estuaries illustrates the main sectors of potential estuarine user confl ict which may require management (shaded red in the fi gure), together with areas of synergistic potential (shaded green in the fi gure). 5 red shading: confl icts green shading: benefi ts (color intensity refl ects the level of antagonism or synergism) Humber Estuary: The provision of Flood Protection & Assimilative Capacity and Ecological Function & Diversity were ranked as the most important uses for the Humber, with the provision of transport and accessibility scoring far lower than for the other TIDE estuaries. This refl ects the somewhat different management priorities in the Humber, with the region low lying and subject to relative sea-level rise and, whilst featuring the UK s largest port complex, there is almost no need to artifi cially maintain navigable channels through dredging and channel stabilisation. However, the matrix analysis identifi ed many notable confl icts, with Natura 2000 conservation protection, primarily in the intertidal zone, impacting on port infrastructure activity, recreational access and fl ood protection provision, as well as recreational access impacts on intertidal conservation protection, the requirements of fl ood protection provision and port activity on Natura 2000 protection. Whilst the confl ict matrix process has highlighted a number of already established antagonisms between key sectoral uses in estuaries, the spatial distribution of these was variable across some of the estuaries. The Humber in particular showed considerable dissimilarity with reduced confl ict levels arising from navigation-related issues on Natura 2000 protection requirements and vice versa. This is mainly due to the position of the main ports industry on the Humber, compared to the other estuaries, with the Humber s main port industry proportionally closer to the mouth of the estuary and with non-accreting shipping channels than the other TIDE estuaries. Furthermore, the confl ict matrix analysis identifi ed some notable sectoral variations between estuaries. For instance, on the Humber, the provision of Natura 2000 protection in the intertidal zone was frequently identifi ed as having a high level of impact on the provision of managed realignment, whilst the presence of fl ood protection dykes was similarly identifi ed as having a high impact on intertidal Natura 2000 provision. On the Scheldt, managed realignment was further identifi ed as impacting on conservation protection requirements on adjacent terrestrial areas. As managed realignment is often used as a measure to mitigate for the impacts of coastal squeeze arising from the presence of fi xed fl ood protection dykes, then this would seem to be a considerable management pinch-point requiring addressing. In addition, managed realignment provision was also identifi ed as having the potential for high level confl icts with industrial activity
25 46 Uses and Confl icts Uses and Confl icts 47 and residential housing in the immediate fl ood plain. Again, given the potential for the tool to be used as a measure to increase fl ood assimilation capacity, then the success of the technique requires both management focus and possibly additional stakeholder involvement. Mechanisms for Resolving Confl icts As shown above, estuaries are subject to many often similar competing and confl icting uses and users. While high level management needs are the same across most northwest European estuaries, to protect and enhance nature conservation while ensuring public safety and the delivery of ecosystem services and societal benefi ts, there are clear differences in priorities for specifi c management actions. We have shown that these vary between estuaries but also within an estuary and so management needs to refl ect this and be targeted. In particular, the need for conservation protection raises several management confl icts with other uses, including the ports industry, fl ood protection requirements and recreational access to the estuary and vice versa. In particular, we highlight that measures employed to mitigate one management problem may affect others. For instance, managed realignment can be used to offset losses in both intertidal habitats from direct land claim and/or coastal squeeze in order to satisfy Natura 2000 as well as fl ood assimilation capacity. However, applying managed realignment can in itself impact on Natura 2000 provision as well as on fl ood protection requirements not to mention potential provision for housing and industry. As such, mechanisms are necessary to assist in stakeholder inclusion and confl ict resolution as part of a wider integrative management strategy. Public awareness study The Tidal Elbe a people s perspective : Several high level confl icts were identifi ed from the assessment process within the Elbe, Weser and Humber systems, but this was less the case for the Scheldt. Whilst having some very high level confl icts, primarily between navigation requirements and Natura 2000 protection needs, the Scheldt in general featured a reduced number of confl icts and an increased number of synergistic activities. Whilst this may be to some extent an artefact of the RWG assessment process, and has not been identifi ed directly as a result of a specifi c management action, it is possible to conclude that management of the Scheldt appears to be effective in several areas. This may be a result of its relatively long period of integrated management arising from the Long-term vision Westerscheldt plan (2000), integrating safety accessibility and environment aspects, including requirements for trans-national action and data sharing between Belgium and The Netherlands. Based on the results of the confl ict matrix approach, together with those from other TIDE aspects, we have derived a typology of key confl ict areas for most estuaries and, based on these, produced guidance principles for integrated management. We have also determined a series of measures to assist in both in determining confl ict areas and addressing some of the impact factors. 5 In terms of land use confl icts, interviewed residents along the Elbe estuary considered nature conservation to offer the most serious potential for confl ict since people perceived nature conservation to be incompatible with other land uses. In the rural parts of the Elbe region, nature conservation and agriculture are perceived to be the main confl ict, whereas elsewhere it is nature conservation and industry. However, these responses mostly refl ect general opinions about the interaction of different land uses and do not refer to existing regional confl icts. It is assumed that these Elbe-specifi c fi ndings are broadly transferable to other similar estuaries. Nevertheless it is suggested that estuary-specifi c surveys might be required to confi rm this, and perhaps incorporate local variations. Uses and Conflicts TIDE concludes that whilst north-west European estuaries present many generic management challenges, management initiatives need to be site-specific in order to accommodate both the natural and human systems. Furthermore, the Ecosystem Services and Conflict Matrix approaches employed in TIDE have the potential to be combined to assist in effective management. However, it is important to understand that measures employed to provide a management solution for a specific problem can also generate their own management issues. This is particularly the case for measures used to address flood protection, land claim offset and Natura 2000 requirements. Summary
26 Management initiatives and governance 49 6 Management initiatives and governance 6 The Legal Framework Implementation of EU Directives SWOT Analysis Environmental Assessment Tom Jeynes
27 50 Management initiatives and governance Management initiatives and governance 51 Management initiatives and governance The proposed EU Directive on Marine Spatial Planning and Coastal Management may also affect estuary management if adopted, but we have not yet considered it as its implementation details are unknown. The Legal Framework The many uses and users of estuaries have led to extensive current management measures driven by international obligations and European Directives as well as the Member State or federal province policies. In order to share best practice between the estuaries, and to understand their planning and governance, it is necessary to understand the Member State legislative management frameworks and their differences. This encompasses national and local political demands and management organisations and their responsibilities. The TIDE estuaries provide a range of managerial differences from the international catchment areas of the Elbe and Scheldt, to the regionally managed estuaries of the Weser and the Humber. As such, holistic management planning frameworks for estuaries must build on existing structures, use a multi-manager sectoral framework and have an understanding of: the management issues in estuaries; the governance framework (i.e. policies, politics, administrative bodies and legislation); the methods used to deliver the management; the basis on which that management is delivered; the effi cacy of the management tools; the best tools/plans available to meet these needs, and the gaps in management (knowledge). All European estuaries have to comply with various policies, developmental and management plans, and sectoral strategies and so we have analysed these in the TIDE estuaries to determine good management practices that can be applied elsewhere. These include: water quality (Water Framework Directive (WFD) & Urban Waste Water Treatment Directive); nature conservation (Habitats & Species Directive & Wild Birds Directive (HBD)); fl ood protection and coastal protection (Flood Risk Management Directive (FRMD)); integrated coastal zone management; shipping, ports and pollution prevention; economic development (including agriculture, forestry, tourism); and the Maritime Strategy Framework Directive (MSFD). Implementation of EU Directives Schematic frameworks produced for each estuary show how the directives have been implemented from a top-down basis over the past two decades and there is considerable guidance on the requirements and implementation of these directives at an estuary level. The TIDE countries have also made good progress with the implementation of the newer directives e.g. MSFD and the FRMD into national law, meeting the deadlines set by the European Commission. Our analysis has revealed the following examples of best practice: Management plans which engage all users and uses of the estuary Although non-statutory in nature, successful plans have been implemented in all four estuaries to ensure that the habitats and species within the estuaries maintain their favourable condition. These plans enable the different users and stakeholders to harmonise the requirements of Natura 2000 and Water Framework Directive objectives. Examples of best practice include the Humber Management Scheme, the Integrated Management-plan Elbe, Integrated Management-plan Weser and the Nature Development Plan for the Scheldt Estuary. The creation of unified management decisions and the avoidance of overlapping plans The Master Plan Coastal Defence in the Weser has demonstrated that a unifi ed management framework for coastal protection can be developed despite the number of different federal states and authorities involved. In response to the Flood Risk Management Directive, all four estuaries have comprehensive fl ood risk management plans in place derived through their environment protection agencies and local authorities/federal states. These management plans have been developed on a whole estuary scale, instead of on an administrative basis, which avoids duplication of effort and possible overlap and omissions. Open communication between statutory authorities, stakeholders and users within an estuary will lead to common goals being met All four estuaries have shown good practice in using stakeholder and advisory networks to develop many of the plans, for example the River Basin Management Plans (RBMPs) and other programmes of measures as required under the Water Framework Directive. The RBMPs have been successfully developed both at the local scale (e.g. the Humber estuary), and at the international scale (e.g. the Elbe) thus overcoming administrative boundaries. 6
28 52 Management initiatives and governance Management initiatives and governance 53 SWOT Analysis As the TIDE estuaries each have various management plans each covering a particular sector (use or feature), we carried out a SWOT analysis to assess best practice within the estuary management systems. We have highlighted the following threats across the four estuaries: limited funding thereby making a plan short-lived or including the initial stages of defi ning the needs but then a lack of resources for implementation; too many stakeholders with different goals can threaten a plan s success, and the limited spatial coverage of a plan. Strengths Weaknesses Common strengths, weaknesses, opportunities and threats identifi ed within the management plans of the four TIDE estuaries internal What are the highlights of the management plan? Are unique (or unusual) resources being drawn upon (and, if so, what are they)? What factors would be central in the management plan approach being adopted or transferred to plans in the future? What aspects of the management plan could be improved? What apparent pitfalls within the management plans have led to limited implementation? Strengths Best Practice towards the sustainable management of estuaries Weaknesses Opportunities Threats external Opportunities Does the management plan provide opportunities to incorporate future changes? Will opportunities arrive by changes in relation to new technology, environmental changes or changes in government policy or societal wishes? Threats Is the management plan threatened by funding, long term vision or political will? statutory in nature multi-sectoral suffi cient spatial coverage to provide a broad management remit for the estuary lack of fi nancial support/funding when non-statutory plans which have non-specifi c targets plans which are very narrow in focus lacking multi-sectoral inclusiveness to be forward thinking to integrate new issues e.g. climate change to be framework for future management needs confl ict resolution between different sectors and provide win-win situations limited funding therefore making a plan short lived too many stakeholders with different goals can threaten a plan s success limited spatial coverage of a plan A plan s strengths is that it should have the legislative power to enforce its aims, be multi-sectoral, have defi ned funding and have suffi cient spatial coverage to provide a broad management remit for the estuary. However, the SWOT analyses show that plans can be successful even if they are not statutory, e.g. the Integrated Management-plan Elbe, especially where there is a good implementation structure. Other strengths include multi-user management, stakeholder/user commitment/buy-in to the plan aims and for the plan to be regularly updated to keep up with changing legislation or environmental conditions. The main weaknesses highlighted across the plans include their lack of fi nancial support/funding when non-statutory; for example, lack of funding is often a major hurdle in delivering the policies put forward within shoreline management plans. Plans which have non-specifi c targets, and restricted plans that are not multi-sectorial are considered weak in achieving holistic solutions. Despite this, to be effective, a multi-sectorial plan should not lose focus of the key management issue and while it should not override the other interests, it needs to be multi-functional and holistic thus getting acceptance by all groups. The plan should present opportunities to be forward-thinking with the need to integrate new or changing issues, e.g. climate change. It should provide a framework for future management needs and provide confl ict resolution between different sectors to give a win-win situation in estuarine management. Environmental Assessment Here we emphasise two main axioms of environmental assessment: fi rstly, that all developments with a potential to harm the environment, such as new or increased infrastructure (e.g. industrial complexes or ports), require permission. Secondly, that while a regulating body does not have to prove that a development will harm the environment, the developer does have to show that it will not do so. Hence under EU Directives, all major developments require an Environmental Impact Assessment (EIA) and the production of an Environmental Statement (ES). An EIA is defi ned very precisely what is the impact of this activity, carried out at this time, in this place and in this way, with this level of mitigation and/or compensation and communicated widely. Similarly, plans and projects in Natura 2000 sites require an Appropriate Assessment (AA) which is very precisely what is the effect of the development on the features and conservation objectives of a designated Natura 2000 site. However, and again following the EU Directives, both of these require a precautionary approach, especially as there is uncertainty in determining impacts in a highly variable environment such as an estuary. TIDE considered how Belgium, Germany, the UK and the Netherlands cope with these uncertainties. 6
29 54 Management initiatives and governance Management initiatives and governance 55 Differences/similarities in dealing with EIA/AA in different countries Belgium (Flanders) Germany (Bremen) The Netherlands UK (England and Wales) Management Initiatives and Governance Summary EA and AA regimes are precise implementation of the EU Directives The management and resulting management plan should be: General/Definitions EA and SEA are implemented by the same act and regulations (very similar procedures) EIA and SEA are separate regimes but closely linked based on a good knowledge not only of the natural science but also the administrative and legislative framework; Formal screening procedures have been put in place based on a logical approach and founded on priorities and agreed objectives; Screening ECJ: screening procedure with mainly thresholds focusing on extent of activity are incorrect implementation of Annex III of EIA Directive ECJ: screening procedure with mainly thresholds focusing on extent of activity are incorrect implementation of Annex III of EIA Directive Navigation dredging not EIA Maintance Dredging Protocol aware of national and European implementation of Directives and their overlap; cross-sectoral in preference and integrated but if they are sectoral they must still engage all users; enacted at the level of the whole estuary; Content Assessment Consultation/Participation Minimal content of EA and AA (incl. overview knowledge gaps and other uncertaintles) Provisions of formal consultation during scoping and consideration of ES Independent Expert body (NCEA) System of statutory consultees supported by legislation where possible but non-statutory plans may still be successful; adequately funded and with commitment by stakeholders not only to derive the plan but also its implementation. Specifi c EIA/SEA procedure, not integrated EIA/SEA integrated in existing permit and planning procedures EIA/SEA integrated in existing permit and planning procedures SEA not applicable to port related activities understand and share information on the baseline conditions e.g. the physical processes and morphological evolution Decision/Monitoring Specialised central authority approves EIA/SEA, advises on AA Permitting or planning authority approves EIA/SEA, but a specialised commission acts as independent expert body Permitting or planning authority approves EIA/SEA, but independent Expert body gives advice Implemented into sectorbased and overarching development control regime have early consultation with relevant stakeholders, in order to involve stakeholders from the start of the project; use an adaptive strategy to overcome knowledge gaps; 6 choose an appropriate communication strategy, e.g. appropriate language; Courts exercise marginal control find synergies or at least increase awareness of conflicts and consider regional differences, and We analysed as examples the enlargement of the navigation channels in the Ems and Scheldt estuaries, dredging of the approach channel to the port of Immingham (Humber), several major port development and capital dredging projects in the Stour and Orwell estuaries, and the construction of Container Terminal 4 in the Weser. Our recommendations for good practice and innovative solutions on how to manage uncertainties take into account the different phases of a project (the current situation, project assessment, permits and derogation, mitigation and compensation, and monitoring and evaluation). These in general follow those of good integrated management. use conditions on permits to deal with scientific uncertainty. In addition, we need to take precautionary compensation into account for the potential failure of an untested mitigation measure. This can be: an adaptive strategy, a long term forum with stakeholders for reporting financial safeguards, a legal agreement for corrective measures and, under extreme cases, stopping the project.
30 Management measures 57 7 Management measures 42 Management Measures Evaluation of Measures Aspects related to Sedimentation, Site Selection and Design of Management Measures Recommendations 7 H. Glindemann
31 58 Management measures Management measures 59 Management measures 42 Management Measures The many demands on estuaries and challenges faced by estuarine users produce actual or potential problems which must be addressed using management measures. In TIDE, we have considered 42 management measures which either have already been implemented or are at a fi rm planning stage (for example, 11 measures for the Scheldt). The measures are related to different targets, for example to develop and/or protect specifi c habitats or species (measure category Biology/Ecology ), to reduce tidal energy, tidal range, tidal asymmetry and tidal pumping effects, to improve morphological conditions or for fl ood protection. Most measures aim at biological and ecological development targets whilst others are assigned to the measure categories Hydrology/Morphology and Physical/Chemical Quality. Pilot projects Throughout TIDE, we have analysed specifi c aspects of several pilot projects: Locations of management measures in the Scheldt polyhaline Nr. Measures 13 Lippenbroek fl ood control area with controlled reduced tide (FCA-CRT) 14 Groynes at Waarde 15 Ketenisse wetland small scale tidal wetland restoration in the freshwater zone of the Seascheldt 16 Paddeback wetland small scale tidal wetland restoration in the freshwater zone of the Seascheldt 17 Paardenschor small scale tidal wetland restoration in the Seascheldt 18 Heusden LO small scale tidal wetland restoration in the freshwater zone of the Seascheldt 19 Schelde pilot project 2: Relocation of dredged sediment to deep areas of the navigation channel mesohaline oligohaline Evaluation of the Sediment trap near Wedel (Elbe): effectiveness of related monitoring programmes; Potential Alternative uses of Dredged Material in the Humber: using both capital and maintenance dredged materials for uses other than targeted benefi cial disposal; Sediment relocation to shallow water near Walsoorden sandbar (Scheldt): feasibility of sediment disposal near the sandbar aimed at improving the physical and ecological status; Morphological management of estuaries (Scheldt): the concept of using morphological management aiming to harmonise various estuarine functions; Restoration of a tidal foreland in the Werderland region (Weser): developing uniform foreland pasture into typical tidal aquatic habitats related to coastal protection and port accessibility using of stakeholder involvement; Hard substratum Habitats in the Outer Weser: fi eld study on ecological signifi cance of geo- and biogenic habitats; Anabranch Revitalisation of the Lower Weser Estuary: the ecological effectiveness of various revitalisation scenarios; Secondary channels in European estuaries (Weser): occurrence and importance of secondary channels; boundary conditions of self-sustaining systems; Mitigation measures at the estuarine mouth (Elbe and Scheldt): the suitability of the chosen location. The pilot projects primarily address a particular question for a given estuary but they also provide results transferable to other similar estuaries elsewhere. limnic limnic Evaluation of Measures 7 limnic 5 km 20 TIDE pilot: Relocationof dredged sediment to shallow water area at the edge of the Walsoorden sandbar (2004) 21 TIDE pilot: Relocation of dredged sediment to a shallow water area at the edge of the Walsoorden sandbar (2006) 22 TIDE pilot: Relocation of dredged sediment to four shallow water areas at the edge of sandbars (2010) 23 Vispaaiplaats Fish spawning pond In TIDE, we have determined the effectiveness of measures relating to development targets, according to monitoring and/or modelling results and expert knowledge. Furthermore, we investigated the effect of the measure on the delivery of ecosystem services, the achievement of conservation objectives for Natura 2000 sites and attaining Good Ecological Status under the Water Framework Directive (WFD). Estimating potential confl icts and synergistic effects of the actual or planned measures related to WFD targets was based on identifying the main pressures in single estuary zones. We included the success or failure of the measure, implementation costs, potential co-benefi ts, i.e. win-win opportunities, lessons learned and gaps in knowledge.
32 60 Management measures Management measures 61 ES analysis results for all TIDE measures Translation of measure targets into ES terms Target Safety Habitat conservation/restoration Compensation Research Access opportunity and education Achieving Natura 2000/WFD Requirements Although most measures were originally not designed to meet WFD or Natura 2000 requirements, we have identifi ed multiple positive effects targeting the main pressures. Neutral effects were also stated but negative effects were not indicated. In many cases, we found several potential synergistic effects related to WFD requirements especially in the measures assigned to the category Biology/Ecology. However, despite the dynamic nature of estuaries, measures were sometimes aimed at a static target. As sedimentation, erosion and the development of vegetation are natural processes of restored estuarine habitats, the character of the estuarine habitat will inevitably change (e.g. a mudfl at will evolve to marsh). Therefore, the measure s success can be improved by formulating dynamic goals (e.g. marshland with mudfl ats and creek development). This needs an adaptive management approach which accommodates natural development and anthropogenic demands and changes. Delivery of Ecosystem Services The different measures also contribute to the delivery of ecosystem services and so to show the potential co-benefi ts of the studied management measures, we translated the targets into ES terms. Corresponding Ecosystem Service R1 Water quantity regulation: dissipation of tidal and river energy R4 Reg. of extreme events: fl ood water storage R12 Erosion and sedimentation regulation by water bodies S Habitat services S Habitat services C3 Cult. Information for cognitive development C4 Cult. Opportunities for recreation and tourism ES benefi ts were identifi ed for most of the measures including high positive scores for habitat, regulating and cultural services. Only the expected impact on provisioning services is limited. The expected impact of the measures on the different benefi ciaries is mainly indirect, related to the future use of the area, and on a local or regional scale. Overall, the measures generate many co-benefi ts for ES are positively impacted and the largely positive ES assessment for most TIDE measures results from the measure selection. Since most measures considered are biodiversity-targeted and examples of good practice, high scores for supporting, regulating and cultural services are expected while the anticipated impact on provisioning services is limited. Legend: expected impact* 3 very positive 2 positive 1 slightly positive 0 neutral -1 slightly negative -2 negative -3 very negative X Targeted ES Ecosystem services Biodiversity Erosion and sedimentation regulation by water bodies Water quality regulation: reduction of excess loads coming from the catchment Water quality regulation: transport of polutants and excess nutriënts Water quantity regulation: drainage of river water Erosion and sedimentation regulation by biological mediation Water quantity regulation: transportation Water quantity regulation: landscape maintenance Climate regulation: Carbon sequestration and burial Water quantity regulation: dissipation of tidal and river energy Regulation extreme events or disturbance: Wave reduction Regulation extreme events or disturbance: Water current reduction Regulation extreme events or disturbance: Flood water storage Water for industrial use Water for navigation Food: Animals Aesthetic information Inspiration for culture, art and design Information for cognitive development Opportunities for recreation & tourism Estuary Measure Zone Categ. S R1 R2 R3 R4 R5 R6 R7 R8 R9 R10 R11 R12 P1 P2 P3 C1 C2 C3 C4 Elbe Spadenlander Busch Fresh HB Elbe Medemrinne Ost Meso H Elbe Current defl ection wall Fresh H Elbe Current direction control Fresh H Elbe Sediment trap Wedel Fresh H Elbe Hahnöfer Nebenelbe Fresh HB Elbe Wrauster Bogen Fresh B Elbe Hahnöfer Sand Fresh B Elbe Spadenlander Spitze Fresh B Elbe Reed settlement Haken Fresh B Elbe METHA Fresh B Elbe Managing Reiherstieg sluice Fresh P Schelde Lippenbroek Fresh HB Schelde Groynes Waarde Meso B Schelde Ketenisse wetland Meso B Schelde Paddebeek wetland Fresh B Schelde Paardenschor wetland Meso B Schelde Heusden LO wetland Fresh B Schelde Sediment relocation Ketelplaat Meso H Schelde Walsoorden 2004 Meso B Schelde Walsoorden 2006 Meso B Schelde Sandbars 2010 Poly B Schelde Fish pond Meso B Weser Tegeler Plate Oligo B Weser Shallow water area Rönnebecker Sand Fresh HB Weser Vorder- und Hinterwerder Fresh HB Weser Kleinensieler Plate Fresh B Weser Cappel-Süder-Neufeld Poly B Weser Werderland Poly B Humber Alkborough SM Meso HB Humber PHS SM Poly B Humber MudBug SM B Humber Choweder Ness ABP mer SM Meso B Humber sluice at Doigs Creek at Grimsby B Humber Welwick B Humber Beacon Lagoon B
33 62 Management measures Management measures 63 Managed Realignment Measures We paid particular attention to Managed Realignment Measures (MRM) as habitat restoration which account for almost half of the estuarine measures studied. Two specifi c types of MRM were analysed: Basic managed realignment ( dyke-realignment, de-polderisation ) involving the setting back of the line of actively maintained defences to a new line inland of the original and promoting the creation of intertidal habitat between the old and new defences, this habitat being open to regular tidal exchange. Regulated tidal exchange (RTE) where a similar process to the basic managed realignment technique is used, but with tidal inundation being manipulated for a specifi c management aim (e.g. increased or reduced sediment deposition within the site). In the TIDE estuaries, we assessed 17 managed realignment measures (MRM) with an average size of 63ha, ranging from 1.6ha to 440ha (only two cases had areas larger than 100ha). Overall, the degree of target achievement of MRM is high and reached by almost half of the measures whereas not all targets were completely reached in the remainder. However, in some cases the degree of target achievement could be improved by just slightly adapting the MR site e.g. regarding the design of the inlet or the elevation of certain parts of the measure area to increase the effectiveness and minimise siltation. There are several aspects relating to the location and design of a measure which infl uence its success such as choosing the appropriate elevation. Spatial differences in elevation in the area infl uence spatial patterns of accretion and saltmarsh vegetation, with implications for the habitat development, benthic invertebrate diversity and bird usage of the site. Elevation and accretion rates inside the realignment site are inversely related as a consequence of the tidal regime, i.e. lower areas of elevation will fl ood at a higher frequency and for longer periods of time potentially resulting in more sediment being deposited. There is a positive relationship between inundation (frequency and duration) and the accretion rate and hence with elevation, as can be seen for example at the measure Lippenbroek (Scheldt). Hence, an inappropriate elevation could mean specifi c site objectives (e.g. marsh development) are not met. Areas that are located much lower than mean high water level (MHWL) for example are constantly fl ooded and hence vegetation development is suppressed. Old polders, which are often used as project sites, are however usually located much lower than MHWL due to increasing water levels and their location. Elevation changes in the time following sedimentation at 10 sites of Lippenbroek (Scheldt) Elbe Spadenlander Busch/Kreetsand HPA Scheldt Lippenbroek FCA-CRT APA 3,300 3,200 S1 S2 3,100 S3 Elevation (mtaw) 3,000 2,900 2,800 2,700 S4 S5 S6 S7 S8 7 2,600 S9 Weser Shallow water zone Kleinensieler Plate WSA Bremerhaven Humber Creation of ~13 ha intertidal habitat at Chowder Ness Environment Agency 2,500 2,400 feb/06 mei/06 aug/06 nov/06 mrt/07 jun/07 sep/07 jan/08 apr/08 jul/08 okt/08 feb/09 mei/09 aug/09 S10 Half of the TIDE MRM are located in the freshwater zone of the estuaries and the other half spread along the remaining three salinity zones. The MRM have been implemented for different targets such as habitat conservation, restoration or creation. Only a few cases combined this conservation target with a safety target (fl ood storage capacity), research target, and/or recreation opportunities. Time
34 64 Management measures Management measures 65 MRM generate many synergies between nature conservation, fl ood protection and public safety, port development, recreation and natural resources, but there are also confl icts with agriculture and local inhabitants. They are expensive but could also generate large benefi ts, for example, the relative implementation cost of the TIDE MRM cases averaged ca. 280,000 /ha ranging between 16,000 and 1.4 M /ha, depending on the design, location, local boundaries and need for lowering the site. The TIDE MRM produce benefi ts for at least 12 of the 20 ES considered, especially for habitat services and cultural services and partly for regulating services but not for provisioning services for most measures. On average, only 10% of the ES achieving benefi ts were initially targeted by the measure and although most ES were not targeted by the measure, they still showed benefi ts. The valuation of ES is proposed as a tool for estuarine managers to assess the overall impact of management measures. It could also help in decision-making to select the most sustainable management measures. Although different monetary valuations of ES exist with often different outcomes, TIDE obtained an approximate indication of the monetary benefi ts of the MRM. By multiplying available global monetary data for different ecosystems with the habitat created in the MRM, our examples showed an annual average benefi t of 133,000 /ha. This fi nancial gain is limited to the benefi ts generated within the estuary itself but excludes those from the lost land. Sediment Management Strategies Our comprehensive comparison of sediment management strategies of the TIDE estuaries, including for example development of traffi c and shipping channels, dredging amounts and types of relocation, shows the optimal dredging location to guarantee port access. Sediment management practice has developed over time especially in those estuaries where unfortunately the ports are located in sediment accreting areas. Such practice has had to adapt to natural, technical, biogeochemical, administrative and boundary conditions and legal requirements but has had the benefi t of an improving knowledge base. Therefore site-specifi c strategies not only include the dredging process itself but also adaptive sediment use and disposal strategies, morphological management, and sediment quality issues. Successful management requires the greater integration of sediment management approaches to accommodate current changes in the environmental and nature conservation regulations but with also reducing port costs and accommodating more frequent undesired morphodynamic developments such as increased tidal pumping. Therefore modern sediment management strategies need to consider the whole estuarine system. More ambitious strategies aim at infl uencing sediment transport patterns and amounts or at preventing the entry of sediments into a certain area and contribute, as far as possible, to a balanced development of the estuary. By comparing the experience in our estuaries, TIDE has been able to make recommendations to both achieve user objectives and reduce potential confl icts. Recommendations We describe and give guidance on a methodology for the monetary valuation of ecosystem services for estuarine managers. This state-of-the-art methodology is based on best available data. In general the overall success of a management measure should be judged on the extent to which the different development targets and objectives are met. Hence the targets have to be SMART (specifi c, measurable, achievable, realistic and time-dependent). Aspects Related to Sedimentation, Site Selection and Design of Management Measures High amounts of suspended sediments (SPM) and their deposition in accreting areas are a common feature in many estuaries, and the resulting problems for estuarine management are increased by developing ports, navigation channels and realignment sites in those accreting areas. Increased accretion in ports and channels increases maintenance costs whereas in shallow habitats this may reduce fi sh and bird feeding areas and thus the ecological carrying capacity. Further, high sedimentation rates may prevent us achieving the targets of a measure, such as enlarging hallow water habitats. As sedimentation is governed by many factors, there are some ways of reducing its negative consequences. For example, the location of a MRM is important in determining both global and local sedimentation and erosion processes which are key to the success of the MRM. The important processes include the hydrodynamics of the area, salinity gradient, SPM content, location of the turbidity maximum zone in relation to the planned location of the measure, the number and position of breaches, and the tidal elevation and inundation for habitat development and/or for fl ood storage capacity. A good understanding of the relationships between currents, tidal range and sediment transport is needed when attempting to alter the system. This may include applying an adaptive strategy based on model forecasts or large scale experiments. Summary and recommendations for planning and implementing a management measure: firstly and most importantly, define and stick to SMART targets; analyse the pressures within the respective estuary section; analyse conflicts, synergistic effects, benefits and co-benefits related to other targets; consider the fundamental hydrodynamic, geomorphological and ecological processes; formulate dynamic goals, including the improved delivery of ecosystem services over time trajectory; incorporate lessons learned from previous and on-going projects; work with the natural system, not against it; minimise land manipulation and accommodate the existing topography; monitor the development of the measure and demonstrate the degree of target achievement, and make the results available to other estuary managers. Summary 7
35 Monitoring 67 8 Monitoring Types of Monitoring Opportunities for Standardisation The Pyramid Approach of Monitoring 8
36 68 Monitoring Monitoring 69 Monitoring It is unquestionable that you cannot manage anything unless you can measure it and hence the success of each management strategy and measure depends on whether the progress is appropriately monitored. The various policy frameworks including EU environmental directives require monitoring whether by a developer or a statutory/competent authority. In most cases, permission is granted for a development or an activity on condition that monitoring is performed. Therefore, decisions need to be based on good knowledge based on adequate measurements. We have to defi ne beforehand what we want or need to know, then the right parameters have to be measured in the right way, in the right place and with the right frequency. Subsequently the data have to be properly processed, stored and made available. Types of Monitoring There are different types of monitoring and each of these are defi ned in different EU Directives: Situation, condition and trend monitoring implies an intensive programme to evaluate pressures and assess long term trends. Operational monitoring implies monitoring the effects and especially the success of implementing a programme of measures. Compliance monitoring implies the monitoring required to determine whether or not a licence/permit/authorisation/consent has been met. Investigative or diagnostic monitoring implies further study to determine causal relationships leading to observed changes, thus increasing our understanding and providing the necessary information for drawing up measurement programmes in case of exceptions. Additionally, there is a distinction between effect monitoring and system monitoring. The latter is a long term monitoring programme to collect all necessary data to evaluate the functioning of the system. To evaluate effects of individual measures on accessibility, safety and ecology additional monitoring can be required, limited in space and time. Hence effect monitoring consists of an increase in monitoring frequency or additional parameters, a targeted programme nested within the system monitoring scheme. Opportunities for Standardisation Apart from the need to integrate policy and monitoring efforts, our inter-estuarine comparison revealed monitoring differences and hence the opportunities for monitoring standardisation. For example, suspended matter, a crucial parameter for interpreting sediment transport, turbidity, primary production, sedimentation, erosion and as shown for the Humber even water quality, are monitored differently in different estuaries, making the comparison and exchange of knowledge more diffi cult. Therefore, in TIDE we have proposed a standard monitoring approach that can be used to cover all purposes with detailed, fully described methods. Experience from the Scheldt has shown that the application of standard methods and a well-defi ned approach can effectively reduce monitoring costs and overlaps and thus optimise the monitoring programme. Furthermore, we have shown that monitoring results can improve communication and the criteria of decision making by a limited set of communication indicators which are built up in a pyramid approach. Therefore the Scheldt serves as an example to fulfi l the three main functions of estuaries namely accessibility (navigation), safety (against fl ooding) and naturalness (ecology). Fieldwork Silinski 8
37 70 Monitoring Monitoring 71 The Pyramid Approach of Monitoring Diagram of the pyramid approach for monitoring Explains why a calculation parameter meets/doesn t meet the criterium Increase/decrease of the parameter can not be evaluated in an unambiguous way Simple terms that describe the Scheldt estuary We have shown that monitoring can improve both communication and the criteria of decision-making using a limited set of indicators. A system was developed for the Scheldt where the three main functions of estuaries namely, accessibility (navigation), safety (against fl ooding) and naturalness (ecology), were assessed using a hierarchical approach of indicators presented in the form of a pyramid. Evaluation Safety Accessibility Naturalness Communication indicator Test parameter Calculation parameter Explanatory parameter Favourable Unfavourable Main function Long Term Vision Limited number Clear concepts Can be tested in an unambiguous way and evaluated as sufficient or insufficient One or more calculation parameters to be deduced per test parameter Meets or doesn t meet the criterium At the top of the pyramid one can fi nd the communication indicator, which is evaluated by the lower levels. Level 1: Directly below the communication indicator are the test parameters: a limited, yet complete set of parameters which can be used to evaluate unambiguously the status or trend of the communication indicator. Level 2: Each test parameter consists of one or more calculation parameters. A clear test criterion has been designed for each calculation parameter. All the calculation parameters combined determine whether changes in a test parameter are favourable or unfavourable for the functioning of the system. Level 3: At the bottom of the pyramid is a set of explanatory parameters aimed mainly to help to understand the observed changes and to a lesser extent to evaluate the changes. The explanatory parameters themselves cannot be evaluated independently. This tool offers an effects assessment on different scales and proportional to the problem being tackled. It results in monitoring which is scientifi cally, technically and legislatively defensible, cost effective, and that provide suffi cient information to evaluate the impacts of the activities and management measures. End of evaluation Sufficient knowledge Insufficient knowledge Policy decision No further action Measures Further investigation TIDE provides a scheme giving different monitoring levels that can be used to cover all purposes with detailed, fully described methods. Experience from the Scheldt has showed that the application of standard methods and a well-defined approach can effectively reduce monitoring costs and overlaps and optimise the monitoring. Summary 8
38 TIDE Toolbox 73 9 TIDE Toolbox TIDE 9
39 74 TIDE Toolbox TIDE Toolbox 75 TIDE Toolbox Estuarine management, its institutions and stakeholders cover a wide range of aspects and interests, have different levels of knowledge, and different ways of approaching a challenge and may require one or more particular tools. Much valuable information related to integrated estuarine management has become available. This summary can only give a broad overview of the project results which will support estuarine managers in their work. More information on estuarine functioning, experiences and recommendations related to the implementation of management plans and measures, and tools are presented at the website TIDE toolbox for managers, stakeholder and the general public. Firstly, essential knowledge on the historical evolution of the four estuaries, their functioning and the delivery of ecosystem services is provided from which societal benefi ts can be derived. Following this, the existing management initiatives and plans within the TIDE estuaries are made available after being subjected to a SWOT analysis to present good/best practices. We have enabled managers to determine which are the uses and users and whether there are confl icts between these. This knowledge enables the implementation of appropriate management measures and restoration projects. In total 42 management measures and pilot projects related to different management topics, for example habitat restoration or sediment transport, have been evaluated. To be successful, governance initiatives and measures must be embedded in an appropriate communication and information programme, hence we present the relevant experiences and lessons learned. The toolbox provides several ways to approach the diverse TIDE products according to the user s preference: select a specifi c report from the list of reports; choose between the summary or the whole report; search one or several related reports by keywords compiled in a glossary; select your specifi c question/management issue from a list (management issues); browse the list of tools; browse the list of management measures that may serve as good practice. Screenshot of toolbox website Tools in this toolbox include recommendations concerning certain methodologies, templates, specifi c reports and their summary, a generic roadmap for integrated management including the instructions for performing an Environmental Impact Assessment and an Estuarine Planning Support System (EPSS), an interactive bird disturbance tool to assist managers characterise the likely impact of a proposed activity on components of Natura 2000 waterbird communities, including both noise and visual disturbance effects mitigation. Finally an overall summary report brings together all the different aspects as applied for the four TIDE estuaries. The website allows the user to scroll down in a document and enlarge graphs and tables, but the products can also be downloaded freely as.pdf documents and stand-alone tools. 9
40 76 Imprint TIDE Project Partners Ten partners from port administrations, universities, and public and environmental agencies founded the project to propose the integrated management of estuaries leading to benefi ts for ecology, economy and society: Hamburg Port Authority (Germany, Lead Partner) Lower Saxony Water Management, Coastal Defense and Nature Conservation Agency (Germany) Rijkswaterstaat (Middelburg, The Netherlands) Flemish Authorities Department of Mobility and Public Works (Belgium) Antwerp Port Authority (Belgium) University of Antwerp (Belgium) Free Hanseatic City of Bremen (Germany) University of Bremen (Germany) Institute of Estuarine and Coastal Studies, University of Hull (United Kingdom) Environment Agency (United Kingdom) Although not a funded partner, Associated British Ports (United Kingdom) also contributed greatly to the Humber aspects of the project, as well as the Federal Institute of Hydrology (Germany) for the Elbe aspects. TIDE aimed to share the knowledge and the experiences made with other interested or responsible people, institutions and stakeholders at a regional, national and international level. Layout Atelier Hauer+Dörfl er GmbH, Germany Print Imprint TIDE is an initiative of Hamburg Port Authority and nine other international partners responsible for management and research at the estuaries Elbe, Weser, Scheldt and Humber. The project s budget of 3,7 m is half fi nanced by the INTERREG IVB North Sea Programme of the European Commission. Brandenburgische Universitätsdruckerei und Verlagsgesellschaft Potsdam mbh Project Lead Partner Manfred Meine Hamburg Port Authority (HPA) Neuer Wandrahm Hamburg, Germany Tel [email protected] External Project Coordination Office Angela Schultz-Zehden s.pro sustainable projects GmbH Rheinstr Berlin, Germany Tel [email protected] Hamburg March 2013 This publication has been produced with the assistance of the European Union. Its content is the sole responsibility of the authors and can in no way be taken to refl ect the views of the European Union.
41
Long Term Challenges for Tidal Estuaries
 A view from a former tidal river manager expert with experience from 6 decades living at, with and from the Tidal River Elbe chairman of the European Interreg Project TIDE (Tidal River Development) Land
The River Ribble is one of the longest rivers in the North West of England
 River Ribble The River Ribble is one of the longest rivers in the North West of England Did you know? The tidal limit of the Ribble is 11 miles inland (above Preston); The River Ribble is home to a variety
Sediment and Dredged Material Management - Relevance and Objectives 18 September 2003
 - Relevance and Objectives 1. Scope of the Dutch German Exchange (DGE) The Netherlands and Germany have large river systems such as Danube, Rhine, Meuse, Elbe, Weser and Ems, which have important hydrological
Policy & Management Applications of Blue Carbon. fact SHEET
 Policy & Management Applications of Blue Carbon fact SHEET Policy & Management Applications of Blue Carbon Coastal Blue Carbon - An Important Wetland Ecosystem Service Coastal Blue Carbon refers to the
RESTORATION AND ENHANCEMENT OF SOUTHERN CALIFORNIA LAGOONS
 RESTORATION AND ENHANCEMENT OF SOUTHERN CALIFORNIA LAGOONS by Hany Elwany, Ph.D. Scripps Institution of Oceanography Headwaters to Oceans Conference 25 October 2003 CE Ref #03-22 San Diego County Lagoons
Catchment Scale Processes and River Restoration. Dr Jenny Mant [email protected]. The River Restoration Centre therrc.co.uk
 Catchment Scale Processes and River Restoration Dr Jenny Mant [email protected] The River Restoration Centre therrc.co.uk 3 Main Catchment Elements Hydrology Energy associated with the flow of water affects
4.2 Buena Vista Creek Watershed
 Buena Vista Creek Watershed 4.2 Buena Vista Creek Watershed Watershed Overview The Buena Vista Creek Watershed is the fourth-largest system within the Carlsbad Hydrologic Unit. The watershed extends approximately
GREAT BARRIER REEF. Climate Change Action Plan
 GREAT BARRIER REEF Climate Change Action Plan 2007 2011 Climate change is now recognised as the greatest long-term threat to the Great Barrier Reef. The Great Barrier Reef is internationally renowned as
Green Infrastructure Case Study Template
 Green Infrastructure Case Study Template The aim of the exercise is to provide information on how the elements of the Green Infrastructure Strategy are implemented at national level and to provide case
case study 7: south east queensland healthy waterways partnership
 2 Australia s National Programme of Action for the Protection of the Marine Environment from Land-Based Activities introduction South-east Queensland s marine systems support large populations of dugongs
Stream Rehabilitation Concepts, Guidelines and Examples. Objectives. Pierre Y. Julien. Three Laws of Stream Restoration
 Stream Rehabilitation Concepts, Guidelines and Examples Pierre Y. Julien Wuhan 2005 Objectives Part I - Stream restoration and rehabilitation: 1. Present and discuss important concepts, laws, criteria
UK ENVIRONMENTAL STANDARDS AND CONDITIONS (PHASE 1) Final report. April 2008
 Final report. April 2008") UK Technical Advisory Group on the Water Framework Directive UK ENVIRONMENTAL STANDARDS AND CONDITIONS (PHASE 1) Final report April 2008 (SR1 2006) Final Table of Contents LIST OF TABLES...3 SECTION 1
UK Technical Advisory Group on the Water Framework Directive UK ENVIRONMENTAL STANDARDS AND CONDITIONS (PHASE 1) Final report April 2008 (SR1 2006) Final Table of Contents LIST OF TABLES...3 SECTION 1
Origins and causes of river basin sediment degradation and available remediation and mitigation options. Feedback from the Riskbase workshop
 Origins and causes of river basin sediment degradation and available remediation and mitigation options Feedback from the Riskbase workshop Corinne Merly 1, Olivier Cerdan 1, Laurence Gourcy 1 Emmanuelle
Dr. Lidija Globevnik Luka Snoj, Neven Verdnik, Peter Muck. Meta Povž
 The concept of ecological restoration of a sub-alpine river and its tributaries in Slovenia Suggestions for regulation of riverbed and reconstruction of hydrotechnical facilities Dr. Lidija Globevnik Luka
Improving the physical condition of Scotland s water environment. A supplementary plan for the river basin management plans
 Improving the physical condition of Scotland s water environment A supplementary plan for the river basin management plans Contents Executive summary... 2 1. Introduction... 3 2. Vision... 4 3. Taking
River Wensum Restoration Strategy Swanton Morley Restoration Scheme Reach 14a
 River Wensum Restoration Strategy Swanton Morley Restoration Scheme Reach 14a At a glance River restoration benefits: Improved planform, channel cross-section, flow variation and sediment process. Improved
Environmental Case Study Decatur, Georgia, DeKalb County A Suburban Creek Resists Channelization
 Introduction A visual examination of Doolittle Creek in a highly developed suburban county in Georgia yielded telltale signs of a creek whose original streambed had been altered. Examination of official
Introduction to protection goals, ecosystem services and roles of risk management and risk assessment. Lorraine Maltby
 Introduction to protection goals, ecosystem services and roles of risk management and risk assessment. Lorraine Maltby Problem formulation Risk assessment Risk management Robust and efficient environmental
WATER RESOURCES ENGINEERING DESIGN LANDSCAPE ECOLOGY AND RIVER RESTORATION. www.sindlar.eu
 Geomorphological processes of watercourse development, system of typology and application of the results in practice Part 01 Analysis of geomorphological processes in watercourses Part 02 Applications
Ecosystems and Food Webs
 Ecosystems and Food Webs How do AIS affect our lakes? Background Information All things on the planet both living and nonliving interact. An Ecosystem is defined as the set of elements, living and nonliving,
Delivering multiple benefits through effective river restoration UK & EU
 Martin Janes Managing Director The River Restoration Centre Delivering multiple benefits through effective river restoration UK & EU CIEEM Annual Conference Southampton 2013 [email protected] 01234 752979
Chapter 3 Communities, Biomes, and Ecosystems
 Communities, Biomes, and Ecosystems Section 1: Community Ecology Section 2: Terrestrial Biomes Section 3: Aquatic Ecosystems Click on a lesson name to select. 3.1 Community Ecology Communities A biological
It s hard to avoid the word green these days.
 Going green : Environmental jobs for scientists and engineers Alice Ramey Alice Ramey is an economist in the Office of Occupational Statistics and Employment Projections, BLS. She is available at (202)
Restoring Ecosystems. Ecosystem Restoration Services
 Restoring Ecosystems Ecosystem Restoration Services 2 Ecosystem Restoration Services AECOM s integrated approach sciencebased planning, with innovative design and execution delivers sustainable and cost-effective
AN INITIATIVE TO IMPROVE
 L OW E R C A R M E L R I V E R A N D L AG O O N F L O O D P L A I N R E S TO R AT I O N A N D E N H A N C E M E N T P R O J E C T AN INITIATIVE TO IMPROVE FLOOD PROTECTION RESTORE AND PROTECT RIPARIAN
Aquatic Biomes, Continued
 Aquatic Biomes, Continued Introduction Extent of Marine biomes Issues & challenges Factors influencing distribution Dynamics in time & space Depth Tour of marine biomes Issues (by biome) Freshwater biomes
An Irish Strategy for River Restoration: How it works on the ground. Karen Delanty
 An Irish Strategy for River Restoration: How it works on the ground Karen Delanty River Restoration and EU Directives River Restoration in Ireland to-date; TAM (Tourism Angling Measure) Local small scale
Howsham fish passage Consultation document
 Howsham fish passage Consultation document Report ENVIMNE000903 Final version 30 June 2016 We are the Environment Agency. We protect and improve the environment. Acting to reduce the impacts of a changing
How To Manage Water Resources
 NB: Unofficial translation; legally binding texts are those in Finnish and Swedish Ministry of the Environment, Finland Government Decree on Water Resources Management (1040/2006) Given in Helsinki on
Urban Waters and River Restoration. Pinja Kasvio, Finnish Environment Institute, SYKE RESTORE North Region Closing Seminar 14.8.
 Urban Waters and River Restoration Pinja Kasvio, Finnish Environment Institute, SYKE RESTORE North Region Closing Seminar 14.8.2013 Urban Waters Hålland, Gässlösa (Sweden) Characteristics of urban areas:
The concepts developed in this standard include the following: Oceans cover about 70% of the surface of the Earth.
 Name Date Grade 5 SOL 5.6 Review Oceans Made by SOLpass - www.solpass.org [email protected] Reproduction is permitted for SOLpass subscribers only. The concepts developed in this standard include
Using the Carbon Market to Provide Financial Support for Coastal Restoration and Protection. fact SHEET
 Using the Carbon Market to Provide Financial Support for Coastal Restoration and Protection fact SHEET Using the Carbon Market to Provide Financial Support for Coastal Restoration and Protection Coastal
Advice note. Linking River and Floodplain Management
 Advice note Linking River and Floodplain Management Advice note Linking River and Floodplain Management Demonstrating STrategic REstoration And Management (STREAM) is a 1 million four-year conservation
AP ENVIRONMENTAL SCIENCE 2010 SCORING GUIDELINES
 AP ENVIRONMENTAL SCIENCE 2010 SCORING GUIDELINES Question 4 (a) Based on the rate cited above, calculate the expected increase in sea level, in meters, during the next 50 years. One point can be earned
Curt Kerns, M.S., R.P.Bio., C.F.S. WetlandsPacific Corp. 250-722-7117 www.wetlandspacific.com
 Curt Kerns, M.S., R.P.Bio., C.F.S. WetlandsPacific Corp. 250-722-7117 www.wetlandspacific.com Presentation Historical perspectives Present perspectives How wetlands function Examples of natural wetlands
1.7.0 Floodplain Modification Criteria
 1.7.0 Floodplain Modification Criteria 1.7.1 Introduction These guidelines set out standards for evaluating and processing proposed modifications of the 100- year floodplain with the following objectives:
Compilation of Upper Mississippi River System Science Questions developed by the Long Term Resource Monitoring Program
 Compilation of Upper Mississippi River System Science Questions developed by the Long Term Resource Monitoring Program Includes: 1. Questions from the Science Planning Effort in 2003 2. FY07 Additional
Greater Los Angeles County Region
 Attachment 6 Greater Los Angeles County Region IRWM Implementation Grant Proposal Monitoring, Assessment, and Attachment 6 consists of the following items: Monitoring, Assessment, and. The purpose of this
Rural Flooding: The Potential Role of Forestry
 Rural Flooding: The Potential Role of Forestry Nadeem Shah, Tom Nisbet, & Huw Thomas Centre for Forestry and Climate Change Structure Background Woodland and Flood Alleviation The Theory. Studies on Woodland
Nipigon Bay. Area of Concern Status of Beneficial Use Impairments September 2010
 Nipigon Bay Area of Concern Status of Beneficial Use Impairments September 2010 Nipigon Bay is in the most northerly area of Lake Superior. The Area of Concern takes in a large portion of Nipigon Bay and
Appendix B: Cost Estimates
 Appendix B: Estimates This appendix presents the estimated costs of the monitoring and supplemental research components presented in Section 3 of this document. A 20% quality assurance and quality control
RECALLING Paragraph b of Article 13 of the Convention on the Protection of the Marine Environment of the Baltic Sea Area, 1974 (Helsinki Convention),
,") CONVENTION ON THE PROTECTION OF THE MARINE ENVIRONMENT OF THE BALTIC SEA AREA HELSINKI COMMISSION - Baltic Marine HELCOM 19/98 Environment Protection Commission 15/1 Annex 3 19th Meeting Helsinki, 23-27
CONVENTION ON THE PROTECTION OF THE MARINE ENVIRONMENT OF THE BALTIC SEA AREA HELSINKI COMMISSION - Baltic Marine HELCOM 19/98 Environment Protection Commission 15/1 Annex 3 19th Meeting Helsinki, 23-27
Ecosystem services in grasslands: evidence, trade-offs and restoration. James Bullock NERC Centre for Ecology and Hydrology [email protected].
 Ecosystem services in grasslands: evidence, trade-offs and restoration James Bullock NERC Centre for Ecology and Hydrology [email protected] Ecosystem services definitions and types Grasslands 13% of Earth
Protected Area Categories and Management Objectives
 Protected Area Categories and Management Objectives A protected area is defined as: An area of land and/or sea especially dedicated to the protection and maintenance of biological diversity, and of natural
Water Quality Modeling in Delaware s Inland Bays: Where Have We Been and Where Should We Go?
 Water Quality Modeling in Delaware s Inland Bays: Where Have We Been and Where Should We Go? Damian C. Brady University of Maine Center for the Inland Bays Science and Technical Advisory Committee March
Background Information: The Mamquam River Floodplain Restoration Project
 Background Information: The Mamquam River Floodplain Restoration Project The Mamquam River Floodplain Restoration project is being undertaken in partnership with the Squamish River Watershed Society, Fisheries
Areas of protection and the impact chain
 Areas of protection and the impact chain Bo P. Weidema 2001.01.10 1. Introduction A modified scheme of areas of protection (also known as safeguard subjects) by Udo de Haes & Lindeijer (2000) has opened
Automated In-Situ Water Quality Monitoring Report
 Automated In-Situ Water Quality Monitoring Report Issued by the North of Ireland Joint Agency Coastal Monitoring Programme. For further information and data access please visit our website at: www.afbini.gov.uk/coastal-monitoring.htm
Development of innovative tools for understanding marine biodiversity and assessing good environmental status: the progress of the EU project DEVOTES
 Development of innovative tools for understanding marine biodiversity and assessing good environmental status: the progress of the EU project DEVOTES Angel Borja Scientific Symposium 2015, 6-7 May, Malmö,
Most informed people realize that cumulative impacts have had
 Welcome to the First Issue of Rivers & Coast! The goal of the new Rivers & Coast newsletter is to keep readers well informed of current scientific understanding behind key environmental issues related
Experience in Wetlands restoration and conservation concerning natural water retention measures. Ministry of Environment and Water, Bulgaria
 Experience in Wetlands restoration and conservation concerning natural water retention measures Ministry of Environment and Water, Bulgaria Water management in Bulgaria - Water management in Bulgaria national
Co-creation progress update and an invitation to respond. Overview of ideas from co-creation activities towards a Climate Ready UK...
 Department for Environment, Food and Rural Affairs Climate Ready Co-creation progress update and an invitation to respond July 2012 Contents Overview of ideas from co-creation activities towards a Climate
From Evidence to Action: Whole-catchment approaches to linking flood risk management and WFD measures
 From Evidence to Action: Whole-catchment approaches to linking flood risk management and WFD measures Nick Hardiman Royal Society for the Protection of Birds A wealth of research has been devoted to the
Ecosystem Services in the Greater Houston Region. A case study analysis and recommendations for policy initiatives
 Ecosystem Services in the Greater Houston Region A case study analysis and recommendations for policy initiatives Ecosystem Services Ecosystems provide services through their natural processes that we
Flood Risk Management
 Flood Risk Management Value of Flood Risk Management Every year floods sweep through communities across the United States taking lives, destroying property, shutting down businesses, harming the environment
Flood Risk Management
 Flood Risk Management Value of Flood Risk Management Value to Individuals and Communities Every year floods sweep through communities across the United States taking lives, destroying property, shutting
Earth Science. River Systems and Landforms GEOGRAPHY 1710. The Hydrologic Cycle. Introduction. Running Water. Chapter 14.
 Earth Science GEOGRAPHY 1710 River Systems and Landforms DAVID R. SALLEE Robert W. Christopherson Charlie Thomsen Chapter 14 Introduction Rivers and streams are dynamic systems that continually adjust
EU China River Basin Management Programme
 Ministry of Water Resources Ministry of Environmental Protection EU China River Basin Management Programme Technical Report 075 Water Resource Supply Security Strategy Analysis Ben Piper, Zhang Wang and
Inclusion of ecosystem concepts in integrated management of river resources
 Integrated Water Resources Management (Proceedings of a symposium held al Davis. California. April 2000). IAHS Publ. no. 272. 2001. 379 Inclusion of ecosystem concepts in integrated management of river
Belmont Forum Collaborative Research Action on Mountains as Sentinels of Change
 Belmont Forum Collaborative Research Action on Mountains as Sentinels of Change 1. Background and rationale Mountains exist in many regions of the world and are home to a significant fraction of the world
Responding to the Challenges of Water Security: the VIII Phase of the International Hydrological Programme 2014-2021
 3rd UNECWAS Annual Seminar 21st of August, TUT Responding to the Challenges of Water Security: the VIII Phase of the International Hydrological Programme 2014-2021 Blanca Jimenez-Cisneros Director of the
CAPS Landscape Metrics November 2011
 CAPS Landscape Metrics November 2011 This appendix describes the landscape metrics available in CAPS. These metrics are weighted and combined separately for each community, using the community model listed
San Francisco Bay Margin Conservation Decision Support System (DSS)
") San Francisco Bay Margin Conservation Decision Support System (DSS) Presented by Brian Fulfrost1, MS David Thomson2, MS 1 Brian Fulfrost and Associates 2 San Francisco Bay Bird Observatory Transitional
San Francisco Bay Margin Conservation Decision Support System (DSS) Presented by Brian Fulfrost1, MS David Thomson2, MS 1 Brian Fulfrost and Associates 2 San Francisco Bay Bird Observatory Transitional
Connecting Science and Management for Virginia s Tidal Wetlands. In this issue...
 In this issue... We review the relationship between science and the management of tidal wetlands in Virginia. The program has evolved over the past four decades to address: E the public benefits provided
Hydrological transport modeling
 Hydrological transport modeling Catchment modeling example from the EU EUROCAT project Catchment - river - coast continuum modeling example from MONERIS modeling Sea-air exchange modeling example from
Living & Working Managing Natural Resources and Waste
 Living & Working Managing Natural Resources and Waste 5.13 Managing Natural Resources and Waste Background 5.13.1 This chapter focuses on how we manage resources within the AONB. It includes renewable
Riparian Ecosystems and Climate Change: the Value of Floodplains along the River Elbe
 Climate Change and Nature Conservation in Europe - an ecological, policy and economic perspective 25-27 June 2013, Bonn, Germany Riparian Ecosystems and Climate Change: the Value of Floodplains along the
Phosphorus. Phosphorus Lake Whatcom Cooperative Management. www.ecy.wa.gov/programs/wq/nonpoint/phosphorus/phosphorusban.html
 Phosphorus Phosphorus Brochure Lake Whatcom Cooperative Management Reducing Phosphorus Website Washington State Department of Ecology www.ecy.wa.gov/programs/wq/nonpoint/phosphorus/phosphorusban.html Nutrients
Detention Ponds. Detention Ponds. Detention Ponds. Detention Ponds. Detention Ponds. Detention Ponds. CIVL 1112 Detention Ponds - Part 1 1/12
 CIVL 1112 - Part 1 1/12 The water cycle, also known as the hydrologic cycle, describes the continuous movement of water on, above and below the surface of the Earth. The water cycle, also known as the
AQUATIC ECOSYSTEMS & BIOMES
 AQUATIC ECOSYSTEMS & BIOMES A) Name three general types of aquatic ecosystems and describe the salinity for each. Give an example for each. 1) 2) 3) B) MATCHING In the space provided, write the letter
FUTURE CHALLENGES OF PROVIDING HIGH-QUALITY WATER - Vol. II - Environmental Impact of Food Production and Consumption - Palaniappa Krishnan
 ENVIRONMENTAL IMPACT OF FOOD PRODUCTION AND CONSUMPTION Palaniappa Krishnan Bioresources Engineering Department, University of Delaware, USA Keywords: Soil organisms, soil fertility, water quality, solar
Rhode Island NRCS received approximately $2.4 million in ARRA funds to implement four floodplain easement projects.
 American Recovery and Reinvestment Act (ARRA) Emergency Watershed Protection Program Floodplain Easements Rhode Island Natural Resources Conservation Service Rhode Island NRCS received approximately $2.4
SECTION 10.0 MANAGEMENT UNIT 5: HORNSEA
 10.1 Summary Information 10.1.1 Location SECTION 10.0 MANAGEMENT UNIT 5: HORNSEA The limits of Management Unit 5, a 2.9km stretch of shoreline fronting the town of Hornsea on the Holderness coast, are
Markets for Ecosystem Services on Agricultural Lands: Experience and Outlook in the United States
 Markets for Ecosystem Services on Agricultural Lands: Experience and Outlook in the United States Frank Casey Conservation Economics and Finance Program Defenders of Wildlife Presented at the Biodiversity
The Everglades & Northern Estuaries; St. Lucie River Estuary, Indian River Lagoon & Caloosahatchee Estuary. Water Flows & Current Issues
 The Everglades & Northern Estuaries; St. Lucie River Estuary, Indian River Lagoon & Caloosahatchee Estuary Water Flows & Current Issues Florida Governor Rick Scott August 20, 2013 Upper Chain of Lakes
CATCHMENT MANAGEMENT USING PAYMENTS FOR ECOSYSTEM SERVICES TO RESTORE AND MAINTAIN UPLAND PEAT
 CATCHMENT MANAGEMENT USING PAYMENTS FOR ECOSYSTEM SERVICES TO RESTORE AND MAINTAIN UPLAND PEAT There is growing interest in the potential for Payments for Ecosystem Services (PES) to fund conservation
Environmental Engineering, University of Seoul, Jennong-dong, Dongdaemun-gu, Seoul, Korea.
 WATER QUALITY MANAGEMENT FOR ECOLOGICAL RESTORATION IN ANYANG STREAM Yu, M.J., Cho, Y.M. 2, Lee, S.K. 3 Environmental Engineering, University of Seoul, Jennong-dong, Dongdaemun-gu, Seoul, Korea. 2 Department
Sewerage Management System for Reduction of River Pollution
 Sewerage Management System for Reduction of River Pollution Peter Hartwig Germany Content page: 1 Introduction 1 2 Total emissions 3 3 Discharge from the wastewater treatment plants 4 4 Discharge from
SECTION 3.2 CLIMATE AND PRECIPITATION
 SECTION 3.2 CLIMATE AND PRECIPITATION Ulster County Climate Data A preliminary analysis of the Preserve s weather data shows that the average temperature has risen about two degrees over the past 114 years.
Interim Technical Guidelines for the Development of Environmental Management Plans for Underground Infrastructure Revised - July 2013.
 Interim Technical Guidelines for the Development of Environmental Management Plans for Underground Infrastructure Revised - July 2013 Rationale Underground infrastructure may be at risk from valley, streambank
Michigan Wetlands. Department of Environmental Quality
 Department of Environmental Quality Wetlands are a significant component of Michigan s landscape, covering roughly 5.5 million acres, or 15 percent of the land area of the state. This represents about
Ariana Sutton-Grier, Holly Bamford & Kateryna Wowk University of Maryland and National Oceanic and Atmospheric Administration
 Future of our coasts: Potential for natural and hybrid infrastructure Ariana Sutton-Grier, Holly Bamford & Kateryna Wowk University of Maryland and National Oceanic and Atmospheric Administration Green
Chapter 3 CULVERTS. Description. Importance to Maintenance & Water Quality. Culvert Profile
 Chapter 3 CULVERTS Description A culvert is a closed conduit used to convey water from one area to another, usually from one side of a road to the other side. Importance to Maintenance & Water Quality
Guidance Document for Sediment Assessment
 Guidance Document for Sediment Assessment Methods to determine to what extent the realization of water quality objectives of a water system is impeded by contaminated sediments Date 4 November 2010 Status
Introduction to Natural Resource Damage Assessment
 Introduction to Natural Resource Damage Assessment Topics Overview Legal: Laws and Regulations NRDA Process Scaling Injuries and Restoration Restoration in the Arctic Summary 2 1 Top Three Things to Know
A Functional Classification System for Marine Protected Areas in the United States
 A Functional Classification System for Marine Protected Areas in the United States The U.S. Classification System: An Objective Approach for Understanding the Purpose and Effects of MPAs as an Ecosystem
FLOOD PROTECTION AND ECOSYSTEM SERVICES IN THE CHEHALIS RIVER BASIN. May 2010. Prepared by. for the. 2010 by Earth Economics
 FLOOD PROTECTION AND ECOSYSTEM SERVICES IN THE CHEHALIS RIVER BASIN May 2010 Prepared by for the Execubve Summary The Chehalis Basin experienced catastrophic flooding in 2007 and 2009. In response, the
Rivers Group. Effect of Canterbury Earthquakes on Waimakariri, Kaiapoi, & Halswell Rivers. Flooding & Drainage Perspectives
 Rivers Group Effect of Canterbury Earthquakes on Waimakariri, Kaiapoi, & Halswell Rivers Flooding & Drainage Perspectives Waimakariri River Catchment Waimakariri River Hydrology Catchment area - 3,990
Clean Water Services. Ecosystems Services Case Study: Tualatin River, Washington
 Viewed broadly, the concept of ecosystem services describes the many resources and services provided by nature. Typically, traditional planning and development practices do not adequately represent the
Flash Flood Science. Chapter 2. What Is in This Chapter? Flash Flood Processes
 Chapter 2 Flash Flood Science A flash flood is generally defined as a rapid onset flood of short duration with a relatively high peak discharge (World Meteorological Organization). The American Meteorological
One Major Six Concentrations. Department of Environmental Conservation University of Massachusetts Amherst
 One Major Six Concentrations Natural Resources Conservation Undergraduate Major Department of Environmental Conservation University of Massachusetts Amherst Conserving Earth s biological diversity and
Amherst County Public Schools. AP Environmental Science Curriculum Pacing Guide. College Board AP Environmental Science Site
 Amherst County Public Schools AP Environmental Science Curriculum Pacing Guide College Board AP Environmental Science Site REV: 8/12 1 st 9 weeks AP Objectives Energy Resources and Consumption A. Energy
Welcome to the Understanding Dissolved Oxygen learning module. This section provides information on the following topics:
 Introduction Welcome to the learning module. This section provides information on the following topics: How dissolved oxygen is defined and measured in numbers Why dissolved oxygen is important Natural
ECONOMIC ANALYSIS FLOOD DAMAGE REDUCTION. Lower Carmel River Floodplain Restoration and Enhancement Project
 ECONOMIC ANALYSIS FLOOD DAMAGE REDUCTION Lower Carmel River Floodplain Restoration and Enhancement Project I. Description of the Project and its Relationship to Other Projects in the Proposal The Lower
@race4thebaltic #RFTBBCGReport. Barbara Jackson Programme Director Zennström Philanthropies
 @race4thebaltic #RFTBBCGReport Barbara Jackson Programme Director Zennström Philanthropies Background This report was commissioned by Zennström Philanthropies to better understand local benefits from
Birmingham City University / Students Union Aspects and Impacts Register. Waste. Impacts description
 Birmingham City University / Students Union and Impacts Register Waste Production of non - hazardous waste Production of hazardous waste Storage of non - hazardous waste Potential for waste to be disposed
Proposed General Plan Update Goals, Policies, and Implementation Actions
 Proposed General Plan Update Goals, Policies, and Implementation Actions The construction and maintenance of infrastructure is necessary to support existing and planned land uses and to achieve Environmental