OLAP Solutions using Pentaho Analysis Services. Gabriele Pozzani
|
|
|
- Hester Norris
- 9 years ago
- Views:
Transcription

1 OLAP Solutions using Pentaho Analysis Services Gabriele Pozzani

2 PAS Pentaho Analysis Services (PAS) provides OLAP capabilities To interactively analyze data through a cross-tab interface No need to define a query A front-end provides the interface to retrieve and format data Drill-down Drill-up Slicing Dicing

3 PAS components (I) PAS consists of four components 1. Mondrian OLAP Engine: receives MDX queries from JPivot and returns a multi-dimensional result-set Included in the Pentaho Server 2. Schema Workbench: designes and tests Mondrian cube schemas Cubes are used by Mondrian to interpret MDX and translate it into SQL queries on a RDBMS

4 PAS components (II) 3. JPivot analysis front-end: a Java-based analysis tool. Front-end for OLAP cubes 4. Aggregate designer: a designer for generating aggregate tables to speed up the analytical engine

5
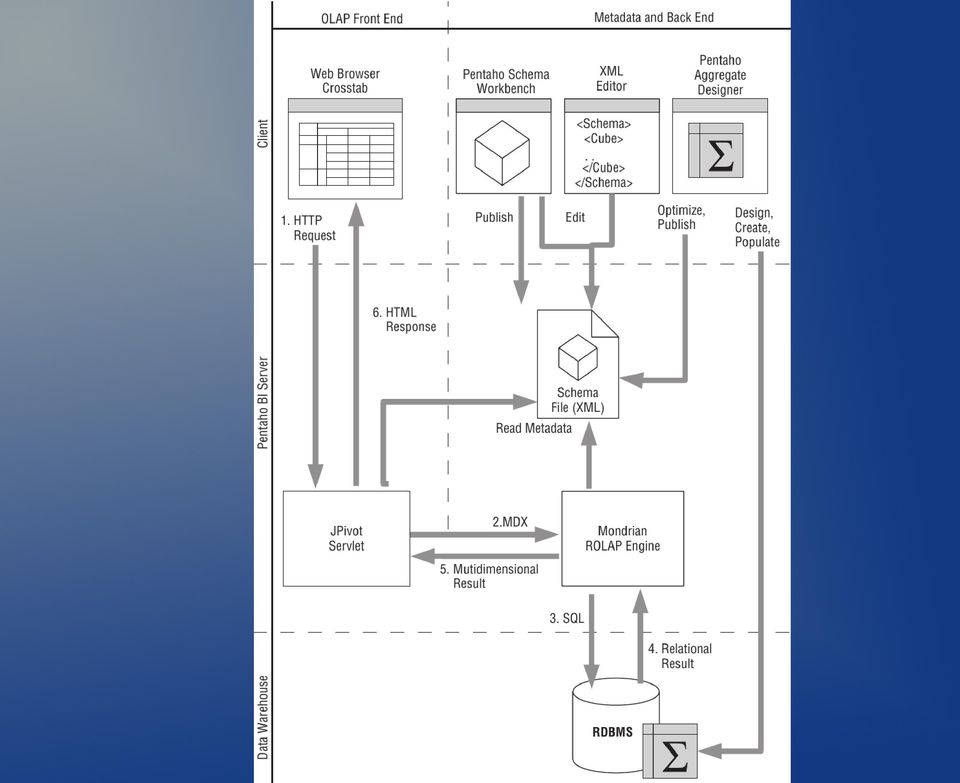
6 Schemas Mondrian Schemas are XML documents Describe multidimensional cubes Describe the mapping between multi-dimensional and relational model Is used to translate MDX to SQL

7 MDX MDX: Multi-Dimensional expressions A language designed for querying OLAP databases A de facto standard developed by Microsoft

8 Pentaho Schema Workbench


9 Pentaho Schema Workbench PSW is a graphical tool To create Mondrian schemas To publish schemas to the Pentaho Server


10 Connect to DB The first thing to do is to establish a connection to the database Options Connections...


11 JDBC Explorer Once the connection has been established you can explore the database File New JDBC Explorer

12 Create a new schema The schema editor can: Create a new schema File New Schema Save the schema on disk.xml Edit object attributes Switch to view the XML representation of the schema Only view. No editing

13 Main tasks Basic tasks for defining a schema are: 1. Create a schema 2. Create cubes 2.1. Choose a fact table 2.2. Add measures 3. Create dimensions 3.1. Edit the default hierarchy and choose a dimension table 3.2. Define hierarchy levels 4. Associate dimensions with cubes


14 1. Create a schema File New Schema

15 2. Create cubes 2.1!!!

16 2.1. Choose a fact table DB Schema Table name in the schema


17 2.2. Add measures

18 3. Create dimensions (I) Dimensions can be added to: A cube: "private dimensions" known only to the cube that contains them A schema: "shared dimensions" that can be associated to multiple cubes


19 3. Create dimensions (II) Fact table foreign key Date/time related dim. has TimeDimension type

20 3. Create dimensions (III) Usual dimensions have StandardDimension type 3.1!!!


21 3.1. Add/edit hierarchies A new hierarchy is created for each dimension New hierarchies can be added to dimensions Each hierarchy must have a table node and one or more levels

22 3.1. Dimension table Same settings for fact tables

23 3.2. Add hierarchy levels

24 4. Associate shared dimensions Shared dimensions can be associated to a cube adding a "Dimension usage" Shared dim.
25 Testing and deployment Once schemas have been defined they may be Tested using the MDX query tool (MDX) included in PSW Published to the Pentaho Server
26 MDX query tool (I) File New MDX Query If a schema editor is open MDX attempts to connect to the underlying DB for loading the schema definition

27 MDX query tool (II) A query can be entered in the upper pane The result is shown in the lower pane

28 Publishing the cube (I) File Publish... Server URL Password specified in publisher_config.xml User with privileges for publishing

29 Publishing the cube (II) If the connection succeeds a dialog appears Choose the location in the server's solution repository where to save the schema Specify the data source to use at the server side to execute the SQL queries (corresponding to the MDX ones)
30 JPivot
31 JPivot Once a cube has been published it can be used to build analysis applications Pentaho provides the JPivot front-end in the Pentaho User Console

32 Analysis View

33 Create a new analysis view Schema to use Cube to use defined into the schema
34 New analysis view JPivot toolbar

35 Drilling Drilling allows the user to navigate from one level of aggregation to another
36 Drilling flavors There are 4 different ways to drill, with different drill result Different drill ways can be selected in the toolbar Drill member Drill position Drill replace Drill through Apply to dimensions Apply to measures
37 Drill member & Drill position Drill member: the drilling on one instance of a member is also applied to all other instances of this member Drill position: the drilling occurs directly to the member instance and it is not applied to other instances of that member

38 Drill replace The drilled member is replaced with the drill result

39 Drill through It applies to measures It retrieves the detail rows of the rolled up measure aggregate value and shows them in a separate table

40 The OLAP Navigator (I) It is a GUI that allows to control the mapping between the cube and the pivot table Which dimension is mapped to which axis How multiple dimensions on one axis are ordered What slice of the cube is used in analysis

41 The OLAP Navigator (II) The navigator has three sections A Columns section A Rows section A Filtes section
 to Columns")
42 Controlling placement of dimensions on axes Clicking the little square before a dimension you can move the dimension from Rows (Columns) to Columns (Rows)
 of the data Clicking on the funnel icon you move a dimension in the Filter")
43 Slicing with the OLAP Navigator (I) A slicer corresponds to the MDX WHERE clause Used to show only a subset (slice) of the data Clicking on the funnel icon you move a dimension in the Filter section
44 Slicing with the OLAP Navigator (II)
45 Specifying member sets It is also possible to specify particular members on columns and rows axes

46 MDX query pane You can also view the MDX query that represent the current state of the analysis view Useful to learn MDX syntax

47 Export Print to PDF export in MS Excel format

48 Charts JPivot allows to display data in a chart The chart can be configured
49 Alternative to JPivot Pentaho has a modular structure It may be extended with new plugins SAIKU Provide a plugin for Pentaho offering lightweight OLAP features It also provides a RESTful server that can connect with any OLAP system
50 Saiku It allows to execute OLAP analysis on any cube already defined Based on the definition of what we want to see in the analysis By specifying which dimensions/measures we want on columns, rows, and filters Drag 'n' drop UI
51 Defining the analysis (I) Once a cube has been selected the available dimensions (with hierarchies) and measures are listed
52 Defining the analysis (II) Then, we can drag'n'drop dimensions and measures as we want in columns, rows, filters We are restricted only to not put measures on both columns and rows After each change the query is updated and executed automatically
53 Defining the analysis (III)
 and invisible (filter)")
54 Filtering Filters may be applied to visible (columns and rows) and invisible (filter) dimensions

55 Ordering Each dimension and/or measure can be used to order data But not all possible combinations are allowed We can't order both by a measure on columns and a dimension on row (or viceversa)

56 Popup menus Some options for fast filtering and adding/removing dimension levels are available by clicking on columns and rows header

57 Charts Data can be also reported in a chart

58 Statistics Saiku allows also to show some statistics about columns values
59 Other commands Other available commands include: Show MDX query Drill through on cell Export Drill-Through on cell to CSV Export XLS Export CSV
60 Saiku remarks Saiku is still in development Some features of JPivot are missing Some features have bugs or malfunctionings Charts Drill through
Analytics with Excel and ARQUERY for Oracle OLAP
 Analytics with Excel and ARQUERY for Oracle OLAP Data analytics gives you a powerful advantage in the business industry. Companies use expensive and complex Business Intelligence tools to analyze their
Reporting with Pentaho. Gabriele Pozzani
 Reporting with Pentaho Gabriele Pozzani A key feature Reporting is a key feature for a BI solution Used and delivered contents consist of Reporting 75-80% Analytical tools for OLAP 15-20% Data mining tools
BUILDING OLAP TOOLS OVER LARGE DATABASES
 BUILDING OLAP TOOLS OVER LARGE DATABASES Rui Oliveira, Jorge Bernardino ISEC Instituto Superior de Engenharia de Coimbra, Polytechnic Institute of Coimbra Quinta da Nora, Rua Pedro Nunes, P-3030-199 Coimbra,
ULTIMATE GUIDE. Jaspersoft OLAP 4.0
 ULTIMATE GUIDE Jaspersoft OLAP 4.0 Jaspersoft OLAP Ultimate Guide Copyright 2011 Jaspersoft Corporation. All rights reserved. Printed in the U.S.A. Jaspersoft, the Jaspersoft logo, JasperAnalysis, JasperServer,
CHAPTER 4: BUSINESS ANALYTICS
 Chapter 4: Business Analytics CHAPTER 4: BUSINESS ANALYTICS Objectives Introduction The objectives are: Describe Business Analytics Explain the terminology associated with Business Analytics Describe the
About PivotTable reports
 Page 1 of 8 Excel Home > PivotTable reports and PivotChart reports > Basics Overview of PivotTable and PivotChart reports Show All Use a PivotTable report to summarize, analyze, explore, and present summary
Monitoring Genebanks using Datamarts based in an Open Source Tool
 Monitoring Genebanks using Datamarts based in an Open Source Tool April 10 th, 2008 Edwin Rojas Research Informatics Unit (RIU) International Potato Center (CIP) GPG2 Workshop 2008 Datamarts Motivation
Implementing Data Models and Reports with Microsoft SQL Server 2012 MOC 10778
 Implementing Data Models and Reports with Microsoft SQL Server 2012 MOC 10778 Course Outline Module 1: Introduction to Business Intelligence and Data Modeling This module provides an introduction to Business
Implementing Data Models and Reports with Microsoft SQL Server
 Course 20466C: Implementing Data Models and Reports with Microsoft SQL Server Course Details Course Outline Module 1: Introduction to Business Intelligence and Data Modeling As a SQL Server database professional,
Cognos 8 Best Practices
 Northwestern University Business Intelligence Solutions Cognos 8 Best Practices Volume 2 Dimensional vs Relational Reporting Reporting Styles Relational Reports are composed primarily of list reports,
Toad for Data Analysts, Tips n Tricks
 Toad for Data Analysts, Tips n Tricks or Things Everyone Should Know about TDA Just what is Toad for Data Analysts? Toad is a brand at Quest. We have several tools that have been built explicitly for developers
CHAPTER 5: BUSINESS ANALYTICS
 Chapter 5: Business Analytics CHAPTER 5: BUSINESS ANALYTICS Objectives The objectives are: Describe Business Analytics. Explain the terminology associated with Business Analytics. Describe the data warehouse
Learning Objectives. Definition of OLAP Data cubes OLAP operations MDX OLAP servers
 OLAP Learning Objectives Definition of OLAP Data cubes OLAP operations MDX OLAP servers 2 What is OLAP? OLAP has two immediate consequences: online part requires the answers of queries to be fast, the
The Reporting Console
 Chapter 1 The Reporting Console This chapter provides a tour of the WebTrends Reporting Console and describes how you can use it to view WebTrends reports. It also provides information about how to customize
InfoView User s Guide. BusinessObjects Enterprise XI Release 2
 BusinessObjects Enterprise XI Release 2 InfoView User s Guide BusinessObjects Enterprise XI Release 2 Patents Trademarks Copyright Third-party contributors Business Objects owns the following U.S. patents,
OLAP Cube Manual deployment and Error resolution with limited licenses and Config keys
 Documented by - Sreenath Reddy G OLAP Cube Manual deployment and Error resolution with limited licenses and Config keys Functionality in Microsoft Dynamics AX can be turned on or off depending on license
SQL Server Administrator Introduction - 3 Days Objectives
 SQL Server Administrator Introduction - 3 Days INTRODUCTION TO MICROSOFT SQL SERVER Exploring the components of SQL Server Identifying SQL Server administration tasks INSTALLING SQL SERVER Identifying
Course 6234A: Implementing and Maintaining Microsoft SQL Server 2008 Analysis Services
 Course 6234A: Implementing and Maintaining Microsoft SQL Server 2008 Analysis Services Length: Delivery Method: 3 Days Instructor-led (classroom) About this Course Elements of this syllabus are subject
Stored Documents and the FileCabinet
 Stored Documents and the FileCabinet Introduction The stored document features have been greatly enhanced to allow easier storage and retrieval of a clinic s electronic documents. Individual or multiple
IBM DB2 XML support. How to Configure the IBM DB2 Support in oxygen
 Table of Contents IBM DB2 XML support About this Tutorial... 1 How to Configure the IBM DB2 Support in oxygen... 1 Database Explorer View... 3 Table Explorer View... 5 Editing XML Content of the XMLType
Creating Reports with Microsoft Dynamics AX SQL Reporting Services
 Creating Reports with Microsoft Dynamics AX SQL Reporting Services. Table of Contents Lab 1: Building a Report... 1 Lab Objective... 1 Pre-Lab Setup... 1 Exercise 1: Familiarize Yourself with the Setup...
ReportPortal Web Reporting for Microsoft SQL Server Analysis Services
 Zero-footprint OLAP OLAP Web Client Web Client Solution Solution for Microsoft for Microsoft SQL Server Analysis Services ReportPortal Web Reporting for Microsoft SQL Server Analysis Services See what
Creating Dashboards for Microsoft Project Server 2010
 Creating Dashboards for Microsoft Project Server 2010 Authors: Blaise Novakovic, Jean-Francois LeSaux, Steven Haden, Microsoft Consulting Services Information in the document, including URL and other Internet
Implementing Data Models and Reports with Microsoft SQL Server 20466C; 5 Days
 Lincoln Land Community College Capital City Training Center 130 West Mason Springfield, IL 62702 217-782-7436 www.llcc.edu/cctc Implementing Data Models and Reports with Microsoft SQL Server 20466C; 5
SAS BI Dashboard 4.3. User's Guide. SAS Documentation
 SAS BI Dashboard 4.3 User's Guide SAS Documentation The correct bibliographic citation for this manual is as follows: SAS Institute Inc. 2010. SAS BI Dashboard 4.3: User s Guide. Cary, NC: SAS Institute
Business Insight Report Authoring Getting Started Guide
 Business Insight Report Authoring Getting Started Guide Version: 6.6 Written by: Product Documentation, R&D Date: February 2011 ImageNow and CaptureNow are registered trademarks of Perceptive Software,
Jet Data Manager 2012 User Guide
 Jet Data Manager 2012 User Guide Welcome This documentation provides descriptions of the concepts and features of the Jet Data Manager and how to use with them. With the Jet Data Manager you can transform
Kyubit Business Intelligence OLAP analysis - User Manual
 Using OLAP analysis features of Kyubit Business Intelligence www.kyubit.com Kyubit Business Intelligence OLAP analysis - User Manual Using OLAP analysis features of Kyubit Business Intelligence 2016, All
BusinessObjects Enterprise InfoView User's Guide
 BusinessObjects Enterprise InfoView User's Guide BusinessObjects Enterprise XI 3.1 Copyright 2009 SAP BusinessObjects. All rights reserved. SAP BusinessObjects and its logos, BusinessObjects, Crystal Reports,
Data W a Ware r house house and and OLAP II Week 6 1
 Data Warehouse and OLAP II Week 6 1 Team Homework Assignment #8 Using a data warehousing tool and a data set, play four OLAP operations (Roll up (drill up), Drill down (roll down), Slice and dice, Pivot
2074 : Designing and Implementing OLAP Solutions Using Microsoft SQL Server 2000
 2074 : Designing and Implementing OLAP Solutions Using Microsoft SQL Server 2000 Introduction This course provides students with the knowledge and skills necessary to design, implement, and deploy OLAP
Microsoft 20466 - Implementing Data Models and Reports with Microsoft SQL Server
 1800 ULEARN (853 276) www.ddls.com.au Microsoft 20466 - Implementing Data Models and Reports with Microsoft SQL Server Length 5 days Price $4070.00 (inc GST) Version C Overview The focus of this five-day
Microsoft Excel 2010 Pivot Tables
 Microsoft Excel 2010 Pivot Tables Email: [email protected] Web Page: http://training.health.ufl.edu Microsoft Excel 2010: Pivot Tables 1.5 hours Topics include data groupings, pivot tables, pivot
Business Intelligence for SUPRA. WHITE PAPER Cincom In-depth Analysis and Review
 Business Intelligence for A Technical Overview WHITE PAPER Cincom In-depth Analysis and Review SIMPLIFICATION THROUGH INNOVATION Business Intelligence for A Technical Overview Table of Contents Complete
DATA WAREHOUSING - OLAP
 http://www.tutorialspoint.com/dwh/dwh_olap.htm DATA WAREHOUSING - OLAP Copyright tutorialspoint.com Online Analytical Processing Server OLAP is based on the multidimensional data model. It allows managers,
Creating a Patch Management Dashboard with IT Analytics Hands-On Lab
 Creating a Patch Management Dashboard with IT Analytics Hands-On Lab Description This lab provides a hands-on overview of the IT Analytics Solution. Students will learn how to browse cubes and configure
MS 50511A The Microsoft Business Intelligence 2010 Stack
 MS 50511A The Microsoft Business Intelligence 2010 Stack Description: This instructor-led course provides students with the knowledge and skills to develop Microsoft End-to-End business solutions using
Data Warehousing OLAP
 Data Warehousing OLAP References Wei Wang. A Brief MDX Tutorial Using Mondrian. School of Computer Science & Engineering, University of New South Wales. Toon Calders. Querying OLAP Cubes. Wolf-Tilo Balke,
SAP BusinessObjects Business Intelligence (BI) platform Document Version: 4.1, Support Package 3-2014-04-03. Report Conversion Tool Guide
 platform Document Version: 4.1, Support Package 3-2014-04-03. Report Conversion Tool Guide") SAP BusinessObjects Business Intelligence (BI) platform Document Version: 4.1, Support Package 3-2014-04-03 Table of Contents 1 Report Conversion Tool Overview.... 4 1.1 What is the Report Conversion Tool?...4
SAP BusinessObjects Business Intelligence (BI) platform Document Version: 4.1, Support Package 3-2014-04-03 Table of Contents 1 Report Conversion Tool Overview.... 4 1.1 What is the Report Conversion Tool?...4
Connecting Pentaho Suite applications with Microsoft SQL Server Analysis Services
 Connecting Pentaho Suite applications with Microsoft SQL @stratebi - April 2014 www.stratebi.com - www.todobi.com Index 1 SCOPE OF THIS DOCUMENT... 3 2 ENVIRONMENT... 3 2.1 Software Used... 3 2.2 Prerequisites...
MicroStrategy Desktop
 MicroStrategy Desktop Quick Start Guide MicroStrategy Desktop is designed to enable business professionals like you to explore data, simply and without needing direct support from IT. 1 Import data from
Spotfire v6 New Features. TIBCO Spotfire Delta Training Jumpstart
 Spotfire v6 New Features TIBCO Spotfire Delta Training Jumpstart Map charts New map chart Layers control Navigation control Interaction mode control Scale Web map Creating a map chart Layers are added
Information Design Tool User Guide SAP BusinessObjects Business Intelligence platform 4.0 Feature Pack 3
 Information Design Tool User Guide SAP BusinessObjects Business Intelligence platform 4.0 Feature Pack 3 Copyright 2012 SAP AG. All rights reserved.sap, R/3, SAP NetWeaver, Duet, PartnerEdge, ByDesign,
Modeling Guide for SAP Web IDE for SAP HANA
 PUBLIC SAP HANA Platform SPS 11 Document Version: 1.1 2016-03-15 Content 1 Introduction to Modeling in the SAP HANA Web IDE.... 4 1.1 Modeling in Web-based Environments....4 2.... 6 2.1 Attributes and
SAP BusinessObjects Design Studio Document Version: 1.2-2013-11-12. What's New Guide: SAP BusinessObjects Design Studio
 SAP BusinessObjects Design Studio Document Version: 1.2-2013-11-12 What's New Guide: SAP BusinessObjects Design Studio Table of Contents 1 About This Guide....3 2 About the Documentation Set....4 3 New
How To Create A Report In Excel
 Table of Contents Overview... 1 Smartlists with Export Solutions... 2 Smartlist Builder/Excel Reporter... 3 Analysis Cubes... 4 MS Query... 7 SQL Reporting Services... 10 MS Dynamics GP Report Templates...
Business Intelligence & Product Analytics
 2010 International Conference Business Intelligence & Product Analytics Rob McAveney www. 300 Brickstone Square Suite 904 Andover, MA 01810 [978] 691 8900 www. Copyright 2010 Aras All Rights Reserved.
Reporting Services. White Paper. Published: August 2007 Updated: July 2008
 Reporting Services White Paper Published: August 2007 Updated: July 2008 Summary: Microsoft SQL Server 2008 Reporting Services provides a complete server-based platform that is designed to support a wide
Web Intelligence User Guide
 Web Intelligence User Guide Office of Financial Management - Enterprise Reporting Services 4/11/2011 Table of Contents Chapter 1 - Overview... 1 Purpose... 1 Chapter 2 Logon Procedure... 3 Web Intelligence
Business Objects Version 5 : Introduction
 Business Objects Version 5 : Introduction Page 1 TABLE OF CONTENTS Introduction About Business Objects Changing Your Password Retrieving Pre-Defined Reports Formatting Your Report Using the Slice and Dice
COGNOS 8 Business Intelligence
 COGNOS 8 Business Intelligence QUERY STUDIO USER GUIDE Query Studio is the reporting tool for creating simple queries and reports in Cognos 8, the Web-based reporting solution. In Query Studio, you can
Anwendersoftware Anwendungssoftwares a. Data-Warehouse-, Data-Mining- and OLAP-Technologies. Online Analytic Processing
 Anwendungssoftwares a Data-Warehouse-, Data-Mining- and OLAP-Technologies Online Analytic Processing Online Analytic Processing OLAP Online Analytic Processing Technologies and tools that support (ad-hoc)
Create an Excel BI report and share on SharePoint 2013
 2013 Create an Excel BI report and share on SharePoint 2013 Hands-On Lab Lab Manual This document is provided as-is. Information and views expressed in this document, including URL and other Internet Web
NEW FEATURES ORACLE ESSBASE STUDIO
 ORACLE ESSBASE STUDIO RELEASE 11.1.1 NEW FEATURES CONTENTS IN BRIEF Introducing Essbase Studio... 2 From Integration Services to Essbase Studio... 2 Essbase Studio Features... 4 Installation and Configuration...
Release Document Version: 1.4-2013-05-30. User Guide: SAP BusinessObjects Analysis, edition for Microsoft Office
 Release Document Version: 1.4-2013-05-30 User Guide: SAP BusinessObjects Analysis, edition for Microsoft Office Table of Contents 1 About this guide....6 1.1 Who should read this guide?....6 1.2 User profiles....6
Release 2.1 of SAS Add-In for Microsoft Office Bringing Microsoft PowerPoint into the Mix ABSTRACT INTRODUCTION Data Access
 Release 2.1 of SAS Add-In for Microsoft Office Bringing Microsoft PowerPoint into the Mix Jennifer Clegg, SAS Institute Inc., Cary, NC Eric Hill, SAS Institute Inc., Cary, NC ABSTRACT Release 2.1 of SAS
How to Create Dashboards. Published 2014-08
 How to Create Dashboards Published 2014-08 Table of Content 1. Introduction... 3 2. What you need before you start... 3 3. Introduction... 3 3.1. Open dashboard Example 1... 3 3.2. Example 1... 4 3.2.1.
Implementing Data Models and Reports with Microsoft SQL Server
 CÔNG TY CỔ PHẦN TRƯỜNG CNTT TÂN ĐỨC TAN DUC INFORMATION TECHNOLOGY SCHOOL JSC LEARN MORE WITH LESS! Course 20466C: Implementing Data Models and Reports with Microsoft SQL Server Length: 5 Days Audience:
Turning your Warehouse Data into Business Intelligence: Reporting Trends and Visibility Michael Armanious; Vice President Sales and Marketing Datex,
 Turning your Warehouse Data into Business Intelligence: Reporting Trends and Visibility Michael Armanious; Vice President Sales and Marketing Datex, Inc. Overview Introduction What is Business Intelligence?
Excel 2007. OLAP@Work Excel 97 Add-In. Excel 2010 PowerPivot. Excel Add-In Pivot Table Services Office Web Components
 Excel Excel OLAP features and limitations Pivot tables, charts, named sets, cube formulas, online/offline cubes and so much more Best of combined PowerPivot with Analysis Services cubes Demo: Excel with
PROJECT ON MICROSOFT ACCESS (HOME TAB AND EXTERNAL DATA TAB) SUBMITTED BY: SUBMITTED TO: NAME: ROLL NO: REGN NO: BATCH:
 SUBMITTED BY: SUBMITTED TO: NAME: ROLL NO: REGN NO: BATCH:") PROJECT ON MICROSOFT ACCESS (HOME TAB AND EXTERNAL DATA TAB) SUBMITTED BY: SUBMITTED TO: NAME: ROLL NO: REGN NO: BATCH: INDEX Microsoft Access- An Overview 2 Datasheet view 4 Create a Table in Datasheet
PROJECT ON MICROSOFT ACCESS (HOME TAB AND EXTERNAL DATA TAB) SUBMITTED BY: SUBMITTED TO: NAME: ROLL NO: REGN NO: BATCH: INDEX Microsoft Access- An Overview 2 Datasheet view 4 Create a Table in Datasheet
Open Source Business Intelligence Intro
 Open Source Business Intelligence Intro Stefano Scamuzzo Senior Technical Manager Architecture & Consulting Research & Innovation Division Engineering Ingegneria Informatica The Open Source Question In
Excel 2013 What s New. Introduction. Modified Backstage View. Viewing the Backstage. Process Summary Introduction. Modified Backstage View
 Excel 03 What s New Introduction Microsoft Excel 03 has undergone some slight user interface (UI) enhancements while still keeping a similar look and feel to Microsoft Excel 00. In this self-help document,
Novell ZENworks Asset Management 7.5
 Novell ZENworks Asset Management 7.5 w w w. n o v e l l. c o m October 2006 USING THE WEB CONSOLE Table Of Contents Getting Started with ZENworks Asset Management Web Console... 1 How to Get Started...
SAP BusinessObjects Financial Consolidation Web User Guide
 SAP BusinessObjects Financial Consolidation Document Version: 10.0 Support Package 18 2016-02-19 SAP BusinessObjects Financial Consolidation Web User Guide Content 1 General user functions....12 1.1 To
Building reports using the Java Report Panel
 Building reports using the Java Report Panel BusinessObjects Enterprise XI 3.0 Copyright 2008 Business Objects. All rights reserved. Business Objects owns the following U.S. patents, which may cover products
COGNOS Query Studio Ad Hoc Reporting
 COGNOS Query Studio Ad Hoc Reporting Copyright 2008, the California Institute of Technology. All rights reserved. This documentation contains proprietary information of the California Institute of Technology
Business Benefits From Microsoft SQL Server Business Intelligence Solutions How Can Business Intelligence Help You? PTR Associates Limited
 Business Benefits From Microsoft SQL Server Business Intelligence Solutions How Can Business Intelligence Help You? www.ptr.co.uk Business Benefits From Microsoft SQL Server Business Intelligence (September
Oracle Fusion Middleware
 Oracle Fusion Middleware Data Modeling Guide for Oracle Business Intelligence Publisher 11g Release 1 (11.1.1) E22258-05 July 2014 Explains how to retrieve and structure data from a variety of sources
ReceivablesVision SM Getting Started Guide
 ReceivablesVision SM Getting Started Guide March 2013 Transaction Services ReceivablesVision Quick Start Guide Table of Contents Table of Contents Accessing ReceivablesVision SM...2 The Login Screen...
Performing On-Report Analysis with SAP BusinessObjects Web Intelligence
 Performing On-Report Analysis with SAP BusinessObjects Web Intelligence SAP BusinessObjects XI 3.1 Service Pack 3 Copyright 2010 SAP AG. All rights reserved.sap, R/3, SAP NetWeaver, Duet, PartnerEdge,
SQL Server 2012 Business Intelligence Boot Camp
 SQL Server 2012 Business Intelligence Boot Camp Length: 5 Days Technology: Microsoft SQL Server 2012 Delivery Method: Instructor-led (classroom) About this Course Data warehousing is a solution organizations
Using SQL Server Management Studio
 Using SQL Server Management Studio Microsoft SQL Server Management Studio 2005 is a graphical tool for database designer or programmer. With SQL Server Management Studio 2005 you can: Create databases
Top 10 Oracle SQL Developer Tips and Tricks
 Top 10 Oracle SQL Developer Tips and Tricks December 17, 2013 Marc Sewtz Senior Software Development Manager Oracle Application Express Oracle America Inc., New York, NY The following is intended to outline
SQL Server 2005 Reporting Services (SSRS)
") SQL Server 2005 Reporting Services (SSRS) Author: Alex Payne and Brian Welcker Published: May 2005 Summary: SQL Server 2005 Reporting Services is a key component of SQL Server 2005. Reporting Services
SQL Server 2005 Reporting Services (SSRS) Author: Alex Payne and Brian Welcker Published: May 2005 Summary: SQL Server 2005 Reporting Services is a key component of SQL Server 2005. Reporting Services
Welcome to the topic on Master Data and Documents.
 Welcome to the topic on Master Data and Documents. In this topic, we will look at master data in SAP Business One. After this session you will be able to view a customer record to explain the concept of
Oracle Business Intelligence Server Administration Guide. Version 10.1.3.2 December 2006
 Oracle Business Intelligence Server Administration Guide Version 10.1.3.2 December 2006 Part Number: B31770-01 Copyright 2006, Oracle. All rights reserved. The Programs (which include both the software
Accessing Your Database with JMP 10 JMP Discovery Conference 2012 Brian Corcoran SAS Institute
 Accessing Your Database with JMP 10 JMP Discovery Conference 2012 Brian Corcoran SAS Institute JMP provides a variety of mechanisms for interfacing to other products and getting data into JMP. The connection
BRIO QUERY FUNCTIONALITY IN COMPARISION TO CRYSTAL REPORTS
 BRIO QUERY FUNCTIONALITY IN COMPARISION TO CRYSTAL REPORTS Category Downstream Analysis Nested Queries Brio Functionality Ability to create data sets Ability to create tables and upload tables Available
IBM Information Server
 IBM Information Server Version 8 Release 1 IBM Information Server Administration Guide SC18-9929-01 IBM Information Server Version 8 Release 1 IBM Information Server Administration Guide SC18-9929-01
Oracle Business Intelligence Answers, Delivers, and Interactive Dashboards User Guide. Version 10.1.3.2 December 2006
 Oracle Business Intelligence Answers, Delivers, and Interactive Dashboards User Guide Version 10.1.3.2 December 2006 Part Number: B31767-01 Copyright 2006, Oracle. All rights reserved. The Programs (which
Version 8.4.1 User Guide
 IBM Cognos 8 Business Intelligence PowerPlay Studio Version 8.4.1 User Guide Product Information This document applies to IBM Cognos 8 Business Intelligence Version 8.4.1 and may also apply to subsequent
SMB Intelligence. Reporting
 SMB Intelligence Reporting Introduction Microsoft Excel is one of the most popular business tools for data analysis and light accounting functions. The SMB Intelligence Reporting powered by Solver is designed
Enterprise Reporting Solution. Argos Report Viewers Guide. Document Version 2.0
 Enterprise Reporting Solution Argos Report Viewers Guide Document Version 2.0 Last Updated 10.18.2010 Table of Contents Introduction... 5 Evisions Support Site... 5 Getting Started... 6 Starting Argos...
ORACLE OLAP. Oracle OLAP is embedded in the Oracle Database kernel and runs in the same database process
 ORACLE OLAP KEY FEATURES AND BENEFITS FAST ANSWERS TO TOUGH QUESTIONS EASILY KEY FEATURES & BENEFITS World class analytic engine Superior query performance Simple SQL access to advanced analytics Enhanced
Getting Started with Pentaho Data Integration
 Getting Started with Pentaho Data Integration This document supports Pentaho Business Analytics Suite 4.8 GA and Pentaho Data Integration 4.4 GA, documentation revision October 31, 2012. This document
Taleo Enterprise. Taleo Reporting Getting Started with Business Objects XI3.1 - User Guide
 Taleo Enterprise Taleo Reporting XI3.1 - User Guide Feature Pack 12A January 27, 2012 Confidential Information and Notices Confidential Information The recipient of this document (hereafter referred to
March 2015. Module 3 Processing MOVES Output
 March 2015 Module 3 Processing MOVES Output Module Overview Describe what is contained in the MOVES output tables Use the Post-Processing Menu and post-processing MySQL scripts View and manipulate MOVES
Creating Hybrid Relational-Multidimensional Data Models using OBIEE and Essbase by Mark Rittman and Venkatakrishnan J
 Creating Hybrid Relational-Multidimensional Data Models using OBIEE and Essbase by Mark Rittman and Venkatakrishnan J ODTUG Kaleidoscope Conference June 2009, Monterey, USA Oracle Business Intelligence
Student Guide. SAP BusinessObjects XI 3.0 Universe Design
 Student Guide SAP BusinessObjects XI 3.0 Universe Design 2 C O N T E N T S Lesson 1 Understanding BusinessObjects Universes Lesson introduction...1 BusinessObjects universe concepts...2 What is a universe?...2
Microsoft Excel: Pivot Tables
 Microsoft Excel: Pivot Tables Pivot Table Reports A PivotTable report is an interactive table that you can use to quickly summarize large amounts of data. You can rotate its rows and columns to see different
RIFIS Ad Hoc Reports
 RIFIS Ad Hoc Reports To retrieve the entire list of all Ad Hoc Reports, including the Base reports and any additional reports published to your Role, select Ad Hoc for the Type under Filter Report By and
Utilities. 2003... ComCash
 Utilities ComCash Utilities All rights reserved. No parts of this work may be reproduced in any form or by any means - graphic, electronic, or mechanical, including photocopying, recording, taping, or
Business Intelligence, Analytics & Reporting: Glossary of Terms
 Business Intelligence, Analytics & Reporting: Glossary of Terms A B C D E F G H I J K L M N O P Q R S T U V W X Y Z Ad-hoc analytics Ad-hoc analytics is the process by which a user can create a new report