Poverty, Inequality and Trends in the Labor Market. Hilary Hoynes, University of California Berkeley
|
|
|
- Julianna Parks
- 7 years ago
- Views:
Transcription
1 Poverty, Inequality and Trends in the Labor Market Hilary Hoynes, University of California Berkeley

2 Overview Since the 1980s we have seen little improvement in poverty despite steady economic growth At the same time, inequality is increasing, with more resources for skilled and high income groups Here I examine these trends and investigate the causes of poverty and inequality, paying particular attention to the labor market causes We conclude by discussing the efficacy of policies to address these concerns Hoynes, Page 2

3 Roadmap 1. Facts on poverty and inequality in the U.S. 2. Linking the trends in poverty and inequality to trends in the labor market 3. Identifying the driving forces of these trends in the labor market 4. Policy solutions Hoynes, Page 3

4 Roadmap 1. Facts on poverty and inequality in the U.S. 2. Linking the trends in poverty and inequality to trends in the labor market 3. Identifying the driving forces of these trends in the labor market 4. Policy solutions Hoynes, Page 4

5 Trends in Official Poverty 5
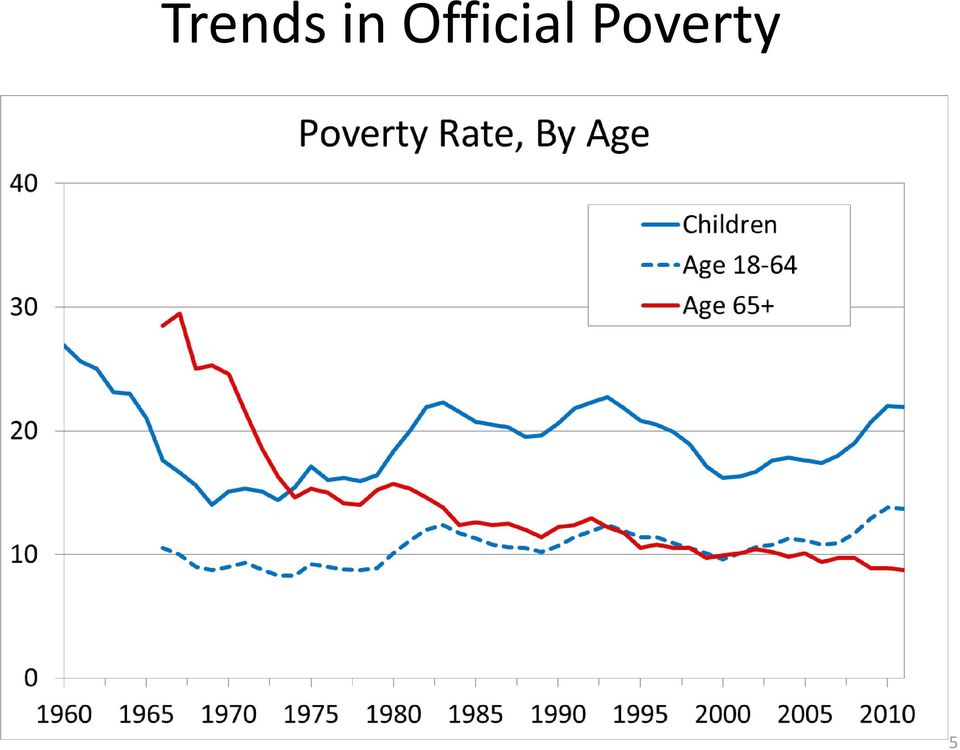
6 Limitations of official poverty measure Income measure is pre-tax family income; includes only cash income Does not include Food Stamps (SNAP) or Earned Income Tax Credit (the most important government benefits for low income families!) Not adjusted for work-related expenses Not adjusted for regional variation in costs of living (e.g., housing) Definition of poverty has not changed since measure developed in early 1960s Recent Supplemental Poverty Measure released by Census; addresses these concerns 6

7 New poverty measure shows more improvement, yet poverty remains high and in recent period only fell during strong labor market of late 1990s


8 State Child Poverty by State, SPM Annie E. Casey, Data Snapshot and Kids Count, Feb 2015

9 Trends in Inequality Piketty and Saez have developed a world database for measuring inequality Getting data to measure the level and trend in incomes at the very top of the distribution is hard. Standard survey data does not have enough information on these high income earners. Piketty and Saez came up with the novel idea of using data from income tax returns to estimate trends in top incomes. This is high quality data that is provided by most countries.


10

11 Inequality: The facts for the U.S. Source: Piketty and Saez (2003) updated to Series based on pre-tax cash income including realized capital gains and excluding government transfers.

12 Decline in top income shares between pre-wwi and post-ww2 The great compression period = growth of the middle class Source: Piketty and Saez (2003) updated to Series based on pre-tax cash income including realized capital gains and excluding government transfers.

13 Post-WW2 and through the 1970s, top income remained low Source: Piketty and Saez (2003) updated to Series based on pre-tax cash income including realized capital gains and excluding government transfers.

14 Beginning in late 1970s top income share trends steadily up Source: Piketty and Saez (2003) updated to Series based on pre-tax cash income including realized capital gains and excluding government transfers.


15 The period through the 1970s was similar in the U.S. compared to other countries suggesting that global factors were responsible The upward trend beginning in the late 1970s IS NOT experienced by all countries suggesting that global factors CAN NOT explain the trend

16 Greater progressive taxation (higher top MTR) is associated with LESS inequality

17 Comparisons across countries shows that: Back in the early 1960s the US was on the HIGH end of progressivity of the income tax (and the middle of the pack in inequality) Today we have the highest inequality and very low progressivity

18 Roadmap 1. Facts on poverty and inequality in the U.S. 2. Linking the trends in poverty and inequality to trends in the labor market 3. Identifying the driving forces of these trends in the labor market 4. Policy solutions Hoynes, Page 18

19 The big picture Since the mid 1970s, there has been little gain in wages for less skilled workers, especially for men Additionally, labor force participation rates are declining for prime age men, and more recently, prime age women The implication is stagnant family incomes for the bottom quintile of Americans The growth of real wages and the distribution among workers is a crucial factor for determining trends in poverty.

20 EPI, State of Working America.

21 EPI, State of Working America.
22 Declines in labor force participation Economic Report of the President, Prime age is

23
24 These changes in wage and income distribution contribute fundamentally to trends in poverty This factor would be putting upward pressure on poverty rates over time; thus the observed trends should be interpreted against this finding. But taking a step back, what do we know about why these labor market trends are occurring?
25 Roadmap 1. Facts on poverty and inequality in the U.S. 2. Linking the trends in poverty and inequality to trends in the labor market 3. Identifying the driving forces of these trends in the labor market 4. Policy solutions Hoynes, Page 25
26 Returns to Skill earnings gap between college and high school degrees Rising steadily; doubled between 1979 and 2012 This trend is also experienced by other countries Autor, The Hamilton Project.
27 Autor, Science.
28 Rising Skill Premium is explained by demand and supply factors DEMAND Over last 100 years innovation has led to reduction in demand for physical labor (technological change) In recent decades the process of machine substitution for routine human tasks has reduced demand for those doing routine tasks (where workers are substitutes) and increased the demand for those who excel in more abstract tasks (where workers are complements) SUPPLY Educational attainment increases slowed beginning in 1980s Overall if demand for skilled labor keeps increasing AND the supply of skilled labor does not keep up, then the wages of skilled labor increase.
29 Trends in education 1960s/1970s: supply of young college educated increased rapidly relative to high school educated Since then educational attainment slowed (though still increasing) especially for men. Research by Goldin and Katz (2008) and others shows that more than half of the increase in wage inequality is due to the rising premium to skill (and thus the slowdown in educational attainment)
30 Autor, Science.
31 Trends more compelling when you look at new labor market entrants Autor, The Polarization of Job Opportunities in the U.S. Labor Markets, The Hamilton Project.
32 In addition to trends in relative wages, non-college workers are experiencing absolute reductions in real wage levels What is leading to reductions in real wages for less skilled workers? Technological change (as above) Globalization: Chinese manufacturing gains led to reduction in manufacturing in the US and thus declines in wages in those industries Fall of unions Fall in real value of minimum wages
33 Autor, Science.
34 The result Employment growth is polarizing into relatively high-skill, high-wage jobs and lowskill, low-wage jobs [at the expense of middle skill jobs]
35 Empty middle Autor, The Polarization of Job Opportunities in the U.S. Labor Markets, The Hamilton Project.
36 Autor, The Polarization of Job Opportunities in the U.S. Labor Markets, The Hamilton Project.
37 Polarization Key forces 1. The slowing rate of four-year college degree attainment among young adults, particularly males 2. Changes in technology, international trade, and the international offshoring of jobs, which affect job opportunities and skill demands 3. Changes in U.S. labor market institutions affecting wage setting, including labor unions and minimum wage legislation
38 Roadmap 1. Facts on poverty and inequality in the U.S. 2. Linking the trends in poverty and inequality to trends in the labor market 3. Identifying the driving forces of these trends in the labor market 4. Policy solutions Hoynes, Page 38
39 Policy Solutions (Pre-Market) Minimum wages Promote unionization Promote skills: Pre-K, K-12 Increase college access Funded perhaps with higher MTR
40 The Earned Income Tax Credit: Effective policy given trends in the labor market The EITC is the main post-market policy that affects the twin concerns of low employment and stagnant income
, earnings (and")
41 Earned Income Tax Credit In-work, tax based assistance Refundable tax credit for low income families Credit varies by number of children (small credit for childless), earnings (and AGI)
42 The effect of the EITC on employment and income THE EITC requires earned income. Research shows that the EITC leads to robust and large increases in employment particularly for single women with children. Therefore, the EITC increases family after-tax income through two channels Credit effect: direct EITC payments Earnings effect: incentivized increase in earnings Potential to substantively reduce lower tail inequality
43 Source: Calculations based on Supplemental Poverty Measure, 2013 (Kathleen Short), U.S. Department of Census, Current Population Report P
44 Source: Calculations based on Supplemental Poverty Measure, 2013 (Kathleen Short), U.S. Department of Census, Current Population Report P
45 The Effect of the EITC on the Aggregate Number of Children Above a Multiple of the Poverty Threshold In recent work, I have found that the static estimates of EITC underestimate the anti-poverty effects by as much as 50%. The effects on earnings contribute importantly to the reductions in poverty. Source: Hoynes and Patel (2015)
46 The Great Recession as a test of the social safety net Poverty rates rose with unemployment Source: Bitler and Hoynes The More Things Change, the More They Stay the Same? The Safety Net and Poverty in the Great Recession, forthcoming, Journal of Labor Economics.

47 State Scatterplot of Change in UR against Change in Child Poverty, Great Recession Period but the social safety net provided important protection Source: Bitler, Hoynes and Kuka Child Poverty in the Great Recession.
48 Concluding comments Since the 1980s we have seen little improvement in poverty despite steady economic growth The main driver for these trends are declines in real wages for low skilled workers Against this backdrop, the social safety net makes important improvements in the resources for low to moderate income families The broader trends call for renewed attention for human capital investments, from pre-school through college Hoynes, Page 48
Striking it Richer: The Evolution of Top Incomes in the United States (Update using 2006 preliminary estimates)
") Striking it Richer: The Evolution of Top Incomes in the United States (Update using 2006 preliminary estimates) Emmanuel Saez March 15, 2008 The recent dramatic rise in income inequality in the United
Striking it Richer: The Evolution of Top Incomes in the United States (Update using 2006 preliminary estimates) Emmanuel Saez March 15, 2008 The recent dramatic rise in income inequality in the United
Striking it Richer: The Evolution of Top Incomes in the United States (Updated with 2015 preliminary estimates)
") Striking it Richer: The Evolution of Top Incomes in the United States (Updated with 2015 preliminary estimates) Emmanuel Saez, UC Berkeley June 30, 2016 What s new for recent years? 2013-2015: Robust income
Striking it Richer: The Evolution of Top Incomes in the United States (Updated with 2015 preliminary estimates) Emmanuel Saez, UC Berkeley June 30, 2016 What s new for recent years? 2013-2015: Robust income
Who Is Working For Minimum Wage In Ontario? By Sheila Block
 Who Is Working For Minimum Wage In Ontario? By Sheila Block October, 2013 The Wellesley Institute engages in research, policy and community mobilization to advance population health. Copies of this report
Proposal 11: Building on the Success of the Earned Income Tax Credit
 Proposal 11: Building on the Success of the Earned Income Tax Credit Hilary Hoynes University of California, Berkeley Introduction The Earned Income Tax Credit (EITC) provides a refundable tax credit to
State of Working Britain
 State of Working Britain Aim is to Gives an up to date assessment of the performance of UK labour market, to highlight recent important developments seeks to describe and understand the major long-term
Notes - Gruber, Public Finance Chapter 17 - Income distribution and Welfare programs Welfare policy in the United States Motivations - relative
 Notes - Gruber, Public Finance Chapter 17 - Income distribution and Welfare programs Welfare policy in the United States Motivations - relative income inequality, income distribution: The evolution of
Levy Economics Institute of Bard College. Policy Note A DECADE OF FLAT WAGES?
 Levy Economics Institute of Bard College Levy Economics Institute of Bard College Policy Note 14 / 4 A DECADE OF FLAT WAGES? FERNANDO RIOS-AVILA and JULIE L. HOTCHKISS Workers wages are the most important
The Economists Voice
 The Economists Voice Volume 2, Issue 4 2005 Article 3 Does College Still Pay? Lisa Barrow Cecilia Elena Rouse Summary Since the mid-1990s college tuition costs have risen quickly while the rate of increase
Analyst HEALTH AND HEALTH CARE IN SAN JOAQUIN COUNTY REGIONAL
 SPRING 2016 HEALTH AND HEALTH CARE IN SAN JOAQUIN COUNTY San Joaquin County Health Care s Rapid Growth Creates Critical Shortages in Key Occupations. Health care has been changing rapidly in the United
Young Black America Part Four: The Wrong Way to Close the Gender Wage Gap
 Issue Brief August 2015 Young Black America Part Four: The Wrong Way to Close the Gender Wage Gap By Cherrie Bucknor* Young blacks in America have had significant improvements in educational attainment
Education in Hampton Roads
 Section X Education in Hampton Roads Figure 10.1 Graduation Rates in Hampton Roads and Virginia... 97 Figure 10.2 Enrolled Students in Hampton Roads... 97 Figure 10.3 Percent of Population Attaining High
Executive summary. Global Wage Report 2014 / 15 Wages and income inequality
 Executive summary Global Wage Report 2014 / 15 Wages and income inequality Global Wage Report 2014/15 Wages and income inequality Executive summary INTERNATIONAL LABOUR OFFICE GENEVA Copyright International
BTC Reports NORTH CAROLINA S BROKEN ECONOMY: Hard Work Not Enough to Climb Out of Poverty
 BTC Reports BUDGET & TAX CENTER February 2014 ENJOY READING THESE REPORTS? Please consider making a donation to support the Budget & tax Center at NORTH CAROLINA S BROKEN ECONOMY: Hard Work Not Enough
The Great Depression is often cast as the
 A Great Recession Brief Income, Wealth, and Debt and the Great Recession The Russell Sage Foundation and The Stanford Center on Poverty and Inequality October 212 Timothy Smeeding, University of Wisconsin,
CONGRESS OF THE UNITED STATES CONGRESSIONAL BUDGET OFFICE CBO. The Distribution of Household Income and Federal Taxes, 2008 and 2009
 CONGRESS OF THE UNITED STATES CONGRESSIONAL BUDGET OFFICE Percent 70 The Distribution of Household Income and Federal Taxes, 2008 and 2009 60 50 Before-Tax Income Federal Taxes Top 1 Percent 40 30 20 81st
DATA AND CHART PACK February 2016
 DATA AND CHART PACK February 2016 Income Inequality Income includes the revenue streams from wages, salaries, interest on a savings account, dividends from shares of stock, rent, and profits from selling
Income and Wealth Inequality: Evidence and Policy Implications
 Income and Wealth Inequality: Evidence and Policy Implications Emmanuel Saez, UC Berkeley Neubauer Collegium Lecture University of Chicago October 2014 1 MEASURING INEQUALITY Inequality matters because
By eliminating jobs and/or reducing employment growth,
 Issue Brief M M A N H A T T A N I N S T I T U T E F O R P O L I C Y R E S E A R C H I No. 36 July 2015 Published by the Manhattan Institute and American Action Forum COUNTERPRODUCTIVE The Employment and
How To Calculate The Federal Eitc
 The Earned Income Tax Credit and the Distribution of Income Draft: Preliminary and Incomplete Hilary W. Hoynes University of California, Berkeley and NBER hoynes@berkeley.edu Ankur J. Patel U.S. Department
Do In-Work Tax C redits Serve as a Safety Net? Marianne Bitler Department of Economics, UC Irvine and NBER mbitler@uci.edu
 Do In-Work Tax C redits Serve as a Safety Net? Marianne Bitler Department of Economics, UC Irvine and NBER mbitler@uci.edu Hilary Hoynes Department of Economics, UC Davis and NBER hwhoynes@ucdavis.edu
The U.S. labor force the number of
 Employment outlook: 14 Labor force projections to 2014: retiring boomers The baby boomers exit from the prime-aged workforce and their movement into older age groups will lower the overall labor force
Key Facts About Poverty and Income in Texas
 Key Facts About Poverty and Income in Texas U.S. Census American Community Survey 2013 data CPPP.org Why care about poverty? Research shows living in poverty is connected to negative outcomes, both for
Striking it Richer: The Evolution of Top Incomes in the United States (Updated with 2009 and 2010 estimates)
") Striking it Richer: The Evolution of Top Incomes in the United States (Updated with 2009 and 2010 estimates) Emmanuel Saez March 2, 2012 What s new for recent years? Great Recession 2007-2009 During the
Striking it Richer: The Evolution of Top Incomes in the United States (Updated with 2009 and 2010 estimates) Emmanuel Saez March 2, 2012 What s new for recent years? Great Recession 2007-2009 During the
A Bottom-Up Tax Cut to Build Georgia s Middle Class The Case for a State Earned Income Tax Credit By Wesley Tharpe, Senior Policy Analyst
 A Bottom-Up Tax Cut to Build Georgia s Middle Class The Case for a State Earned Income Tax Credit By Wesley Tharpe, Senior Policy Analyst Building a better Georgia, with a strong economy and vibrant businesses,
Skills, Tasks and Technologies: Implications for Employment and Earnings
 CHAPTER12 Skills, Tasks and Technologies: Implications for Employment and Earnings Daron Acemoglu *, David Autor ** * MIT, NBER and CIFAR ** MIT, NBER and IZA Contents 1. Introduction 1044 2. An Overview
Éducation et changement dans les inégalités économiques
 Éducation et changement dans les inégalités économiques Conférence Statistiques sociales, pauvreté et exclusion sociale Thomas Lemieux University of British Columbia A few motivating facts Major rise in
Women, Wages and Work A report prepared by the UNC Charlotte Urban Institute for the Women s Summit April 11, 2011
 A report prepared by the UNC Charlotte Urban Institute for the Women s Summit April 11, 2011 A report prepared for the Women s Summit by the UNC Charlotte Urban Institute 1 Table of Contents Table of Contents...
Left Behind: DC s Economic Recovery Is Not Reaching All Residents By Ed Lazere and Marco Guzman 1
 An Affiliate of the Center on Budget and Policy Priorities 820 First Street NE, Suite 460 Washington, DC 20002 (202) 408-1080 Fax (202) 408-8173 www.dcfpi.org Left Behind: DC s Economic Recovery Is Not
Over the past three decades, the share of middle-skill jobs in the
 The Vanishing Middle: Job Polarization and Workers Response to the Decline in Middle-Skill Jobs By Didem Tüzemen and Jonathan Willis Over the past three decades, the share of middle-skill jobs in the United
Top Incomes throughout the Great Recession
 Top Incomes throughout the Great Recession Emmanuel Saez UC Berkeley Rodolfo Debenedetti Lecture December 2012 1 INTRODUCTION Free market economies generate substantial inequality Main criticism of capitalism
Iowa s Earned Income Tax Credit Tax Credits Program Evaluation Study
 Iowa s Earned Income Tax Credit Tax Credits Program Evaluation Study December 2011 Revised February 2012 By Zhong Jin Bob Rogers Tax Research and Program Analysis Section Iowa Department of Revenue Preface
Women s Participation in Education and the Workforce. Council of Economic Advisers
 Women s Participation in Education and the Workforce Council of Economic Advisers Updated October 14, 214 Executive Summary Over the past forty years, women have made substantial gains in the workforce
income inequality The takeoff in income inequality over the By Jeffrey Thompson and Timothy Smeeding January 2014
 national report card 30 income inequality income inequality January 2014 The Stanford Center on Poverty and Inequality By Jeffrey Thompson and Timothy Smeeding Key findings The Great Recession had a mixed
Pre-Test Chapter 16 ed17
 Pre-Test Chapter 16 ed17 Multiple Choice Questions 1. Suppose total output (real GDP) is $4000 and labor productivity is 8. We can conclude that: A. real GDP per capita must be $500. B. the price-level
CH 10 - REVIEW QUESTIONS
 CH 10 - REVIEW QUESTIONS 1. The short-run aggregate supply curve is horizontal at: A) a level of output determined by aggregate demand. B) the natural level of output. C) the level of output at which the
Regression Analysis of the Relationship between Income and Work Hours
 Regression Analysis of the Relationship between Income and Work Hours Sina Mehdikarimi Samuel Norris Charles Stalzer Georgia Institute of Technology Econometric Analysis (ECON 3161) Dr. Shatakshee Dhongde
September 14, 2011. Several facts stand out from the new Census data:
 820 First Street NE, Suite 510 Washington, DC 20002 Tel: 202-408-1080 Fax: 202-408-1056 center@cbpp.org www.cbpp.org September 14, 2011 POVERTY RATE SECOND-HIGHEST IN 45 YEARS; RECORD NUMBERS LACKED HEALTH
Gloomy Days, But a Ray of Hope, for Oregon Workers
 Executive Summary September 3, 2010 Gloomy Days, But a Ray of Hope, for Oregon Workers Labor Day is an appropriate moment to reflect on the state of Oregon workers. This year s holiday takes place as the
ANTHONY P. CARNEVALE TAMARA JAYASUNDERA BAN CHEAH THE COLLEGE ADVANTAGE: WEATHERING THE ECONOMIC STORM EXECUTIVE SUMMARY
 ANTHONY P. CARNEVALE TAMARA JAYASUNDERA BAN CHEAH THE COLLEGE ADVANTAGE: WEATHERING THE ECONOMIC STORM EXECUTIVE SUMMARY CII THE COLLEGE ADVANTAGE: WEATHERING THE ECONOMIC STORM EXECUTIVE SUMMARY W hen
World of Labor KEY FINDINGS. Harry J. Holzer McCourt School of Public Policy, Georgetown University, USA, and IZA, Germany. Cons.
 Harry J. Holzer McCourt School of Public Policy, Georgetown University, USA, and IZA, Germany Should the earned income tax credit rise for childless adults? The earned income tax credit raises income and
CENTER FOR LABOR MARKET STUDIES
 The Complete Breakdown in the High Schoolto Work Transition of Young, Non College Enrolled High School Graduates in the U.S.; The Need for an Immediate National Policy Response Prepared by: Andrew Sum
Making Jobs Good. John Schmitt and Janelle Jones. April 2013
 Making Jobs Good John Schmitt and Janelle Jones April 2013 Center for Economic and Policy Research 1611 Connecticut Avenue, NW, Suite 400 Washington, D.C. 20009 202-293-5380 www.cepr.net CEPR Making Jobs
Country Report for the United States
 GROWING INEQUALITIES AND THEIR IMPACTS IN THE UNITED STATES Lane Kenworthy Timothy Smeeding Country Report for the United States January 2013 Table of Contents Executive Summary 1 1. Introduction... 3
Access and Barriers to Post-Secondary Education Under Michigan's Welfare to Work Policies
 Access and Barriers to Post-Secondary Education Under Michigan's Welfare to Work Policies Policy Background and Recipients' Experiences Coalition for Independence Through Education (CFITE) February 2002
Florida s Families and Children Below the Federal Poverty Level
 Florida s Families and Children Below the Federal Poverty Level Florida Senate Committee on Children, Families, and Elder Affairs Presented by: February 17, 2016 The Florida Legislature Office of Economic
West Virginia Children and Families Funding Study
 West Virginia Children and Families Funding Study Update and Report on Nine Year Trends in Public Expenditures FY 1999 through FY 2007 June, 2009 Supported By: Division of Criminal Justice Services / Department
820 First Street NE, Suite 510 Washington, DC 20002. Tel: 202-408-1080 Fax: 202-408-1056. center@cbpp.org www.cbpp.org.
 820 First Street NE, Suite 510 Washington, DC 20002 Tel: 202-408-1080 Fax: 202-408-1056 center@cbpp.org www.cbpp.org January 5, 2011 DESPITE DEEP RECESSION AND HIGH UNEMPLOYMENT, GOVERNMENT EFFORTS INCLUDING
Income Tax Liabilities Statistics 2012-13 to 2014-15
 Coverage: United Kingdom Theme: The Economy Released: 13 February 2015 Next Release: May 2015 Frequency of release: Twice yearly (Jan/Feb and Apr/May) Income Tax Liabilities Statistics 2012-13 to 2014-15
Health Insurance Data Brief # 4
 cepr Center for Economic and Policy Research Health Insurance Data Brief # 4 Access to Employer-Provided Health Insurance as a Dependent on a Family Member s Plan By Heather Boushey and Joseph Wright 1
CREATING AN INNOVATION AGENDA TO GENERATE SUSTAINABLE GROWTH, ENERGY EFFICIENCY AND JOBS IN EUROPE
 CREATING AN INNOVATION AGENDA TO GENERATE SUSTAINABLE GROWTH, ENERGY EFFICIENCY AND JOBS IN EUROPE BERT COLIJN AND BART VAN ARK NEUJOBS DELIVERABLE NO. 3.9 A discussion brief focusing on: Abstract The
Quarterly Economics Briefing
 Quarterly Economics Briefing March June 2015 2016 Review of Current Conditions: The Economic Outlook and Its Impact on Workers Compensation The exhibits below are updated to reflect the current economic
Changing Policy. Improving Lives.
 Changing Policy. Improving Lives. Louisiana s Earned Income Tax Credit: A Smart Investment in Working Families and Children By Steve Spires With poverty on the rise in Louisiana, especially among children,
The Recession of 2007 2009
 The Recession of 2007 2009 February 2012 A general slowdown in economic activity, a downturn in the business cycle, a reduction in the amount of goods and services produced and sold these are all characteristics
An Equity Profile of the Kansas City Region. Summary. Overview. The Equity Indicators Framework. central to the region s economic success now and
 An Equity Profile of the Kansas City Region PolicyLink and PERE An Equity Profile of the Kansas City Region Summary Overview Across the country, regional planning organizations, community organizations
Suggested Citation: Institute for Research on Higher Education. (2016). College Affordability Diagnosis: Georgia. Philadelphia, PA: Institute for
. College Affordability Diagnosis: Georgia. Philadelphia, PA: Institute for") GEORGIA Suggested Citation: Institute for Research on Higher Education. (2016). College Affordability Diagnosis: Georgia. Philadelphia, PA: Institute for Research on Higher Education, Graduate School of
GEORGIA Suggested Citation: Institute for Research on Higher Education. (2016). College Affordability Diagnosis: Georgia. Philadelphia, PA: Institute for Research on Higher Education, Graduate School of
Gini in a Bottle: The Mathematics of Income Inequality
 Gini in a Bottle: The Mathematics of Income Inequality Rich Beveridge Clatsop Community College rbeveridge@clatsopcc.edu https://www.clatsopcc.edu/rich-beveridges-homepage Statistics and Social Justice
Striking it Richer: The Evolution of Top Incomes in the United States (Updated with 2012 preliminary estimates)
") Striking it Richer: The Evolution of Top Incomes in the United States (Updated with 2012 preliminary estimates) Emmanuel Saez, UC Berkeley September 3, 2013 What s new for recent years? 2009-2012: Uneven
Striking it Richer: The Evolution of Top Incomes in the United States (Updated with 2012 preliminary estimates) Emmanuel Saez, UC Berkeley September 3, 2013 What s new for recent years? 2009-2012: Uneven
Finance and Economics Discussion Series Divisions of Research & Statistics and Monetary Affairs Federal Reserve Board, Washington, D.C.
 Finance and Economics Discussion Series Divisions of Research & Statistics and Monetary Affairs Federal Reserve Board, Washington, D.C. Income and Earnings Mobility in U.S. Tax Data Jeff Larrimore, Jacob
Brief 1 The State of North Carolina: Jobs, Poverty and Family. Jeannine Sato, Center for Child and Family Policy
 Brief 1 The State of North Carolina: Jobs, Poverty and Family Jeannine Sato, Center for Child and Family Policy The connection among jobs, poverty and family well-being is well established. Research shows
Family structure, childbearing, and parental employment: Implications for the level and trend in poverty
 Family structure, childbearing, and parental employment: Implications for the level and trend in poverty Maria Cancian and Deborah Reed Maria Cancian is Professor of Public Affairs and Social Work at the
It is important to understand child poverty as multidimensional. Income poverty in South Africa. Annie Leatt (Children s Institute)
") Income poverty in South Africa Annie Leatt (Children s Institute) It is important to understand child poverty as multidimensional and more than just a lack of income. Nevertheless, this essay specifically
Income poverty in South Africa Annie Leatt (Children s Institute) It is important to understand child poverty as multidimensional and more than just a lack of income. Nevertheless, this essay specifically
RESEARCH. Poor Prescriptions. Poverty and Access to Community Health Services. Richard Layte, Anne Nolan and Brian Nolan.
 RESEARCH Poor Prescriptions Poverty and Access to Community Health Services Richard Layte, Anne Nolan and Brian Nolan Executive Summary Poor Prescriptions Poor Prescriptions Poverty and Access to Community
Suggested Citation: Institute for Research on Higher Education. (2016). College Affordability Diagnosis: Tennessee. Philadelphia, PA: Institute for
. College Affordability Diagnosis: Tennessee. Philadelphia, PA: Institute for") TENNESSEE Suggested Citation: Institute for Research on Higher Education. (2016). College Affordability Diagnosis: Tennessee. Philadelphia, PA: Institute for Research on Higher Education, Graduate School
TENNESSEE Suggested Citation: Institute for Research on Higher Education. (2016). College Affordability Diagnosis: Tennessee. Philadelphia, PA: Institute for Research on Higher Education, Graduate School
Catching Up to Reality: Building the Case for a New Social Model
 Catching Up to Reality: Building the Case for a New Social Model by Jane Jenson Executive Summary January 2004 Research Report F 35 CPRN Social Architecture Papers, is available at http://www.cprn.org
OECD SOCIAL COHESION POLICY REVIEWS
 OECD SOCIAL COHESION POLICY REVIEWS CONCEPT NOTE Social Cohesion Policy Reviews are a new OECD tool to: measure the state of social cohesion in a society and monitor progress over time; assess policies
4. Answer c. The index of nominal wages for 1996 is the nominal wage in 1996 expressed as a percentage of the nominal wage in the base year.
 Answers To Chapter 2 Review Questions 1. Answer a. To be classified as in the labor force, an individual must be employed, actively seeking work, or waiting to be recalled from a layoff. However, those
Forty years ago when the discovery of North Slope
 The Changing Economic Status of Alaska Natives, -2007 By Stephanie Martin and Alexandra Hill Note No. 5 July 2009 Forty years ago when the discovery of North Slope Figure 1. Economic Indicators, Alaska
STAFF REPORT The American Recovery and Reinvestment Act: Helping Middle-Class Families
 STAFF REPORT The American Recovery and Reinvestment Act: Helping Middle-Class Families Introduction One of the central goals of the Middle Class Taskforce is to identify public policies that will help
The State of Working America 12th Edition
 The State of Working America 12th Edition LAWRENCE MISHEL JOSH BIVENS ELISE GOULD HEIDI SHIERHOLZ Wages EPI DIGITAL EDITION This chapter is from The State of Working America, 12th Edition, an Economic
APPENDIX A The PSID Sample and Family Income
 1 APPENDIX A The PSID Sample and Family Income The sample for this analysis is 2,367 individuals who were between the ages of 0 and 18 in 1968 and have been tracked into adulthood through the Panel Study
Long Island is rapidly losing its lead in private health care coverage. That distinctive mark of middle class success - private
 RESEARCH REPORT Regional Labor Review Fall 1998 Long Island s Ailing Health Care Benefits by Niev Duffy Long Island is rapidly losing its lead in private health care coverage. That distinctive mark of
14 Million Millennials Benefit From Pro-Work Tax Credits But 6 Million Will Lose Out if Congress Fails to Save Key Provisions
 820 First Street NE, Suite 510 Washington, DC 20002 Tel: 202-408-1080 Fax: 202-408-1056 center@cbpp.org www.cbpp.org June 15, 2015 14 Million Millennials Benefit From Pro-Work Tax Credits But 6 Million
Amendment 66 will improve Colorado s income tax
 Amendment 66: Economic analysis Amendment 66 will improve Colorado s income tax Amendment 66 will restore Colorado s ability to raise enough revenue to meet our schools growing needs and make the income
The primary purpose of a tax system is to support public goods and services. State and local taxes
 Issue Brief UPDATED APRIL 2015 BY WILLIAM CHEN Who Pays Taxes in California? The primary purpose of a tax system is to support public goods and services. State and local taxes are the way that Californians
Women in the Workforce
 Women in the Workforce Subject Definitions Employed Employed includes all civilians 16 years old and over who were either (1) at work during the reference week; or (2) those who did not work during the
GUIDING PRINCIPLES WHAT IS WORKFORCE DEVELOPMENT?
 W O RKFORCE DEVELOPMEN T Modified with permission from Learning to Lead Second Edition GUIDING PRINCIPLES Workforce development requires the coordinated efforts of many different organizations. Current
Jobs and Equality in Germany: Which Way Forward?
 Jobs and Equality in Germany: Which Way Forward? Lane Kenworthy Department of Sociology Emory University Atlanta, GA 30322 USA Tel: 404-727-7538 Fax: 404-727-7532 E-mail: lkenwor@emory.edu Homepage: www.emory.edu/soc/lkenworthy
FRBSF ECONOMIC LETTER
 FRBSF ECONOMIC LETTER 2015-02 January 12, 2015 Higher Education, Wages, and Polarization BY ROB VALLETTA The earnings gap between people with a college degree and those with no education beyond high school
Workforce Training Results Report December 2008
 Report December 2008 Community and Technical Colleges (CTC) Job Preparatory Training Washington s 34 community and technical colleges offer job preparatory training that provides students with skills required
Exam 1 Review. 3. A severe recession is called a(n): A) depression. B) deflation. C) exogenous event. D) market-clearing assumption.
: A) depression. B) deflation. C) exogenous event. D) market-clearing assumption.") Exam 1 Review 1. Macroeconomics does not try to answer the question of: A) why do some countries experience rapid growth. B) what is the rate of return on education. C) why do some countries have high
Exam 1 Review 1. Macroeconomics does not try to answer the question of: A) why do some countries experience rapid growth. B) what is the rate of return on education. C) why do some countries have high
The Wealth of Households: An Analysis of the 2013 Survey of Consumer Finances
 November 214 The Wealth of Households: An Analysis of the 213 Survey of Consumer Finances By David Rosnick and Dean Baker* Center for Economic and Policy Research 1611 Connecticut Ave. NW Suite 4 Washington,
Health Insurance Soars, But America s Next Generation Still Lives in Families Struggling to Make Ends Meet
 An In-Depth Look at 2014 Census Data and Policy Solutions to Address Poverty Health Insurance Soars, But America s Next Generation Still Lives in Families Struggling to Make Ends Meet Summary of Findings
How Can Employment-Based Benefits Help the Nursing Shortage?
 How Can Employment-Based Benefits Help the Nursing Shortage? Joanne Spetz, Ph.D., Center for the Health Professions and Department of Community Health Systems University of California, San Francisco Sara
Top MTR. Threshold/Averag e Income. US Top Marginal Tax Rate and Top Bracket Threshold. Top MTR (Federal Individual Income Tax)
") Source: IRS, Statistics of Income Division, Historical Table 23 Top Marginal Tax Rate and Top Bracket Threshold Top MTR (Federal Individual Income Tax) 100% 90% 80% 70% 60% 50% 40% 30% 20% 10% Top MTR
Source: IRS, Statistics of Income Division, Historical Table 23 Top Marginal Tax Rate and Top Bracket Threshold Top MTR (Federal Individual Income Tax) 100% 90% 80% 70% 60% 50% 40% 30% 20% 10% Top MTR
Living Standard Trends in Australia: Report for Anglicare Australia. BEN PHILLIPS NATSEM UNIVERSITY OF CANBERRA, September 2015
 Living Standard Trends in Australia: Report for Anglicare Australia BEN PHILLIPS NATSEM UNIVERSITY OF CANBERRA, September 2015 2 Contents 1 Executive Sumary 3 2 Introduction 5 3 Methodology 6 4 Results
Economic inequality and educational attainment across a generation
 Economic inequality and educational attainment across a generation Mary Campbell, Robert Haveman, Gary Sandefur, and Barbara Wolfe Mary Campbell is an assistant professor of sociology at the University
The Hidden Public Costs of Low-Wage Jobs in California
 The Hidden Public Costs of Low-Wage Jobs in California Dr. Carol Zabin, Dr. Arindrajit Dube, and Ken Jacobs Center for Labor Research and Education, UC Berkeley Written for the National Economic Development
THE RECENT SLOWDOWN IN THE WAR ON POVERTY 50 YEARS LATER: A PROGRESS REPORT
 THE RECENT SLOWDOWN IN THE WAR ON POVERTY 50 YEARS LATER: A PROGRESS REPORT The Council of Economic Advisers January 2014 Executive Summary Unfortunately, many Americans live on the outskirts of hope some
Income inequality: Trends and Measures
 Key Points Income inequality: Trends and Measures UK income inequality increased by 32% between 1960 and 2005. During the same period, it increased by 23% in the USA, and in Sweden decreased by 12%. In
Wealth and Demographics: Demographics by Wealth and Wealth by Demographics using the Survey of Consumer Finances. *** DRAFT March 11, 2013 ***
 Wealth and Demographics: Demographics by Wealth and Wealth by Demographics using the Survey of Consumer Finances *** DRAFT March 11, 2013 *** Jeff Thompson* Economist Microeconomic Surveys Federal Reserve
Research Report May 2016. Which Countries in Europe Have the Best Gender Equality in the Workplace?
 Research Report May 2016 Which Countries in Europe Have the Best Gender Equality in the Workplace? Foreword Despite improvements in gender equality in recent decades, much remains to be done. Around the
Income Inequality and the Great Recession
 Income Inequality and the Great Recession September 2010 Report by the U.S. Congress Joint Economic Committee Representative Carolyn B. Maloney, Chair Senator Charles E. Schumer, Vice Chairman EXECUTIVE
Income Inequality in Korea, 1933-2010: Evidence from Income Tax Statistics
 Income Inequality in Korea, 1933-2010: Evidence from Income Tax Statistics Nak Nyeon Kim and Jongil Kim Abstract This paper constructs long-term series of top income shares and top wage income shares using
Strategies to Support Work and Reduce Poverty Eileen Trzcinski
 Strategies to Support Work and Reduce Poverty Eileen Trzcinski Overview of Low Income Working Families in Michigan 1998, the Michigan Budget and Tax Policy Project, an initiative of the Michigan League
Labor Market and Emigration from Mexico during the world economic recession Carla Pederzini April, 2011. Paper prepared for the Conference:
 Labor Market and Emigration from Mexico during the world economic recession Carla Pederzini April, 2011 Paper prepared for the Conference: Migration and Development: Comparing Mexico-US and Turkey-Europe
What It Will Take for Colorado to Compete with the Best Education Systems in the World
 What It Will Take for Colorado to Compete with the Best Education Systems in the World A Presentation to the Joint Colorado House and Senate Education Committees Marc Tucker National Center on Education
The Earned Income Tax Credit in Rhode Island
 Improve Rhode Island s Earned Income Tax Credit To Help Hard-working Rhode Islanders March 2014 The Earned Income Tax Credit () is widely recognized as one of the most effective policies at keeping low-income
Figure 1: Gini coefficient
 0.50 Figure 1: Gini coefficient Gini coefficient 0.45 0.40 0.35 0.30 1940 1950 1960 1970 1980 1990 2000 Source: Kopczuk, Saez, Song QJE'10: Wage earnings inequality Year All Workers Men Women Top 10% Pre-
America s Debt Problem: How Private Debt Is Holding Back Growth and Hurting the Middle Class
 America s Debt Problem: How Private Debt Is Holding Back Growth and Hurting the Middle Class Joshua Freedman and Sherle R. Schwenninger Economic Growth Program June 2014 Contents Part I: A Debt-Dependent
Uncovering the American Dream: Inequality and Mobility in Social Security Earnings Data since 1937
 Uncovering the American Dream: Inequality and Mobility in Social Security Earnings Data since 1937 Wojciech Kopczuk, Columbia and NBER Emmanuel Saez, UC Berkeley and NBER Jae Song, SSA 1,2 September 15,