Top MTR. Threshold/Averag e Income. US Top Marginal Tax Rate and Top Bracket Threshold. Top MTR (Federal Individual Income Tax)
|
|
|
- Della McDonald
- 7 years ago
- Views:
Transcription

1 Source: IRS, Statistics of Income Division, Historical Table 23

2 Top Marginal Tax Rate and Top Bracket Threshold Top MTR (Federal Individual Income Tax) 100% 90% 80% 70% 60% 50% 40% 30% 20% 10% Top MTR Threshold/Averag e Income 0% Top Bracket Threshold/Average Income 1 Source: statistics computed by the author

3 100% Top MTR ordinary income vs. capital gains 100% Top MTR (Federal Individual Income Tax) 90% 80% 70% 60% 50% 40% 30% 20% 10% Top MTR 0% Top MTR (capital gains) 90% 80% 70% 60% 50% 40% 30% 20% 10% 0% Source: statistics computed by the author
 90% 80% 70% 60% 50%")
4 Source: Saez et al. (2010) Table A1. Top Federal Marginal Tax Rates Ordinary Income Earned Income Capital Gains Corporate Income Year (1) (2) (3) (4) Notes: MTRs apply to top incomes. In some instances, lower income taxpayers may face higher MTRs because of income caps on payroll taxes or the so-called 33 percent "bubble" bracket following TRA 86. From 1952 to 1962, a 87% maximum average tax rate provision made the top marginal tax rate 87% instead of 91% for many very top income earners. From 1968 to 1970, rates include surtaxes. For earned income, MTRs include the Health Insurance portion of the payroll tax beginning with year Rates exclude the effect of phaseouts, which effectively raise top MTRs for many high-income filers. MTRs on realized capital gains are adjusted to reflect that, for some years, a fraction of realized gains were excluded from taxation. Since 2003, dividends are also tax favored with a maximum tax rate of 15%.

5 Top 0.01% Income Share and MTR (Piketty-Saez and Landais) 100% 5.0% 90% Top 0.01% MTR 4.5% 80% 70% 60% 50% 40% 30% 20% 10% 0% Top.01% MTR (Federal Income Tax) Top 0.01% Share 4.0% 3.5% 3.0% 2.5% 2.0% 1.5% 1.0% 0.5% Top 0.01% Income Share 0.0%

6 Top 0.01% Income Share and MTR (Piketty-Saez and Landais) 100% 5.0% 90% Top 0.01% MTR 4.5% Top.01% MTR (Federal Income Tax) 80% 70% 60% 50% 40% 30% 20% 10% Top 0.01% Share 0% % 3.5% 3.0% 2.5% 2.0% 1.5% 1.0% 0.5% Top 0.01% Income Share 0.0% log(share)=a (0.077)*log(1-MTR)+e log(share)=a+b*t (0.071)*log(1-MTR)+e
=a+0.617 (0.")
7 A. Top 1% Income Share and Marginal Tax Rate 60% 18% 50% 16% 14% Top 1% Marginal Tax Rate 40% 30% 20% 10% Top 1% Marginal Tax Rate Top 1% Income Share 0% % 10% 8% 6% 4% 2% Top 1% Income Share 0% Source: satistics computed by the author B. Next 9% Income Share and Marginal Tax Rate

8 B. Next 9% Income Share and Marginal Tax Rate 60% 30% 50% 25% Next 9% Marginal Tax Rate 40% 30% 20% 10% Next 9% Marginal Tax Rate 0% Next 9% Income Share 20% 15% 10% 5% Next 9% Income Share 0% FIGURE 1 Top Income Shares and Marginal Tax Rates, Source: Updated version of Figure 8 in Saez (2004). Computations based on income tax return data. Income excludes realized capital gains, as well as Social Security and unemployment insurance benefits. The figure displays the income share (right y-axis) and the average marginal tax rate (left y-axis) (weigthed by income) for the top 1% (Panel A) and for the next 9% (Panel B) income earners.

9 Table 1. Elasticity estimates using top income share time series Top 1% Next 9% (1) (2) A. Tax Reform Episodes 1981 vs (ERTA 1981) vs (TRA 1986) vs (OBRA 1993) vs (OBRA 1993) B. Full Time Series No time trends (0.31) (0.13) Linear time trend (0.20) (0.02) Linear and square time trends (0.06) (0.03) Linear, square, and cube time trends (0.11) (0.02) Notes: Estimates in panel A are obtained using series from Figure 1 and using the formula e=[log(income share after reform)-log(income share before reform)]/[log(1- MTR after reform)-log(1- MTR before reform)] Source: Saez et al. (2010) Estimates in Panel B are obtained by time-series regression of log(top 1% income share) on a constant, log (1 - average marginal tax rate), and polynomials time controls from 1960 to 2006 (44 observations). OLS regression. Standard Errors from Newey-West with 8 lags.
 Notes: Estimates in panel A are obtained using series from Figure 1 and using the formula e=[log(income share after reform)-log(income share before reform)]/[log(1- MTR after reform)-log(1- MTR")
10 Source: Series based on regression analysis presented in Table 3, columns (1) and (5). The diamond line is the top 1% income share. The dotted line is the fitted regression curve including only the net-of-tax rate. The solid line is the fitted regression curve including time controls. The dashed line is the same fitted regression curve but freezes the marginal tax rate at the 1960 value. 18% Income Share(t) 16% A+1.58*log[1-MTR(t)] A+0.62*log[1-MTR(t)]-.018*t *t^2 Income Share 14% 12% 10% 8% 6% A+0.62*log[1-MTR(1960)]-.018*t *t^2 FIGURE 5. The Top 1% Income Share and fitted Values from Elasticity Regressions
![The dashed line is the same fitted regression curve but freezes the marginal tax rate at the 1960 value. 18% Income Share(t) 16% A+1.58*log[1-MTR(t)] A+0.62*log[1-MTR(t)]-.018*t+.](/docs-images/48/19347657/images/page_10.jpg "00077*t^2 Income Share 14% 12% 10% 8% 6% 1960 1962 1964 1966 1968 1970 1972 1974 1976 1978 1980 1982 1984 1986 1988 1990 1992 1994 1996 1998 2000 A+0.62*log[1-MTR(1960)]-.018*t+.")
11 Source: Feldstein (1995), p. 561

12 Source: Feldstein (1995), p. 565

13
14 100% Top MTR ordinary income vs. capital gains 100% Top MTR (Federal Individual Income Tax) 90% 80% 70% 60% 50% 40% 30% 20% 10% Top MTR 0% Top MTR (capital gains) 90% 80% 70% 60% 50% 40% 30% 20% 10% 0% Source: statistics computed by the author
 90% 80% 70% 60% 50%")
15 Top 0.1% Income Share and Composition 12% 10% 8% Capital Gains Capital Income Business Income Salaries 6% 4% 2% 0% Source: Piketty and Saez QJE'03, updated to 2007

16 Source: Goolsbee (2000), p. 365

17 Source: Goolsbee (2000), p. 365

18 3.5% The Top 0.01% Income Share, Composition, and MTR 90% Top 0.01% share and composition 3.0% 2.5% 2.0% 1.5% 1.0% 0.5% 0.0% Wages Partnership Dividends Other S-Corp. Sole Prop. Interest MTR 80% 70% 60% 50% 40% 30% 20% 10% 0% Marginal Tax Rate for the top 0.01% Source: Saez et al. (2010)

19 Top Marginal Tax Rate (Federal Individual Income Tax) 100% 90% Top MTR (Federal Individual Income Tax) 80% 70% 60% 50% 40% 30% 20% 10% 0% Source: statistics computed by the author

20 Top 0.1% Income Share and Composition 12% 10% 8% Capital Gains Capital Income Business Income Salaries 6% 4% 2% 0% Source: Piketty and Saez QJE'03, updated to 2007

21 Top 0.1% WAGE Share and Marginal Tax Rate in 70% 6% Top 0.1% MTR Top 0.1% Share Marginal Tax Rate 60% 50% 40% 30% 20% 5% 4% 3% 2% 10% % Top 0.1% WAGE Income Share 0% Source: statistics computed by the author
22 Top 0.1% WAGE income Share and MTR in 70% 6% Marginal Tax Rate 60% 50% 40% 30% 20% Top 0.1% MTR Top 0.1% Share 5% 4% 3% 2% 1% 10% Top 0.1% WAGE Income Share % Source: statistics computed by the author
23 SOURCE IS LANDAIS '09 Charitable contributions as a % of total income and MTR on ordinary income Top.01% tax units, United States, (fractiles computed by total income excluding capital gains) MTR 100% 90% 80% 70% 60% 50% 40% 30% 20% 10% 0% MTR contributions % of income 16% 14% 12% 10% 8% 6% 4% 2% 0% Note: MTR is for Federal Income Tax only
 provides electricity for the north side San Diego Source: Ito, (San 2011Diego Gas & Electric) provides electricity for the south side 19 /")
24 Introduction Research Design Estimation Welfare Conclusion I specifically focus on households located within 1 mile of the utility border Edison (Southern California Edison) provides electricity for the north side San Diego Source: Ito, (San 2011Diego Gas & Electric) provides electricity for the south side 19 / 69
25 Introduction Research Design Estimation Welfare Conclusion In contrast, they experience substantially different nonlinear pricing Edison and San Diego: Cents per kwh in Edison 20 San Diego Monthly Consumption Source: Ito, / 69
26 DD = (mean % change in San Diego) - (mean % change in Edison) Relative changes for SDG&E customers relative to SCE customers. Panel A: Top Decile (90% - 100%) of Consumption Distributions Difference in Differences in Price (%) Year Source: Ito, 2011 Marginal Price Average Price Consumption Difference in Differences in Consumption (%)
27 DD = (mean % change in San Diego) - (mean % change in Edison) Relative changes for SDG&E customers relative to SCE customers. Panel A: Top Decile (90% - 100%) of Consumption Distributions Difference in Differences in Price (%) Year Source: Ito, 2011 Marginal Price Average Price Consumption Difference in Differences in Consumption (%)
28 DD = (mean % change in San Diego) - (mean % change in Edison) Relative changes for SDG&E customers relative to SCE customers. Panel A: Top Decile (90% - 100%) of Consumption Distributions Difference in Differences in Price (%) Year Source: Ito, 2011 Marginal Price Average Price Consumption Difference in Differences in Consumption (%)
29 DD = (mean % change in San Diego) - (mean % change in Edison) Relative changes for SDG&E customers relative to SCE customers. Panel B. Fifth Decile (40% - 50%) of Consumption Distributions Difference in Differences in Price (%) Year Source: Ito, 2011 Marginal Price Average Price Consumption Difference in Differences in Consumption (%)
30 Introduction Research Design Estimation Welfare Conclusion Estimation results: Marginal Price v.s. Average Price 2SLS Estimates: Marginal Price vs. Average Price Distance from border 1 mile 0.5 mile (1) (2) (3) (4) (5) (6) ln(mp) (.007) (.015) (.011) (.020) ln(ap) (.006) (.013) (.011) (.017) Observations 6,513,600 3,520,320 Dependent variable: ln(electricity consumption) Standard errors are clustered at city-deciles levels Source: Ito, / 69
31 Figure 2. Two Decades of Danish Tax Reform Panel A. Marginal Tax Rate on Labor Income Panel B. Marginal Tax Rate on Negative Capital Income Marginal Tax Rate Marginal Tax Rate Bottom bracket Middle bracket Top bracket Bottom bracket Middle bracket Top bracket Panel C. Marginal Tax Rate on Positive Capital Income Panel D. Share of Taxpayers in the Three Tax Brackets Marginal Tax Rate Share of all taxpayers (%) Source: Kleven and Schultz '12 Bottom bracket Middle bracket Top bracket Bottom bracket Middle bracket Top bracket
32 Figure 6. Graphical Evidence on the Effects of the 1987 reform on Taxable Income Source: Kleven and Schultz '12Panel A. Labor Income Labor income (ind dex 1986=100) DD 1 Elasticity = (0.011) DD 2 Elasticity = (0.013) Treatment 1 Treatment 2 Control Panel B. Positive Capital Income Positive Cap pital Income (index 1986=1 100) 130 DD Elasticity = (0.063) Treatment Control
33 Figure 1 : Total number of foreigners in different income groups Source: Kleven, Landais, Saez, Schultz QJE (2014) Control #1:.8 to.9*threshold Control #2:.9 to.99*threshold Treatment: earnings> threshold DD elasticity: Long term: 1.62 (.16) Short term: 1.28 (.15) Control 1= annualized income between.8 and.9 of threshold Control 2= annualized income between.9 and.995 of threshold. DD specifications
34 Elasticity=.07 (.15) Top 1% Income Share (%) Top Marginal Tax Rate (%) A. Top 1% Share and Top Marginal Tax Rate in Source: Piketty, Saez, Stantcheva AEJ-EP (2014)
35 Elasticity= 1.90 (.43) Top 1% Income Share (%) Top Marginal Tax Rate (%) B. Top 1% Share and Top Marginal Tax Rate in Source: Piketty, Saez, Stantcheva AEJ-EP (2014)
36 Elasticity=.47 (.11) Change in Top 1% Income Share (points) Change in Top Marginal Tax Rate (points) Change in Top Tax Rate and Top 1% Share, to Source: Piketty, Saez, Stantcheva AEJ-EP (2014)
37 Top tax rates and top 1% income share Piketty, Saez & Stantcheva () Three Elasticities November / 62
38 GDP per capita real annual growth (%) Change in Top Marginal Tax Rate (points) A. Growth and Change in Top Marginal Tax Rate Change in Top Tax Rate and GDP per capita growth since 1960 Source: Piketty, Saez, Stantcheva AEJ-EP (2014)
39 GDP per capita real annual growth (%) Change in Top Marginal Tax Rate (points) B. Growth (adjusted for initial 1960 GDP) Change in Top Tax Rate and GDP per capita growth since 1960 Source: Piketty, Saez, Stantcheva AEJ-EP (2014)
40 Top tax rates and average growth Piketty, Saez & Stantcheva () ) No or signi cantly Three Elasticities negative November / 62
41 CEO pay($ million, log scale) A. Average CEO compensation United States Elasticity= 1.97 (.27) United Kingdom Belgium Top Income Marginal Tax Rate Piketty, Saez & Stantcheva () Three Elasticities November / 62
42 CEO pay($ million, log scale) with controls B. Average CEO compensation with controls Elasticity= 1.90 (.29) United States United Kingdom Belgium Top Income Marginal Tax Rate Piketty, Saez & Stantcheva () Three Elasticities November / 62
43 International CEO Pay: Governance Piketty, Saez & Stantcheva () Three Elasticities November / 62
44 Top 0.1% Pre- Tax Income Share and Composi:on 12% 10% 8% Capital Gains Capital Income Business Income Salaries 6% 4% 2% 0% Source: Piketty and Saez, 2003 updated to Series based on pre-tax cash market income including or excluding realized capital gains, and always excluding government transfers
45 Tax Avoidance: Top 1% Income Shares and Top MTR Top 1% Income Shares (%) Top 1% Share Top 1% (excl. KG) Top MTR MTR K gains Marginal Tax Rates (%) Year
46 Top 1% and Bottom 99% Income Growth Real Income per adult (1913=100) Top 1% Bottom 99% Top MTR Marginal Tax Rate (%) Year
47 Top 1% Income Share and Top MTR Top 1% Income Shares (%) Top 1% (excluding Capital Gains) Top MTR Marginal Tax Rates (%) Year
48 Mean charitable giving of top 1% incomes / mean income 90% 80% 70% 60% 50% 40% 30% 20% 10% 0% Charitable Giving of Top 1% Incomes Mean charitable giving of top 1% divided by mean income [lea y- axis] Source: Appendix Table XX. The figure depicts average charitable giving of top 1% inomes (normalized by average income per family) on the left y-axis
49 Mean charitable giving of top 1% incomes / mean income 90% 80% 70% 60% 50% 40% 30% 20% 10% 0% Charitable Giving of Top 1% Incomes, Mean charitable giving of top 1% divided by mean income [lea y- axis] Top 1% Income Share [right y- axis] Source: Appendix Table XX. The figure depicts average charitable giving of top 1% inomes (normalized by average income per family) on the left y-axis. For comparison, the figure reports the top 1% income share (on the right y-axis) % 20% 15% 10% 5% 0% Top 1% income share
Income and Wealth Inequality: Evidence and Policy Implications
 Income and Wealth Inequality: Evidence and Policy Implications Emmanuel Saez, UC Berkeley Neubauer Collegium Lecture University of Chicago October 2014 1 MEASURING INEQUALITY Inequality matters because
Top Incomes throughout the Great Recession
 Top Incomes throughout the Great Recession Emmanuel Saez UC Berkeley Rodolfo Debenedetti Lecture December 2012 1 INTRODUCTION Free market economies generate substantial inequality Main criticism of capitalism
How do the 2016 Presidential Tax Plans Compare So Far?
 How do the 2016 Presidential Tax Plans Compare So Far? 10-Year GDP Growth 10.0% 16.0% -1.0% 13.9% 15.0% -9.5% 11.5% 10-Year Capital Investment Growth 28.8% 46.6% -2.8% 43.9% 48.9% -18.6% 29% 10-Year Wage
Over the last 40 years, the U.S. federal tax system has undergone three
 Journal of Economic Perspectives Volume 21, Number 1 Winter 2007 Pages 3 24 How Progressive is the U.S. Federal Tax System? A Historical and International Perspective Thomas Piketty and Emmanuel Saez Over
Striking it Richer: The Evolution of Top Incomes in the United States (Updated with 2012 preliminary estimates)
") Striking it Richer: The Evolution of Top Incomes in the United States (Updated with 2012 preliminary estimates) Emmanuel Saez, UC Berkeley September 3, 2013 What s new for recent years? 2009-2012: Uneven
Striking it Richer: The Evolution of Top Incomes in the United States (Updated with 2012 preliminary estimates) Emmanuel Saez, UC Berkeley September 3, 2013 What s new for recent years? 2009-2012: Uneven
Jobs and Income Growth of Top Earners and the Causes of Changing Income Inequality: Evidence from U.S. Tax Return Data
 Jobs and Income Growth of Top Earners and the Causes of Changing Income Inequality: Evidence from U.S. Tax Return Data Jon Bakija Bradley T. Heim Williams College Office of Tax Analysis Williamstown, MA
Details and Analysis of Senator Bernie Sanders s Tax Plan
 FISCAL FACT Jan. 2016 No. 498 Details and Analysis of Senator Bernie Sanders s Tax Plan By Alan Cole and Scott Greenberg Economist Analyst Key Findings: Senator Sanders (I-VT) would enact a number of policies
Striking it Richer: The Evolution of Top Incomes in the United States (Updated with 2009 and 2010 estimates)
") Striking it Richer: The Evolution of Top Incomes in the United States (Updated with 2009 and 2010 estimates) Emmanuel Saez March 2, 2012 What s new for recent years? Great Recession 2007-2009 During the
Striking it Richer: The Evolution of Top Incomes in the United States (Updated with 2009 and 2010 estimates) Emmanuel Saez March 2, 2012 What s new for recent years? Great Recession 2007-2009 During the
Striking it Richer: The Evolution of Top Incomes in the United States (Updated with 2015 preliminary estimates)
") Striking it Richer: The Evolution of Top Incomes in the United States (Updated with 2015 preliminary estimates) Emmanuel Saez, UC Berkeley June 30, 2016 What s new for recent years? 2013-2015: Robust income
Striking it Richer: The Evolution of Top Incomes in the United States (Updated with 2015 preliminary estimates) Emmanuel Saez, UC Berkeley June 30, 2016 What s new for recent years? 2013-2015: Robust income
THE BUFFETT RULE: A BASIC PRINCIPLE OF TAX FAIRNESS. The National Economic Council
 THE BUFFETT RULE: A BASIC PRINCIPLE OF TAX FAIRNESS The National Economic Council April 2012 The Buffett Rule: A Basic Principle of Tax Fairness The Buffett Rule is the basic principle that no household
Striking it Richer: The Evolution of Top Incomes in the United States (Update using 2006 preliminary estimates)
") Striking it Richer: The Evolution of Top Incomes in the United States (Update using 2006 preliminary estimates) Emmanuel Saez March 15, 2008 The recent dramatic rise in income inequality in the United
Striking it Richer: The Evolution of Top Incomes in the United States (Update using 2006 preliminary estimates) Emmanuel Saez March 15, 2008 The recent dramatic rise in income inequality in the United
Wealth Inequality in the United States since 1913
 Wealth Inequality in the United States since 1913 Emmanuel Saez (UC Berkeley) Gabriel Zucman (LSE) October 2014 Introduction US Income inequality has increased sharply since the 1970s Mixed existing evidence
Chapter 9 Practice Test Multiple Choice Identify the choice that best completes the statement or answers the question.
 Chapter 9 Practice Test Multiple Choice Identify the choice that best completes the statement or answers the question. 1. The authority to levy a federal tax comes from a. the Fifth Amendment. c. an act
April 8,2005 JEFFREY KUPFER, EXECUTIVE DIRECTOR PRESIDENT S ADVISORY PANEL ON FEDERAL TAX REFORM
 DEPARTMENT OF THE TREASURY WASHINGTON, D.C. 20220 April 8,2005 MEMORANDUM FOR FROM SUBJECT JEFFREY KUPFER, EXECUTIVE DIRECTOR PRESIDENT S ADVISORY PANEL ON FEDERAL TAX REFORM ROBERT CAmoLi& DEPUTY ASSISTANT
NBER WORKING PAPER SERIES HOW PROGRESSIVE IS THE U.S. FEDERAL TAX SYSTEM? A HISTORICAL AND INTERNATIONAL PERSPECTIVE. Thomas Piketty Emmanuel Saez
 NBER WORKING PAPER SERIES HOW PROGRESSIVE IS THE U.S. FEDERAL TAX SYSTEM? A HISTORICAL AND INTERNATIONAL PERSPECTIVE Thomas Piketty Emmanuel Saez Working Paper 12404 http://www.nber.org/papers/w12404 NATIONAL
A Comparison of the Tax Burden on Labor in the OECD By Kyle Pomerleau
 FISCAL FACT Jun. 2014 No. 434 A Comparison of the Tax Burden on Labor in the OECD By Kyle Pomerleau Economist Key Findings Average wage earners in the United States face two major taxes: the individual
Chapter 3: The effect of taxation on behaviour. Alain Trannoy AMSE & EHESS
 Chapter 3: The effect of taxation on behaviour Alain Trannoy AMSE & EHESS Introduction The most important empirical question for economics: the behavorial response to taxes Calibration of macro models
APPENDIX TO: Top Incomes in Korea, 1933-2010: Evidence from Income Tax Statistics
 TOP INCOMES IN KOREA, 1933-2010: EV Title INCOME TAX STATISTICS Author(s) KIM, NAK NYEON; KIM, JONGIL Citation Hitotsubashi Journal of Economics, Issue 2015-06 Date Type Departmental Bulletin Paper Text
Details and Analysis of Dr. Ben Carson s Tax Plan
 FISCAL FACT Jan. 2016 No. 493 Details and Analysis of Dr. Ben Carson s Tax Plan By Kyle Pomerleau Director of Federal Projects Key Findings Dr. Ben Carson s tax plan would replace the federal income tax
Designing Tax Policy for Finland: Lessons from the Mirrlees Review and Comments on Peter s Presentation
 Designing Tax Policy for Finland: Lessons from the Mirrlees Review and Comments on Peter s Presentation Jukka Pirttilä University of Tampere Labour Institute for Economic Research Contents Wider perspective:
Figure 1: Gini coefficient
 0.50 Figure 1: Gini coefficient Gini coefficient 0.45 0.40 0.35 0.30 1940 1950 1960 1970 1980 1990 2000 Source: Kopczuk, Saez, Song QJE'10: Wage earnings inequality Year All Workers Men Women Top 10% Pre-
How To Know If A Health Insurance Tax Is Progressive
 Citizens for Tax Justice December 11, 2009 Would the Senate Democrats proposed excise tax on highcost employer-paid health insurance benefits be progressive? Summary Senate Democrats have proposed a new,
Income Inequality in Korea, 1933-2010: Evidence from Income Tax Statistics
 Income Inequality in Korea, 1933-2010: Evidence from Income Tax Statistics Nak Nyeon Kim and Jongil Kim Abstract This paper constructs long-term series of top income shares and top wage income shares using
The 2001 and 2003 Tax Relief: The Benefit of Lower Tax Rates
 FISCAL Au 2008 No. 141 FACT The 2001 and 2003 Tax Relief: The Benefit of Lower Tax Rates By Robert Carroll Summary Recent research on President Bush's tax relief in 2001 and 2003 has found that the lower
The Elasticity of Taxable Income: A Non-Technical Summary
 The Elasticity of Taxable Income: A Non-Technical Summary John Creedy The University of Melbourne Abstract This paper provides a non-technical summary of the concept of the elasticity of taxable income,
Estimating Taxable Income Responses Using Danish Tax Reforms
 Estimating Taxable Income Responses Using Danish Tax Reforms By Henrik Jacobsen Kleven and Esben Anton Schultz This paper estimates taxable income responses using a series of Danish tax reforms and populationwide
A Comparison of the Tax Burden on Labor in the OECD
 FISCAL FACT July 2015 No. 475 A Comparison of the Tax Burden on Labor in the OECD By Sam Jordan & Kyle Pomerleau Research Assistant Economist Key Findings Average wage earners in the United States face
AN ANALYSIS OF DONALD TRUMP S TAX PLAN
 AN ANALYSIS OF DONALD TRUMP S TAX PLAN Jim Nunns, Len Burman, Jeff Rohaly, and Joe Rosenberg December 22, 2015 ABSTRACT This paper analyzes presidential candidate Donald Trump s tax proposal. His plan
The Case for a Progressive Tax: From Basic Research to Policy Recommendations
 The Case for a Progressive Tax: From Basic Research to Policy Recommendations Peter Diamond Emmanuel Saez CESIFO WORKING PAPER NO. 3548 CATEGORY 1: PUBLIC FINANCE AUGUST 2011 An electronic version of the
Reducing the Deficit by Increasing Individual Income Tax Rates
 Reducing the Deficit by Increasing Individual Income Tax Rates Eric Toder, Jim Nunns, and Joseph Rosenberg March 2012 The authors are all affiliated with the Urban-Brookings Tax Policy Center. Toder is
1. A is a tax system which has higher tax rates on people with lower incomes.
 Homework 15 1. A is a tax system which has higher tax rates on people with lower incomes. A. regressive tax B. progressive tax C. flat tax D. a value added tax 2. The is calculated by taking the total
How Much Do Americans Pay in Federal Taxes? April 15, 2014
 How Much Do Americans Pay in Federal Taxes? April 15, 2014 One of the most hotly debated issues of our time is the fairness of our federal tax system. But too often, discussions are clouded and confused
Appendix Figure 1 The Geography of Consumer Bankruptcy
 Appendix Figure 1 The Geography of Consumer Bankruptcy Number of Bankruptcy Offices in Each Court Number of Chapter 13 Judges Chapter 13 Filings Per Capita Chapter 13 Discharge Rate Variation in Chapter
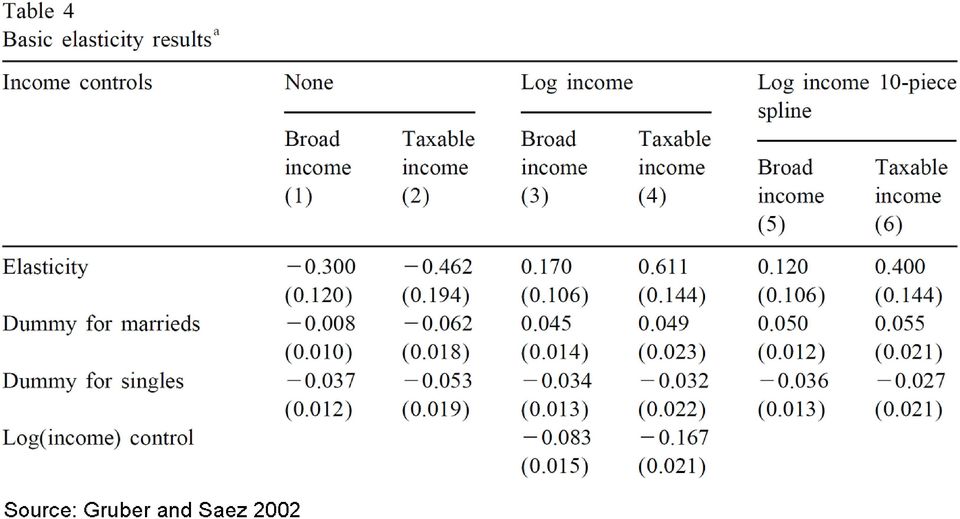
Notes - Gruber, Public Finance Chapter 20.3 A calculation that finds the optimal income tax in a simple model: Gruber and Saez (2002).
.") Notes - Gruber, Public Finance Chapter 20.3 A calculation that finds the optimal income tax in a simple model: Gruber and Saez (2002). Description of the model. This is a special case of a Mirrlees model.
Notes - Gruber, Public Finance Chapter 20.3 A calculation that finds the optimal income tax in a simple model: Gruber and Saez (2002). Description of the model. This is a special case of a Mirrlees model.
UNWILLING OR UNABLE TO CHEAT? EVIDENCE
 UNWILLING OR UNABLE TO CHEAT? EVIDENCE FROM A TAX AUDIT EXPERIMENT IN DENMARK Econometrica (forthcoming) H. J. Kleven, M. Knudsen, C. T. Kreiner, S. Pedersen, E. Saez Presented by Lucila Berniell Macro
The Tax (and Wage) Implications of Bernie Sanders s Medicare for All Health Plan
 Implications of Bernie Sanders s Medicare for All Health Plan") The Tax (and Wage) Implications of Bernie Sanders s Medicare for All Health Plan Citizens for Tax Justice February 2016 The Tax (and Wage) Implications of Bernie Sanders s Medicare for All Health Plan
The Tax (and Wage) Implications of Bernie Sanders s Medicare for All Health Plan Citizens for Tax Justice February 2016 The Tax (and Wage) Implications of Bernie Sanders s Medicare for All Health Plan
CONGRESS OF THE UNITED STATES CONGRESSIONAL BUDGET OFFICE CBO. The Distribution of Household Income and Federal Taxes, 2008 and 2009
 CONGRESS OF THE UNITED STATES CONGRESSIONAL BUDGET OFFICE Percent 70 The Distribution of Household Income and Federal Taxes, 2008 and 2009 60 50 Before-Tax Income Federal Taxes Top 1 Percent 40 30 20 81st
2014 TAX AND FINANCIAL PLANNING TABLES. An overview of important changes, rates, rules and deadlines to assist your 2014 tax planning.
 2014 TAX AND FINANCIAL PLANNING TABLES An overview of important changes, rates, rules and deadlines to assist your 2014 tax planning. 2014 2014 TAX TAX AND AND FINANCIAL FINANCIAL PLANNING PLANNING TABLES
RECENT EVIDENCE ON TAXPAYERS RESPONSE TO THE RATE INCREASES IN THE 1990 S FRANK SAMMARTINO DAVID WEINER *
 TAXPAYERS RESPONSE TO THE RATE INCREASES IN THE 1990S RECENT EVIDENCE ON TAXPAYERS RESPONSE TO THE RATE INCREASES IN THE 1990 S FRANK SAMMARTINO DAVID WEINER * * & * Tax Analysis Division, Congressional
TAX CONSIDERATIONS BUSINESSES. Marty Verdick
 TAX CONSIDERATIONS FOR SMALL BUSINESSES Marty Verdick RSM McGladrey, Inc. Overview of Topics General federal tax issues Federal tax incentives Entity selection tax issues State tax issues Sales & use tax
Jobs and Income Growth of Top Earners and the Causes of Changing Income Inequality: Evidence from U.S. Tax Return Data
 Jobs and Income Growth of Top Earners and the Causes of Changing Income Inequality: Evidence from U.S. Tax Return Data Jon Bakija Adam Cole Bradley T. Heim Williams College Office of Tax Analysis Indiana
How To Calculate The Federal Eitc
 The Earned Income Tax Credit and the Distribution of Income Draft: Preliminary and Incomplete Hilary W. Hoynes University of California, Berkeley and NBER hoynes@berkeley.edu Ankur J. Patel U.S. Department
QUARTERLY JOURNAL OF ECONOMICS
 THE QUARTERLY JOURNAL OF ECONOMICS Vol. CXVIII February 2003 Issue 1 INCOME INEQUALITY IN THE UNITED STATES, 1913 1998* THOMAS PIKETTY AND EMMANUEL SAEZ This paper presents new homogeneous series on top
Gini in a Bottle: The Mathematics of Income Inequality
 Gini in a Bottle: The Mathematics of Income Inequality Rich Beveridge Clatsop Community College rbeveridge@clatsopcc.edu https://www.clatsopcc.edu/rich-beveridges-homepage Statistics and Social Justice
NAR Frequently Asked Questions Health Insurance Reform
 NEW MEDICARE TAX ON UNEARNED NET INVESTMENT INCOME Q-1: Who will be subject to the new taxes imposed in the health legislation? A: A new 3.8% tax will apply to the unearned income of High Income taxpayers.
ENTITY CHOICE AND EFFECTIVE TAX RATES
 ENTITY CHOICE AND EFFECTIVE TAX RATES Prepared by Quantria Strategies, LLC for the National Federation of Independent Business and the S Corporation Association ENTITY CHOICE AND EFFECTIVE TAX RATES CONTENTS
Taxes and the Economy: An Economic Analysis of the Top Tax Rates Since 1945
 Taxes and the Economy: An Economic Analysis of the Top Tax Rates Since 1945 Thomas L. Hungerford Specialist in Public Finance September 14, 2012 CRS Report for Congress Prepared for Members and Committees
CBO STAFF DISTRIBUTIONAL EFFECTS OF SUBSTITUTING A FLAT-RATE INCOME TAX AND AVALUE-ADDEDTAXFORCURRENT FEDERAL INCOME, PAYROLL, AND EXCISE TAXES
 CBO STAFF MEMORANDUM DISTRIBUTIONAL EFFECTS OF SUBSTITUTING A FLAT-RATE INCOME TAX AND AVALUE-ADDEDTAXFORCURRENT FEDERAL INCOME, PAYROLL, AND EXCISE TAXES April 1992 CONGRESSIONAL BUDGET OFFICE SECOND
DO INCOME TAXES AFFECT THE PROGRESSIVITY OF SOCIAL SECURITY?
 January 2012, Number 12-3 RETIREMENT RESEARCH DO INCOME TAXES AFFECT THE PROGRESSIVITY OF SOCIAL SECURITY? By Norma B. Coe, Zhenya Karamcheva, Richard Kopcke, and Alicia H. Munnell* Introduction Policymakers
The accuracy of the bunching method under optimization frictions: Students labor market frictions
 The accuracy of the bunching method under optimization frictions: Students labor market frictions Tuomas Kosonen (Labour Institute for Economic Research) Tuomas Matikka (VATT Institute for Economic Research)
Crunch or Crucible? Upcoming Changes in the Federal Tax Law A Special Edition Tax Guide for Friends and Alumni of Pomona College
 Upcoming Changes in the Federal Tax Law A Special Edition Tax Guide for Friends and Alumni of Pomona College Pomona College, Office of Trusts & Estates, 550 N. College Ave., Claremont, CA 91711 www.pomona.planyourlegacy.org
HOW DO TAX-DEFERRED SAVINGS ACCOUNTS AFFECT SAVINGS BEHAVIOR? EVIDENCE FROM DENMARK
 HOW DO TAX-DEFERRED SAVINGS ACCOUNTS AFFECT SAVINGS BEHAVIOR? EVIDENCE FROM DENMARK Raj Chetty, Harvard University and NBER John N. Friedman, Harvard University and NBER Søren Leth-Petersen, University
How To Find Out How Much Money You Get From Bunching
 How Sensitive Are Taxpayers to Marginal Tax Rates? Evidence from Income Bunching in the United States Jacob A. Mortenson * and Andrew Whitten * October 1, 2015 Abstract Understanding the way taxpayers
Provincial Taxation of High Incomes: What are the Impacts on Equity and Tax Revenue?
 Provincial Taxation of High Incomes: What are the Impacts on Equity and Tax Revenue? Kevin Milligan Vancouver School of Economics University of British Columbia kevin.milligan@ubc.ca Michael Smart Department
16. Individual Retirement Accounts
 16. Individual Retirement Accounts Introduction Through enactment of the Employee Retirement Income Security Act of 1974 (ERISA), Congress established individual retirement accounts (IRAs) to provide workers
Definition 8.1 Two inequalities are equivalent if they have the same solution set. Add or Subtract the same value on both sides of the inequality.
 8 Inequalities Concepts: Equivalent Inequalities Linear and Nonlinear Inequalities Absolute Value Inequalities (Sections 4.6 and 1.1) 8.1 Equivalent Inequalities Definition 8.1 Two inequalities are equivalent
IFS. Means-testing and tax rates on earnings. Mike Brewer Emmanuel Saez Andrew Shephard
 IFS Means-testing and tax rates on earnings Mike Brewer Emmanuel Saez Andrew Shephard Prepared for the Report of a Commission on Reforming the Tax System for the 21st Century, Chaired by Sir James Mirrlees
Creating Tax Alpha B & F Financial Analytics, Inc.
 This presentation is not intended to provide legal or tax advice. Consult with your legal and tax professional To determine how the concepts presented apply in your Situation. Creating Tax Alpha B & F
Volume Title: The Effects of Taxation on Capital Accumulation. Volume Publisher: University of Chicago Press
 This PDF is a selection from an out-of-print volume from the National Bureau of Economic Research Volume Title: The Effects of Taxation on Capital Accumulation Volume Author/Editor: Martin Feldstein, ed.
I. Introduction to Taxation
 University of Pacific-Economics 53 Lecture Notes #17 I. Introduction to Taxation Government plays an important role in most modern economies. In the United States, the role of the government extends from
Tax Subsidies for Private Health Insurance
 Tax Subsidies for Private Health Insurance Matthew Rae, Gary Claxton, Nirmita Panchal, Larry Levitt The federal and state tax systems provide significant financial benefits for people with private health
budget brief On Tuesday, August 3, legislative leaders proposed a new budget plan, including a tax swap that would increase some
 UNDERSTANDING THE TAX SWAP budget brief AUGUST JUNE 2010 2005 On Tuesday, August 3, legislative leaders proposed a new budget plan, including a tax swap that would increase some of the state s personal
Jobs and Growth Effects of Tax Rate Reductions in Ohio
 Jobs and Growth Effects of Tax Rate Reductions in Ohio BY ALEX BRILL May 2014 This report was sponsored by American Freedom Builders, Inc., a 501(c)4 organization. The author is solely responsible for
Traditional IRA s Contribution rules-
 A Traditional IRA is a retirement plan that allows you to save money for retirement. In the case of a traditional IRA, you may also be offered an immediate tax shelter for the contributions that you make
Tax Facts Quick Reference 2012
 Wealth Management Services Tax Facts Quick Reference 2012 Income Investment Estate Retirement Social Security FOR USE BY FINANCIAL ADVISORS AND CLIENTS IN CONSULTATION WITH THEIR FINANCIAL ADVISOR FOR
Jon Bakija Tax Policy and Philanthropy: A Primer on the Empirical Evidence for the United States and Its Implications
 Jon Bakija Tax Policy and Philanthropy: A Primer on the Empirical Evidence for the United States and Its Implications federal and state tax policies in the united states offer substantial incentives to
2011 Tax And Financial Planning Tables
 2011 Tax and Financial PLanning Tables Investment Planning 2011 Tax And Financial Planning Tables Tax planning is an important component for your overall financial plan. 2011 Tax and Financial PLanning
INDEPENDENT FISCAL OFFICE Matthew Knittel, Director Testimony Before the Senate Finance Committee June 10, 2015
 INDEPENDENT FISCAL OFFICE Matthew Knittel, Director Testimony Before the Senate Finance Committee June 10, 2015 Chairmen Eichelberger and Blake, members of the committee, thank you for the opportunity
Labour Economics 17 (2010) 940 950. Contents lists available at ScienceDirect. Labour Economics. journal homepage: www.elsevier.
 940 950. Contents lists available at ScienceDirect. Labour Economics. journal homepage: www.elsevier.") Labour Economics 17 (2010) 940 950 Contents lists available at ScienceDirect Labour Economics journal homepage: www.elsevier.com/locate/labeco The responsiveness of self-employment income to tax rate changes
Labour Economics 17 (2010) 940 950 Contents lists available at ScienceDirect Labour Economics journal homepage: www.elsevier.com/locate/labeco The responsiveness of self-employment income to tax rate changes
2015 vs. 2016 Key Facts and Figures Note: We highlighted the information that changed between 2015 and 2016 with a box.
 2015 vs. 2016 Key Facts and Figures Note: We highlighted the information that changed between 2015 and 2016 with a box. 2016 Keir Educational Resources Key Facts-1 800-795-5347 Personal Exemption 2015
Federal Income Tax Information January 29, 2016 Page 2. 2016 Federal Income Tax Withholding Information - PERCENTAGE METHOD
 Federal Income Tax Information January 29, 2016 Page 2 - PERCENTAGE METHOD ALLOWANCE TABLE Dollar Amount of Withholding Allowances Number of Biweekly Monthly Withholding Pay Period Pay Period Allowances
AN ANALYSIS OF MARCO RUBIO S TAX PLAN
 AN ANALYSIS OF MARCO RUBIO S TAX PLAN Elaine Maag, Roberton Williams, Jeff Rohaly, and Jim Nunns February 11, 2016 ABSTRACT Marco Rubio s tax proposal would convert the federal income tax into a consumption
Poverty, Inequality and Trends in the Labor Market. Hilary Hoynes, University of California Berkeley
 Poverty, Inequality and Trends in the Labor Market Hilary Hoynes, University of California Berkeley Overview Since the 1980s we have seen little improvement in poverty despite steady economic growth At
Could a Health Savings Account Be Better than an Employer- Matched 401(k)?
?") Could a Health Savings Account Be Better than an Employer- Matched 401(k)? by Greg, Ph.D. Greg, Ph.D., is an associate professor of accounting at the University of Missouri St. Louis. He teaches a graduate
Could a Health Savings Account Be Better than an Employer- Matched 401(k)? by Greg, Ph.D. Greg, Ph.D., is an associate professor of accounting at the University of Missouri St. Louis. He teaches a graduate
Jeb Bush's Stimulus Package - A paper Analysis
 AN ANALYSIS OF GOVERNOR BUSH S TAX PLAN Len Burman, Bill Gale, John Iselin, Jim Nunns, Jeff Rohaly, Joe Rosenberg, and Roberton Williams December 8, 2015 ABSTRACT This paper analyzes presidential candidate
The primary purpose of a tax system is to support public goods and services. State and local taxes
 Issue Brief UPDATED APRIL 2015 BY WILLIAM CHEN Who Pays Taxes in California? The primary purpose of a tax system is to support public goods and services. State and local taxes are the way that Californians
Can more revenue be raised by increasing income tax rates for the very rich?
 Can more revenue be raised by increasing income tax rates for the very rich? Mike Brewer and James Browne * Institute for Fiscal Studies 1. Introduction After three decades in which such a reform would
Can cars be made more affordable in India?
 Can cars be made more affordable in? Only four people in a thousand own a passenger car in compared to 35 people per thousand in Thailand, 92 in Brazil, 187 in South Korea and over 450 in the developed
The Impact of Proposed Federal Tax Reform on Farm Businesses
 The Impact of Proposed Federal Tax Reform on Farm Businesses James M. Williamson and Ron Durst United States Department of Agriculture Economic Research Service Washington, DC Poster prepared for presentation
Tax Subsidies for Health Insurance An Issue Brief
 Tax Subsidies for Health Insurance An Issue Brief Prepared by the Kaiser Family Foundation July 2008 Tax Subsidies for Health Insurance Most workers pay both federal and state taxes for wages paid to them
Social Security Benefits and the 55.5% Tax Bracket. by Larry Layton CPA
 Social Security Benefits and the 55.5% Tax Bracket by Larry Layton CPA Every year there is a lot of press regarding the need for Congress to step in and provide an income adjustment for the Alternative
ACTIONABLE STRATEGIES FOR REDUCING MEDICARE TAXES
 ACTIONABLE STRATEGIES FOR REDUCING MEDICARE TAXES Medicare taxes increased in 2013 for high-income earners. Timely action can help reduce the impact of higher taxes. KEY TAKEAWAYS High-income taxpayers
VERY FEW SMALL BUSINESS OWNERS WOULD FACE TAX INCREASES UNDER PRESIDENT S BUDGET Vast Majority Would Benefit From Other Key Proposals
 820 First Street NE, Suite 510 Washington, DC 20002 Tel: 202-408-1080 Fax: 202-408-1056 center@cbpp.org www.cbpp.org February 28, 2009 VERY FEW SMALL BUSINESS OWNERS WOULD FACE TAX INCREASES UNDER PRESIDENT
AN OVERVIEW OF STATE INCOME TAXES ARKANSAS AND SURROUNDING STATES
 AN OVERVIEW OF STATE INCOME TAXES ARKANSAS AND SURROUNDING STATES A current topic of conversation among many who are concerned about economic development in Arkansas is how the State s taxation laws, particularly
Transfer income/payments : payments received by persons from the federal government in the form of cash social service benefits such as pensions.
 The government s economic objective of equity in the distribution personal income basically means that it is striving for a fair, but not necessarily equal, share of income to be distributed to all members
The S-Corporation Election; Advantages & Disadvantages
 The S-Corporation Election; Advantages & Disadvantages Presented by: National Society of Accountants 1010 N. Fairfax Street Alexandria, VA 22314 800-966-6679 www.nsacct.org 1 Learning Objectives At the
The Revenue and Taxpayer Impacts of the Income Tax Provisions of SB 407
 The Revenue and Taxpayer Impacts of the Income Tax Provisions of SB 407 Tax Policy and Research Montana Department of Revenue December 2006 Executive Summary Senate Bill 407, enacted in the 2003 legislative
The Elasticity of Taxable Income: Influences on Economic Efficiency and Tax Revenues, and Implications for Tax Policy
 Published in TAX POLICY LESSONS FROM THE 2000s, ed. Alan D. Viard (Washington, DC: AEI Press, 2009). 5 The Elasticity of Taxable Income: Influences on Economic Efficiency and Tax Revenues, and Implications
Taxes and Transitions
 Taxes and Transitions THE NEW FRONTIER FOR RETIREMENT PLANNING Wealthy individuals have been hit with their first major tax increase in more than 20 years, with tax hikes on ordinary income, dividends
Illustration of the President s Health Care Tax Initiative
 January 25, 2007 Illustration of the President s Health Care Tax Initiative by Gerald Prante Fiscal Fact No. 75 Now that more details of the President's health care proposal have emerged, we can look more
Post Election Focus: Stars, Stripes & Taxes
 Post Election Focus: Stars, Stripes & Taxes Presented By: Margo Cook, CPA December 6, 2012 Click HERE to listen to webinar. Post Election Focus: Stars, Stripes & Taxes Presented By: Margo Cook, CPA December
Sarena Goodman and Jeffrey Liebman. September, 2008. Abstract
 The Taxation of Social Security Benefits as an Approach to Means Testing Sarena Goodman and Jeffrey Liebman September, 2008 Abstract Many Social Security reform proposals suggest cutting benefits in ways
Executive summary. Global Wage Report 2014 / 15 Wages and income inequality
 Executive summary Global Wage Report 2014 / 15 Wages and income inequality Global Wage Report 2014/15 Wages and income inequality Executive summary INTERNATIONAL LABOUR OFFICE GENEVA Copyright International
Chapter 2 Personal Income Tax
 Chapter 2 Personal Income Tax 2.1 General Principles The new law on personal income taxes (Personal Income Tax Law, or PIT Law) replaced Ordinance 35, which only taxed the income of individuals in the
NBER WORKING PAPER SERIES OPTIMAL LABOR INCOME TAXATION. Thomas Piketty Emmanuel Saez. Working Paper 18521 http://www.nber.
 NBER WORKING PAPER SERIES OPTIMAL LABOR INCOME TAXATION Thomas Piketty Emmanuel Saez Working Paper 18521 http://www.nber.org/papers/w18521 NATIONAL BUREAU OF ECONOMIC RESEARCH 1050 Massachusetts Avenue
National Capital Gift Planning Council
 National Capital Gift Planning Council Nuts and Bolts Session September 16, 2015 Craig Stevens, Aronson LLC www.aronsonllc.com 1 Income Tax and Tax Brackets Calculating Income Tax Gross Income Everything
2013 TAX PLANNING TIPS FOR INDIVIDUALS
 2013 TAX PLANNING TIPS FOR INDIVIDUALS The 2012 American Taxpayer Relief Act, which was enacted in early January 2013, was a sweeping tax package that included permanent extension of the Bush-era tax cuts
Eliminating Double Taxation through Corporate Integration
 FISCAL FACT Feb. 2015 No. 453 Eliminating Double Taxation through Corporate Integration By Kyle Pomerleau Economist Key Findings The United States tax code places a double-tax on corporate income with
The American Tax Relief Act of 2012 (HR 8, the Act )
") NATIONAL CAPITAL GIFT PLANNING COUNCIL The Fiscal Cliff, Taxes and Planned Giving: Where Are We Now? Robert E. Madden Susan Leahy BLANK ROME LLP JANUARY 9, 2013 The American Tax Relief Act of 2012 (HR
NATIONAL CAPITAL GIFT PLANNING COUNCIL The Fiscal Cliff, Taxes and Planned Giving: Where Are We Now? Robert E. Madden Susan Leahy BLANK ROME LLP JANUARY 9, 2013 The American Tax Relief Act of 2012 (HR
An Overview of The Tax Relief Act on 2010
 An Overview of The Tax Relief Act on 2010 On December 17, 2010, the President signed a multi-billion dollar tax cut package, the Tax Relief, Unemployment Insurance Reauthorization and Job Creation Act