Figure 1: Fishbone Diagram - Structure. Cause-and-Effect Diagram, Ishikawa diagram, Fishbone diagram, Root Cause Analysis.
|
|
|
- Pierce Kennedy
- 7 years ago
- Views:
Transcription
1 FISHBONE DIAGRAM ABSTRACT Category: Analysis Tool The Fishbone Diagram (G) is a tool for analyzing process dispersion. It is also referred to as the "Ishikawa diagram," because Kaoru Ishikawa developed it, and the "fishbone diagram," because the complete diagram resembles a fish skeleton. The diagram illustrates the main causes and subcauses leading to an effect (symptom). It is a team brainstorming tool used to identify potential root causes (G) to problems. Because of its function it may be referred to as a causeand-effect diagram. In a typical Fishbone diagram, the effect is usually a problem needs to be resolved, and is placed at the "fish head". The causes of the effect are then laid out along the "bones", and classified into different types along the branches. Further causes can be laid out alongside further side branches. So the general structure of a fishbone diagram is presented below. KEYWORDS Figure 1: Fishbone Diagram - Structure OBJECTIVES Cause-and-Effect Diagram, Ishikawa diagram, Fishbone diagram, Root Cause Analysis. The main goal of the Fishbone diagram is to illustrate in a graphical way the relationship between a given outcome and all the factors that influence this outcome. The main objectives of this tool are: 1

2 Determining the root causes (G) of a problem. Focusing on a specific issue without resorting to complaints and irrelevant discussion. Identifying areas where there is a lack of data. FIELD OF APPLICATION RELATED TOOLS The Fishbone diagram could be applied when it is wanted to: Focus attention on one specific issue or problem. Focus the team on the causes (G), not the symptoms. Organize and display graphically the various theories about what the root causes (G) of a problem may be. Show the relationship of various factors influencing a problem. Reveal important relationships among various variables and possible causes (G). Provide additional insight into process behaviors. DESCRIPTION Pareto chart, Scatter diagram, Flowcharts Checksheets Dr. Kaoru Ishikawa, a Japanese quality control statistician, invented the fishbone diagram. It is often also referred to as the Ishikawa diagram. The fishbone diagram is an analysis tool that provides a systematic way of looking at effects and the causes that create or contribute to those effects. Because of the function of the fishbone diagram, it may be referred to as a cause-and-effect diagram. The design of the diagram looks much like the skeleton of a fish. Therefore, it is often referred to as the fishbone diagram. A cause-and-effect diagram can help identify the reasons why a process goes out of control. Often the fishbone diagram can be used to summarize the results of a brainstorming session, identifying the causes of a specified undesirable outcome. It helps to identify root causes (G) and ensures a common understanding of the causes. The steps for constructing and analyzing a Cause-and-Effect Diagram are outlined below: Step 1 - Identify and clearly define the outcome or effect to be analyzed 2. Formulate the problem and write it in a box on the right side of the diagram. Everyone must clearly understand the nature of the problem and the process/product being discussed. If everyone is not clear on 2
. Provide additional insight into process behaviors. DESCRIPTION Pareto chart, Scatter diagram, Flowcharts Checksheets Dr.")
3 the purpose of the session, the session will not resolve the problem. In this step the following rules have to be be applied: Decide on the effect to be examined. Effects are stated as particular quality characteristics, problems resulting from work, planning objectives, and the like. Use Operational Definitions. Develop an Operational Definition of the effect to ensure that it is clearly understood. Remember, an effect may be positive (an objective) or negative (a problem), depending upon the issue that s being discussed. Using a positive effect which focuses on a desired outcome tends to foster pride and ownership over productive areas. This may lead to an upbeat atmosphere that encourages the participation of the group. When possible, it is preferable to phrase the effect in positive terms. Focusing on a negative effect can sidetrack the team into justifying why the problem occurred and placing blame. However, it is sometimes easier for a team to focus on what causes a problem than what causes an excellent outcome. While you should be cautious about the fallout that can result from focusing on a negative effect, getting a team to concentrate on things that can go wrong may foster a more relaxed atmosphere and sometimes enhances group participation. You must decide which approach will work best with your group. Step 2 - Use a chart pack positioned so that everyone can see it, draw the spine and create the effect box. Draw a horizontal arrow pointing to the right. This is the spine. To the right of the arrow, write a brief description of the effect or outcome which results from the process. Draw a box around the description of the effect. Step 3 - Identify the main causes (G) studied. contributing to the effect being These are the labels for the major branches of your diagram and become categories under which to list the many causes related to those categories. Establish the major causes, or categories, under which other possible causes will be listed. You should use category labels that make sense for the diagram you are creating. Write the main categories your team has selected to the left of the effect box, some above the spine and some below it. Draw a box around each category label and use a diagonal line to form a branch connecting the box to the spine. 3
 or negative (a problem), depending upon the issue that s being discussed.")
4 Step 4 - For each major branch, identify other specific factors which may be the causes of the effect Identify as many causes or factors as possible and attach them as subbranches of the major branches. Fill in detail for each cause. If a minor cause applies to more than one major cause, list it under both. Step 5 - Identify increasingly more detailed levels of causes and continue organizing them under related causes or categories. You can do this by asking a series of why questions. You may need to break your diagram into smaller diagrams if one branch has too many subbranches. Any main cause (3Ms and P, 4Ps, or a category you have named) can be reworded into an effect. Step 6 - Analyze the diagram. Analysis helps you identify causes that warrant further investigation. Since Cause-and-Effect Diagrams identify only Possible Causes, you may want to use a Pareto Chart to help your team determine the cause to focus on first. Look at the balance of your diagram, checking for comparable levels of detail for most of the categories. A thick cluster of items in one area may indicate a need for further study. A main category having only a few specific causes may indicate a need for further identification of causes. If several major branches have only a few subbranches, you may need to combine them under a single category. Look for causes that appear repeatedly. These may represent root causes. Look for what you can measure in each cause so you can quantify the effects of any changes you make. 4
 can be reworded into an effect.")
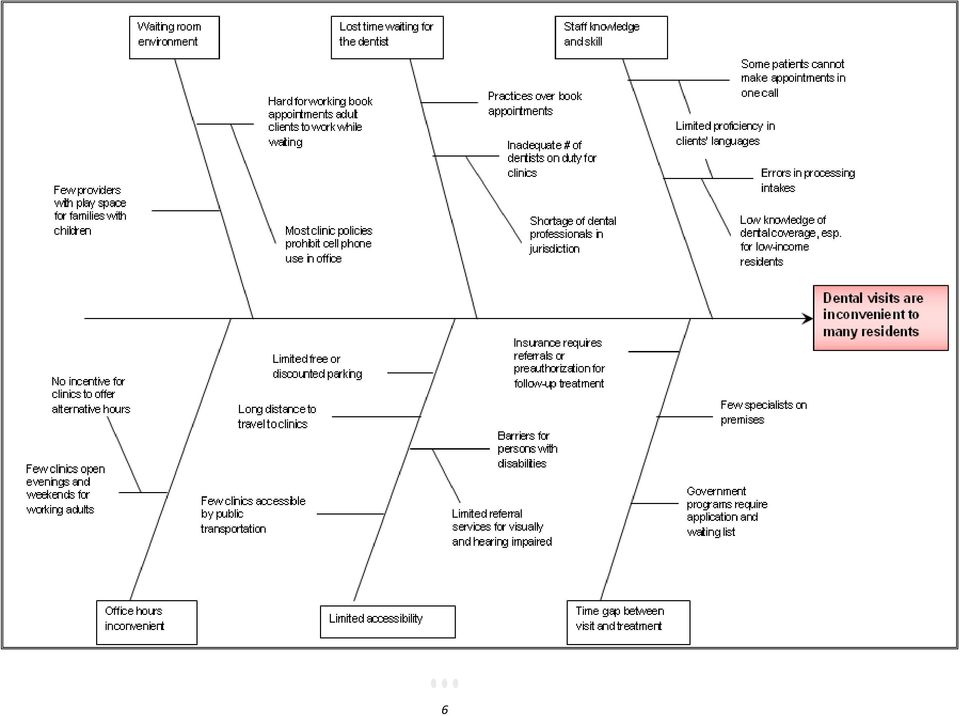
5 BENEFITS PREREQUISITES Helps determine root causes Encourages group participation Uses an orderly, easy-to-read format to diagram cause and effect relationships Indicates possible causes of variation Increases knowledge of the process by helping everyone to learn more about the factors at work and how they relate Identifies areas for collecting data A problem is composed of a limited number of causes, which are in turn composed of sub causes. Distinguish these causes and sub causes is a useful step to deal with the problem. EXAMPLES CASE STUDY Example problem: Low utilization of dental services by adults 5 The following Fishbone Diagram shows how a public health team could delve into one potential root cause of low utilization of dental services by adults throughout the jurisdiction: "Dental visits are inconvenient to many residents." 5

6 6
7 BIBLIOGRAPHY 1. American Society for Quality, Fishbone diagram 2. Balanced Scorecard Institute, Basic tools for process improvement, Module 5 Cause and Effect diagram 3. Ishikawa, Kaoru (1986). Guide to Quality Control. Tokyo, Japan: Asian Productivity Organization. 4. Walton, Mary (1992) The Deming Management Method, Mercury Business 5. Public Health Infrastructure, Fishbone (Ishikawa) Diagram (Example) (accessed on 8/8/2007) 7
 The Deming Management Method, Mercury Business 5. Public Health Infrastructure, Fishbone (Ishikawa) Diagram (Example) http://www.phf.")
CAUSE-AND-EFFECT DIAGRAM
 Module 5 CAUSE-AND-EFFECT DIAGRAM CAUSE-AND-EFFECT DIAGRAM 1 What is a Cause-and-Effect Diagram? A Cause-and-Effect Diagram is a tool that helps identify, sort, and display possible causes of a specific
Lean Six Sigma Training The DMAIC Story. Unit 6: Glossary Page 6-1
 Unit 6: Glossary Page 6-1 Glossary of Terms Unit 6: Glossary Page 6-2 Action Plan A technique that documents everything that must be done to ensure effective implementation of a countermeasure or improvement
A C T I V I T Y : U S I N G T H E F I S H B O N E D I A G R A M TO
 C O L L E C T I V E L E A D E R S H I P W O R K S P L A N N I N G F O R AC T I O N 143 A C T I V I T Y : U S I N G T H E F I S H B O N E D I A G R A M TO GENERATE ACTION PL ANS Moving from identifying
Application of Fishbone Analysis for Evaluating Supply Chain and Business Process- A CASE STUDY ON THE ST JAMES HOSPITAL
 Application of Fishbone Analysis for Evaluating Supply Chain and Business Process- A CASE STUDY ON THE ST JAMES HOSPITAL Tarun Kanti Bose 1 1 Assistant Professor, Business Administration Discipline, Khulna
APPLICATION OF FISHBONE DIAGRAM TO DETERMINE THE RISK OF AN EVENT WITH MULTIPLE CAUSES
 APPLICATION OF FISHBONE DIAGRAM TO DETERMINE THE RISK OF AN EVENT WITH MULTIPLE CAUSES Gheorghe ILIE, Carmen Nadia CIOCOIU 2 UTI Grup SRL, Soseaua Oltenitei no.07a, Bucharest, Romania, gheorghe.ilie@uti.ro
The Importance of Project Quality Management. What Is Project Quality? The International Organization for Standardization (ISO)
") Chapter 8 Project Quality Management November 17, 2008 2 The Importance of Project Quality Management Many people joke about the poor quality of IT products People seem to accept systems being down occasionally
Chapter 8 Project Quality Management November 17, 2008 2 The Importance of Project Quality Management Many people joke about the poor quality of IT products People seem to accept systems being down occasionally
Tools & Techniques for Process Improvement
 Tools & Techniques for Process Improvement Understanding processes so that they can be improved by means of a systematic approach requires the knowledge of a simple kit of ols or techniques. The effective
Problem Solving. Appreciation is a very simple but powerful technique for extracting the maximum amount of information from a simple fact.
 Problem Solving Appreciation - Extracting Maximum Information from Facts Appreciation is a very simple but powerful technique for extracting the maximum amount of information from a simple fact. Starting
Continuous Improvement Toolkit
 Continuous Improvement Toolkit Mind Mapping Managing Risk PDPC Pros and Cons Importance-Urgency Mapping RACI Matrix Stakeholder Analysis FMEA RAID Logs Break-even Analysis Cost Benefit Analysis PEST PERT/CPM
Introduction to STATISTICAL PROCESS CONTROL TECHNIQUES
 Introduction to STATISTICAL PROCESS CONTROL TECHNIQUES Preface 1 Quality Control Today 1 New Demands On Systems Require Action 1 Socratic SPC -- Overview Q&A 2 Steps Involved In Using Statistical Process
Problem Solving Tools and Techniques
 GUIDELINES TESSERACT Management Systems Problem Solving Tools and Techniques Prepared by: Mike Clargo Tesseract Management Systems Limited INTRODUCTION This document is intended to provide a basic outline
Process/Workflow Analysis Quiz
 Process/Workflow Analysis Quiz Question ID: 1 Outline Section: WF A flowchart can be used to show all except A: the specifications of the system. B: re-engineered clarity. C: existing confusion. D: the
White paper. Corrective action: The closed-loop system
 White paper Corrective action: The closed-loop system Contents Summary How corrective action works The steps 1 - Identify non-conformities - Opening a corrective action 6 - Responding to a corrective action
Six Sigma aims to maximise customer satisfaction and minimise defects.
 Six Sigma aims to maximise customer satisfaction and minimise defects. WHAT IS SIX SIGMA? In statistical terms, the purpose of Six Sigma is to reduce process variation so that virtually all the products
By Geoff Vorley MSc. MCQI
 MINI GUIDE TO ROOT CAUSE ANALYSIS By Geoff Vorley MSc. MCQI Published by Quality Management & Training (Publications) Ltd PO Box 172 Guildford Surrey United Kingdom GU2 7FN W: www.qmt.co.uk E: help@qmt.co.uk
Root Cause Analysis 1
 Root Cause Analysis 1 Root Cause Analysis Root Cause Analysis is a method that is used to address a problem or non-conformance, in order to get to the root cause of the problem. It is used so we can correct
MULTIMEDIA COLLEGE JALAN GURNEY KIRI 54100 KUALA LUMPUR
 STUDENT IDENTIFICATION NO MULTIMEDIA COLLEGE JALAN GURNEY KIRI 54100 KUALA LUMPUR FIFTH SEMESTER FINAL EXAMINATION, 2014/2015 SESSION MGT2063 TOTAL QUALITY MANAGEMENT DMGA-E-F-3/12, DMGW-E-F-3/12, DMGQ-E-F-3/12
Introduction to CONTINUOUS QUALITY IMPROVEMENT TECHNIQUES. for Healthcare Process Improvement
 Introduction to CONTINUOUS QUALITY IMPROVEMENT TECHNIQUES for Healthcare Process Improvement Preface 1 Quality Control and Healthcare Today 1 New Demands On Healthcare Systems Require Action 1 Continous
TOPIC 8 QUALITY OBJECTIVE. Quality
 TOPIC 8 QUALITY Q Copyright Houghton Mifflin Company. All rights reserved. 8-1 OBJECTIVE What is Quality & Its Importance Total Quality Management (TQM) Dimensions of Quality Element of TQM TQM vs. Traditional
Certified Quality Improvement Associate
 Certified Quality Improvement Associate Quality excellence to enhance your career and boost your organization s bottom line asq.org/certification The Global Voice of Quality TM Certification from ASQ is
How To Improve Quality
 ASN Dialysis Advisory Group ASN DIALYSIS CURRICULUM 0 ASN Dialysis Curriculum Continuous Quality Improvement in Dialysis Units Uptal D. Patel, MD Affiliations Duke Clinical Research Institute Departments
CONTINUOUS IMPROVEMENT EXERCISE L. Leslie Gardner, Ph.D., Assistant Professor School of Business University of Indianapolis
 CONTINUOUS IMPROVEMENT EXERCISE L. Leslie Gardner, Ph.D., Assistant Professor School of Business University of Indianapolis To try out the continuous improvement skills you have learned over the last few
Writing Reports BJECTIVES ONTENTS. By the end of this section you should be able to :
 Writing Reports By the end of this section you should be able to : O BJECTIVES Understand the purposes of a report Plan a report Understand the structure of a report Collect information for your report
Hoshin Kanri Planning Process. In today s business world, the goal of any organization is to survive in the market,
 Christina C. Udasco Mini-Tutorial 470W Due: 02 April 01 Hoshin Kanri Planning Process In today s business world, the goal of any organization is to survive in the market, by having a strong competitive
Depth-of-Knowledge Levels for Four Content Areas Norman L. Webb March 28, 2002. Reading (based on Wixson, 1999)
") Depth-of-Knowledge Levels for Four Content Areas Norman L. Webb March 28, 2002 Language Arts Levels of Depth of Knowledge Interpreting and assigning depth-of-knowledge levels to both objectives within
Depth-of-Knowledge Levels for Four Content Areas Norman L. Webb March 28, 2002 Language Arts Levels of Depth of Knowledge Interpreting and assigning depth-of-knowledge levels to both objectives within
Total Quality Management TQM Dr.-Ing. George Power. The Evolution of Quality Management
 Total Management TQM Dr.-Ing. George Power The Evolution of Management The Evolution of Management Assurance Total Control Companywide Control Mass Inspection Control (Acceptance Sampling) 2 Evolution
Implementation of Lean Six Sigma Principles: Making Data Cleansing Lean
 Implementation of Lean Six Sigma Principles: Making Data Cleansing Lean Nityanand Wachche B.E in Computer Engineering University of Mumbai Mumbai, India ABSTRACT Data cleansing is required before performing
Root cause analysis. Chartered Institute of Internal Auditors
 27 June 2016 Root cause analysis Chartered Institute of Internal Auditors Root cause analysis is a process for understanding 'what happened' and solving a problem through looking back and drilling down
PROJECT QUALITY MANAGEMENT
 8 PROJECT QUALITY MANAGEMENT Project Quality Management includes the processes required to ensure that the project will satisfy the needs for which it was undertaken. It includes all activities of the
Chapter 3 02/18/1437. Foundations of Quality Management. Deming (1900-1993) Leaders in the Quality Revolution
 Leaders in the Quality Revolution") Chapter 3 Foundations of Quality Management Evans & Lindsay (2014) MANAGING FOR QUALITY AND PERFORMANCE EXCELLENCE, 8e 1 Leaders in the Quality Revolution W. Edwards Deming Joseph M. Juran Philip B. Crosby
Chapter 3 Foundations of Quality Management Evans & Lindsay (2014) MANAGING FOR QUALITY AND PERFORMANCE EXCELLENCE, 8e 1 Leaders in the Quality Revolution W. Edwards Deming Joseph M. Juran Philip B. Crosby
Key Resources for Project Managers. Critical Thinking. Guide 3
 Critical Thinking Guide 3 Guide 3 Critical Thinking Reference About this Guide The Critical Thinking Guide is intended to serve as a reference for you, the new project manager, and to give you basics
9 RUN CHART RUN CHART
 Module 9 RUN CHART RUN CHART 1 What is a Run Chart? A Run Chart is the most basic tool used to display how a process performs over time. It is a line graph of data points plotted in chronological order
CAPA Essentials Root Cause Analysis Tools and Techniques
 CAPA Essentials Root Cause Analysis Tools and Techniques Presented by Edna R. Falkenberg 21/10/2014 Slide 1 in numbers: Growing from strength to strength 1 One-stop technical solution provider 150 years
SIX-STEP PROBLEM SOLVING MODEL
 SIX-STEP PROBLEM SOLVING MODEL Problem solving models are used to address many issues that come up on a daily basis in the workplace. These problems may be technical or issue-based. While many of you have
Module 3: Correlation and Covariance
 Using Statistical Data to Make Decisions Module 3: Correlation and Covariance Tom Ilvento Dr. Mugdim Pašiƒ University of Delaware Sarajevo Graduate School of Business O ften our interest in data analysis
Overview. Elementary Quality Tools
 Overview 1. Planned procedure 2. Brainstorming 3. Cause-and-Effect Diagram (Ishikawa) 4. Checklist 5. Flow Chart 6. Data Collection 7. Tally List 8. Data Evaluation 9. Original Value Sequence 10. Histogram
SENTINEL EVENTS AND ROOT CAUSE ANALYSIS
 HOSPITAL NAME INSTITUTIONAL POLICY AND PROCEDURE (IPP) Department: Manual: Section: TITLE/DESCRIPTION POLICY NUMBER SENTINEL EVENTS AND ROOT CAUSE ANALYSIS EFFECTIVE DATE REVIEW DUE REPLACES NUMBER NO.
Brought to you by the NVCC-Annandale Reading and Writing Center
 Brought to you by the NVCC-Annandale Reading and Writing Center WORKSHOP OBJECTIVES: To understand the steps involved in writing inclass essays To be able to decode the question so that you answer the
Training Pack. Kaizen PDCA ( Plan / Do / Check / Act )
") Training Pack Kaizen PDCA ( Plan / Do / Check / Act ) Introductions Name Department Current knowledge of Plan Do Check Act Aims & Objectives Target Audience : All! Purpose of Module : To train the delegates
Training Pack Kaizen PDCA ( Plan / Do / Check / Act ) Introductions Name Department Current knowledge of Plan Do Check Act Aims & Objectives Target Audience : All! Purpose of Module : To train the delegates
Measurement of Construction Processes for Continuous Improvement
 Measurement of Construction Processes for Continuous Improvement 0 Measurement of Construction Processes for Continuous Improvement Revised Final Report Submitted to Mr. Michael Ashworth Planning Consultant
FMEA and FTA Analysis
 FMEA and FTA Analysis Why it is Coming to Your Hospital and Your Laboratory Tina A. Krenc Director, R&D Phase Systems Abbott Laboratories 1 Agenda Background on requirements for risk management Tools to
BODY OF KNOWLEDGE CERTIFIED SIX SIGMA YELLOW BELT
 BODY OF KNOWLEDGE CERTIFIED SIX SIGMA YELLOW BELT The topics in this Body of Knowledge include additional detail in the form of subtext explanations and the cognitive level at which test questions will
Expository Reading and Writing By Grade Level
 Expository and Writing By Grade Level Kindergarten TEKS identify the topic of an informational text heard identify the topic and details in expository text heard or read, referring to the words and/or
Appendix E Quality Improvement and Data Quality
 Appendix E Quality Improvement and Data Quality The best laid schemes o mice and men Gang aft a-gley; And leave us naught but grief and pain For promised joy Robert Burns, To a Mouse (1785) Purpose This
THE PROCESS APPROACH IN ISO 9001:2015
 International Organization for Standardization BIBC II, Chemin de Blandonnet 8, CP 401, 1214 Vernier, Geneva, Switzerland Tel: +41 22 749 01 11, Web: www.iso.org THE PROCESS APPROACH IN ISO 9001:2015 Purpose
*Quality. Management. Module 5
 *Quality Management Module 5 * After WW2 Mid-1960 s USA: Huge domestic market, high capacity Price for competitive advantage Oversupply. Europe, Japan: Can t match US productivity & economies of scale
Keywords: management, total quality management, automotive industry
 Romanian Economic and Business Review Vol. 5, No. 4 187 PRINCIPLES OF TQM IN AUTOMOTIVE INDUSTRY Nicoleta Isac Abstract TQM refers to a management process and set of disciplines that are coordinated to
Introducing the. Tools for. Continuous Improvement
 Introducing the Tools for Continuous Improvement The Concept In today s highly competitive business environment it has become a truism that only the fittest survive. Organisations invest in many different
Topic 12 Total Quality Management. From Control to Management. Deming s Fourteen Points for TQM
 Topic 12 Total Quality Management From Control to Management 1 Inspection Error detection of finished goods Rectification Reading guide: Chapter 20 (Slack et al, 2004) and MGT326 Slides/Handout 1 2 Quality
Personal Development Planning and eportfolio. Student Guide
 Personal Development Planning and eportfolio Student Guide 1 Introduction PDP helps you to develop the skills you need to take responsibility for your learning, development and career progression. Engaging
Exhibit memory of previously-learned materials by recalling facts, terms, basic concepts, and answers. Key Words
 The Six Levels of Questioning Level 1 Knowledge Exhibit memory of previously-learned materials by recalling facts, terms, basic concepts, and answers. who what why when where which omit choose find how
The purpose of Capacity and Availability Management (CAM) is to plan and monitor the effective provision of resources to support service requirements.
 is to plan and monitor the effective provision of resources to support service requirements.") CAPACITY AND AVAILABILITY MANAGEMENT A Project Management Process Area at Maturity Level 3 Purpose The purpose of Capacity and Availability Management (CAM) is to plan and monitor the effective provision
CAPACITY AND AVAILABILITY MANAGEMENT A Project Management Process Area at Maturity Level 3 Purpose The purpose of Capacity and Availability Management (CAM) is to plan and monitor the effective provision
Common Tools for Displaying and Communicating Data for Process Improvement
 Common Tools for Displaying and Communicating Data for Process Improvement Packet includes: Tool Use Page # Box and Whisker Plot Check Sheet Control Chart Histogram Pareto Diagram Run Chart Scatter Plot
DigiPoints Volume 2. Student Workbook. Module 10 Network Management
 Network Management Page 10.1 DigiPoints Volume 2 Module 10 Network Management Summary In this module, students learn engineering and operational information about Network Management. Module Objectives
Myths and Strategies of Defect Causal Analysis
 Proceedings: Pacific Northwest Software Quality Conference, October 2006 Myths and Strategies of Defect Causal Analysis David N. Card Q-Labs, Inc. dca@q-labs.com Biography David N. Card is a fellow of
pm4dev, 2008 management for development series Project Quality Management PROJECT MANAGEMENT FOR DEVELOPMENT ORGANIZATIONS
 pm4dev, 2008 management for development series Project Quality Management PROJECT MANAGEMENT FOR DEVELOPMENT ORGANIZATIONS PROJECT MANAGEMENT FOR DEVELOPMENT ORGANIZATIONS A methodology to manage development
Effective Root Cause Analysis For Corrective and Preventive Action
 Effective Root Cause Analysis For Corrective and Preventive Action Manuel Marco Understanding Key Principles Requirement need or expectation that is stated, generally implied, or obligatory Generally implied
Project Management Professionals Hot Topics & Challenges Quality Management. Topic: Seven Basic Quality Management Tools
 Topic: Seven Basic Quality Management Tools Presenter: Sohel Akhter, PMP, CCNA,ISMS PMP Instructor, Netcom Learning Adjunct Professor, MBA program, CUNY 1 Agenda Seven Basic Quality Tools & Techniques
Cognitive Domain (Bloom)
") Bloom s Taxonomy So what exactly is this thing called Bloom s Taxonomy, and why do education people keep talking about it? Well, Bloom was the head of a group in the 1950 s and 1960 s that created the
Bloom s Taxonomy So what exactly is this thing called Bloom s Taxonomy, and why do education people keep talking about it? Well, Bloom was the head of a group in the 1950 s and 1960 s that created the
CONDUCTING EFFECTIVE MEETINGS WORKBOOK A BASIC BUSINESS VICTORY GUIDE
 CONDUCTING EFFECTIVE MEETINGS WORKBOOK A BASIC BUSINESS VICTORY GUIDE This book was developed by James H. Saylor Copyright 2006. All rights reserved. Printed in the United States of America. Except as
Writing learning objectives
 Writing learning objectives This material was excerpted and adapted from the following web site: http://www.utexas.edu/academic/diia/assessment/iar/students/plan/objectives/ What is a learning objective?
QUALITY/BUSINESS OPERATING SYSTEM - DESIGN AND CONTROL FOR PRODUCTION
 QUALITY/BUSINESS OPERATING SYSTEM - DESIGN AND CONTROL FOR PRODUCTION Ing. Lenka Hejnková, Ing. Zdeňka Videcká, Ph.D. Annotation: Quality Operating System/Business Operating System is an advanced approach
ADVANCE YOUR CAREER COURSES / CERTIFICATE IN PROCESS MANAGEMENT
 ADVANCE YOUR CAREER COURSES / CERTIFICATE IN PROCESS MANAGEMENT A FOCUS ON ORGANIZATIONAL EXCELLENCE EXCELLENCE CANADA OFFERS A NUMBER OF DYNAMIC, INTERACTIVE TRAINING PROGRAMS TO UNLEASH STANDARDS OF
Continuous Improvement Philosophies
 Inputs Transformation Process Throughput Managing Operations: A Focus on Excellence Cox, Blackstone, and Schleier, 2003 Chapter 3 The Total Quality Management Philosophy: Managing Operations For Quality
Root Cause Analysis Dealing with problems not just symptoms 1
 Root Cause Analysis Dealing with problems not just symptoms 1 By Alon Linetzki, Managing Director & Principal Consultant, Best- Testing M: +972-54-3050824 alonl@best-testing.com www.best-testing.com Abstract
Performance Improvement (PI) Plan and Template
 Plan and Template") Performance Improvement (PI) Plan and Template Approved and adopted 11/2009 by the Best Practices Committee of the Health Care Association of New Jersey 4 AAA Drive, Suite 203, Hamilton, NJ 08691 Tel:
Performance Improvement (PI) Plan and Template Approved and adopted 11/2009 by the Best Practices Committee of the Health Care Association of New Jersey 4 AAA Drive, Suite 203, Hamilton, NJ 08691 Tel:
Lean Six Sigma Black Belt Body of Knowledge
 General Lean Six Sigma Defined UN Describe Nature and purpose of Lean Six Sigma Integration of Lean and Six Sigma UN Compare and contrast focus and approaches (Process Velocity and Quality) Y=f(X) Input
Setting SMART Objectives
 Setting SMART Objectives Whilst line managers are responsible for ensuring that objectives are set it is important that, wherever possible, objectives are jointly agreed, between staff and line manager,
BAPTIST HEALTH SCHOOL OF NURSING NSG 4027: PROFESSIONAL ROLES IN NURSING PRACTICE
 BAPTIST HEALTH SCHOOL OF NURSING NSG 4027: PROFESSIONAL ROLES IN NURSING PRACTICE H1 QUALITY IMPROVEMENT 2006 LECTURE OBJECTIVES: 1. Differentiate between the concepts of quality control/assurance and
Practical Research. Paul D. Leedy Jeanne Ellis Ormrod. Planning and Design. Tenth Edition
 Practical Research Planning and Design Tenth Edition Paul D. Leedy Jeanne Ellis Ormrod 2013, 2010, 2005, 2001, 1997 Pearson Education, Inc. All rights reserved. Chapter 1 The Nature and Tools of Research
Learning from Our Mistakes with Defect Causal Analysis. April 2001. Copyright 2001, Software Productivity Consortium NFP, Inc. All rights reserved.
 Learning from Our Mistakes with Defect Causal Analysis April 2001 David N. Card Based on the article in IEEE Software, January 1998 1 Agenda What is Defect Causal Analysis? Defect Prevention Key Process
CE Disclosure. Potential Failure and RCA 7/2/2014
 Potential Failure and RCA Helene Eckrich & Leon Spackman Potential Failure and Root Cause Analysis: Key Tools to Identify Potential Failures and Solve Problems to Attain High Reliability Workshop B //
FAILURE INVESTIGATION AND ROOT CAUSE ANALYSIS
 FAILURE INVESTIGATION AND ROOT CAUSE ANALYSIS Presented By Clay Anselmo, R.A.C. President and C.O.O. Reglera L.L.C. Denver, CO Learning Objectives Understand the Definitions of Failure Investigation and
Using Performance Excellence Models - Part 1:
 Using Performance Excellence Models - Part 1: Defining and Managing the Value Chain Jim Hill Minnesota ASQ Professional Development Summit Feb 27, 2013 1 Topics Problem: Wide interpretation of Work System
Training As a Root Cause
 Corrective Action Preventative Action Defining Alternatives to Training As a Root Cause Presentation Sponsors Corporate Quality Director at MME Group Inc ISO 9001:2008 & ISO 13485-:2003 Certified Customer
Project Quality Management. Project Management for IT
 Project Quality Management 1 Learning Objectives Understand the importance of project quality management for information technology products and services Define project quality management and understand
FAILURE MODES AND EFFECTS ANALYSIS (FMEA)
") FAILURE MODES AND EFFECTS ANALYSIS (FMEA) ABSTRACT Category: Analysis-Design Tools KEYWORDS Failure Modes and Effects Analysis (FMEA) (G) is a procedure that is performed after a failure mode effects analysis
FAILURE MODES AND EFFECTS ANALYSIS (FMEA) ABSTRACT Category: Analysis-Design Tools KEYWORDS Failure Modes and Effects Analysis (FMEA) (G) is a procedure that is performed after a failure mode effects analysis
Beyond Sarbanes-Oxley: Improving Corporate Value With a 4th Generation Balanced Scorecard Approach
 Beyond Sarbanes-Oxley: Improving Corporate Value With a 4th Generation Balanced Scorecard Approach Tomonori Tomura Preface With this article, the author would like to advocate a new approach that uses
Goals, Objectives and Norms
 Goals, Objectives and Norms Helping your team plan for success. Objectives Participants will be able to: Explain the difference between goals and objectives Define what norms are and why it is so important
Guide to Using Quality Improvement Tools to Drive Clinical Audits. Nancy Dixon and Mary Pearce Healthcare Quality Quest
 Guide to Using Quality Improvement Tools to Drive Clinical Audits Nancy Dixon and Mary Pearce Healthcare Quality Quest October 2011 Contents 1 Introduction 1 1.1 Who this guide is for 1 1.2 How the guide
2012-2013 Social Studies Fair
 2012-2013 Social Studies Fair All students at Sandtown Middle School are required to complete either a Social Studies or Science Fair project. These projects are student-focused research projects and the
Certified Six Sigma Yellow Belt
 Certified Six Sigma Yellow Belt Quality excellence to enhance your career and boost your organization s bottom line asq.org/cert The Global Voice of Quality TM Certification from ASQ is considered a mark
The Original Quality Gurus
 The Original Gurus What is a quality guru? A guru, by definition, is a good person, a wise person and a teacher. A quality guru should be all of these, plus have a concept and approach quality within business
Unit 6: Quality Management (PMBOK Guide, Chapter 8)
") (PMBOK Guide, Chapter 8) Historically, quality management questions have been difficult for some exam takers for two major reasons: 1) over-reliance on their previous training and personal experience (rather
(PMBOK Guide, Chapter 8) Historically, quality management questions have been difficult for some exam takers for two major reasons: 1) over-reliance on their previous training and personal experience (rather
Hoshin Training. Supplier Workshop Presented by Mark Underwood 5/1/2014
 Hoshin Training Supplier Workshop Presented by Mark Underwood 5/1/2014 What is Hoshin? Hoshin is a form of Strategic Planning. Some of the key benefits of Hoshin activity are: 1. Creates an established
Related guides: Effective Note Making', Creative Revision Strategies and Planning an Essay.
 Learning Enhancement Team Thought mapping This guide gives you a step by step introduction to a note making technique called thought mapping. This non-linear technique provides you with a note making tool
Keywords Agile, Scrum Methodology, Tools for Scrum, Six Sigma tools, scrum and six sigma
 Volume 4, Issue 3, March 2014 ISSN: 2277 128X International Journal of Advanced Research in Computer Science and Software Engineering Research Paper Available online at: www.ijarcsse.com Integrating Six
SCPC's Quality Improvement is the Science of Process Management
 SCPC's Quality Improvement is the Science of Process Management Identifying and implementing Processes of Care within your hospital will help transform your organization, improve healthcare processes,
INTRODUCTION to writing a graph description
 INTRODUCTION to writing a graph description For the IELTS writing test, you are required to complete two writing tasks. Task 1 is some kind of data report, while Task 2 is an essay. You are probably already
Chapter 8 Project Quality Management (1) Dr. Feng-Jen Yang
 Dr. Feng-Jen Yang") Chapter 8 Project Quality Management (1) Dr. Feng-Jen Yang Objectives Understand the importance of project quality management for information technology products and services Define project quality management
Chapter 8 Project Quality Management (1) Dr. Feng-Jen Yang Objectives Understand the importance of project quality management for information technology products and services Define project quality management
Total Quality Management
 Total Quality Management William M. Norton MIS 462 - Systems Design, Implementation and Project Management October 25, 2005 Norton 2 TABLE OF CONTENTS INTRODUCTION... 3 DEFINING QUALITY... 3 Nine Dimensions
Module 15: Nonconformance And Corrective And Preventive Action
 Module 15: Nonconformance And Corrective And Preventive Action Guidance...15-2 Figure 15-1: Root Cause Diagram...15-3 Tools and Forms...15-6 Tool 15-1: Corrective & Preventive Action Worksheet...15-6 Tool
Coexistence of Automatic Weather Station (AWS) System in harsh environmental conditions at National Meteorological Centre (NMC) Colombo, Sri Lanka.
 System in harsh environmental conditions at National Meteorological Centre (NMC) Colombo, Sri Lanka.") Coexistence of Automatic Weather Station (AWS) System in harsh environmental conditions at National Meteorological Centre (NMC) Colombo, Sri Lanka. Nuwan Kumarasinghe Department of Meteorology, Bauddhaloka
Coexistence of Automatic Weather Station (AWS) System in harsh environmental conditions at National Meteorological Centre (NMC) Colombo, Sri Lanka. Nuwan Kumarasinghe Department of Meteorology, Bauddhaloka
20 Points for Quality and Process Improvement
 20 Points for Quality and Process Improvement SEPG 2007 Conference March 2007 Austin, Texas Tim Kasse Kasse Initiatives LLC +1 972-987 - 7706 USA +49 (0) 7721-407 - 851 Europe +65 6430 6769 Singapore Welcome
DARTS Directed Activities Related to Texts
 DARTS Directed Activities Related to Texts What are DARTS? DARTS are activities that are designed to challenge pupils to engage with texts. They ask them to read closely and to interpret the information
The Seven Basic Tools. QUALITY CONTROL TOOLS (The Seven Basic Tools) What are check sheets? CHECK SHEET. Illustration (Painting defects)
 What are check sheets? CHECK SHEET. Illustration (Painting defects)") QUALITY CONTROL TOOLS (The Seven Basic Tools) Dr. Ömer Yağız Department of Business Administration Eastern Mediterranean University TRNC The Seven Basic Tools The seven basic tools are: Check sheet Flow
QUALITY CONTROL TOOLS (The Seven Basic Tools) Dr. Ömer Yağız Department of Business Administration Eastern Mediterranean University TRNC The Seven Basic Tools The seven basic tools are: Check sheet Flow
How To Write An Impactful Audit Report
 IIA Chicago Chapter 53 rd Annual Seminar April 15, 2013, Donald E. Stephens Convention Center @IIAChicago #IIACHI How To Write An Impactful Audit Report The role of Audit adds increasingly more value Susan
Module 9. Making a Good Presentation
 Module 9 Making a Good Presentation Module 9: Making a Good Presentation 9: 1 Module 9: Making a Good Presentation What we will learn during this session: 1. We will identify various ways of presenting
A STRUCTURED APPROACH TO ORGANIZATIONAL IMPROVEMENT
 http://www.psu.edu/president/pia/innovation/ INNOVATION INSIGHT SERIES NUMBER 7 A STRUCTURED TO ORGANIZATIONAL IMPROVEMENT Penn State s IMPROVE model is a structured approach to facilitate problem solving,
LeadingAge Maryland. QAPI: Quality Assurance Performance Improvement
 LeadingAge Maryland QAPI: Quality Assurance Performance Improvement NOT ALL CHANGE IS IMPROVEMENT, BUT ALL IMPROVEMENT IS CHANGE Donald Berwick, MD Former CMS Administrator 2 WHAT IS QAPI? Mandated as