Technical Report. For this research Ipsos MORI interviewed a sample of 1,005 adults Wales between the 5 th and 9th March 2011.
|
|
|
- Edgar Stanley
- 7 years ago
- Views:
Transcription
1 Technical Report This technical report, which can be appended to the Electoral Commission s Post NAW Referendum 2011 topline, contains a summary of the technical details and statistical reliability of this quantitative research project. 1. Methodology For this research Ipsos MORI interviewed a sample of 1,005 adults Wales between the 5 th and 9th March Interviews were conducted by telephone using Random Digit Dialling. We interviewed a representative quota sample. Quotas were set by age, gender, working status and region. The data were then weighted to the known national population profile in Wales. 2. Statistical Reliability The nature of research methodology dictates that respondents to the questionnaire are samples of the total population of Wales so we cannot be certain that the figures obtained are exactly those we would have if everybody in Wales had been interviewed (the true values). However, the variation between the sample results and the true values can be predicted from the knowledge of the size of the samples on which the results are based, the representativeness of the sample itself and the number of times that a particular answer is given. The confidence with which this prediction can be made is usually chosen to be 95% - that is, the chances are 95 in 100 that the true value will fall within a specified range. Given that we have both set quotas during the fieldwork phase as well as weighted our data to be representative of the profile of Wales, this reduces the effective base size from 1,005 to All statistical reliability has been calculated using this effective base size. Effective base:when data are weighted, it creates this 'design effect'which can negatively impact on the reliability of the data. Therefore the effective base size (the base size left when taking this into account) is the base size that can be used for significance testing. This is also known as the design effect, wherein some factors of the research methodology can negatively impact on the reliability of the data. In this case, this is due to the weighting used. 1

2 The table below illustrates the predicted ranges for different sample sizes and percentage results at the 95% confidence interval. Size of sample on which survey result is based Approximate sampling tolerances applicable to percentages at or near these levels 10% or 90% 30% or 70% 50% interviews interviews interviews interviews interviews interviews interviews interviews ,000 interviews For example, with an effective base size of 600 where 50% give a particular answer, the chances are 19 in 20 that the true value (which would have been obtained if the whole population had been interviewed) will fall within the range of +4 percentage points from the sample result (i.e. between 46% and 54% inclusive). When results are compared between separate groups within a sample, different results may be obtained. The difference may be real, or it may occur by chance (because not everyone in the population has been interviewed). To test if the difference is a real one i.e. if it is statistically significant we again have to know the size of the samples, the percentage giving a certain answer and the degree of confidence chosen. If we assume 95% confidence interval, the differences between the results of two separate groups must be greater than the values given in the table below. 2
 will fall within the range of +4")
3 Size of samples compared Differences required for significance at or near these percentage levels 10% or 90% 30% or 70% 50% and and and and and and and and and and and and and 1, and 1, So, for example, if we were to compare voters and non-voters views in the Electoral Commission s Post NAW Referendum Research in Wales, we would be comparing sub group samples of approximately 624 (voters) and 381 (non-voters). With these base sizes, where (e.g.) 30% of voters give a particular answer and (e.g.) 37% of non-voters give the same answer, the chances are 19 in 20 that the difference in responses between voters and non-voters is a true (statistically significant) difference (because the difference is seven or more). 3. Interpreting data tables When looking at the data tables for this research, you will notice that in addition to the percentage figures, there are also some small letters and other indicators within the text on the tables. We have explained these in full below. Letters assigned to percentage figures: if you look at the cross breaks (the columns running across the top of each table, e.g. age, gender etc), each cross break is assigned a letter (written in lower case directly underneath the column heading) that it has throughout the tables. For example, total is x', voter is 'a', non-voter is 'b'and male is 'c'. If a letter is written alongside a percentage figure within the body of the table, it is highlighting the fact that the percentage is statistically significantly higher than the corresponding figure in column 'a'or 'b'or 'c'etc. For example, if the percentage in the total column (x) has 'b'and 'c'written alongside it, then the total (x) percentage is significantly higher than that of non-voters (b) and males (c). 3
 and 381 (non-voters). With these base sizes, where (e.g.")
4 A practical example of this from the tables can be found in question 4. In the total column (column x) it is shown that 59% of respondents always vote at elections for the Welsh Assembly. As the table shows, this figure is significantly higher than columns b (non-voters 25%), e (18-24 year olds 25%) and g (35-44 year olds 47%). All other columns either have no significant difference with the total, or are significantly higher than the total column themselves (which would be shown by a 'x'next to the percentage in said column). Small base size: This is a base that is too small to statistically analyse through significance testing. The small number of respondents means that we cannot guarantee representativeness and that the findings are therefore indicative. We would thus advise that you not use these percentages for statistical analysis but that they are used indicatively with a note to the reader outlining the small base size and its limitations. 4. Social Grade Definitions A Professionals such as doctors, surgeons or dentists; chartered people like architects; fully qualified people with a large degree of responsibility such as senior editors, senior civil servants, town clerks, senior business executives and managers, and high ranking grades of the Services. B C1 C2 D E People with very responsible jobs such as university lecturers, matrons of hospitals, heads of local government departments; middle management in business; qualified scientists, bank manages, and upper grades of the Services, police inspectors. All others doing non-manual jobs: nurses, technicians, pharmacists, salesmen, publicans, people in clerical positions and middle ranks of the Services, police sergeants. Skilled manual workers/craftsmen who have served apprenticeships; foremen, manual workers with special qualifications such as long distance lorry drivers, security officers and lower grades of Services, police constables. Semi-skilled and unskilled manual workers, including labourers and mates of occupations in the C2 grade and serving apprenticeships; machine minders, farm labourers, bus and railway conductors, laboratory assistants, postmen, waiter/waitress, door-to-door and van salesmen. Those of lowest levels of subsistence including pensioners, casual workers, the unemployed and other with minimum levels of income. 4
. Small base size: This is a base that is too small to statistically analyse through significance testing.")
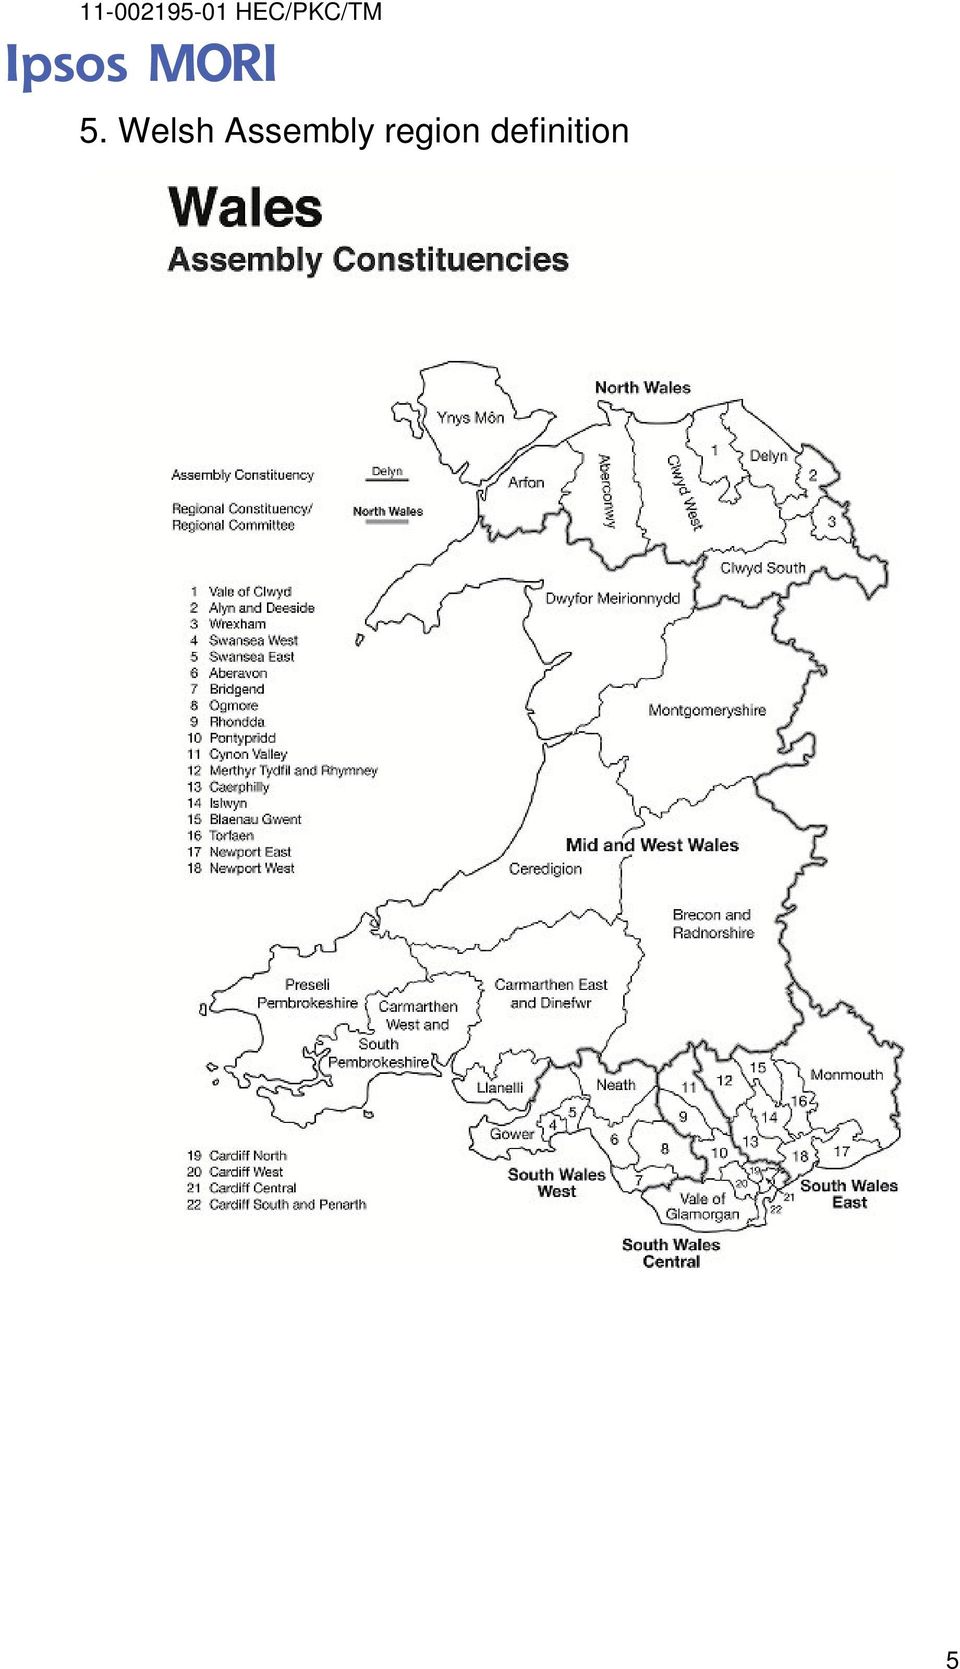
5 5. Welsh Assembly region definition 5
6 6. Claimed level of turnout As part of this research respondents were asked whether or not they had voted in the referendum. The chart below shows that 60% of respondents said they did vote, compared to the official turnout of 35%. This finding of overclaimed turnout is common in this type of research and in 2010 we found that 82% said they had voted in the General Election. Q As you may know, there was a referendum in Wales on Thursday 3rd March about the powers of the National Assembly for Wales. Many people have told us they didn t manage to vote in the referendum on 3rd March. How about you did you manage to vote in the referendum? 2011 Referendum Yes No 2010 General Election 49 18% 40% 60% 82% Base: 1,005 adults, fieldwork dates: 5 th March 9 th March 2011 Source: Ipsos MORI 6

The Office of Public Services Reform The Drivers of Satisfaction with Public Services
 The Office of Public Services Reform The Drivers of Satisfaction with Public Services Research Study Conducted for the Office of Public Services Reform April - May 2004 Contents Introduction 1 Executive

Pan-European opinion poll on occupational safety and health
 PRESS KIT Pan-European opinion poll on occupational safety and health Results across 36 European countries Press kit Conducted by Ipsos MORI Social Research Institute at the request of the European Agency
Parental Occupation Coding
 Parental Occupation Coding A report submitted to the Performance Measurement and Reporting Taskforce of the Ministerial Council on Education, Employment Training and Youth Affairs by Dr Roger Jones Quantitative
an employment status variable that captures information on employment status and size of organisation
 14 Deriving the NS-SEC: self-coded method 14.1 NS-SEC is derived from occupation and employment status information, occupation being ideally coded to the most detailed level of SOC2010. As there are 369
Trends in life expectancy by the National Statistics Socio-economic Classification 1982 2006
 Trends in life expectancy by the National Statistics Socio-economic Classification 1982 2006 Date: 22 February 2011 Coverage: England and Wales Theme: Health & Care This bulletin presents the first estimates
Public perceptions of the Removal of the Spare Room Subsidy (RSRS)
") Public perceptions of the Removal of the Spare Room Subsidy (RSRS) November 2013 Public perceptions of the Removal of the Spare Room Subsidy (RSRS) A report of research carried out by the Department for
Public perceptions of the Removal of the Spare Room Subsidy (RSRS) November 2013 Public perceptions of the Removal of the Spare Room Subsidy (RSRS) A report of research carried out by the Department for
9th PAY REVISION COMMISSION REPORT BRIEFING
 9th PAY REVISION COMMISSION REPORT BRIEFING According to the 9th Kerala Pay Revision Commission 2010, there will be a considerable Hike in Salary for Kerala Government Employees, Teachers, University Staff,
Attitudes towards Equality. Findings from the YouGov Survey
 Findings from the YouGov Survey June 2014 Department for Culture, Media & Sport Department for Culture, Media & Sport 3 Section 1: Introduction This report gives a first snapshot of public opinion on equality
The Effects of the Current Economic Conditions on Sport Participation. Chris Gratton and Themis Kokolakakis
 The Effects of the Current Economic Conditions on Sport Participation Chris Gratton and Themis Kokolakakis Sport Industry Research Centre Sheffield Hallam University A118 Collegiate Hall Sheffield S10
NHSScotland Staff Survey 2015. National Report
 National Report November 2015 Contents 1 Introduction... 3 2 Background... 3 2.1 Survey purpose... 3 2.2 Policy context... 4 3 Survey methodology... 5 4 Response rates... 6 5 Notes to aid interpretation...
2014 May Elections Campaign Tracking Research
 2014 May Elections Campaign Tracking Research Report for: Controlled document - Issue 4 TNS 2014 08.08.2014 JN 123256 Controlled document - Issue 5 Contents Executive Summary... 1 1. Background and objectives...
Biochemist 4 Biomedical Scientist 4 Board Level Director (depends on job role) 4 Bricklayer 5 Building Craftsperson 5 Building Officer 5
 4 Bricklayer 5 Building Craftsperson 5 Building Officer 5") Capacity Codes List This list is strictly for general guidance only, where there is uncertainty employers can ask for an assessment by sending a job description to NHS Pensions Fleetwood. Accountant 4
Capacity Codes List This list is strictly for general guidance only, where there is uncertainty employers can ask for an assessment by sending a job description to NHS Pensions Fleetwood. Accountant 4
Individual Electoral Registration Frequently asked questions
 Individual Electoral Registration Frequently asked questions 1 Contents Contents... 2 About the change to individual electoral registration... 6 Has the registration system changed?... 6 Who is responsible
Research brief for the AQMeN & ScotCen event Through the public s eye: Researching attitudes on Scotland s constitutional future using the SSA
 Independence and affluence: explaining differences in levels of support for independence by socio-economic status using the Scottish Social Attitudes Survey Christopher McLean, Ipsos MORI Christopher.McLean@ipsos.com
Social Grade A Classification Tool. Bite Sized Thought Piece
 Social Grade A Classification Tool Bite Sized Thought Piece 2009 There are several demographic classification systems used in market research. A well established system, as well as the most widely known
1 The total values reported in the tables and
 1 Recruiting is increasingly social and Adecco wants to know how it works. An international survey, that involved over 17.272 candidates and 1.502 Human Resources managers between March 18 and June 2,
Degrees Open Doors to Success
 Degrees Open Doors to Success Unit 6 National PASS Center 2013 National PASS Center Geneseo Migrant Center 3 Mt. Morris-Leicester Road Leicester, NY 14418 (585) 658-7960 (585) 658-7969 (fax) www.migrant.net/pass
A survey of public attitudes towards conveyancing services, conducted on behalf of:
 A survey of public attitudes towards conveyancing services, conducted on behalf of: February 2009 CONTENTS Methodology 4 Executive summary 6 Part 1: your experience 8 Q1 Have you used a solicitor for conveyancing
GOWER WARD PROFILE. Information, Research & GIS Team, City and County of Swansea, October 2015
 GOWER WARD PROFILE Information, Research & GIS Team, City and County of Swansea, October 2015 Population: 3,600 (source: mid-2013 estimates, rounded - Office for National Statistics / ONS) Councillors
CALCULATIONS & STATISTICS
 CALCULATIONS & STATISTICS CALCULATION OF SCORES Conversion of 1-5 scale to 0-100 scores When you look at your report, you will notice that the scores are reported on a 0-100 scale, even though respondents
NEW JERSEY VOTERS DIVIDED OVER SAME-SEX MARRIAGE. A Rutgers-Eagleton Poll on same-sex marriage, conducted in June 2006, found the state s
 - Eagleton Poll Oct. 25, 2006 CONTACTS: MURRAY EDELMAN, Ph.D., (917) 968-1299 (cell) TIM VERCELLOTTI, Ph.D., (732) 932-9384, EXT. 285; (919) 812-3452 (cell) (Note: News media covering the New Jersey Supreme
RUTGERS-EAGLETON POLL: NEW JERSEY VOTERS SUPPORT GOV. CHRISTIE S CALL FOR GAY MARRIAGE REFERENDUM
 Eagleton Institute of Politics Rutgers, The State University of New Jersey 191 Ryders Lane New Brunswick, New Jersey 08901-8557 www.eagleton.rutgers.edu eagleton@rci.rutgers.edu 732-932-9384 Fax: 732-932-6778
Child Obesity and Socioeconomic Status
 NOO data factsheet Child Obesity and Socioeconomic Status September 2012 Key points There are significant inequalities in obesity prevalence for children, both girls and boys, and across different age
Data Center --> County Data: Education
 Selected Tables Adult Literacy - 1992 Survey Degree-Granting Institutions (added 02/16/07) Elementary and Secondary Educational Expenses (updated 09/18/06) School Lunch Program Expenditures (updated 02/16/07)
Tailor-made training programmes in Bulgaria
 MUTUAL LEARNING PROGRAMME: PEER COUNTRY COMMENTS PAPER - BULGARIA Tailor-made training programmes in Bulgaria Peer Review on Tailor-made training programmes Luxembourg, 23-24 April 2009 A paper submitted
Research into Issues Surrounding Human Bones in Museums Prepared for
 Research into Issues Surrounding Human Bones in Museums Prepared for 1 CONTENTS 1. OBJECTIVES & RESEARCH APPROACH 2. FINDINGS a. Visits to Museums and Archaeological Sites b. Interest in Archaeology c.
Types of Error in Surveys
 2 Types of Error in Surveys Surveys are designed to produce statistics about a target population. The process by which this is done rests on inferring the characteristics of the target population from
Workplace Pension Reform: Multiple Jobholders
 Workplace Pension Reform: Multiple Jobholders July 2013 1 Introduction The analysis presented in this paper is intended to support the passage of the 2013-14 Pensions Bill through Parliament. It provides
Public and Private Sector Earnings - March 2014
 Public and Private Sector Earnings - March 2014 Coverage: UK Date: 10 March 2014 Geographical Area: Region Theme: Labour Market Theme: Government Key Points Average pay levels vary between the public and
Employment and Wages for Alberta Workers with a Post-Secondary Education
 Employment and Wages for Alberta Workers with a Post-Secondary Education Abstract Between 2013 and 2017, Alberta s economy is expected to add approximately 163,000 new jobs. 1 In addition, approximately
Further information on when to use each job role is available in Appendix B
 Appendix C Job Role Staff Group Alphabetical List Further information on when to use each job role is available in Appendix B Job Role Staff Group Accountant Advanced Practitioner Advanced Practitioner
Gender inequalities in South African society
 Volume One - Number Six - August 2001 Gender inequalities in South African society South Africa's national policy framework for women's empowerment and gender equality, which was drafted by the national
Public Attitudes Survey
 An Garda Síochána Public Attitudes Survey Garda.ie CONTENTS 1 Executive Summary 3 Introduction 9 Victims of crime 13 Satisfaction with the service provided to the local community 16 Priorities for An Garda
Mode and Patient-mix Adjustment of the CAHPS Hospital Survey (HCAHPS)
") Mode and Patient-mix Adjustment of the CAHPS Hospital Survey (HCAHPS) April 30, 2008 Abstract A randomized Mode Experiment of 27,229 discharges from 45 hospitals was used to develop adjustments for the
Mode and Patient-mix Adjustment of the CAHPS Hospital Survey (HCAHPS) April 30, 2008 Abstract A randomized Mode Experiment of 27,229 discharges from 45 hospitals was used to develop adjustments for the
PURPOSE OF GRAPHS YOU ARE ABOUT TO BUILD. To explore for a relationship between the categories of two discrete variables
 3 Stacked Bar Graph PURPOSE OF GRAPHS YOU ARE ABOUT TO BUILD To explore for a relationship between the categories of two discrete variables 3.1 Introduction to the Stacked Bar Graph «As with the simple
Will 16 and 17 year olds make a difference in the referendum?
 Will 16 and 17 year olds make a difference in the referendum? 1 Author: Jan Eichhorn Date: xx/11/2013 Comparisons between the newly enfranchised voters and the adult population 2 ScotCen Social Research
Survey of DC pension scheme members
 Survey of DC pension scheme members A research report on understanding, engagement and perception among members of defined contribution (DC) occupational and work-based personal pension schemes Contents
Application to vote by emergency proxy based on disability. How do I apply to vote by proxy? Voting by proxy
 How do I apply to vote by proxy? 1 You must ask someone if they are willing and able to be your proxy and vote on your behalf. Please note that a person can only be the proxy for close relatives and up
[5.2.1] List of Flat-Rate Schedule E Expenses
![[5.2.1] List of Flat-Rate Schedule E Expenses](/thumbs/37/17724897.jpg "[5.2.1] List of Flat-Rate Schedule E Expenses") [5.2.1] List of Flat-Rate Schedule E Expenses A list of flat-rate Schedule E expenses deductions for 2011 et seq is attached. Reviewed June2015 NOTE: Expenses deductions to be apportioned on a time basis
[5.2.1] List of Flat-Rate Schedule E Expenses A list of flat-rate Schedule E expenses deductions for 2011 et seq is attached. Reviewed June2015 NOTE: Expenses deductions to be apportioned on a time basis
What the Commission Doesn t Tell You: New Thinking on Pay Equity
 What the Commission Doesn t Tell You: New Thinking on Pay Equity OMHRA Fall Conference - September 15, 2011 What we are going to cover 2 review Pay Equity mechanics and municipal sector obligations to
Chapter 5 Analysis of variance SPSS Analysis of variance
 Chapter 5 Analysis of variance SPSS Analysis of variance Data file used: gss.sav How to get there: Analyze Compare Means One-way ANOVA To test the null hypothesis that several population means are equal,
2014 Alberta Labour Mobility Survey
 2014 Alberta Labour Mobility Survey Survey results on the Labour Mobility of Out-of-Province Certified Individuals to Alberta in 2014 Domestic and International Labour Mobility Unit Workforce Strategies
PROPERTY TAX SOLUTIONS
 POLLING INSTITUTE Contact: PATRICK MURRAY 732-263-5858 (office) 732-979-6769 (cell) pdmurray@monmouth.edu Embargoed to: Sunday, July 23, 2006, 5:30 am This poll was conducted by the Monmouth University
New Scientist/SRG Salary Survey 2013
 New Scientist/SRG Salary Survey 2013 Contents + Background + Objectives + Methodology + Executive Summary + Respondent Profile + Main Findings + Summary of Findings + Appendix Background & objectives +
STAT/MATH 3379: Dr. Manage Chapter Assignment Chapter 1: The Nature of Statistics-Solutions
 STAT/MATH 3379: Dr. Manage Chapter Assignment Chapter 1: The Nature of Statistics-Solutions 1. statistics consists of methods for estimating and drawing conclusions about population characteristics based
Employment Application
 Employment Application 1512 7TH STREET * CITY OF CORALVILLE * CORALVILLE, IOWA 52241 We consider applicants for all positions without regard to race, color, religion, sex, national origin, age, marital
Great Britain (Numbers) All People 194,000 6,076,500 63,258,400 Males 97,000 2,993,400 31,165,300 Females 97,000 3,083,100 32,093,100
 All People 194,000 6,076,500 63,258,400 Males 97,000 2,993,400 31,165,300 Females 97,000 3,083,100 32,093,100") Labour Market Profile - The profile brings together data from several sources. Details about these and related terminology are given in the definitions section. Resident Population Total population (2015)
Labour Market Profile - The profile brings together data from several sources. Details about these and related terminology are given in the definitions section. Resident Population Total population (2015)
Adult Apprenticeships
 Department for Business, Innovation and Skills Skills Funding Agency National Apprenticeship Service Adult Apprenticeships Estimating economic benefits from apprenticeships Technical paper FEBRUARY 2012
Disability Rights Commission Disability Briefing June 2005
 Disability Rights Commission Disability Briefing June 2005 Contents Page Introduction 1 Definitions of disability used in the LFS 2 Some Key Facts and Figures 3 Section 1: Autumn 2004 Data 5 Table 1: Economic
Kirklees (Numbers) All People 434,300 5,390,600 63,258,400 Males 215,000 2,658,400 31,165,300 Females 219,400 2,732,200 32,093,100. Kirklees (Numbers)
 All People 434,300 5,390,600 63,258,400 Males 215,000 2,658,400 31,165,300 Females 219,400 2,732,200 32,093,100. Kirklees (Numbers)") Labour Market Profile - The profile brings together data from several sources. Details about these and related terminology are given in the definitions section. Resident Population Total population (2015)
Labour Market Profile - The profile brings together data from several sources. Details about these and related terminology are given in the definitions section. Resident Population Total population (2015)
The test uses age norms (national) and grade norms (national) to calculate scores and compare students of the same age or grade.
 and grade norms (national) to calculate scores and compare students of the same age or grade.") Reading the CogAT Report for Parents The CogAT Test measures the level and pattern of cognitive development of a student compared to age mates and grade mates. These general reasoning abilities, which
Reading the CogAT Report for Parents The CogAT Test measures the level and pattern of cognitive development of a student compared to age mates and grade mates. These general reasoning abilities, which
Easy Read summaryummary
 Easy Read summaryummary Mental Capacity Act 2005 - A Summary Mental capacity means being able to make your own decisions The Mental Capacity Act 2005 will help people to make their own decisions. The Mental
CHAPTER 15 NOMINAL MEASURES OF CORRELATION: PHI, THE CONTINGENCY COEFFICIENT, AND CRAMER'S V
 CHAPTER 15 NOMINAL MEASURES OF CORRELATION: PHI, THE CONTINGENCY COEFFICIENT, AND CRAMER'S V Chapters 13 and 14 introduced and explained the use of a set of statistical tools that researchers use to measure
The monthly Remuneration Received by each of the Faculties/Officers and Employees (as on 15 th October 2014).
.") The monthly Remuneration Received by each of the Faculties/Officers and Employees (as on 15 th October 2014). Faculties of AIIMS Sl. Designation Pay Scale 6 th CPC No. 1. Director Rs.80000 (Fixed)+NPA
The monthly Remuneration Received by each of the Faculties/Officers and Employees (as on 15 th October 2014). Faculties of AIIMS Sl. Designation Pay Scale 6 th CPC No. 1. Director Rs.80000 (Fixed)+NPA
SOME KEY FACTORS CONSIDERED BY STUDENTS IN ELECTING TO STUDY ENGINEERING. Brendan C. O Kelly
 SOME KEY FACTORS CONSIDERED BY STUDENTS IN ELECTING TO STUDY ENGINEERING Brendan C. O Kelly Department of Civil, Structural and Environmental Engineering, Trinity College Dublin, Ireland E-mail: bokelly@tcd.ie
NHSScotland Staff Survey 2014. National Report
 NHSScotland Staff Survey 2014 National Report December 2014 Contents 1 Introduction... 4 2 Background... 4 2.1 Survey purpose... 4 2.2 Policy context... 4 3 Survey methodology... 6 4 Response rates...
Introduction to Quantitative Research Contact: tel 01296 680374
 Introduction to Quantitative Research Quantitative Research Quantification - i.e. numbers e.g 51% of the population is female 74% of households have a washing machine 33% strongly agree with the statement.
2015 Michigan Department of Health and Human Services Adult Medicaid Health Plan CAHPS Report
 2015 State of Michigan Department of Health and Human Services 2015 Michigan Department of Health and Human Services Adult Medicaid Health Plan CAHPS Report September 2015 Draft Draft 3133 East Camelback
Techniques for data collection
 Techniques for data collection Technical workshop on survey methodology: Enabling environment for sustainable enterprises in Indonesia Hotel Ibis Tamarin, Jakarta 4-6 May 2011 Presentation by Mohammed
How does education after high school affect my job opportunities and the money I ll make? Approx. 45 minutes I. Warm Up: Why College?
 The Value of a Degree 3 CAREERS The BIG Idea How does education after high school affect my job opportunities and the money I ll make? AGENDA Approx. 45 minutes I. Warm Up: Why College? (10 minutes) II.
ITEM FOR ESTABLISHMENT SUBCOMMITTEE OF FINANCE COMMITTEE
 For discussion on 17 June 2010 EC(2010-11)9 ITEM FOR ESTABLISHMENT SUBCOMMITTEE OF FINANCE COMMITTEE APPLICATION OF THE FINDINGS OF THE 2009 STARTING SALARIES SURVEY TO CONCERNED CIVILIAN GRADES IN THE
Hoover Institution Golden State Poll Fieldwork by YouGov October 3-17, 2014. List of Tables. 1. Family finances over the last year...
 List of Tables 1. Family finances over the last year............................................................ 2 2. Family finances next six months............................................................
Attitudes to Mental Illness - 2011 survey report
 Attitudes to Mental Illness - 2011 survey report Copyright 2011, The Health and Social Care Information Centre. All Rights Reserved. 1 Acknowledgements This document was published by the NHS Information
Fastest Growing Occupations 2008 2018
 Fastest Growing Occupations Fifty five percent of the top 20 fastest growing occupations pay over $15.00 an hour. Almost all of the top 20 fastest growing occupations require some type of education or
Jobs That Are Exempt As a Result of the FLSA
 Workers Compensation Issues/independent contractors and misclassification Most jobs are governed by the FLSA. Some are not. Some jobs are excluded from FLSA coverage by statute. Other jobs, while governed
Technical Information
 Technical Information Trials The questions for Progress Test in English (PTE) were developed by English subject experts at the National Foundation for Educational Research. For each test level of the paper
Sussex Secure and Forensic Service Career opportunities
 Sussex Secure and Forensic Service Career opportunities Transforming lives We are based in a new, purpose-built centre in Hellingly, East Sussex. Our staff are drawn from across the South East including
GAS TAX REFERENDUM 51 GAINS GROUND; INITIATIVE 776 REJECTED
 GAS TAX REFERENDUM 51 GAINS GROUND; INITIATIVE 776 REJECTED * EXCLUSIVE SURVEYUSA RESEARCH RESULTS * YOU MUST CREDIT SURVEYUSA IF YOU AIR, CITE OR REPRINT THESE RESULTS IN WHOLE OR PART HERE ARE SOME OF
Phone: 020 79115334 Email: j.tripney@ioe.ac.uk
 Title Registration for a Systematic Review: Post-basic technical and vocational education and training (TVET) interventions to improve employability and employment of TVET graduates in low- and middle-income
2. THE ECONOMIC BENEFITS OF EDUCATION
 2. THE ECONOMIC BENEFITS OF EDUCATION How much more do tertiary graduates earn? How does education affect employment rates? What are the incentives for people to invest in education? What are the incentives
VOTER TURNOUT IN THE 2011 PROVINCIAL ELECTION: A SURVEY OF VOTERS AND NON-VOTERS
 VOTER TURNOUT IN THE 2011 PROVINCIAL ELECTION: A SURVEY OF VOTERS AND NON-VOTERS March 29, 2012 Prepared for: Elections Manitoba WINNIPEG OTTAWA EDMONTON REGINA admin@pra.ca www.pra.ca Elections Manitoba
SCAT Application. (1) SCAT Eligibility Questionnaire Form and (2) Professional Verification Form
 SCAT Eligibility Questionnaire Form and (2) Professional Verification Form") The has two different forms and both forms must be completed and received by GTA either prior to the in-person interview, or brought to the interview: (1) SCAT Eligibility Questionnaire Form and (2) Professional
The has two different forms and both forms must be completed and received by GTA either prior to the in-person interview, or brought to the interview: (1) SCAT Eligibility Questionnaire Form and (2) Professional
Educational Pathways of Leaders: an international comparison Findings of a 30 Country Study of Professional Leaders
 Educational Pathways of Leaders: an international comparison Findings of a 30 Country Study of Professional Leaders Creating effective solutions to global challenges will require a range of skills from
Business Statistics: Chapter 2: Data Quiz A
 CHAPTER 2 Quiz A Business Statistics, 2nd ed. 2-1 Business Statistics: Chapter 2: Data Quiz A Name 1. The mission of the Pew Internet & Life Project is to explore the impact of the Internet on families,
Scientific Method. 2. Design Study. 1. Ask Question. Questionnaire. Descriptive Research Study. 6: Share Findings. 1: Ask Question.
 Descriptive Research Study Investigation of Positive and Negative Affect of UniJos PhD Students toward their PhD Research Project : Ask Question : Design Study Scientific Method 6: Share Findings. Reach
Survey to Doctors in England End of Life Care Report prepared for The National Audit Office
 Survey to Doctors in England End of Life Care Report prepared for The National Audit Office 1 2008, medeconnect Table of Contents 1 SUMMARY OF FINDINGS... 3 2 INTRODUCTION... 5 3 RESEARCH OBJECTIVES AND
Sydney West and Blue Mountains
 Slide 1 Sydney West and Blue Mountains Priority Employment Area 9 May 2014 Presenter: Ivan Neville Branch Manager Labour Market Research and Analysis Branch www.employment.gov.au Slide 2 Sydney West and
MEDICAL EQUIPMENT TECHNICIAN 1
 MEDICAL EQUIPMENT TECHNICIAN 1 GENERAL Employees in this class are required, under the general direction of higher graded technicians, to install, maintain and repair medical home care equipment. TYPICAL
Market Research Analyst
 Market Research Analyst Introduction Market research analysts explain the results of surveys such as questionnaires and opinion polls. They process, analyse and present information in statistical and report
International Republican Institute: Turkish Public Opinion Survey May 8 16, 2010. Harris Interactive
 International Republican Institute: Turkish Public Opinion Survey May 8 16, 2010 Harris Interactive 1 Methodology This report is a summary of data from a survey conducted May 8 16, 2010 by Infakto Research
JHSPH HUMAN SUBJECTS RESEARCH ETHICS FIELD TRAINING GUIDE
 JHSPH HUMAN SUBJECTS RESEARCH ETHICS FIELD TRAINING GUIDE This guide is intended to be used as a tool for training individuals who will be engaged in some aspect of a human subject research interaction
National Quali cations SPECIMEN ONLY
 H National Qualications SPECIMEN ONLY SQ41/H/01 Sociology Date Not applicable Duration 2 hours Total marks 60 SECTION 1 HUMAN SOCIETY 20 marks Attempt ALL parts of the question. SECTION 2 CULTURE AND IDENTITY
Civil Surgeon 10000-15150 16650-23200 a Dental Civil Surgeon 10000-15150 16650-23200
 27. Health Services Director of Health Services 16300-19900 26600-33750 Additional Director of Health Services 14300-18300 25400-33100 Deputy Director of Health Services 14000-18000 23200-31150 District
Trust and confidence in charities
 ` Trust and confidence in charities An overview of the existing evidence Joy Dobbs 1. Background and aims This report summarises a short piece of work reviewing the current evidence about levels of public
THE CAYMAN ISLANDS LABOUR FORCE SURVEY REPORT SPRING 2015
 THE CAYMAN ISLANDS LABOUR FORCE SURVEY REPORT SPRING 2015 Published September 2015 Economics and Statistics Office i CONTENTS SUMMARY TABLE 1. KEY LABOUR FORCE INDICATORS BY STATUS... 1 SUMMARY TABLE 2.
Answers: a. 87.5325 to 92.4675 b. 87.06 to 92.94
 1. The average monthly electric bill of a random sample of 256 residents of a city is $90 with a standard deviation of $24. a. Construct a 90% confidence interval for the mean monthly electric bills of
MARKETING RESEARCH AND MARKET INTELLIGENCE (MRM711S) FEEDBACK TUTORIAL LETTER SEMESTER `1 OF 2016. Dear Student
 FEEDBACK TUTORIAL LETTER SEMESTER `1 OF 2016. Dear Student") MARKETING RESEARCH AND MARKET INTELLIGENCE (MRM711S) FEEDBACK TUTORIAL LETTER SEMESTER `1 OF 2016 Dear Student Assignment 1 has been marked and this serves as feedback on the assignment. I have included
MARKETING RESEARCH AND MARKET INTELLIGENCE (MRM711S) FEEDBACK TUTORIAL LETTER SEMESTER `1 OF 2016 Dear Student Assignment 1 has been marked and this serves as feedback on the assignment. I have included
Estimating domestic workers, home-based workers, street vendors and waste pickers in India
 Estimating domestic workers, home-based workers, street vendors and waste pickers in India 1. Introduction: why improved methods are critical? In a policy brief, Global and Regional Estimates on Domestic
The Irish Health Behaviour in School-aged Children (HBSC) Study 2010
 Study 2010") The Irish Health Behaviour in School-aged Children (HBSC) Study 2 ii The Irish Health Behaviour in School-aged Children (HBSC) Study 2 February 212 Colette Kelly, Aoife Gavin, Michal Molcho and Saoirse
The Irish Health Behaviour in School-aged Children (HBSC) Study 2 ii The Irish Health Behaviour in School-aged Children (HBSC) Study 2 February 212 Colette Kelly, Aoife Gavin, Michal Molcho and Saoirse
THE INDEPENDENT AND NON-PARTISAN STATEWIDE SURVEY OF PUBLIC OPINION ESTABLISHED IN 1947 BY MERVIN D. FiElD.
 THE INDEPENDENT AND NON-PARTISAN STATEWIDE SURVEY OF PUBLIC OPINION ESTABLISHED IN 1947 BY MERVIN D. FiElD. 234 Front Street San Francisco 94111 (415) 392-5763 COPYRIGHT 1982 BY THE FIELD INSTITUTE. FOR
List of Organisations represented in the Consultation Forums of the Task Force. Forum for Main Staff Consultative Councils/Bodies
 Appendix V List of Organisations represented in the Consultation Forums of the Task Force (I) Forum for Main Staff Consultative Councils/Bodies Date : 3 June 2002 2:30 p.m. 4:30 p.m. Venue : Hong Kong
Accredited training courses for safety and health representatives. Annual report 2014-15
 Accredited training courses for Annual report 2014-15 The Commission for Occupational Safety and Health criteria for accreditation require each provider of an accredited training course for to submit an
European Union Referendum Bill 2015 House of Commons Second Reading briefing
 European Union Referendum Bill 2015 House of Commons Second Reading briefing 9 June 2015 Introduction This briefing sets out the Electoral Commission s view on key issues arising from the European Union
ISCO-08 and health occupations
 ISCO-08 and health occupations David Hunter Department of Statistics International Labour Office 1 International Standard Classification of Occupations (ISCO-08) Endorsed by the ILO Governing Body in 2008
Attitudes of the over 50s to Fuller Working Lives
 Attitudes of the over 50s to Fuller Working Lives January 2015 DWP ad hoc research report no. 15 A report of research carried out by YouGov PLC on behalf of the Department for Work and Pensions Crown copyright
behavior research center s
 behavior research center s behavior research center s NEWS RELEASE [RMP 2012-III-01] Contact: Earl de Berge Research Director 602-258-4554 602-268-6563 OBAMA PULLS EVEN WITH ROMNEY IN ARIZONA; FLAKE AND
EMPLOYABILITY TRENDS
 Fabrizio Carmignani Associate Professor, BCom Programme Director (Nathan) Economics, Griffith Business School EMPLOYABILITY TRENDS Plan of campaign Some background on employment projections Australia medium
PCC Elections Campaign Tracking Research. Report for: TNS BMRB. Controlled document - Issue 4 JN 113244 TNS 2013 15/2/2013
 PCC Elections Campaign Tracking Research Report for: Controlled document - Issue 4 TNS BMRB TNS 2013 15/2/2013 JN 113244 Contents Executive Summary... 1 1. Background and objectives... 12 2. Methodology...
Regional characteristics of foreignborn people living in the United Kingdom
 Regional characteristics of foreignborn people living in the United Kingdom By Alice Reid and Caroline Miller, Office for National Statistics Abstract This article examines the characteristics of foreign-born