iseries WebSphere Performance Tips and Techniques
|
|
|
- Estella McKinney
- 9 years ago
- Views:
Transcription
1 Session: : 26CO Tuesday 3:30pm-4:45pm 7 WebSphere Performance Tips and Techniques Rick Peterson 8 Copyright Corporation, All Rights Reserved. This publication may refer to products that are not currently available in your country. makes no commitment to make available any products referred to herein. Rick Peterson [email protected] rmp _was_tips_Common_Spring2001_external.PRZ 1 07/18/01

2 Agenda What is WebSphere? Performance and Capacity Planning process System Level Optimization WebSphere Application Server Tuning Application Coding Tips Application Analysis tools Performance Results Websites/References Backup charts TM Understanding Java on Optimizing the Java Environment PTDV Tool Details rmp _was_tips_Common_Spring2001_external.PRZ 2 07/18/01

3 WebSphere Overview What is WebSphere Application Server? rmp _was_tips_Common_Spring2001_external.PRZ 3 07/18/01

4 What is WebSphere Advanced 3.5? WebSphere Advanced 3.5 is 's Application Server for Java, supporting Servlets and Java Server Pages in addition to Enterprise JavaBeans rmp _was_tips_Common_Spring2001_external.PRZ 4 07/18/01

5 Road map to e-business 1. Web Presence - Static Content - static HTML 2. Dynamic Site - Dynamic Content - CGI, servlets, JSP 3. Transactional Site - Transactional Content - EJB, scalability rmp _was_tips_Common_Spring2001_external.PRZ 5 07/18/01

6 and WebSphere & Java Performance Optimization Steps rmp _was_tips_Common_Spring2001_external.PRZ 6 07/18/01

7 Overall tuning process Prerequisite: Ensure adequate system resources: Sufficient processor power MHz and L2 cache are more important than CPW Sufficient memory No I/O bottlenecks To achieve optimal performance and stability: Step 1 - System Level Optimization for WebSphere Step 2 - Optimize Java Environment Step 3 - Tune WebSphere Step 4 - Analyze and tune application code Step 5 - Load and/or stress testing to prove the expected benefit rmp _was_tips_Common_Spring2001_external.PRZ 7 07/18/01

8 Notes: Overall Tuning Process Prerequisite - Ensure adequate system resources Sufficient processor power - there is no substitute for both a fast processor, L2 cache and CPW. Sufficient memory. No IO bottlenecks - this should be obvious Use Workload Estimator to determine right system Prefer V4R5/V4R4 models - avoid 150s, 250s. Northstar and Condor only. Minimum (460CPW), 4MB L2 Choose with most L2 cache In order of most influence: Processor speed in MHz Size of L2 cache CPW rating Step 1. Understand the Java environment on the system Step 2. Optimize OS/400 environment for Java Use latest version of WebSphere including fix pack(s) Run latest version of OS/400 - maintain OS current and load latest Java PTFs See separate foil for 6 values. Step 3. Optimize Java Environment Set Java heap size As with almost all programming languages, Java has a memory area known as the heap. This is a region of memory in which new objects are created and stored. Normally in Java, we do not need to know (and do not have direct access to) the exact contents of the heap. We are only interested in objects which are in scope at the time. When you are trying to track down specific problems like memory leaks, it is useful to be able to see what is happening within the JVM. Use DMPJVM Consider executing the JVM in verbose mode for class and garbage Use Resource Analyzer rmp _was_tips_Common_Spring2001_external.PRZ 8 07/18/01
 Run latest version of OS/400 - maintain OS current and load latest Java PTFs See separate foil for 6 values.")
9 Notes: (continued) Step 4. WebSphere System Queues Identify the WebSphere System Queues used in your production environment - Network, web, servlet engine, EJB, data source Adjust queue settings using the Max. Application Concurrency value as a reference point Queue upstream, preferably in the network Readjust queues for access patterns Readjust queues after adding additional s in a cluster Step 5. Tune Application Application tuning is covered in detail later in the presentation Step 6. Load/Stress testing - See referenced paper below Setting queue sizes Identify a representative and reproducible workload (test application) This will likely require the use of a load generation test tool Draw the throughput curve Use a fixed number of requests to your test application, varying the client load. After each experiment note the throughput, response time, system memory, and CPU utilization Find the saturation point and adjust queues Use Resource Analyzer to understand concurrency in the Servlet Engine Memory Understand how your application is using memory Repeat experiments with fixed workload while varying Java heap parameters Run GCStats.java against output from stderr.log to determine the percentage of time spent in GC Understand if your application is leaking memory Repeat experiments with increasing workloads and fixed heap parameters rmp _was_tips_Common_Spring2001_external.PRZ 9 07/18/01

10 System-level Optimization for WebSphere rmp _was_tips_Common_Spring2001_external.PRZ 10 07/18/01

11 Performance impacts are everywhere Application architecture Capacity and Performance management Application WebSphere OS/400 & Hardware Application Design Application Tuning WebSphere/Java Tuning OS Software tuning Hardware configuration rmp _was_tips_Common_Spring2001_external.PRZ 11 07/18/01

12 Notes: Performance Impact Performance is a balancing act, such that there is an optimum point at which the expenditure of time to measure matches the value of the improvements which may be obtained. Implicit in this statement is a fundamental technique of always looking for the most gains from the least effort Factors which influence the overall system and application performance include: Hardware configuration. Sufficient resources most be present and available to the application System tuning options. Ensure that the system and subsystems make most efficient use of the hardware resources available Application architecture. Critical from the application perspective. The performance of a good architecture even if implemented poorly can frequently be overcome by application tuning, the reverse does not apply. Application design. Poor design and/or implementation can sometimes be overcome by tuning. rmp _was_tips_Common_Spring2001_external.PRZ 12 07/18/01

13 Pick the Right Server and Environment Run the latest release of OS/400 Keep current (load Java PTFs, run latest release you can) Run WebSphere on a that meets CPU requirements Plan for more CPU, main storage for Java Don't expect great performance on an undersized Prefer newer (V4R4 or later) models; avoid 150s, 250s; Newer model at same CPW should beat older model Utilize s which have L2 cache (bigger is better) Utilize s which have higher CPU MHZ (versus just CPW) Use the Workload Estimator to determine the right system rmp _was_tips_Common_Spring2001_external.PRZ 13 07/18/01
 Use the Workload Estimator to determine the right system http://as400service.ibm.com/estimator rmp - 404362_was_tips_Common_Spring2001_external.")
14 Tools for Ensuring adequate system resources Workload estimator: Provides an estimate of the size of hardware required to support a defined load A significant number of defaults used Can accept monitor data from current systems via PM/400 Does not handle LPAR, journalling, response times, locked resources etc. Easy to use Good if you have no idea BEST/1 Uses mathematical techniques to model a defined load executing on specific hardware and estimate the response/throughput Can use performance monitor data as input Models disk, IOP, memory Does not model threads The only sure sizing method is based on load testing rmp _was_tips_Common_Spring2001_external.PRZ 14 07/18/01


15 ebusiness Workload Estimator overview rmp _was_tips_Common_Spring2001_external.PRZ 15 07/18/01
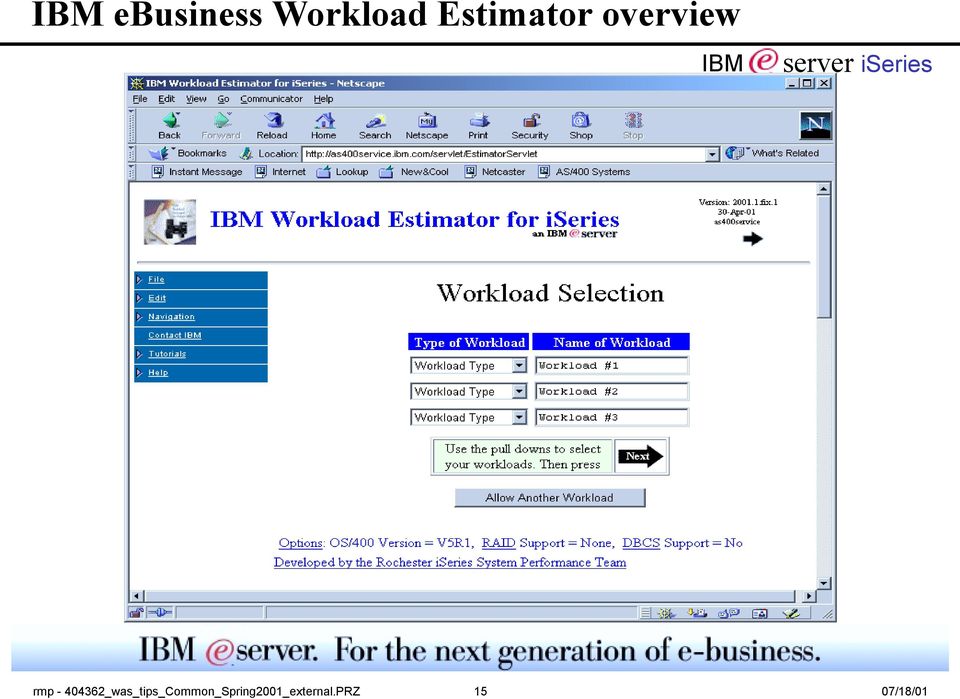
16 Notes Workload Estimator Objectives Provide and BP sales/marketing reps a comprehensive AS/400 sizing tool for new and existing customers interested in deploying new emerging workloads standalone or in combination with their current workloads. Recommendations will be for the most recent hardware Project model, CPU % Utilization, memory, dasd arms and capacity Easy to use, less than dozen questions per application Defaults for applications and system Printed Report with defaults, input parameters and results Estimator is not a capacity planning tool or a configurator Capacity planning tools offer detail modeling from actual system performance data Capacity planning tools will project the response time for specific configurations No support for LPAR, Journaling, response times, locked resources... BEST/1 continues to be available and recommended for final configs Estimator does not provide application response times rmp _was_tips_Common_Spring2001_external.PRZ 16 07/18/01


17 Workload Estimator rmp _was_tips_Common_Spring2001_external.PRZ 17 07/18/01

18 Pick the Right Server and Environment II Use the latest version of WebSphere WebSphere Advanced 3.5 provides better performance than 3.0 or 2.0 Load the latest WebSphere fix pack Throughput (trans/sec) Trade EJB WS WS WS /2385 V4R5 rmp _was_tips_Common_Spring2001_external.PRZ 18 07/18/01

19 Where are we tuning the application? Each user click may represent zero to many client/ conversations This area + + CPU Service & Queuing Disk I/O Single User Possible Multitasking Network Multi-user Multitasking CPU Service CPU Queuing Memory Disk I/O Multi-user Multitasking Include Asynchronous Processing Locks Seizes rmp _was_tips_Common_Spring2001_external.PRZ 19 07/18/01

20 Notes: Where are we tuning This covers a set of high-level measurements, which will allow for the ongoing assessment of the adequacy of the installed resources. Such measurements may also provide the initial indication of areas where more detailed performance measurements should be taken. In general such ongoing measurements should have little impact on the overall system resource usage. Detailed measurements to determine the cause of specific anomalies are likely to have greater impact on the overall resource use within the system. Performance is a critical component of customer satisfaction. As an application is constructed, the software architects should be aware of performance-critical areas. Likewise, after an application is deployed, the environment should be monitored and if necessary tuned to ensure the best possible performance. Target - One of either: Ensure that user-driven load is handled with the required response Maximize throughput for the defined environment Comments: To maximize throughput, there must be no bottlenecks (resource constraints) When there are no bottlenecks, then reducing application resource requirement is the only way of improving overall throughput rmp _was_tips_Common_Spring2001_external.PRZ 20 07/18/01

21 Performance Behavior Traditional applications Low percentage high level language instructions Large percentage systems services (Data Base Get Records) 2 ways to improve performance: improves OS/400 Customer improves how application uses system resources Java applications Higher percentage of high level language instructions Lower percentage use of operating system services Computational performance of Java becomes more important Java Virtual Machine (JVM) and translation facilities Potentially inefficient coding practices have greater impact Portability has its price Less able to take account of environment-specific performance capabilities Performance penalties disappearing with time Still slower than traditional rmp _was_tips_Common_Spring2001_external.PRZ 21 07/18/01
22 Notes: Performance Behavior The performance of a application is a combination of program instruction execution and access to system services. If you have a client- application you also have to take into consideration the network. Access to system services typically involves accessing databases. Traditionally, the AS/400 system has been an excellent performer within the commercial environment. Typical RPG, COBOL, or C commercial applications have performance profiles where fewer resources are spent processing high level language program instructions than system services such as database processing. A commercial Java application is expected to have a similar profile, but currently, the Program Instructions portion is proportionately higher, implying that more time is spent executing machine instructions compared to performing system activities such as database I/Os. Since more time is spent executing machine instructions in a typical Java application you need the tools to help you analyze those Java programs. Later in the presentation we shall describe the tools available. Why do we need to be concerned specifically with Java? Once the basic OS/400 and WebSphere tuning options have been taken, there is little at the subsystem level that can be accomplished Need to then analyze at the application level All WebSphere applications are written in Java What is it about Java that requires the more in-depth evaluation? Not Java specifically, but the fact that Java is the programming language for WAS applications The fact that threads are in extensive use The complex interlinkage of modules within an OO environment requires a high degree of understanding of how the various components interact Certain language features, for example using 'string' vs.. 'stringbuffer' will cause higher numbers of object creates rmp _was_tips_Common_Spring2001_external.PRZ 22 07/18/01
23 Keep OS/400 current Load latest CUM package and PTFs OS/400 Java WebSphere Toolbox DB2/400 rmp _was_tips_Common_Spring2001_external.PRZ 23 07/18/01
24 Set OS/400 System Values Change System Values MAXACT for the *BASE pool Increasing this value will reduce or eliminate thread transitions into the ineligible state. Initial choice of value should be (arbitrarily) high, then as implementation proceeds, monitor, and decrease the value if thought necessary. Consider a separate pool if non-java work in *BASE QACTJOB (Initial number of active jobs) Increase to 400 (from default of 20) QADLACTJ (Additional number of active jobs) Increase to 50 (from default of 10) QADLTOTJ (Additional number of total jobs) Increase to 50 (from default of 10) QTOTJOB Increase to 1000 (from default of 35) QMAXACTLVL Ensure is at *NOMAX QPRCMLTTSK Make sure is set to 1 (On) rmp _was_tips_Common_Spring2001_external.PRZ 24 07/18/01
25 Notes: OS/400 System Values Change the Max Active (MAXACT) parameter for the *BASE pool The maximum number of threads that can use the processor concurrently.if the activity level is too low, the threads may transition to the ineligible condition. If the activity level is too high, excessive page faulting may occur. Each storage pool in the AS/400 system has a parameter that is used as a governor to avoid having too many jobs or threads executing simultaneously. This parameter is called Max Active, or maximum active jobs/threads. This value can be changed for all storage pools with the exception of the *MACHINE pool. The system default for the Max Active value is set fairly small. It is important to increase this value for systems that are executing a large number of threads. If set too low, may slowdown or even hang the system. Note. The value applies to number of threads not jobs To increase this value, simply use the WRKSYSSTS system command. Find the pool which is used to run the jobs/threads (often the *BASE pool). To look for the pool name, press the F11 key twice. Increase the Max Active setting to a number large enough to run all the jobs and threads active in the environment. Increasing this value will reduce or eliminate thread transitions into the ineligible state. *NOMAX can work well, if used with MAXJOBS Consider creating a special pool for Java/WebSphere work, if substantial traditional code also runs in the *BASE pool. QACTJOB Initial number of active jobs. Specifies the initial number of active jobs for which storage is allocated during initial program load (IPL). An active job is a job that has started running but has not ended. The amount of storage allocated for each active job is approximately 110K. This storage is in addition to the storage allocated using the system value QTOTJOB. A change to this system value takes effect at the next IPL. The shipped value is 20. A reasonable value to assign to QACTJOB is your estimate of the number of active jobs on a typically heavy-use day. This can be done by viewing the active job field on the active jobs display (WRKACTJOB command). Set this value high enough so that storage does not need to be allocated for additional active jobs using the system value QADLACTJ. QADLACTJ Additional active jobs. Specifies the additional number of active jobs that need storage allocated when the initial number of active jobs (the system value QACTJOB) is reached. An active job is a job that has started running but has not ended. Auxiliary storage is allocated whenever the number of active jobs exceeds the storage which has already been allocated. The amount of storage allocated for each job is approximately 110K. A change to this system value takes effect immediately. Setting the number close to 1 can cause frequent interruptions when many additional jobs are needed. The number should not be set too high because the time required to add additional storage should be minimized. QADLTOTJ Additional total jobs. Specifies the additional number of jobs that need storage allocated when the initial number of jobs (the system value QTOTJOB) is reached. Auxiliary storage is allocated whenever the number of jobs in the system exceeds the number for which storage has been allocated. A change to this system value takes effect immediately. rmp _was_tips_Common_Spring2001_external.PRZ 25 07/18/01
26 Notes: (ctd.) QTOTJOB Total number of jobs. Specifies the initial number of jobs for which auxiliary storage is allocated during IPL. The number of jobs is the number supported by the system at any one time, which includes the jobs on job queues, active jobs (including systemjobs), and jobs having output on output queues. A change to this system value takes effect at the next IPL. To find the number of total jobs in the system, view the jobs in the system field on the system status display (WRKSYSSTS command). A reasonable value to assign to QTOTJOB is 2 to 7 times the value used for QACTJOB, depending on how often you clear your output queue. Set this value high enough so that additional storage does not need to be allocated. QMAXACTLVL Maximum activity level of the system. This is the number of threads that can compete at the same time for main storage and processor resources. For all active subsystems, the sum of all threads running in all storage pools cannot exceed QMAXACTLVL. If a thread cannot be processed because the activity level has been reached, the thread is held until another thread reaches a time slice end or along wait. A change to this system value takes effect immediately. For all active subsystems, the sum of all threads running in all storage pools cannot exceed QMAXACTLVL. This value should be larger than the sum of the activity levels for all your storage pools. If QMAXACTLVL is smaller, activity levels in the storage pools may not be used. QPRCMLTTSK Processor multi-tasking. This system value allows you to turn on and turn off Processor multi-tasking capability. If enabled, more than one set of task data will be resident in each CPU. Some workloads may experience increased performance due to caching implications. Turning this value of can have a detrimental effect on Java performance. Typically % impact. rmp _was_tips_Common_Spring2001_external.PRZ 26 07/18/01
27 OS/400 Subsystem Settings - Database Jobs Increase the number of QSQSRVR initial jobs (Native JDBC) Use a value equal to the approximate number of expected concurrent transactions, plus something for the Application Server. Used for Native JDBC, default 5 CHGPJE SBSD(QSYS/QSYSWRK) PGM(QSYS/QSQSRVR) Increased number slightly increases overhead Ensure maximum number of uses is at default (200) Increase the number of QZDASOINIT initial jobs (Toolbox) Used for Toolbox JDBC, default 1 CHGPJE SBSD(QSYS/QSERVER) PGM(QIWS/QZDASOINIT) Same rules as above rmp _was_tips_Common_Spring2001_external.PRZ 27 07/18/01
28 Notes: OS/400 subsystem settings Increase number of QSQSRVR initial jobs if you are using the native JDBC driver Poor performance can be a problem for applications that attempt to establish a relatively large number of connections in a short period of time. This is especially true if the AS/400 system has not been tuned for performance. Java database accesses using the native JDBC driver require a pre-started job (PSJ), also known as a job -- QSQSRVR -- to process the statements. The default system settings for this job work fine for many environments, but for frequent connect/disconnect workloads the settings should be changed. The defaults are 5 initial jobs started, a threshold (minimum number of jobs available) of 2, and 2 additional jobs added for each threshold exceeded. To determine what the PSJ settings are for the system, type WRKSBS and <enter>, then display the subsystem description for the QSYSWRK subsystem by typing a 5 next to the QSYSWRK entry and <enter>. To look at the prestart job entry information, type 10 and <enter>. Then, to look at the QSQSRVR job details, type a 5 next to QSQSRVR and <enter>. To change the QSQSRVR settings, CHGPJE SBSD(QSYS/QSYSWRK) PGM(QSYS/QSQSRVR) and input the appropriate parameters. Keep in mind that increasing the settings will increase the system overhead slightly. Only start the number of jobs that are required for the environment. It is expected that prestart would normally be *YES Increase number of QZDASOINIT initial jobs if you are using the Toolbox JDBC driver The same rules as above applies. To change the QZDASOINIT settings, CHGPJE SBSD(QSYS/QSERVER) PGM(QIWS/QZDASOINIT) and input the appropriate parameters. Keep in mind that increasing the settings will increase the system overhead slightly. Only start the number of jobs that are required for the environment. rmp _was_tips_Common_Spring2001_external.PRZ 28 07/18/01
29 Measuring System Resource Usage Management Central/Collection Services Real Time Analysis PM/400 Trends rmp _was_tips_Common_Spring2001_external.PRZ 29 07/18/01
30 Notes: Measuring System Resources For quick real-time analysis use Management Central or a similar tool. This will provide instant feedback for current CPU usage patterns and is recommended on a live system or a system under load testing. PM/400 provides trend graphs if history is required. This is mainly an option on live systems and can provide resource growth reports. rmp _was_tips_Common_Spring2001_external.PRZ 30 07/18/01
31 Tune WebSphere Application Server rmp _was_tips_Common_Spring2001_external.PRZ 31 07/18/01
32 Tuning WebSphere Queues WebSphere Queues Bigger not necessarily equates to better Testing is the premier way to tune the queues Tune from Back To Front DataSource Servlet Engine HTTP Server Guidelines Set HTTP threads somehow higher than the maximum application concurrency Set the Servlet queue size to a lower value Set the Datasource queue size to an even lower value Excellent Whitepaper: rmp _was_tips_Common_Spring2001_external.PRZ 32 07/18/01
33 Notes: Tuning WebSphere Queues Most computing environments revolvearound the queuing theory - and WebSphere makes no exceptions. As we will see, a single transaction needs to go through a number of queues in WebSphere before being taken to completion. There are two types of queues - open queues and closed queues, depending on whether the number of slots in the queue can grow indefinitely (open queues) or not (closed queues). As with any queuing system - you need to be aware of the following "trade off": the more slots you make available in a queue, the better the service time is likely to be - on the other hand, though, the higher the number of slots, the larger amount of computing resources (memory, CPU) the queue is likely to use. That's why it is important to assign a "fair" value to the number of slots in WebSphere's queues. Value that are too low would result in a long service time (and therefore impact response time and throughput) - values that are too high, may cause an unnecessary allocation of computing resources that won't therefore be available to perform other work (such as the processing in the Application Server) - and this situation can severely impact performance. rmp _was_tips_Common_Spring2001_external.PRZ 33 07/18/01
34 WebSphere Queue Overview Web Server Servlet Engine Data Source Clients Database HTTP Server Administration Use the Admin Console to change MaxConnections Use the Admin Console to change Maximum Connections Pool Size rmp _was_tips_Common_Spring2001_external.PRZ 34 07/18/01
35 Notes: WebSphere Queue Overview The chart shows the overall structure of WebSphere queuing mechanisms. Three queues are involved in the process and they are all "closed" The web queue controls how many concurrent http requests can be served The servlet engine queue controls how many concurrent threads can be activated in the servlet engine The data source queue controls how many concurrent database connections can be active at one single time. It is a good practice to tune the queues "from back to front" - that is, assigning a decreasing number of available slots as the transactions proceed down to the database. This funneling technique increases the chances that the requests that appear at a certain queue are ready to be processed and reduces the number of requests actually queuing up - at the same time optimizing the allocation of resources. rmp _was_tips_Common_Spring2001_external.PRZ 35 07/18/01
36 Notes: Tuning the queues The HTTP Server's queues can be customized by setting an appropriate value for the maximum number of concurrent threads that you want to allow. It is a good practice to allow for a number somehow higher (but not exceedingly higher) than the maximum "application concurrency" - that is, the maximum number of clients that your environment can manage without experiencing throughput degradation or a prohibitive increase of the response time. Setting this number too high may cause WebSphere to be flooded with a mass of requests that cannot be satisfied. It is better for those requests to "wait outside". The maximum number of concurrent connections a servlet engine is allowed to handle should typically be lower than the total number of http threads, for a couple of reasons. First of all, not all the requests take the same time to be fulfilled. Some requests may be very light and require a limited amount of computing power. Some http requests, depending on the configuration, may end up simply requesting an html page, for instance. Secondly, we want to funnel a smaller number of requests to the next queue, the data source queue, and as we said, ideally we would like to populate that queue with requests that are ready to be served. The Maximum Connection Pool Size that you want to choose depends on two factors: 1) How many clients you expect to be connected and served at the same time 2) How much memory and CPU you want to devote to the queues. There is no easy telling what this number should be - measuring and testing is probably the best way to go about. Keep in mind the following considerations: a data source connection takes 2-4 MB of main storage. In a memory constrained system, this can quickly add up to a significant chunk of the whole available storage - hindering other work on the system. Also, managing the connections takes cpu cycles. There is therefore no need to exaggerate with the max number of connections. Keep also in mind that not all of the requests that get to the servlet engine will generate the same database workload - some requests may in fact not perform any DB I/O at all. Using the resource analyzer, you can measure how many connections were actually used and how long the competing requests had to wait before being granted a connection. Keep the number of connections to a minimum that is compatible with your response time objectives. rmp _was_tips_Common_Spring2001_external.PRZ 36 07/18/01
37 Tuning the HTTP Server Queues rmp _was_tips_Common_Spring2001_external.PRZ 37 07/18/01
38 Tuning the Servlet Queues rmp _was_tips_Common_Spring2001_external.PRZ 38 07/18/01
39 Tuning the Data Source rmp _was_tips_Common_Spring2001_external.PRZ 39 07/18/01
40 WebSphere Tuning Knobs Some easy tuning parameters: Set the initial GC size to: 32MB for 1-2 way systems 256MB for 4-8 way systems 1GB for way systems (Application Server : General : Command Line Arguments) Use value: -Xms32m Change value as necessary Disable Auto Reload or Increase the class re-load interval (Application Server : Servlet Engine : Web Application : Advanced) If unnecessary restarts seen, increase the ping timeout and ping initial timeout (Application Server : Advanced : Ping Timeout, Ping Initial Timeout) Set Standard output and Standard error to " ". (Application Server : General : Standard output, Standard error) rmp _was_tips_Common_Spring2001_external.PRZ 40 07/18/01
41 Notes: WebSphere tuning knobs These recommendations are useful for stable production systems. Setting the initial garbage collection size to 32MB creates a reasonable starting point. The best way to optimize GC is through testing. Too large a setting will cause the garbage collector to run less frequently, but it will need to collect more objects. About seconds between garbage collections should be a good result. Changing the class reload interval reduces the number of times the application scans classes for updates. This can reduce some overhead. Changing the Ping interval determines when the administration believes the application has stopped responding. When this occurs, the administration will restart the application. To avoid this on a busy system, increase the values. Setting the Standard output and Standard error to "" (2 double-quotes) eliminates the writing of logs completely. This reduces overhead because WebSphere is no longer required to synchronize around the file output. This should only be done on a system where no further errors are expected. rmp _was_tips_Common_Spring2001_external.PRZ 41 07/18/01
42 WebSphere Tuning Knobs 2 Session Manager Do not enable persistent sessions unless required by the application (Session Manager : Enable : Enable Persistent Sessions) If persistent sessions are required, enable multi-row sessions and caching (Session Manager : Tuning : Using Multi-row Sessions, Using Cache) Set the base memory value to a number close to the maximum number of active sessions. Ensure that Allow Overflow is enabled (default) (Session Manager : Tuning : Base Memory Size) Security Only turn on security if it is required for the application (Configure Global Settings : Enable Security) If security is enabled, tune the security cache timeout (Configure Global Settings : Security Cache Timeout) rmp _was_tips_Common_Spring2001_external.PRZ 42 07/18/01
43 Notes: Websphere Tuning Knobs 2 Use only persistent sessions if required by the application. In many cases, sessions are not required to be persisted to storage (in fact, this is mostly used for cloning). A performance penalty of % should be expected from using persistent sessions. If Persistent Sessions are required, enable Multi-Row sessions and caching. Set the base memory value to a number close to the average number of active sessions. If there are frequent periods where more sessions are active, increasing the base memory value further may improve performance. Only turn on security if it is required for the application. Enabling security has a substantial performance impact. If security is enabled, tune the security cache timeout for your environment. The larger the value, the better the performance. rmp _was_tips_Common_Spring2001_external.PRZ 43 07/18/01
44 WebSphere Tuning Knobs 3 EJB Container Tune the cache settings (absolute and preferred limits, size, cleanup interval) to avoid passivation of objects. (Application Server : EJBContainer : Advanced) Prepared Statement Cache Set for each data source using XML file datasources.xml file in your [Instance Root]/properties directory. Sample Contents: <data-sources> <data-source name="default DataSource"> <attribute name="statementcachesize" value="1000"/> </data-source> </data-sources> Rule of thumb: Set statementcachesize to: stmtcachesize = (number of stmts per connections) * (max number of connections) rmp _was_tips_Common_Spring2001_external.PRZ 44 07/18/01
45 Notes: WebSphere Tuning Knobs 3 Tune the cache settings (absolute and preferred limits, size, cleanup interval) to avoid passivation of objects. To estimate the required value for the absolute limit property, multiply the number of entity beans active in any given transaction by the total number of concurrent transactions expected. Then add the number of active session bean instances. The property for setting the Prepared Statement Cache Size is specified differently in WebSphere 3.5. This was one of the more significant performance properties in WebSphere and proves to be in WebSphere 3.5 as well. In WebSphere the property was associated with the Application Server and was set in the General tab Command Line Argument field by adding -Dcom.ibm.ejs.dbm.PrepStmtCacheSize=1000. Now, the Prepared Statement Cache is associated with each data source. To specify the property, you need to create a datasources.xml file and put it in your [Instance Root]/properties directory. For example, the default directory would be /Q/UserData/WebASAdv/default/properties. rmp _was_tips_Common_Spring2001_external.PRZ 45 07/18/01
46 WebSphere Tuning Knobs 4 WebSphere Plug-In to HTTP Server Increase the configuration update interval [websphereroot]/properties/bootstrap.properties Property is: ose.refresh.interval Used to inform HTTP Server about new Servlets Default is 10 seconds Higher value gives better performance JSP Engine Reduce Update Checking Frequency by adding an Init parameter to the JSP Servlet (JSP 1.0 and above) (Web Application : JSP 1.0 Processor : Advanced Tab : Init Parameters) Parameter name: mintimebetweenstat Default 1000, Recommended rmp _was_tips_Common_Spring2001_external.PRZ 46 07/18/01
47 Notes: WebSphere Tuning Knobs 4 WebSphere administration tracks a variety of configuration information about WebSphere resources. Some of this information needs to be understood by the web as well, such as URIs pointing to WebSphere resources. This configuration data is pushed to the web via the WebSphere plug-in. This allows new servlet definitions to be added without having to restart any of the WebSphere s. Unfortunately, the dynamic regeneration of this configuration information is an expensive operation. There is a setting in [websphereroot]/properties/bootstrap.properties to change the refresh interval between these updates. The property is ose.refresh.interval. The default value for ose.refresh.interval is 10. Changing this number to a higher value may improve performance. In WebSphere 3.02 and above, the JSP processing engine is implemented as a servlet. The JSP 1.0 servlet is invoked to handle requests destined to all JSP files matching the assigned URL filter, such as /myapp/*.jsp. Each time a JSP file is requested, the corresponding disk file is checked to see if a newer version is available. This can be an expensive operation. Change the interval by adding an Init parameter, mintimebetweenstat, to the JSP Servlet. (Node : Application Server : Servlet Engine : Web Application : JSP 1.0 Processor : Advanced Tab : Init Parameters) The default value is The recommended value is rmp _was_tips_Common_Spring2001_external.PRZ 47 07/18/01
48 The WebSphere settings to leave... Leave these settings alone: Application Server Do not enable tracing unless required for debugging. (Advanced : Trace Specification and Debug : Debug enabled, Object Level Tracing enabled) Do not enable EPM unless you are using it (e.g. for Resource Analyzer). Leave the ping interval at its default value. (Advanced : Ping Interval) On, the process priority value is ignored. (Advanced : Process Priority) The thread pool size value is ignored (Advanced : Thread Pool Size) Servlet Engine Leave OSE as the default queue type (Advanced : Queue Type) Leave Local Pipes as the default transport type when using OSE (Advanced : Settings : Transport Type rmp _was_tips_Common_Spring2001_external.PRZ 48 07/18/01
49 Application Coding Tips rmp _was_tips_Common_Spring2001_external.PRZ 49 07/18/01
50 Application Coding Techniques This section intentionally left blank (Refer to backup material or Session 37DB Java Performance) rmp _was_tips_Common_Spring2001_external.PRZ 50 07/18/01
51 Application Analysis Tools rmp _was_tips_Common_Spring2001_external.PRZ 51 07/18/01
52 WebSphere Resource Analyzer rmp _was_tips_Common_Spring2001_external.PRZ 52 07/18/01
53 Notes: Resource Analyzer Example shows the Resource Analyzer "Resource" display providing information about: Memory usage - Free Total and Memory Size The Memory Size graph shows the JVM Garbage Collection occuring at regular intervals, with a gradual increase in memory use until freed. The resource analyzer has the capability to report on a number of counters inside WebSphere and provides an excellent basis for determining where a problem is. Significant counters include: Number of concurrent request on a Servlet Engine Average number of connections to a Connection Pool Servlet Response time EJB method response time The resource analyzer is not shipped with the WebSphere Application, but can be downloaded from: rmp _was_tips_Common_Spring2001_external.PRZ 53 07/18/01
54 Performance Explorer (PEX) overview PEX provides three types of performance data collection capabilities: STATS - program oriented (mentioned for consistency only). PROFILE - to identify programs that should be investigated further as potential performance bottlenecks (mentioned for consistency only). TRACE collects detailed program, Licensed Internal Code (LIC) task, OS/400 job and object reference information. PEX is part of OS/400 Performance Tools/400 (PT1) provides a capability to print reports for review and manual interpretation makes a no-charge tool available at Alphaworks named PTDV (Performance Trace Data Visualizer). PTDV can analyze and visualize Java Method calls in a PEX trace. rmp _was_tips_Common_Spring2001_external.PRZ 54 07/18/01
55 Notes PEX PEX provides three types of performance data collection capabilities: PEX STATS is focused on identifying application and programs or modules consuming excessive CPU utilization or performing a high number of disk I/O operations. STATS is program oriented. PEX PROFILE support is focused on identifying High Level Language (HLL) program hot spots (high CPU consumption) based upon source program statement numbers. Typically, you use PEX STATS to identify programs that should be investigated further as potential performance bottlenecks. You also use PEX PROFILE on the programs identified for further analysis. PEX TRACE collects detailed program, Licensed Internal Code (LIC) task, OS/400 job and object reference information. PEX TRACE functions can be used to do additional job and program performance analysis. In cases where other performance tools usage cannot identify an application, set of jobs, or programs, the TRACE functions can be used system-wide to assist in identifying applications or programs that need further analysis. The trace events which can be collected are documented in SC "Performance Tools V4R2" table 11-2 and at rmp _was_tips_Common_Spring2001_external.PRZ 55 07/18/01
56 What is PTDV? Performance Trace Data Visualizer Tool for visualizing PEX Trace Data Designed primarily for working with Java programs, but will also work with other ILE languages Runs in client- mode -> data stays on AS/400, visualize it on your PC Originally an internal tool for Java Performance team -- now available externally with limited support New version made available in April 2001 rmp _was_tips_Common_Spring2001_external.PRZ 56 07/18/01
57 What is PEX Trace Data? PEX will create a record for particular events Method entry/exit Java Object Creates and Deletes Java Locks WebSphere Events etc. Some events (method entry/exit) require special "hooks" in code Can generate large amounts of data rmp _was_tips_Common_Spring2001_external.PRZ 57 07/18/01
58 PTDV rmp _was_tips_Common_Spring2001_external.PRZ 58 07/18/01
59 Notes PTDV A PC Java application for visualizing AS/400 PEX trace data. Program flows Number of machine instructions Number of CPU cycles Inline and cumulative time of individual procedure/method calls, threads, and jobs Number and type of objects created and locked Sorts of columns, exporting of data, and many levels of data summarization. The Performance Trace Data Visualizer for (PTDV) is a tool which visualizes trace data collected by the Performance Explorer (PEX) component of the base operating system. It currently only handles a small subset of the possible trace events supported by PEX. The Trace Visualizer is best used with PEX program entry and exit trace events, but can also handle some other events. A listing of the supported events is included below. PTDV can see Java method information for methods running with the interpreter, the Just In Time (JIT) compiler, or Direct Execution (DE). In order to see Java method information in the Trace Visualizer, entry/exit hooks must be enabled in the Java classes. There are two basic methods of doing this: Run your program with the JIT (or interpreter), and enable method entry/exit hooks. One way to force your program to run with the JIT is to set the property java.compiler=jitc. To enable performance hooks, you can set os400.enbpfrcol=1. Enable method entry/exit hooks in transformed (aka DE'd) Java code. In order to do this, you will need to use CRTJVAPGM with the ENBPFRCOL(*ENTRYEXIT) option to create Java program objects with hooks. You will need to do this for each jar, zip, or class file you want hooks for. The Trace Visualizer can view method information for DEd code at any optimization level, but level 40 is preferred, since this is what your application should normally be running at. Using CRTJVAPGM on large files or on slow machines may result in a long wait. If you are running on a machine with a greater batch than interactive capacity, be sure to submit the CRTJVMPGM to batch. rmp _was_tips_Common_Spring2001_external.PRZ 59 07/18/01
60 DBMonitor overview Database Monitor Database Monitor for (DB Monitor) is a tool that can be used to analyze database performance problems after SQL requests have completed running. The DB monitor tool has been part of OS/400 since V3R6. The performance analyst will use DB monitor to gather database and performance data generated when SQL queries are executed. Then using customized SQL programs, the analyst will be able to view, analyze and conclude the most appropriate actions to take in order to generate the most efficient SQL queries possible for their application. Excellent Redpaper available (REDB0502) rmp _was_tips_Common_Spring2001_external.PRZ 60 07/18/01
61 Operations Navigator - Visual Explain rmp _was_tips_Common_Spring2001_external.PRZ 61 07/18/01
62 Notes Visual Explain Visual Explain can be used... On SQL statements stored in database performance monitor data Detailed monitor data (STRDBMON or Detailed SQL Performance Monitor) Monitor data has to be collected on V4R5 to guarantee all of the information is available for drawing the picture (can be another system) Via "Recent Performance Monitor" task in SQL Script Center On SQL statements in the SQL Script Center Explain Task - query governor used with time limit 0 to attempt to draw visual without running the query Run & Explain Task - query has to be run before the visual representation can be drawn No way to store "Visual" results Not all queries can be visualized. In V4R5, the following query types result with error code 99 Subqueries Joins implemented with Hash Join algorithm DB2 Multisystem queries INSERT w/subselect rmp _was_tips_Common_Spring2001_external.PRZ 62 07/18/01
63 DMPJVM overview DMPJVM (Dump Java Virtual Machine) is a standard OS/400 command The command dumps information about the Java Virtual Machine (JVM) for a specified job. The information is dumped to a spooled printer file to be printed. The dump includes formatted information about: The classpath garbage collection threads that are associated with the Java virtual machine. rmp _was_tips_Common_Spring2001_external.PRZ 63 07/18/01
64 Notes DMPJVM The Dump Java Virtual Machine (DMPJVM) command dumps information about the Java Virtual Machine (JVM) for a specified job. The information is dumped using printer file QSYSPRT. The user data for the QSYSPRT file is 'DMPJVM'. The dump includes formatted information about the classpath, garbage collection, and threads associated with the JVM. Restrictions: This command uses the Start Service Job (STRSRVJOB) and Start Debug (STRDBG) commands. The user of this command must be authorized to those commands. This command is shipped with public *EXECUTE authority and the QPGMR, QSYSOPR, QSRV, and QSRVBAS user profiles have private authorities to use the command. This command must be run under a user profile that is the same as the job user identity of the JVM job, or that has use (*USE) authority to the job user identity of the JVM job. This command is not allowed if the remote service operation has been started for another job and that job is not the same job specified on this command. This command is not allowed if the JVM job is held, suspended, or ending. Can specify on the command JOB Specifies the name of the job where the Java Virtual Machine (JVM) is running. If no job number is given, all of the jobs currently in the system are searched for the simple jobname. The job name entered must be a job in which a JVM is currently running. STACKFRAME Specifies the maximum number of stack frames to be processed for each thread. This value must be greater than zero and cannot be greater than 100. If there are more than the specified number of frames on a thread's stack, the more recent frames on the stack are processed and '...' is used to indicate that not all of the stack frames were processed. DUPJOBOPT Specifies the action taken when duplicate jobs are found by this command. rmp _was_tips_Common_Spring2001_external.PRZ 64 07/18/01
65 Performance Review Process Phase Data Collected By: Data Analyzed By: System analysis WAS/Java analysis Application analysis * Performance Monitor * PM/400 * Collection Services * Performance Explorer (PEX) * WebSphere Jobs * Performance Explorer (PEX) * DMPJVM * Performance Explorer (PEX) * DMPJVM * DBMonitor * SQL Visual Explain * Performance Tools (5769-PT1) * * Management Central * Manually * WebSphere Resource Analyzer * Manually * Manually * PTDV * Manually * Manually * Manually Notes: 1. There is no tool which will match the application level Java with database interactions 2. Other tools are in existence, such as JPDC/Jinsight and idoctor, but we make no recommendations related to their use rmp _was_tips_Common_Spring2001_external.PRZ 65 07/18/01
66 Performance Results rmp _was_tips_Common_Spring2001_external.PRZ 66 07/18/01
67 Trade 2 Benchmark Description The Trade 2 benchmark simulates an online stock trading site using WebSphere Application Server Advanced Edition Trade 2 uses a web browser to interact with simulated user The benchmark uses JSPs and servlets to interact with EJBs for database access It contains transactions for the following: Registration to create a user profile, user ID, password, and initial account balance Login validates an already registered user Browse current stock price for a ticker symbol Purchase shares Sell shares from holdings Browse portfolio Logout terminates the users active interval The results of this benchmark are reported as transactions per second rmp _was_tips_Common_Spring2001_external.PRZ 67 07/18/01
68 Trade2 Application Runtime Topology Trade2 http/htttps Web Browser HTTP Server request response WebSphere Application Server Servlets JSPs Business Data Access EJB JDBC Enterprise Data rmp _was_tips_Common_Spring2001_external.PRZ 68 07/18/01
69 Trade2 - V5R1 vs V4R5 V4R5 - WAS V5R1 - WAS Transactions per Second % % EJB V4R5 EJB V5R1 EJB M840/ way M840/ way 500 MHz 600 MHz JDBC V4R5 JDBC V5R1 JDBC 840/ way 840/ way 500 MHz 600 MHz 65% CPU 94% CPU 0.28 sec sec Lab Measurements, April % CPU 82% CPU 0.21 sec sec Lab Measurements, April 2001 improved scalability 48-65% rmp _was_tips_Common_Spring2001_external.PRZ 69 07/18/01
70 WebSphere Scalability - methods to destroy scalability How to keep performance analysts well paid and fully employed Top 10 simple ways to kill scalability... (DON'T DO THESE!) Incorrectly Set Max Active Jobs to a low value for storage pool Causes a large number of ->Ineligible events in WRKSYSSTS for pool Change System Value "QPRCMLTTSK" to 0 for WebSphere systems Limits the performance of multi-threaded jobs in newer hardware Cause excessive application locking Especially over-use of thread safety techniques such as java synchronization Set Transaction isolation level too high *SERIALIZABLE can cause extreme locking conditions Design for multiple users dependent upon a single thread Application design issue: don't multi-task or pool threads for vital functions Cause insufficient caching/pooling of resources Examples: don't use connection pooling, statement caching Cause high resource contention (eg. IOPs, DASD, paging) Don't monitor resources for excessive load Cause excessive object creates or excessive heap management Easy to do with Java Create inefficient SQL Design troublesome queries, don't build indexes, or bad database structure Ignore disabled or troublesome resources Inadvertently forget about LPAR'ed processors, comm errors, VLOGs, etc. rmp _was_tips_Common_Spring2001_external.PRZ 70 07/18/01
71 Summary rmp _was_tips_Common_Spring2001_external.PRZ 71 07/18/01
72 Summary Ensure that the WebSphere is appropriate for workload Focus on capacity planning and system tuning Ensure that the WebSphere application is tuned for performance Follow 5 steps: Step 1 - System Level Optimization for WebSphere Step 2 - Optimize Java Environment Step 3 - Tune WebSphere Step 4 - Analyze and tune application code Step 5 - Load and/or stress testing to prove the expected benefit Utilize the tools available on provides excellent WebSphere performance Throughput Scalability Response Time rmp _was_tips_Common_Spring2001_external.PRZ 72 07/18/01
73 References rmp _was_tips_Common_Spring2001_external.PRZ 73 07/18/01
74 References Workload Estimator WebSphere WebSphere Performance White Paper Performance Tools WebSphere White Papers Redbooks/Redpapers/Redpieces rmp _was_tips_Common_Spring2001_external.PRZ 74 07/18/01
75 References II Web Programming Technology Roadmap WebSphere VisualAge for Java Java rmp _was_tips_Common_Spring2001_external.PRZ 75 07/18/01
76 Trademarks and Disclaimers 8 Copyright International Business Machines Corporation 2001 References in this document to products or services do not imply that intends to make them available in every country. The following terms are trademarks or registered trademarks of International Business Machines Corporation in the United States, other countries, or both: AS/400 AS/400e e-business logo Logo OS/400 WebSphere Java and all Java-based trademarks and logos are trademarks or registered trademarks of Sun Microsystems, Inc. in the United States, other countries, or both. Microsoft, Windows, Windows NT, and the Windows logo are trademarks of Microsoft Corporation in the United States, other countries, or both. Other company, product and service names may be trademarks or service marks of others. Information is provided "AS IS" without warranty of any kind. All customer examples described are presented as illustrations of how those customers have used products and the results they may have achieved. Actual environmental costs and performance characteristics may vary by customer. Information in this presentation concerning non- products was obtained from a supplier of these products, published announcement material, or other publicly available sources and does not constitute an endorsement of such products by. Sources for non- list prices and performance numbers are taken from publicly available information, including vendor announcements and vendor worldwide homepages. has not tested these products and cannot confirm the accuracy of performance, capability, or any other claims related to non- products. Questions on the capability of non- products should be addressed to the supplier of those products. All statements regarding future direction and intent are subject to change or withdrawal without notice, and represent goals and objectives only. Contact your local office or authorized reseller for the full text of the specific Statement of Direction. Some information in this presentation addresses anticipated future capabilities. Such information is not intended as a definitive statement of a commitment to specific levels of performance, function or delivery schedules with respect to any future products. Such commitments are only made in product announcements. The information is presented here to communicate 's current investment and development activities as a good faith effort to help with our customers' future planning. Performance is based on measurements and projections using standard benchmarks in a controlled environment. The actual throughput or performance that any user will experience will vary depending upon considerations such as the amount of multiprogramming in the user's job stream, the I/O configuration, the storage configuration, and the workload processed. Therefore, no assurance can be given that an individual user will achieve throughput or performance improvements equivalent to the ratios stated here. Photographs shown are of engineering prototypes. Changes may be incorporated in production models. rmp _was_tips_Common_Spring2001_external.PRZ 76 07/18/01
77 Backup material rmp _was_tips_Common_Spring2001_external.PRZ 77 07/18/01
78 Application Coding Tips rmp _was_tips_Common_Spring2001_external.PRZ 78 07/18/01
79 Coding Considerations - General String Manipulation (substring and concatenate) Use char[] or StringBuffer Instantiation Ex: new RMISecurityManager() Use "lazy initialization": if (objx == null) objx = new x(); else objx.reset(); rmp _was_tips_Common_Spring2001_external.PRZ 79 07/18/01
80 Notes: General Coding Rules String Manipulation (substring and concatenate) The problem with string manipulation is that strings are immutable. This simply means that the Java specifications dictate that strings are not capable of change. Therefore, changes to the value of a string (for example, assignments or concatenation) result in the old string object being discarded and a new string object being created to contain the new value. String manipulation can then result in large amounts of object instantiation and garbage collection. A technique for reducing this overhead is to use a StringBuffer object instead of a string. The StringBuffer is not immutable and has several methods, one of which is StringBuffer.append. Appending to a StringBuffer is a much better performer than string concatenation. However, being capable of change means that there is a corresponding synchronization overhead associated with this object type. An even faster technique for variable string values is to use an array of characters (char[]) to behave like a fixed-length string. Instantiation Instantiation is the creation of new objects. This is expensive because it results in the allocation of heap storage. As expected, instantiation eventually results in garbage collection since the objects that were created eventually have to be cleaned up when they are no longer referenced. The more complex an object is, the more overhead it takes to instantiate it. Instead of creating a new instance of an object each time with the "new" operation, it may be possible to reuse an object by varying its attributes or instance variables. Obviously, unnecessary object instantiation needs to be eliminated. If possible, re-use complex objects by supplying a reset() method. rmp _was_tips_Common_Spring2001_external.PRZ 80 07/18/01
81 Coding Considerations - General 2 Exception Handling Throwing exceptions is expensive. Use only in "exception" processing Java Native Interface (JNI) Minimize - requires processing above the MI Variable Scope Access of local variables is fastest Don't invoke system.gc() from your application No benefit with Minimize Synchronization Allows better scalability rmp _was_tips_Common_Spring2001_external.PRZ 81 07/18/01
82 Notes: General Coding Rules Exception Handling Using exception handling mechanisms such as "throws exception" is relatively expensive. Using exception handling mechanisms for regular processing should not be done. They should be used only in real exception conditions. Try-catch structures are very efficient. It is far more efficient to catch the occasional exception than to pass return codes and evaluate them. Java Native Interface (JNI) Using the Java Native Interface for interaction with other HLL programs should generally be kept to a minimum. Java is implemented below the MI layer, however calls via JNI needs to be passed above the MI layer for execution, generally increasing overhead. The implementation of the JVM is fully integrated into the OS/400 Machine Interface. Frequent accesses of trivial non-java programs through JNI should be minimized since this requires processing above the Machine Interface and tends to slow the application down. As of V4R4, a safe JNI call can be made to ILE RPG and ILE COBOL programs since they were made thread-safe. Previously, only C programs were recommended for JNI calls. However, calls to longer running non-java programs may be tolerable because the overhead of making the call is small compared to the total amount of productive work done. Variable Scope The scope of variables has different costs. Access to a local variable is the fastest. Direct access to an instance variable or using an inlined accessor method have approximately the same cost. Both are more expensive than local variable access. Using an accessor method (not in-lined) is even more expensive. The most expensive is to use a Synchronized accessor method. rmp _was_tips_Common_Spring2001_external.PRZ 82 07/18/01
83 Coding Considerations - JDBC 1 Retrieve only needed columns or fields Use 'select column1,column2 from ' Do not use 'select * from ' JDBC get...(int columnindex) faster than get...(string columnname) Some JDBC drivers require increasing index values. JDBC can handle various orders Data Conversion Evaluate storing character data as Unicode (CCSID 13488) DB2 numeric data as float rmp _was_tips_Common_Spring2001_external.PRZ 83 07/18/01
84 Notes: JDBC coding rules Retrieve only needed columns or fields If you use the select all option, JDBC will bring back a complete result set. This is slower than accessing only the columns you need. JDBC get...(int columnindex) faster than get...(string columnname) Some JDBC drivers require increasing index values. JDBC can handle various orders. Whilst using column index is slightly less readable, it saves a name to column index conversion. Data Conversion Evaluate storing character data as Unicode (CCSID 13488) Storing Strings as Unicode effectively makes your system double-byte. It does however reduce the overhead involved in translating data to/from EBCDIC. A good option for this is to define the database column with the CCSID This gives such tools as OS/400 SQL and Query the ability to read and display the data. DB2 numeric data as float Store numeric data in DB2 as a float to reduce numeric conversions. Decimal data cannot be represented in Java as a primitive type. Decimal data is converted to the abstract class Java.lang.BigDecimal on every database read or write. This conversion can be avoided by storing numeric data in the database as float or double. Alternatively, you may consider converting the BigDecimal type to float for heavy calculations while leaving the database in decimal form. Note that rounding differences may be introduced with the use of float or double. rmp _was_tips_Common_Spring2001_external.PRZ 84 07/18/01
85 Coding Considerations - JDBC 2 Avoid AutoCommit Reduce number of DB commits Default on with servlets Enable JTA only when required Reduces pathlength Consider using Batch Insert The implementation of JDBC supports the Performance improvement through Batch Insert. // Turn off auto commit con.setautocommit(false); Statement stmt = con.createstatement(); stmt.addbatch("insert INTO employees VALUES (1000, 'Joe Jones')"); stmt.addbatch("insert INTO departments VALUES (260, 'Shoe')"); stmt.addbatch("insert INTO emp_dept VALUES (1000, 260)"); // submit a batch of update commands for execution int[] updatecounts = stmt.executebatch(); rmp _was_tips_Common_Spring2001_external.PRZ 85 07/18/01
86 Notes: JDBC Coding Rules Generally avoid using AutoCommit. AutoCommit results in very frequent commits, which may not be required. The batch update facility allows a Statement object to submit a set of heterogeneous update commands together as a single unit, or batch, to the underlying DBMS. In the example below all of the update operations required to insert a new employee into a fictitious company database are submitted as a single batch. In the example, autocommit mode is disabled to prevent JDBC from committing the transaction when Statement.executeBatch() is called. Disabling autocommit allows the application to decide whether or not to commit the transaction in the event that an error occurs and some of the commands in a batch fail to execute. For this reason, autocommit should usually be turned off when batch updates are done. Using Batch insert can yield up to 10 times the performance, but beware of flooding the JDBC cache. rmp _was_tips_Common_Spring2001_external.PRZ 86 07/18/01
87 Coding Considerations - JDBC 3 If repeatable statement, preparestatement() once pssinglerecord=dbconnectionobject.preparestatement("select partdesc FROM parts WHERE partno =?"); then repeatedly execute() or executequery() or executeupdate() pssinglerecord.setint(1, Integer.parseInt(partNo)); rspartresultset = pssinglerecord.executequery(); else execute(string) or executequery(string) or executeupdate(string) rmp _was_tips_Common_Spring2001_external.PRZ 87 07/18/01
88 Notes: JDBC Coding Rules Using a prepared statement causes the SQL interpreter to precompile the statement and keep it ready in a cache. This can significantly improve performance for repeated queries. rmp _was_tips_Common_Spring2001_external.PRZ 88 07/18/01
89 Picking the Right Driver Which JDBC Driver? Driver Type DB Toolbox Driver Network enabled, Type 4 QZDASOINIT same as ODBC Developer Kit (Native) Driver Direct access Type 2 QSQSRVR Call Level Interface Statement caching *SQLPKG System-wide statement cache Recommended Usage Java on client, accessing DB2/400 Java on 400, accessing DB2/400 rmp _was_tips_Common_Spring2001_external.PRZ 89 07/18/01
90 Notes: Selecting JDBC driver There are two supplied JDBC drivers for the. Picking which driver to use depends largely on the implementation. The Java Toolbox for AS/400 (or JTOpen) driver would be the best choice for any client or application code not residing on the same system as the DB2/400 database. It uses TCP/IP network conections for data access and has statement caching restricted to the SQL package it is accessing. If your client code resides on the same system as the database, you should use the native JDBC driver. The native driver makes calls directly to the DB2/400 call level interface and has the ability to cache SQL statements system wide. If you code is designed to run in both environments, it may be tempting to simply pick the JTOpen driver. However, this results in significant performance overhead, due to the network access. You should instead make the driver implementation a property as shown on the next slide. rmp _was_tips_Common_Spring2001_external.PRZ 90 07/18/01
91 Selecting JDBC Driver in Code Use Properties File for Driver Selection Native Driver for Java to DB2 UDB for 400 Register/Load the Driver java.sql.drivermanager.registerdriver(new com.ibm.db2.jdbc.app.db2driver()); Connect Connection c = DriverManager.getConnection("jdbc:db2://mySystem",p); Toolbox Driver for client Java to DB2 UDB for AS/400 Register/Load the Driver java.sql.drivermanager.registerdriver(new com.ibm.as400.access.as400jdbcdriver()); Set the properties Properties p = new Properties(); p.put("extended dynamic", "true"); Connect Connection c = DriverManager.getConnection("jdbc:as400://mySystem",p); rmp _was_tips_Common_Spring2001_external.PRZ 91 07/18/01
92 Notes: Selecting JDBC driver Porting your code to another platform generally requires changing the JDBC driver. For this reason alone, all JDBC driver naming and associated properties should be stored in a property file. It is also important to use the native driver if the Java Code resides on the same system as DB2/400. Note that this example refers to accessing JDBC directly from Java programs. WebSphere Java Code should use connection pooling instead. For correct use of connection properties, see the AS/400 Toolbox for Java documentation. Some common properties and their defaults: block criteria = 2 block size = 32 prefetch = true extended dynamic = false rmp _was_tips_Common_Spring2001_external.PRZ 92 07/18/01
93 Using DDM or Record Level Access Use good logic (just like in RPG, C or COBOL) For Example: Use Logical files versus Program Record Selection Minimize Open and Close Block on READ_ONLY and WRITE_ONLY Causes buffering of Disk I/O Reads are sequentially ordered For small files, use the readall() method rmp _was_tips_Common_Spring2001_external.PRZ 93 07/18/01
94 Notes: DDM or Record Level Access If DDM is chosen as an access method (via the AS400FileObject from the toolbox), the guidelines shown should be taken into account. Using appropriate logic is of course important in any language, but given that Java is still slightly slower than traditional coding, it becomes essential to avoid such things as table scans in the code if possible. Using appropriate logical files is more efficient. Opening and closing files of course has a price, and keeping them open as much as possible improves performance. Use Blocking (record buffering) on read and writes if possible to improve performance. In some cases where a small file is repeatedly used, it may be more efficient to read the entire file into memory using the readall() method. rmp _was_tips_Common_Spring2001_external.PRZ 94 07/18/01
95 WebSphere Specific Coding 1 Do not store large objects in HttpSession Every object must be serialized and stored/retrieved in DB Use JDBC or IFS instead and access only objects needed Release HttpSessions when finished javax.servlet.http.httpsession.invalidate(); Do not create HttpSessions in JSPs by default <%@ page session="false"%> rmp _was_tips_Common_Spring2001_external.PRZ 95 07/18/01
96 Notes: WAS Specific Coding 1 Large applications require using persistent HttpSessions. However, there is a cost. An HttpSession must be read by the servlet whenever it is used and rewritten whenever it is updated. This involves serializing the data and reading it from and writing it to a database. In most applications, each servlet requires only a fraction of the total session data. However, by storing the data in the HttpSession as one large object graph, an application forces WebSphere Application Server to process the entire HttpSession object each time. WebSphere Application Server has HttpSession configuration options that can optimize the performance impact of using persistent HttpSessions. The HttpSession configuration options are discussed in detail in the WebSphere Application Server documentation. Also consider alternatives to storing the entire servlet state data object graph in the HttpSession. Using your own JDBC connection alternative is described and discussed below. When configuring persistent sessions in WebSphere Application Server, use a dedicated data source. To avoid contention for JDBC connections, don t reuse an application DataSource or the WebSphere Application Server repository for persistent session data. As an alternative to storing the entire object graph in the HttpSession, use JDBC for partitioning and maintaining the state data needed by each servlet in the application. A sample JDBC solution maintains the state data needed by each servlet as a separate row in an application-maintained JDBC datasource. The primary keys for each row (the data for each servlet) are stored as separate attributes in the HttpSession. The use of the HttpSession is reduced to the few strings needed to locate the data. The application should explicitly and programmatically releases HttpSessions. Quite often, programmatic invalidation is part of an application logout function. WebSphere Application Server destroys the allocated HttpSession when it expires (by default, after 1800 seconds or 30 minutes). WebSphere Application Server can only maintain a certain number of HttpSessions in memory. When this limit is reached, WebSphere Application Server serializes and swaps the allocated HttpSession to disk. In a high volume system, the cost of serializing many abandoned HttpSessions can be quite high. By default, JSP files create HttpSessions. This is in compliance with J2EE TM to facilitate the use of JSP implicit objects, which can be referenced in JSP source and tags without explicit declaration. HttpSession is one of those objects. If you do not use HttpSession in your JSP files then you can save some performance overhead. rmp _was_tips_Common_Spring2001_external.PRZ 96 07/18/01
97 WebSphere Specific Coding 2 Minimize synchronization in Servlets Keep a short code path Don't use: synchronized(this) { // Do lots } Use: Class Variable: private Object lockobject = new Object(); In Methods: synchronize(lockobject) { // Only access required variables } rmp _was_tips_Common_Spring2001_external.PRZ 97 07/18/01
98 Notes: WAS Specific Coding 2 Servlets are multi-threaded. Servlet-based applications have to recognize and handle this. However, if large sections of code are synchronized, an application effectively becomes single threaded, and throughput decreases. In extreme cases a deadlock can occur and the application come to a complete halt. The first code shown synchronizes the major code path of the servlet s processing to protect a servlet instance variable. The second code example moves the lock to a servlet instance variable and out of the critical code path. rmp _was_tips_Common_Spring2001_external.PRZ 98 07/18/01
99 WebSphere Specific Coding 3 Do not use SingleThreadModel Extreme Overhead The better approach is to avoid using servlet instance variables that are updated from the servlet s service method. Use the HttpServlet Init() method to perform expensive operations that need only be done once For example: JNDI lookups, which can be cached in an instance variable. (Example with JDBC will follow) Minimize or eliminate use of System.out.println() May seem harmless, has big impact due to IO synchronization Consider also setting Standard output and Standard error settings in WebSphere to "" to turn output off rmp _was_tips_Common_Spring2001_external.PRZ 99 07/18/01
100 Notes: WAS Specific Coding 3 SingleThreadModel is a tag interface that a servlet can implement to transfer its re-entrancy problem to the servlet engine. As such, javax.servlet.singlethreadmodel is part of the J2EE specification. The WebSphere servlet engine handles the servlet s re-entrancy problem by creating separate servlet instances for each user. Because this causes a great amount of system overhead, SingleThreadModel should be avoided. Because the servlet init() method is invoked when servlet instance is loaded, it is the perfect location to carry out expensive operations that need only be performed during initialization. By definition, the init() method is thread-safe. The results of operations in the HttpServlet.init() method can be cached safely in servlet instance variables, which become read-only in the servlet service method. Even though WebSphere has had a JNDI cache since version 3.5.2, using your own private cache is still faster. Because it seems harmless, the commonly used application development legacy of using System.out.println is overlooked for the performance problem it really is. Because System.out.println statements and similar constructs synchronize processing for the duration of disk I/O, they can significantly slow throughput. Avoid using indiscriminate System.out.println statements. State of the art enterprise application development facilities, such as VisualAge Java, provide developers with excellent debugging tools for unit testing. Moreover, the WebSphere Application Server Distributed Debugger can be used to diagnose code on a running system. However, even with these tools, there remains a legitimate need for application tracing both in test and production environments for error and debugging situations. Such application level tracing like most system level traces should be configurable to be activated in error and debugging situations only. One good design implementation is to tie tracing to a final boolean value, which when configured to false will optimize out both the check and execution of the tracing at compile time. Consider also that the WebSphere Application Server product allows for the complete deactivation of System.out and System.err for any given application at runtime. This is achieved by setting the file names to "" (through the Administrator's console). rmp _was_tips_Common_Spring2001_external.PRZ /18/01
101 WebSphere Specific Coding 4 Don t use Beans.instantiate() to create new bean instances Beans.instantiate(), will create a new bean instance either by retrieving a serialized version of the bean from disk or creating a new bean if the serialized form does not exist Each time Beans.instantiate() is called the file system is checked for a serialized version of the bean simply use new to create the instance Avoid Excessive Method Navigation Do not use: myint1 = myinstance.somemethodreturningobject().someothermethod1(); myint2 = myinstance.somemethodreturningobject().someothermethod2(); Use: MyObject mynewinstance = myinstance.somemethodreturningobject(); myint1 = mynewinstance.someothermethod1(); myint2 = mynewinstance.someothermethod2(); rmp _was_tips_Common_Spring2001_external.PRZ /18/01
102 Notes: WAS Specific Coding 4 The method, java.beans.beans.instantiate(), will create a new bean instance either by retrieving a serialized version of the bean from disk or creating a new bean if the serialized form does not exist. The problem, from a performance perspective, is that each time java.beans.beans.instantiate is called the file system is checked for a serialized version of the bean. As usual, such disk activity in the critical path of your web request can be costly. To avoid this overhead, simply use new to create the instance. Avoiding substantial method navigation is a simple way to reduce overhead. Especially if the object returned is remote. Multiple levels of navigation will have to be resolved at each method invocation. rmp _was_tips_Common_Spring2001_external.PRZ /18/01
103 WebSphere Specific Coding 5 Reuse DataSources for JDBC connections A DataSource is obtained through a JNDI naming lookup Obtain the DataSource in the Servlet.init() method and cache it Use JDBC connection pooling Avoids acquiring and closing JDBC connections Release JDBC resources when done Failure to do this can cause long waits for connections Ensure code is structured to close and release under all conditions (even in exceptions and error conditions) rmp _was_tips_Common_Spring2001_external.PRZ /18/01
104 Notes: WAS Specific Coding 5 A javax.sql.datasource is obtained from WebSphere Application Server through a JNDI naming lookup. Avoid the overhead of acquiring a javax.sql.datasource for each SQL access. This is an expensive operation that will severely impact the performance and scalability of the application. Instead, servlets should acquire the javax.sql.datasource in the Servlet.init() method (or some other thread-safe method) and maintain it in a common location for reuse. To avoid the overhead of acquiring and closing JDBC connections, WebSphere Application Server provides JDBC connection pooling based on JDBC 2.0. Servlets should use WebSphere Application Server JDBC connection pooling instead of acquiring these connections directly from the JDBC driver. WebSphere Application Server JDBC connection pooling involves the use of javax.sql.datasources. Failing to close and release JDBC connections can cause other users to experience long waits for connections. Although a JDBC connection that is left unclosed will be reaped and returned by WebSphere Application Server after a timeout period, others may have to wait for this to occur. Close JDBC statements when you are through with them. JDBC ResultSets can be explicitly closed as well. If not explicitly closed, ResultsSets are released when their associated statements are closed. Ensure that your code is structured to close and release JDBC resources in all cases, even in exception and error conditions. rmp _was_tips_Common_Spring2001_external.PRZ /18/01
105 WebSphere Coding 5-Example Using JDBC the right way: public class GoodJDBCServlet extends HttpServlet { private javax.sql.datasource ds = null; // For Caching the DataSource // Get the DataSource (Exception Handling removed for clarity) public void init(servletconfig config) throws ServletException { super.init(config); java.util.hashtable env = new java.util.hashtable(); env.put(context.initial_context_factory,"com.ibm.ejs.ns.jndi.cninitialcontextfactory"); Context ctx = new InitialContext(env); // Store the DataSource for use by every instance ds = (javax.sql.datasource)ctx.lookup("jdbc/sample"); ctx.close(); } // Get a pooled connection public void doget(httpservletrequest request, HttpServletResponse response) throws ServletException, IOException { try { // Get connection and execute Query Connection conn = ds.getconnection(userid,password); PreparedStatement pstmt = conn.preparestatement("select * from SCHEMA.SOMETABLE"); ResultSet rs = pstmt.executequery();... } finally { // Always close both the preparedstatement and the Connection if (pstmt!=null) pstmt.close(); // Note: Wrap this statement in try..catch if (conn!=null) conn.close(); // Note: Wrap this statement in try..catch } } } rmp _was_tips_Common_Spring2001_external.PRZ /18/01
106 EJB Specific Coding 1 Access Entity beans from Session beans Do not access EJB Entity bean directly from client or servlet code Wrap the access into a Session bean and collect the data in structure Reduces the number of remote method calls The Entity bean is accessed locally Provides an outer transaction context for the EJB Entity bean An alternative is to use the WebSphere Command Framework Reuse EJB homes EJB homes are obtained from WebSphere Application Server through a JNDI naming lookup For simple applications use a method similar to the JDBC caching already shown For complex applications create an EJB Home Locator and Caching class. rmp _was_tips_Common_Spring2001_external.PRZ /18/01
107 Notes: EJB Specific Coding 1 Avoid accessing EJB entity beans from client or servlet code. Instead wrap and access EJB entity beans in EJB session beans. This best practice satisfies two performance concerns: Reducing the number of remote method calls. When the client application accesses the entity bean directly, each getter method is a remote call. A wrapping session bean can access the entity bean locally, and collect the data in a structure, which it returns by value. Providing an outer transaction context for the EJB entity bean. An entity bean synchronizes its state with its underlying data store at the completion of each transaction. When the client application accesses the entity bean directly, each getter method becomes a complete transaction. A store and a load follow each method. When the session bean wraps the entity bean to provide an outer transaction context, the entity bean synchronizes its state when outer session bean reaches a transaction boundary. WAS also ships a complete command framework, which is an excellent solution to the above problem. The command facility is implemented in the com.ibm.websphere.command Java package. EJB homes are obtained from WebSphere Application Server through a JNDI naming lookup. This is an expensive operation that can be minimized by caching and reusing EJB Home objects. For simple applications, it might be enough to acquire the EJB home in the servlet init() method. More complicated applications might require cached EJB homes in many servlets and EJBs. One possibility for these applications is to create an EJB Home Locator and Caching class. rmp _was_tips_Common_Spring2001_external.PRZ /18/01
108 EJB Specific Coding 2 Remove stateful Session beans when finished Instances of stateful session beans have affinity to specific clients. Reduce Container cleanup by explicitly removing after use: mysessionbean.remove(); rmp _was_tips_Common_Spring2001_external.PRZ /18/01
109 Notes: EJB Specific Coding 2 Instances of stateful session beans have affinity to specific clients. They will remain in the container until they are explicitly removed by the client, or removed by the container when they timeout. Meanwhile, the container might need to passivate inactive stateful session beans to disk. This requires overhead for the container and constitutes a performance hit to the application. If the passivated session bean is subsequently required by the application, the container activates it by restoring it from disk. By explicitly removing stateful session beans when finished with them, applications will decrease the need for passivation and minimize container overhead. rmp _was_tips_Common_Spring2001_external.PRZ /18/01
110 EJB Deployment Settings Use Read-Only methods where appropriate Set in Deployment Descriptor If only Read-Only methods are used in the transaction unit, then the Entity Bean state synchronization will not invoke store. Use Exclusive database access where appropriate Set in Admin console If only Read-Only methods are used in the transaction unit, then the Entity Bean state synchronization will not invoke load. Reduce the transaction isolation level where appropriate By default, most developers deploy EJBs with the transaction isolation level set to TRANSACTION_SERIALIZABLE In some cases TRANSACTION_READ_UNCOMMITTED would probably be sufficient Consider No Local Copies by adding the following two command line parameters to the application JVM: -Djavax.rmi.CORBA.UtilClass=com.ibm.CORBA.iiop.Util -Dcom.ibm.CORBA.iiop.noLocalCopies=true rmp _was_tips_Common_Spring2001_external.PRZ /18/01
111 Notes: EJB Deployment When setting the deployment descriptor for an EJB entity bean, you can mark getter methods as Read-Only. If a transaction unit of work includes no methods other than Read-Only designated methods, then the Entity Bean state synchronization will not invoke store. This is easily set using the Visual Age Java application development tool. Likewise, if the database access is set to "exclusive", then the Entity Bean state synchronization will not invoke load. By default, most developers deploy EJBs with the transaction isolation level set to TRANSACTION_SERIALIZABLE. This is the default in VisualAge Java - Enterprise Edition and other EJB deployment tools. It is also the most restrictive and protected transaction isolation level incurring the most overhead and locking. Some workloads do not require the isolation level and protection afforded by TRANSACTION_SERIALIZABLE. A given application might never update the underlying data or be run with other concurrent updaters. In that case, the application would not have to be concerned with dirty, non-repeatable, or phantom reads TRANSACTION_READ_UNCOMMITTED would probably be sufficient. Because the EJB s transaction isolation level is set in its deployment descriptor, the same EJB could be reused in different applications with different transaction isolation levels. Review your isolation level requirements and adjust them appropriately to increase performance. Because EJBs are inherently location independent, they use a remote programming model. Method parameters and return values are serialized over RMI-IIOP and returned by value. This is the intrinsic RMI Call By Value model. WebSphere provides the No Local Copies performance optimization for running EJBs and clients (typically servlets) in the same application JVM. The No Local Copies option uses Call By Reference and does not create local proxies for called objects when both the client and the remote object are in the same process. Depending on your workload, this can result in a significant overhead savings. CAUTION: The No Local Copies configuration option improves performance by changing Call By Value to Call By Reference for clients and EJBs in the same JVM. One side effect of this is that the Java object derived (non-primitive) method parameters can actually be changed by the called enterprise bean. rmp _was_tips_Common_Spring2001_external.PRZ /18/01

112 Impact of EJB Coding Changes Requests per Second Base Wrap in Session Bean Reuse Homes Read Only Reduce Isolation rmp _was_tips_Common_Spring2001_external.PRZ /18/01
113 Notes: Impact of coding changes The graph shows the impact on a simple sample application, from implementing some of the suggestions outlined on the previous slides. The first graph represents the throughput achieved with the base application (before optimization). The second graph shows the wrapping of the logic into a Session Bean. Notice that this almost doubled throughput. Next is shown the caching and reuse of EJB homes. Because of the substantial reduction in JNDI lookups, the throughput increases significantly. Read-Only is then set for all valid method in the deployment descriptor and finally the isolation level is reduced. Note that the actual impact on your application may be significantly different. rmp _was_tips_Common_Spring2001_external.PRZ /18/01
114 Understanding the Java Environment on rmp _was_tips_Common_Spring2001_external.PRZ /18/01
115 Java Runtime Environment on Starts whenever you enter the Run Java (RUNJVA) command or JAVA command, or when java is invoked from a QShell. Must run in a job that supports threads Such as Batch Immediate (BCI) Interactive Job Batch Immediate Job Thread X Thread Y JAVA CLASS('Hello') Java Virtual Machine (JVM) Application Code (Hello.class) Garbage Collector rmp _was_tips_Common_Spring2001_external.PRZ /18/01
116 Notes: Java Runtime Environment The Java runtime environment starts whenever you enter the Run Java (RUNJVA) command or JAVA command on the AS/400 command line. Because the Java environment is multithreaded, it is necessary to run the Java virtual machine in a job that supports threads, such as a batch immediate (BCI) job. Once the Java virtual machine starts, additional threads may start in which the garbage collector runs. It is also possible to start the Java runtime environment by using the java command in Qshell from the Qshell Interpreter. In this environment, the Qshell Interpreter is running in a BCI job that is associated with an interactive job. The Java runtime environment starts in the job that is running the Qshell Interpreter. Garbage collection is the process of freeing storage that is used by objects that are no longer referred to by a program. With garbage collection, programmers no longer have to write error prone code to explicitly "free" or "delete" their objects. This code frequently results in "memory leak" program errors. The garbage collector automatically detects an object or group of objects that the user program can no longer reach. It does this because there are no references to that object in any program structure. Once the object has been collected, you can allocate the space for other uses. rmp _was_tips_Common_Spring2001_external.PRZ /18/01
117 Java Advantages with Fully Integrated JVM Below MI Other platforms use software JVM above OS Designed for scaleable SERVER work (many threads & objects) Beware of single thread comparisons Transformer Persistent 64-bit instructions Retains Java bytecode portability Superior Garbage Collection Concurrent, not stop-and-copy Emphasis on Optimization and Currency rmp _was_tips_Common_Spring2001_external.PRZ /18/01
118 Notes: Java Advantages with Fully integrated JVM. Architected for high volume work with large numbers of threads and objects. Large internal data structures and algorithms fit into AS/400's multi-user heritage, e.g., lock conflict handling. It is a common mistake to compare the Java performance on the running in a single thread. Java performance on the shows its strength in a multi-threaded environment due to the efficient OS/400 thread switching engine. JIT results are not persistent. They try to observe most frequently used classes and compile them. This results in overhead. The transformer produces 64 bit RISC instructions from bytecode and stores them. No overhead after first time. GC is less intrusive. Proof of OS/400's multi-tasking heritage. rmp _was_tips_Common_Spring2001_external.PRZ /18/01
119 Java execution modes Java Transformer Creates hidden, compiled programs called Direct Execution programs. Just in time compilation (JIT) Default option in V4R5 and V5R1 (JIT 3.6) Characteristic Direct execution Just-in-Time (JIT) Compiler Execution speed Faster for large programs Faster for small programs and Loading speed Memory use Faster if the code is pre-compiled; slower if is not pre-compiled Less if many processes are using the same program Disk use Uses four to five times the space of JIT Ease of use More user management Invisible to user dynamic environments Faster if methods are called more than once; slower if most methods are used a small number of times Equal to static compilation if one or only a few processes are using the same program Uses four to five times less space than static compilation Binding Tight binding within a JAR, loose binding between classes or between different JAR files (WPO in V5R1) Tight binding for all classes and JAR files rmp _was_tips_Common_Spring2001_external.PRZ /18/01
120 Notes: Java Execution Modes A Just-In-Time (JIT) compiler is a platform-specific compiler that generates machine instructions for each method upon the first call to that method. You may notice a slower start up of the Java virtual machine as the JIT is compiling many methods for the first time. After this initial slow start up, the user program will eventually achieve a state where most of the necessary methods have been compiled and the application will run at close to direct execution optimization level 30 speed. The JIT is currently running about 10-12% slower than direct execution. JIT 3.6 up to 30% faster than JIT 3.5 As of V5R1, the transformer has the ability to perform Whole Program Optimization (WPO) This refers to a tight binding between not only classes within a JAR file, but also tight binding across multiple JAR files. rmp _was_tips_Common_Spring2001_external.PRZ /18/01
121 Java System Resource Access with Java Data Base Connectivity (JDBC) Developer Kit for Java driver Toolbox for Java driver Toolbox for Java DDM (Record Level Access) DPC (Distributed Program Call) IFS Data Queues... rmp _was_tips_Common_Spring2001_external.PRZ /18/01
122 Notes: Resource Access The Toolbox for Java (JTOpen) offers a variety of choices for accessing system resources. So, you are not restricted to using JDBC. You can access files with record level access as well as calling programs and commands directly on the system. Using the Toolbox to access data, such as via DDM can yield significant performance improvements (Up to twice the throughput on simple statements), but at the price of code portability. If porting the code to a non- is of no concern, Toolbox access should be considered. rmp _was_tips_Common_Spring2001_external.PRZ /18/01
123 Toolbox for Java (JTOpen) Java application or applet Command Call Program Call JDBC Record- Level IO File Print Data Queues... Sockets /TCP Sockets /TCP OS/400 Commands Programs Database IFS Spool Data Queues rmp _was_tips_Common_Spring2001_external.PRZ /18/01
124 Notes: Java Toolbox (JTOpen) This diagram shows some of the objects that can be accessed via the JTOpen toolbox. Programmers who do only intend to deploy their applications for the should consider these options to take advantage of the OS/400 system level features. As shown, the toolbox gives access to: Commands Program calls Database (DDM) Integrated File System Spooled output Data Queues... rmp _was_tips_Common_Spring2001_external.PRZ /18/01
125 Java Resource Access Method JAVA JDBC DDM QRWTSRVR SQL Statements Stored Procedures QZDASOINIT SQL Stmts Stored Procedures QSQSRVR Call Level Interface Native Optimization DPC Toolbox HLL Program QZRCSRVS Toolbox DPC DDM JDBC J A V A Native Driver JDBC JAVA rmp _was_tips_Common_Spring2001_external.PRZ /18/01
126 Notes: Java to Access This diagram illustrates the various methods for accessing DB2 data and other resources from a Java program, as well as the OS/400 jobs involved in the process. The important thing to notice is the path from the Java program through to the Database. Using the Native Driver, the path is short and uses call directly to the QSQSRVR call level interface. Using the toolbox, all calls will go via TCP/IP sockets. Depending on the access method chosen, various different jobs will be invoked as shown. These jobs are generally prestart jobs and having a good number of them already started usually improves performance. rmp _was_tips_Common_Spring2001_external.PRZ /18/01
127 Some common Java & WebSphere jobs QEJBSBS <instance name> BCI Application running job. All WebSphere Java code, Servlets, JSPs and EJBs execute in this job. <instance name>admin BCI Administration for the instance. <instance name>mntr BCH Monitor (nanny) job. QHTTPSVR <instance name> BCH Primary instance manager for the HTTP. <instance name> BCI Usually several of these jobs, each capable of managing incoming requests. QINTER QJVACMDSRV BCI Java invoked by Interactive Job QSYSWRK QSQSRVR PJ Usually a large number of these jobs, which provide the database pooling for SQL access to DB2 QRWTSRVR PJ Used for DDM access to Database files. QCMN QRWTSRVR PJ Used for RPC (also known as DPC) QSERVER QZDASOINIT PJ Provides database pooling for the Toolbox JDBC driver rmp _was_tips_Common_Spring2001_external.PRZ /18/01
128 Optimizing the Java Environment rmp _was_tips_Common_Spring2001_external.PRZ /18/01
129 Java System Environment For Mixed Mode Environments: Run Priorities if high CPU utilization Java Priorities: 1 (MIN_PRIORITY) to 5 (NORM_PRIORITY) to 10 (MAX_PRIORITY) OS/400 Priority = BCI runpty Java priority Interactive BCI job priority 14, Batch BCI job priority 44 Setting for WebSphere: CHGCLS QEJB/QEJBCLS RUNPTY(...) Timeslice Each thread has separate CPU count Each hits TSE independently Setting for WebSphere: Purge CHGCLS QEJB/QEJBCLS TIMESLICE(... Irrelevant since V4R4. The value is ignored. rmp _was_tips_Common_Spring2001_external.PRZ /18/01
130 Notes: Java System Environment In a mixed mode environment, RUNPTY and Timeslice settings become important. To be able to determine the base settings, you need to understand how OS/400 determines the RUNPTY for each thread. In Java you have the ability to set a thread priority ranging from 1 (lowest) through to 10 (highest). A standard thread runs at Java priority 5. OS/400 uses this setting to determine the runtime priority, based in the job priority Java Priority. Timeslice is another opportunity to assign more processing time to your threads. Each tread has a separate CPU count and each thread hits the Time Slice End (TSE) independently. If you are required to change these settings for WebSphere, you can do so by changing the QEJBCLS class, which is used by the QEJBSBS subsystem. The Purge *YES/*NO has been a frequent bone of contention for many performance Guru's. This has now become irrelevant as the Purge setting is ignored from V4R4 forward. rmp _was_tips_Common_Spring2001_external.PRZ /18/01
131 Optimizing Java at system level Package Java application as a.jar or.zip file Improves class loading time Improves code optimization Use CRTJVAPGM/CHGJVAPGM to optimize to level 40 In V5R1 store all JAR files in same directory Allows tight binding across JAR files Place frequently used JAR files first in CLASSPATH Adjust value GCHINL as necessary Specifies the size of initial storage allocated to garbage collector Large number allocates more memory to GC, GC runs less frequently Leave GCHMAX as default (*NOMAX) When MAX is reached, all threads are stopped, garbage collection is done synchronously Monitor GC faulting JVM runs in the storage pool of the subsystem in which it is started Rule of thumb: Page Faults If storage available, < may bring benefits rmp _was_tips_Common_Spring2001_external.PRZ /18/01
132 Notes: Java at System Level Packaging Java Applications into a JAR file is a well accepted method to reduce class loading time. This is of course also true for the. Using the Transformer against a JAR file also allows the Transformer to improve the binding between classes. As of V5R1 it is also beneficial to store all related JAR files in the same subdirectory and execute the Transformer over all the JAR files. This allows for Whole Program Optimization. The GCHINL value determines how the garbage collector runs. Each time memory usage equal to the GCHINL value has been consumed, the garbage collector will be invoked. A large value makes the GC run less frequently, but for a long time. A good starting value for WebSphere is 32Mb but a larger value may improve performance. Leave the GCHMAX setting at default of *NOMAX. The system can comfortably support this and you avoid a GC stop situation. Monitor the faulting rates of the subsystem in which the GC is started. You can use page faults as a rule of thumb. If you have enough storage available, it will be beneficial to reduce faulting rates below 20. rmp _was_tips_Common_Spring2001_external.PRZ /18/01
133 PTDV Tool Details rmp _was_tips_Common_Spring2001_external.PRZ /18/01
134 Performance Data Collection Process on AS/400 Multi-threaded Java Application Main Thread Performance Data Collection Secondary Threads Performance Data Collected via AS/400 Performance Explorer (PEX) Support PEX Data Files on AS/400 Megabytes of data generated in seconds!! rmp _was_tips_Common_Spring2001_external.PRZ /18/01
135 Viewing AS/400 Performance Data Performance Explorer Report 1/13/99 13:17:33 Trace Information Page 50 Library.. : QPEXDATA Member... : JDBCTEST Description : BLANK Time Stamp. : Address Offset Object Name Obj Seg PRE NPgs LIC-Pgm--Offset MI-Pgm-----Offset NAGP PI AI T ST T ST FIX Unit Sector Span SKP XCH EXID IEID ss.mmm P M Task ID Parent-Pgm HLL-No CurrentPgm RC Delta Run Cycles Event PTY WaitSleep Cycles WODSC RS SNDTSK F OBCRT F OBCRT F OBCRT F OBCRT F OBCRT F OBCRT F OBCRT F JVXIT F OBCRT Listings are easily hundreds of pages!! Print PEX Report PEX Data Files on AS/400 rmp _was_tips_Common_Spring2001_external.PRZ /18/01
136 Viewing AS/400 Performance Data Performance Explorer Report 1/13/99 13:17:33 Trace Information Page 50 Library.. : QPEXDATA Member... : JDBCTEST Description : BLANK Time Stamp. : Address Offset Object Name Obj Seg PRE NPgs LIC-Pgm--Offset MI-Pgm-----Offset NAGP PI AI T ST T ST FIX Unit Sector Span SKP XCH EXID IEID ss.mmm P M Task ID Parent-Pgm HLL-No CurrentPgm RC Delta Run Cycles Event PTY WaitSleep Cycles WODSC RS SNDTSK F OBCRT F OBCRT F OBCRT F OBCRT F OBCRT F OBCRT F OBCRT F JVXIT F OBCRT Listings are easily hundreds of pages!! Print PEX Report Java Perf. Visualization Tool PEX Data Files on AS/400 rmp _was_tips_Common_Spring2001_external.PRZ /18/01
137 PTDV Features Allows you to view all running jobs and threads and see which are doing the most work Shows you a call trace for each thread, and shows amount of time, instructions, cycles, and objects used by each method call Summarizes information at trace, job, thread, and method level Detailed information on objects -- e.g. number of creates, locking behavior, lifetime rmp _was_tips_Common_Spring2001_external.PRZ /18/01
138 What type of PEX data does PTDV work with? Program Events JVAEntry/JVAExit MIEntry/MIExit MIStr/MIEnd MIPreCall/MIPostCall Java Events OBJCRT (Object Creates) THDSTTCHG (Java locks) Limited support for miscellaneous Java events (e.g. GC events) WebSphere Events JVM developers have made (and continue to make) enhancements in PDC data based on our input rmp _was_tips_Common_Spring2001_external.PRZ /18/01
139 Client-Server Architecture PTDV originally written to run on PC, use AS/400 only to access database Last year we redesigned to use a client- architecture Takes advantage of memory and processing power of Allows us to view 2 million events instead of only 300,000 Can still run the old way (mostly), or in 3-tier mode rmp _was_tips_Common_Spring2001_external.PRZ /18/01
140 PTDV Modes Thin Client PTDV Client RMI via PTDV PTDV Server JV1 PEX DB Files Thick Client PTDV jt400.jar JDBC via Java Toolbox Host Servers PEX DB Files Three Tier Manual Mode PTDV Client RMI via PTDV PTDV Server JV1, jt400.jar JDBC via Java Toolbox Host Servers PEX DB Files Can look like any of the above. Allows use of other JDBC drivers or other flags on JDBC URL. rmp _was_tips_Common_Spring2001_external.PRZ /18/01
141 PTDV Modes (cont.) Thin Client (client on PC, on AS/400) Must remain connected Process million events max Thick Client (client and on PC, db on AS/400) Can disconnect after initial processing Process 200, ,000 events max Three-Tier (client on PC, on AS/400, db on a second AS/400) Server runs on one AS/400, database on another Can disconnect the AS/400 - AS/400 link Process million events max Manual (can be configured like any of the above) rmp _was_tips_Common_Spring2001_external.PRZ /18/01
142 How Is it Used? Low-level analysis Successfully used for solving problems with: Pathlength Java Object leaks Excessive exception handling Excessive Java locking Functional problems/program understanding rmp _was_tips_Common_Spring2001_external.PRZ /18/01
143 Adding Method Entry/Exit Hooks There are two ways of adding hooks to a Java program: Run CRTJVAPGM on the jar/zip/class files with ENBPFRCOL(*ENTRYEXIT) Don't do this for system files such as classes.zip, rt.jar, etc. Use the JIT and enable hooks by specifying properties: java.compiler=jitc os400.enbpfrcol=1 For non-java MI programs, use CHGPGM ENBPFRCOL(*ENTRYEXIT) rmp _was_tips_Common_Spring2001_external.PRZ /18/01
144 Specifying Java Properties There are many ways to specify Java properties: When using the JAVA or RUNJVA CL programs: JAVA PROP((java.compiler jitc) (os400.enbpfrcol 1)) When using the java command from QSH: java -Djava.compiler=jitc -Dos400.enbpfrcol=1 For WebSphere 3.0+, in the command-line parameters for the application : -Djava.compiler=jitc -Dos400.enbpfrcol=1 In a file called /Q/UserData/Java400/SystemDefault.properties: java.compiler=jitc os400.enbpfrcol=1 rmp _was_tips_Common_Spring2001_external.PRZ /18/01
145 Limiting the Amount of Data Traces with method entry/exit hooks can be very large PTDV is currently limited to processing million events -- can be generated in 5 seconds or less on large systems You can limit the amount of data by: Changing the PEX definition to only collect events for the job you want Only adding hooks to the necessary jar files Only run a small number of transactions Starting and stopping PEX as quickly as possible If you already have an idea about what you're looking for, a long trace isn't usually necessary rmp _was_tips_Common_Spring2001_external.PRZ /18/01
146 WebSphere Events Beginning with 3.5.3, WebSphere Application Server for can generate PEX events, for example: application[un]availableforservice servlet[start Finish][Service Init Destroy] transaction[created Committed RollBack] EJB bean[created Removed Activated Passivated] EJB bean method [preinvoke postinvoke] DB connection[created Destroyed Allocated Freed] EJB Object Pool ORB Thread Pool PTDV has support for all of these events rmp _was_tips_Common_Spring2001_external.PRZ /18/01
147 Turning on WebSphere Events Only WebSphere (and future releases) have support for PEX Use a PEX definition that includes OSEVT(*MIEV13) Turn on EPM: right-click on running application, select Performance. Select the node you want to enable, and right-click To turn on events, choose "Low" To turn off events, choose "None" rmp _was_tips_Common_Spring2001_external.PRZ /18/01
148 Analyzing WebSphere Events Events show up as method calls Show "Extra Information" column for more data e.g. number of connections in db connection pool Try enabling method entry/exit hooks for user code (running in JIT), but not WebSphere (running with DE), and turning on WebSphere events Shows the application code details, and a high-level view of what WebSphere is doing Find transaction boundaries Find use of database connection pool rmp _was_tips_Common_Spring2001_external.PRZ /18/01
149 Why is PTDV important? Allows us to view data that no other tool (or platform) can give us Used extensively with Java and WebSphere analysis Locking/scalability problems Object creation problems Excessive exception handling Pathlength analysis rmp _was_tips_Common_Spring2001_external.PRZ /18/01
150 Cloning rmp _was_tips_Common_Spring2001_external.PRZ /18/01
151 What is cloning? Clones of a "model" application Workload can be transparently distributed across clones By the WebSphere Plug-In By the Network Dispatcher By EJBs Workload Management WLM Transparently distributes EJBs across multiple application s May allow for horizontal and vertical scaling rmp _was_tips_Common_Spring2001_external.PRZ /18/01
152 What is cloning? In order to enable cloning, you need to create a regular application and "promote" it to be a "model". Once the model is created you can create a number of clones and locate them in any of the participating nodes. Cloning has two objectives: workload management and failover support. There are various ways to distribute workload among the various clones - the websphere plugin can route HTTP requests to any of the clones, or you could use the SecureWay Network Dispatcher if your topology included multiple separate boxes each running an HTTP - also, EJB workload management distributes method calls across a cluster of clones. rmp _was_tips_Common_Spring2001_external.PRZ /18/01
153 Why Cloning? Provides Horizontal Scaling Provides the ability to add more machines to the WebSphere Domain Maximize Utilization of Machine Resources May provide better vertical scaling Better option than horizontal scaling Rule #1 of Cloning: "Tune the, Application Server and Application before cloning" rmp _was_tips_Common_Spring2001_external.PRZ /18/01
154 Why Cloning? Cloning is the key to WebSphere scaleability. Horizontal cloning, when possible, is an obvious solution to increasing an environment's throughput. However, even on a single system, cloning can lead to better utilization of system resources by maximizing parallelism. In any case - make sure that you tune your application and system before you clone - it is obviously easier to tune a single application and then clone, than trying to tune each individual clone afterwards. rmp _was_tips_Common_Spring2001_external.PRZ /18/01
Analyzing Java Performance on iseries
 Session #: E2122 Analyzing Java Performance on iseries Speaker: Gregory S. Hurlebaus Title: PartnerWorld for Developers, iseries Technology Consultant May 7-10, 2002 Abstract This presentation will cover
Analyzing IBM i Performance Metrics
 WHITE PAPER Analyzing IBM i Performance Metrics The IBM i operating system is very good at supplying system administrators with built-in tools for security, database management, auditing, and journaling.
Tuning WebSphere Application Server ND 7.0. Royal Cyber Inc.
 Tuning WebSphere Application Server ND 7.0 Royal Cyber Inc. JVM related problems Application server stops responding Server crash Hung process Out of memory condition Performance degradation Check if the
Enterprise Manager Performance Tips
 Enterprise Manager Performance Tips + The tips below are related to common situations customers experience when their Enterprise Manager(s) are not performing consistent with performance goals. If you
B M C S O F T W A R E, I N C. BASIC BEST PRACTICES. Ross Cochran Principal SW Consultant
 B M C S O F T W A R E, I N C. PATROL FOR WEBSPHERE APPLICATION SERVER BASIC BEST PRACTICES Ross Cochran Principal SW Consultant PAT R O L F O R W E B S P H E R E A P P L I C AT I O N S E R V E R BEST PRACTICES
WebSphere Architect (Performance and Monitoring) 2011 IBM Corporation
 2011 IBM Corporation") Track Name: Application Infrastructure Topic : WebSphere Application Server Top 10 Performance Tuning Recommendations. Presenter Name : Vishal A Charegaonkar WebSphere Architect (Performance and Monitoring)
Track Name: Application Infrastructure Topic : WebSphere Application Server Top 10 Performance Tuning Recommendations. Presenter Name : Vishal A Charegaonkar WebSphere Architect (Performance and Monitoring)
PART IV Performance oriented design, Performance testing, Performance tuning & Performance solutions. Outline. Performance oriented design
 PART IV Performance oriented design, Performance testing, Performance tuning & Performance solutions Slide 1 Outline Principles for performance oriented design Performance testing Performance tuning General
WAS Performance on i5/os. Lisa Wellman [email protected] May 2010
 WAS Performance on i5/os Lisa Wellman [email protected] May 2010 A simplified view: major WAS functions widely used Administered Java runtime environment HTTP request routing Web container Web thread pool
WebSphere Server Administration Course
 WebSphere Server Administration Course Chapter 1. Java EE and WebSphere Overview Goals of Enterprise Applications What is Java? What is Java EE? The Java EE Specifications Role of Application Server What
IBM WebSphere Server Administration
 IBM WebSphere Server Administration This course teaches the administration and deployment of web applications in the IBM WebSphere Application Server. Duration 24 hours Course Objectives Upon completion
Rational Application Developer Performance Tips Introduction
 Rational Application Developer Performance Tips Introduction This article contains a series of hints and tips that you can use to improve the performance of the Rational Application Developer. This article
Course Description. Course Audience. Course Outline. Course Page - Page 1 of 5
 Course Page - Page 1 of 5 WebSphere Application Server 7.0 Administration on Windows BSP-1700 Length: 5 days Price: $ 2,895.00 Course Description This course teaches the basics of the administration and
Performance Navigator Installation
 Midrange Performance Group / Performance Navigator Business Partner Installation / SOS / Capacity Planning Guide Aug 1, 2011 Overview Performance Navigator provides three main functions for the IBM i platform:
ITG Software Engineering
 IBM WebSphere Administration 8.5 Course ID: Page 1 Last Updated 12/15/2014 WebSphere Administration 8.5 Course Overview: This 5 Day course will cover the administration and configuration of WebSphere 8.5.
A Scalability Study for WebSphere Application Server and DB2 Universal Database
 A Scalability Study for WebSphere Application and DB2 Universal Database By Yongli An, Tsz Kin Tony Lau, and Peter Shum DB2 Universal Database Performance & Advanced Technology IBM Toronto Lab, IBM Canada
ERserver. iseries. Work management
 ERserver iseries Work management ERserver iseries Work management Copyright International Business Machines Corporation 1998, 2002. All rights reserved. US Government Users Restricted Rights Use, duplication
Practical Performance Understanding the Performance of Your Application
 Neil Masson IBM Java Service Technical Lead 25 th September 2012 Practical Performance Understanding the Performance of Your Application 1 WebSphere User Group: Practical Performance Understand the Performance
PTC System Monitor Solution Training
 PTC System Monitor Solution Training Patrick Kulenkamp June 2012 Agenda What is PTC System Monitor (PSM)? How does it work? Terminology PSM Configuration The PTC Integrity Implementation Drilling Down
Web Server (Step 1) Processes request and sends query to SQL server via ADO/OLEDB. Web Server (Step 2) Creates HTML page dynamically from record set
 Processes request and sends query to SQL server via ADO/OLEDB. Web Server (Step 2) Creates HTML page dynamically from record set") Dawn CF Performance Considerations Dawn CF key processes Request (http) Web Server (Step 1) Processes request and sends query to SQL server via ADO/OLEDB. Query (SQL) SQL Server Queries Database & returns
Dawn CF Performance Considerations Dawn CF key processes Request (http) Web Server (Step 1) Processes request and sends query to SQL server via ADO/OLEDB. Query (SQL) SQL Server Queries Database & returns
Tuning Your GlassFish Performance Tips. Deep Singh Enterprise Java Performance Team Sun Microsystems, Inc.
 Tuning Your GlassFish Performance Tips Deep Singh Enterprise Java Performance Team Sun Microsystems, Inc. 1 Presentation Goal Learn tips and techniques on how to improve performance of GlassFish Application
Running a Workflow on a PowerCenter Grid
 Running a Workflow on a PowerCenter Grid 2010-2014 Informatica Corporation. No part of this document may be reproduced or transmitted in any form, by any means (electronic, photocopying, recording or otherwise)
Tool - 1: Health Center
 Tool - 1: Health Center Joseph Amrith Raj http://facebook.com/webspherelibrary 2 Tool - 1: Health Center Table of Contents WebSphere Application Server Troubleshooting... Error! Bookmark not defined. About
WEBLOGIC ADMINISTRATION
 WEBLOGIC ADMINISTRATION Session 1: Introduction Oracle Weblogic Server Components Java SDK and Java Enterprise Edition Application Servers & Web Servers Documentation Session 2: Installation System Configuration
Delivering Quality in Software Performance and Scalability Testing
 Delivering Quality in Software Performance and Scalability Testing Abstract Khun Ban, Robert Scott, Kingsum Chow, and Huijun Yan Software and Services Group, Intel Corporation {khun.ban, robert.l.scott,
Oracle WebLogic Server 11g Administration
 Oracle WebLogic Server 11g Administration This course is designed to provide instruction and hands-on practice in installing and configuring Oracle WebLogic Server 11g. These tasks include starting and
KillTest. http://www.killtest.cn 半 年 免 费 更 新 服 务
 KillTest 质 量 更 高 服 务 更 好 学 习 资 料 http://www.killtest.cn 半 年 免 费 更 新 服 务 Exam : 1Z0-599 Title : Oracle WebLogic Server 12c Essentials Version : Demo 1 / 10 1.You deploy more than one application to the
Java Application Performance Analysis and Tuning on IBM System i
 IBM Systems & Technology Group Technical Conference 14 18 April, 2008, Sevilla, Spain Java Application Performance Analysis and Tuning on IBM System i iap02 Gottfried Schimunek Gottfried Schimunek Senior
EVALUATION ONLY. WA2088 WebSphere Application Server 8.5 Administration on Windows. Student Labs. Web Age Solutions Inc.
 WA2088 WebSphere Application Server 8.5 Administration on Windows Student Labs Web Age Solutions Inc. Copyright 2013 Web Age Solutions Inc. 1 Table of Contents Directory Paths Used in Labs...3 Lab Notes...4
Introduction. Part I: Finding Bottlenecks when Something s Wrong. Chapter 1: Performance Tuning 3
 Wort ftoc.tex V3-12/17/2007 2:00pm Page ix Introduction xix Part I: Finding Bottlenecks when Something s Wrong Chapter 1: Performance Tuning 3 Art or Science? 3 The Science of Performance Tuning 4 The
CA Nimsoft Monitor Snap
 CA Nimsoft Monitor Snap Configuration Guide for IIS Server Monitoring iis v1.5 series Legal Notices This online help system (the "System") is for your informational purposes only and is subject to change
Windows Server Performance Monitoring
 Spot server problems before they are noticed The system s really slow today! How often have you heard that? Finding the solution isn t so easy. The obvious questions to ask are why is it running slowly
WebSphere Application Server V7: Monitoring the Runtime
 Chapter 11 of WebSphere Application Server V7 Administration and Configuration Guide, SG24-7615 WebSphere Application Server V7: Monitoring the Runtime Being able to measure and monitor system interactions
CA Unified Infrastructure Management
 CA Unified Infrastructure Management Probe Guide for IIS Server Monitoring iis v1.7 series Copyright Notice This online help system (the "System") is for your informational purposes only and is subject
Chapter 1 - Web Server Management and Cluster Topology
 Objectives At the end of this chapter, participants will be able to understand: Web server management options provided by Network Deployment Clustered Application Servers Cluster creation and management
Estimate Performance and Capacity Requirements for Workflow in SharePoint Server 2010
 Estimate Performance and Capacity Requirements for Workflow in SharePoint Server 2010 This document is provided as-is. Information and views expressed in this document, including URL and other Internet
Part 3 - Performance: How to Fine-tune Your ODM Solution. An InformationWeek Webcast Sponsored by
 Part 3 - Performance: How to Fine-tune Your ODM Solution An InformationWeek Webcast Sponsored by Webcast Logistics Today s Presenters David Granshaw WODM Performance Architect (Events) Pierre-André Paumelle
Cognos8 Deployment Best Practices for Performance/Scalability. Barnaby Cole Practice Lead, Technical Services
 Cognos8 Deployment Best Practices for Performance/Scalability Barnaby Cole Practice Lead, Technical Services Agenda > Cognos 8 Architecture Overview > Cognos 8 Components > Load Balancing > Deployment
Richmond SupportDesk Web Reports Module For Richmond SupportDesk v6.72. User Guide
 Richmond SupportDesk Web Reports Module For Richmond SupportDesk v6.72 User Guide Contents 1 Introduction... 4 2 Requirements... 5 3 Important Note for Customers Upgrading... 5 4 Installing the Web Reports
HP NonStop JDBC Type 4 Driver Performance Tuning Guide for Version 1.0
 HP NonStop JDBC Type 4 Driver November 22, 2004 Author: Ken Sell 1 Introduction Java applications and application environments continue to play an important role in software system development. Database
CHAPTER 1 - JAVA EE OVERVIEW FOR ADMINISTRATORS
 CHAPTER 1 - JAVA EE OVERVIEW FOR ADMINISTRATORS Java EE Components Java EE Vendor Specifications Containers Java EE Blueprint Services JDBC Data Sources Java Naming and Directory Interface Java Message
Deploying Microsoft Operations Manager with the BIG-IP system and icontrol
 Deployment Guide Deploying Microsoft Operations Manager with the BIG-IP system and icontrol Deploying Microsoft Operations Manager with the BIG-IP system and icontrol Welcome to the BIG-IP LTM system -
Oracle WebLogic Server 11g: Monitor and Tune Performance
 D61529GC10 Edition 1.0 March 2010 D66055 Oracle WebLogic Server 11g: Monitor and Tune Performance Student Guide Author Shankar Raman Technical Contributors and Reviewer s Werner Bauer Nicole Haba Bala
Performance rule violations usually result in increased CPU or I/O, time to fix the mistake, and ultimately, a cost to the business unit.
 Is your database application experiencing poor response time, scalability problems, and too many deadlocks or poor application performance? One or a combination of zparms, database design and application
http://support.oracle.com/
 Oracle Primavera Contract Management 14.0 Sizing Guide October 2012 Legal Notices Oracle Primavera Oracle Primavera Contract Management 14.0 Sizing Guide Copyright 1997, 2012, Oracle and/or its affiliates.
Contents Introduction... 5 Deployment Considerations... 9 Deployment Architectures... 11
 Oracle Primavera Contract Management 14.1 Sizing Guide July 2014 Contents Introduction... 5 Contract Management Database Server... 5 Requirements of the Contract Management Web and Application Servers...
Solutions for detect, diagnose and resolve performance problems in J2EE applications
 IX Konferencja PLOUG Koœcielisko PaŸdziernik 2003 Solutions for detect, diagnose and resolve performance problems in J2EE applications Cristian Maties Quest Software Custom-developed J2EE applications
FileMaker Server 7. Administrator s Guide. For Windows and Mac OS
 FileMaker Server 7 Administrator s Guide For Windows and Mac OS 1994-2004, FileMaker, Inc. All Rights Reserved. FileMaker, Inc. 5201 Patrick Henry Drive Santa Clara, California 95054 FileMaker is a trademark
MEASURING WORKLOAD PERFORMANCE IS THE INFRASTRUCTURE A PROBLEM?
 MEASURING WORKLOAD PERFORMANCE IS THE INFRASTRUCTURE A PROBLEM? Ashutosh Shinde Performance Architect [email protected] Validating if the workload generated by the load generating tools is applied
User Guide for VMware Adapter for SAP LVM VERSION 1.2
 User Guide for VMware Adapter for SAP LVM VERSION 1.2 Table of Contents Introduction to VMware Adapter for SAP LVM... 3 Product Description... 3 Executive Summary... 3 Target Audience... 3 Prerequisites...
Monitoring HP OO 10. Overview. Available Tools. HP OO Community Guides
 HP OO Community Guides Monitoring HP OO 10 This document describes the specifications of components we want to monitor, and the means to monitor them, in order to achieve effective monitoring of HP Operations
Performance Monitoring API for Java Enterprise Applications
 Performance Monitoring API for Java Enterprise Applications Purpose Perfmon4j has been successfully deployed in hundreds of production java systems over the last 5 years. It has proven to be a highly successful
VirtualCenter Database Performance for Microsoft SQL Server 2005 VirtualCenter 2.5
 Performance Study VirtualCenter Database Performance for Microsoft SQL Server 2005 VirtualCenter 2.5 VMware VirtualCenter uses a database to store metadata on the state of a VMware Infrastructure environment.
Integrating VoltDB with Hadoop
 The NewSQL database you ll never outgrow Integrating with Hadoop Hadoop is an open source framework for managing and manipulating massive volumes of data. is an database for handling high velocity data.
Java Troubleshooting and Performance
 Java Troubleshooting and Performance Margus Pala Java Fundamentals 08.12.2014 Agenda Debugger Thread dumps Memory dumps Crash dumps Tools/profilers Rules of (performance) optimization 1. Don't optimize
MyOra 3.0. User Guide. SQL Tool for Oracle. Jayam Systems, LLC
 MyOra 3.0 SQL Tool for Oracle User Guide Jayam Systems, LLC Contents Features... 4 Connecting to the Database... 5 Login... 5 Login History... 6 Connection Indicator... 6 Closing the Connection... 7 SQL
MagDiSoft Web Solutions Office No. 102, Bramha Majestic, NIBM Road Kondhwa, Pune -411048 Tel: 808-769-4605 / 814-921-0979 www.magdisoft.
 WebLogic Server Course Following is the list of topics that will be covered during the course: Introduction to WebLogic What is Java? What is Java EE? The Java EE Architecture Enterprise JavaBeans Application
Install guide for Websphere 7.0
 DOCUMENTATION Install guide for Websphere 7.0 Jahia EE v6.6.1.0 Jahia s next-generation, open source CMS stems from a widely acknowledged vision of enterprise application convergence web, document, search,
DMS Performance Tuning Guide for SQL Server
 DMS Performance Tuning Guide for SQL Server Rev: February 13, 2014 Sitecore CMS 6.5 DMS Performance Tuning Guide for SQL Server A system administrator's guide to optimizing the performance of Sitecore
026-1010 Rev 7 06-OCT-2011. Site Manager Installation Guide
 026-1010 Rev 7 06-OCT-2011 Site Manager Installation Guide Retail Solutions 3240 Town Point Drive NW, Suite 100 Kennesaw, GA 30144, USA Phone: 770-425-2724 Fax: 770-425-9319 Table of Contents 1 SERVER
Performance Monitoring and Tuning. Liferay Chicago User Group (LCHIUG) James Lefeu 29AUG2013
 James Lefeu 29AUG2013") Performance Monitoring and Tuning Liferay Chicago User Group (LCHIUG) James Lefeu 29AUG2013 Outline I. Definitions II. Architecture III.Requirements and Design IV.JDK Tuning V. Liferay Tuning VI.Profiling
Performance Monitoring and Tuning Liferay Chicago User Group (LCHIUG) James Lefeu 29AUG2013 Outline I. Definitions II. Architecture III.Requirements and Design IV.JDK Tuning V. Liferay Tuning VI.Profiling
IBM i on Power - Performance FAQ
 IBM i on Power - Performance FAQ February 5, 2013 IBM Corporation Table of Contents 1 Introduction 8 1.1 Purpose of this document 8 1.2 Overview 8 1.3 Document Responsibilities 8 2 What Is Performance?
WEBAPP PATTERN FOR APACHE TOMCAT - USER GUIDE
 WEBAPP PATTERN FOR APACHE TOMCAT - USER GUIDE Contents 1. Pattern Overview... 3 Features 3 Getting started with the Web Application Pattern... 3 Accepting the Web Application Pattern license agreement...
An Oracle White Paper July 2011. Oracle Primavera Contract Management, Business Intelligence Publisher Edition-Sizing Guide
 Oracle Primavera Contract Management, Business Intelligence Publisher Edition-Sizing Guide An Oracle White Paper July 2011 1 Disclaimer The following is intended to outline our general product direction.
IBM Systems Director Navigator for i5/os New Web console for i5, Fast, Easy, Ready
 Agenda Key: Session Number: 35CA 540195 IBM Systems Director Navigator for i5/os New Web console for i5, Fast, Easy, Ready 8 Copyright IBM Corporation, 2008. All Rights Reserved. This publication may refer
How To Improve Performance On An Asa 9.4 Web Application Server (For Advanced Users)
") Paper SAS315-2014 SAS 9.4 Web Application Performance: Monitoring, Tuning, Scaling, and Troubleshooting Rob Sioss, SAS Institute Inc., Cary, NC ABSTRACT SAS 9.4 introduces several new software products
Paper SAS315-2014 SAS 9.4 Web Application Performance: Monitoring, Tuning, Scaling, and Troubleshooting Rob Sioss, SAS Institute Inc., Cary, NC ABSTRACT SAS 9.4 introduces several new software products
SysPatrol - Server Security Monitor
 SysPatrol Server Security Monitor User Manual Version 2.2 Sep 2013 www.flexense.com www.syspatrol.com 1 Product Overview SysPatrol is a server security monitoring solution allowing one to monitor one or
JBoss Seam Performance and Scalability on Dell PowerEdge 1855 Blade Servers
 JBoss Seam Performance and Scalability on Dell PowerEdge 1855 Blade Servers Dave Jaffe, PhD, Dell Inc. Michael Yuan, PhD, JBoss / RedHat June 14th, 2006 JBoss Inc. 2006 About us Dave Jaffe Works for Dell
TIBCO Spotfire Metrics Modeler User s Guide. Software Release 6.0 November 2013
 TIBCO Spotfire Metrics Modeler User s Guide Software Release 6.0 November 2013 Important Information SOME TIBCO SOFTWARE EMBEDS OR BUNDLES OTHER TIBCO SOFTWARE. USE OF SUCH EMBEDDED OR BUNDLED TIBCO SOFTWARE
Informatica Master Data Management Multi Domain Hub API: Performance and Scalability Diagnostics Checklist
 Informatica Master Data Management Multi Domain Hub API: Performance and Scalability Diagnostics Checklist 2012 Informatica Corporation. No part of this document may be reproduced or transmitted in any
WhatsUp Gold v11 Features Overview
 WhatsUp Gold v11 Features Overview This guide provides an overview of the core functionality of WhatsUp Gold v11, and introduces interesting features and processes that help users maximize productivity
Enterprise Performance Tuning: Best Practices with SQL Server 2008 Analysis Services. By Ajay Goyal Consultant Scalability Experts, Inc.
 Enterprise Performance Tuning: Best Practices with SQL Server 2008 Analysis Services By Ajay Goyal Consultant Scalability Experts, Inc. June 2009 Recommendations presented in this document should be thoroughly
WebSphere Application Server - Introduction, Monitoring Tools, & Administration
 WebSphere Application Server - Introduction, Monitoring Tools, & Administration presented by: Michael S. Pallos, MBA Senior Solution Architect IBM Certified Systems Expert: WebSphere MQ 5.2 e-business
The Complete Performance Solution for Microsoft SQL Server
 The Complete Performance Solution for Microsoft SQL Server Powerful SSAS Performance Dashboard Innovative Workload and Bottleneck Profiling Capture of all Heavy MDX, XMLA and DMX Aggregation, Partition,
vcenter Operations Management Pack for SAP HANA Installation and Configuration Guide
 vcenter Operations Management Pack for SAP HANA Installation and Configuration Guide This document supports the version of each product listed and supports all subsequent versions until a new edition replaces
CA Workload Automation Agent for Databases
 CA Workload Automation Agent for Databases Implementation Guide r11.3.4 This Documentation, which includes embedded help systems and electronically distributed materials, (hereinafter referred to as the
Installation and Configuration Guide for Windows and Linux
 Installation and Configuration Guide for Windows and Linux vcenter Operations Manager 5.0.3 This document supports the version of each product listed and supports all subsequent versions until the document
Load Manager Administrator s Guide For other guides in this document set, go to the Document Center
 Load Manager Administrator s Guide For other guides in this document set, go to the Document Center Load Manager for Citrix Presentation Server Citrix Presentation Server 4.5 for Windows Citrix Access
<Insert Picture Here> Java Application Diagnostic Expert
 Java Application Diagnostic Expert Agenda 1. Enterprise Manager 2. Challenges 3. Java Application Diagnostics Expert (JADE) 4. Feature-Benefit Summary 5. Features Overview Diagnostic
Liferay Performance Tuning
 Liferay Performance Tuning Tips, tricks, and best practices Michael C. Han Liferay, INC A Survey Why? Considering using Liferay, curious about performance. Currently implementing and thinking ahead. Running
Mission-Critical Java. An Oracle White Paper Updated October 2008
 Mission-Critical Java An Oracle White Paper Updated October 2008 Mission-Critical Java The Oracle JRockit family of products is a comprehensive portfolio of Java runtime solutions that leverages the base
Monitor and Manage Your MicroStrategy BI Environment Using Enterprise Manager and Health Center
 Monitor and Manage Your MicroStrategy BI Environment Using Enterprise Manager and Health Center Presented by: Dennis Liao Sales Engineer Zach Rea Sales Engineer January 27 th, 2015 Session 4 This Session
Java Monitoring. Stuff You Can Get For Free (And Stuff You Can t) Paul Jasek Sales Engineer
 Paul Jasek Sales Engineer") Java Monitoring Stuff You Can Get For Free (And Stuff You Can t) Paul Jasek Sales Engineer A Bit About Me Current: Past: Pre-Sales Engineer (1997 present) WaveMaker Wily Persistence GemStone Application
Java Monitoring Stuff You Can Get For Free (And Stuff You Can t) Paul Jasek Sales Engineer A Bit About Me Current: Past: Pre-Sales Engineer (1997 present) WaveMaker Wily Persistence GemStone Application
Understanding Server Configuration Parameters and Their Effect on Server Statistics
 Understanding Server Configuration Parameters and Their Effect on Server Statistics Technical Note V2.0, 3 April 2012 2012 Active Endpoints Inc. ActiveVOS is a trademark of Active Endpoints, Inc. All other
Table of Contents. Chapter 1: Introduction. Chapter 2: Getting Started. Chapter 3: Standard Functionality. Chapter 4: Module Descriptions
 Table of Contents Chapter 1: Introduction Chapter 2: Getting Started Chapter 3: Standard Functionality Chapter 4: Module Descriptions Table of Contents Table of Contents Chapter 5: Administration Table
Oracle Weblogic. Setup, Configuration, Tuning, and Considerations. Presented by: Michael Hogan Sr. Technical Consultant at Enkitec
 Oracle Weblogic Setup, Configuration, Tuning, and Considerations Presented by: Michael Hogan Sr. Technical Consultant at Enkitec Overview Weblogic Installation and Cluster Setup Weblogic Tuning Considerations
PeopleSoft Online Performance Guidelines
 PeopleSoft Online Performance Guidelines Agenda Introduction Web Browser configuration Web Server configuration Application Server PIA PeopleSoft Internet Architecture Introduction Pure Internet Architecture
Installation and Configuration Guide for Windows and Linux
 Installation and Configuration Guide for Windows and Linux vcenter Operations Manager 5.7 This document supports the version of each product listed and supports all subsequent versions until the document
EPiServer Operator's Guide
 EPiServer Operator's Guide Abstract This document is mainly intended for administrators and developers that operate EPiServer or want to learn more about EPiServer's operating environment. The document
Server & Workstation Installation of Client Profiles for Windows
 C ase Manag e m e n t by C l i e n t P rofiles Server & Workstation Installation of Client Profiles for Windows T E C H N O L O G Y F O R T H E B U S I N E S S O F L A W General Notes to Prepare for Installing
CA Nimsoft Monitor. Probe Guide for Apache HTTP Server Monitoring. apache v1.5 series
 CA Nimsoft Monitor Probe Guide for Apache HTTP Server Monitoring apache v1.5 series Legal Notices This online help system (the "System") is for your informational purposes only and is subject to change
Optimize GlassFish Performance in a Production Environment Performance White Paper February 2009. Abstract
 Optimize GlassFish Performance in a Production Environment Performance White Paper February 2009 Abstract Sun GlassFish Application Server v2 is a high performance application server. This white paper
Load Testing and Monitoring Web Applications in a Windows Environment
 OpenDemand Systems, Inc. Load Testing and Monitoring Web Applications in a Windows Environment Introduction An often overlooked step in the development and deployment of Web applications on the Windows
WHITE PAPER. Domo Advanced Architecture
 WHITE PAPER Domo Advanced Architecture Overview There are several questions that any architect or technology advisor may ask about a new system during the evaluation process: How will it fit into our organization
Performance Tuning Guide for ECM 2.0
 Performance Tuning Guide for ECM 2.0 Rev: 20 December 2012 Sitecore ECM 2.0 Performance Tuning Guide for ECM 2.0 A developer's guide to optimizing the performance of Sitecore ECM The information contained
CA Nimsoft Monitor. Probe Guide for IIS Server Monitoring. iis v1.5 series
 CA Nimsoft Monitor Probe Guide for IIS Server Monitoring iis v1.5 series Legal Notices Copyright 2013, CA. All rights reserved. Warranty The material contained in this document is provided "as is," and
Java DB Performance. Olav Sandstå Sun Microsystems, Trondheim, Norway Submission ID: 860
 Java DB Performance Olav Sandstå Sun Microsystems, Trondheim, Norway Submission ID: 860 AGENDA > Java DB introduction > Configuring Java DB for performance > Programming tips > Understanding Java DB performance
DB2 for i. Analysis and Tuning. Mike Cain IBM DB2 for i Center of Excellence. [email protected]
 DB2 for i Monitoring, Analysis and Tuning Mike Cain IBM DB2 for i Center of Excellence Rochester, MN USA [email protected] 8 Copyright IBM Corporation, 2008. All Rights Reserved. This publication may refer
Web Performance, Inc. Testing Services Sample Performance Analysis
 Web Performance, Inc. Testing Services Sample Performance Analysis Overview This document contains two performance analysis reports created for actual web testing clients, and are a good example of the