NetXMS Administrator Guide
|
|
|
- Drusilla Preston
- 8 years ago
- Views:
Transcription
1 NetXMS Administrator Guide Release 2.0-M2 Raden Solutions, SIA November 26, 2015

2

3 CONTENTS 1 Preface Purpose of this document What is NetXMS Supported operating systems and databases Where to get support Conventions Changelog Concepts Architecture overview Objects Event Processing Polling Data Collection Discovery Security Installation Planing Installing on Debian or Ubuntu Installing on Red Hat, Fedora, CentOS or ScientificLinux Installing on Windows Install on Android Generic installation, upgrade and downgrade using source tarball Cryptographic verification of installation files Customizing the compilation process WebUI additional configuration Upgrade Upgrading on Debian or Ubuntu Upgrading on Red Hat, Fedora, CentOS or ScientificLinux Upgrading on Windows Generic upgrade using source tarball Centralized agent upgrade Quick start Default Credentials Basic agent configuration Basic server tuning SMTP SNMP Defaults Actions and Alarms Passive discovery Manually add node Add DCI thresholds i

4 6 Agent management Introduction Agent configuration files Agent configuration options from server Agent registration Security Subagents Agent Proxy node configuration Agent External Metrics Server management Configuration file Configuration variables Synchronization between servers netxmsd commandline options Server debug console Configuring self-monitoring Database connection pool ICMP proxy SNMP MIB Explorer SNMP Trap Configuration Setting default SNMP credentials Using iftable and ifxtable Configure SNMP Proxy Configure SNMP Trap Proxy Import MIB User management Introduction Terms and Definitions User Authentication Integration with LDAP Managing User Accounts Audit Object management Object browser Objects Common object properties Object Details Object Tools Predefined Object Tools Network discovery Introduction Configuring Network Discovery Data collection How data collection works DCI configuration Offline data collection Last DCI values View Thresholds Templates Instance Discovery Working with collected data ii

5 13 Event processing Event Processing Policy Alarms Actions NXLS Persistent Storage Macros for Event Processing Data and Network visualisation Network maps Dashboards Graphs History Summary table Common monitoring tasks (rename this chapter!) Operating System File meta information Log monitoring Service monitoring Database monitoring Application monitoring ICMP ping Monitoring hardware(sensors) UPS monitoring Cluster monitoring Monitoring mobile devices Network topology Introduction How topology information built Find where node is connected Find MAC address Find IP address Business services and SLA Introduction Services, node links, service checks Configuration and usage Remote file management Agent file management Server File Managment Reporting User Interface Configuration Image library Introduction Image Library View Mobile Console Main window Alarms Dashboard Nodes Graphics MACaddress Settings iii
 159 15.1 Operating System.......................................... 159 15.2 File meta information.")
6 21.8 Global settings Connection Notifications Interface Advanced topics Zones Hooks (Pollers hooks) Troubleshooting Automatic actions on a new node Scripting Scripting library Execute Server Script NXSL NXShell Appendix SMS Drivers Agent configuration file (nxagentd.conf) Server configuration file (netxmsd.conf) Server configuration parameters Bundled Subagents Command line tools List of supported metrics Glossary 325 Index 329 iv

7 CHAPTER ONE PREFACE 1.1 Purpose of this document Purpose of this document is to provide knowledge about NetXMS installation, configuration and usage. It contains all required information for installation and operation managers. Document contain Quick start chapter, that describes default installation and some simple metric configuration. Installation and Upgrade chapters contain more detailed information about NetXMS and its components installation and upgrade. To get familiar with main concepts of NetXMS use Concepts chapter. Concepts is main chapter, that provides all necessary information to successfully operate NetXMS. List of built in monitoring options can be found there: Common monitoring tasks (rename this chapter!) chapter. There is also big chapter about NXLS scripting. Mostly this document describes work with Desktop and Web management consoles. Mostly they have similar functionality so there is no separated descriptions of them. Web based console have some limitation, this limitations will be described in a feature text as a notes. There is separate part that describes Mobile NetXMS agent configuration GUI and Mobile Console. This document does not contain detailed description of NetXMS architecture. To get this information please refer to Concept guide. 1.2 What is NetXMS NetXMS is an enterprise grade multi-platform modular open source network management and monitoring system. It provides comprehensive event management, performance monitoring, alerting, reporting and graphing for all layers of IT infrastructure from network devices to business application layer. Having been designed with flexibility and scalability in mind, NetXMS features a wide range of supported platforms. It is licensed under the GNU General Public License version 2 as published by the Free Software Foundation. 1.3 Supported operating systems and databases NetXMS supports most popular operation systems. Supported operating systems for NetXMS server: Windows Server 2003, Windows Vista, Windows Server 2008, Windows Server 2008R2, Windows 7, Windows 8, Windows 8.1, Windows Server 2012, Windows Server 2012R2 RedHat Enterprise Linux, SUSE Linux, CentOS, Debian Linux, Ubuntu Linux FreeBSD, NetBSD, OpenBSD Solaris 10, 11 HP-UX 11.23, AIX

8 Supported DBMS engines for NetXMS server Microsoft SQL MySQL Oracle 11g, 12 PostgreSQL 8+ DB/2 SQLite(it is highly recommended use this option only for test purpose) Supported operating systems for NetXMS agent Windows XP, Windows Server 2003, Windows Vista, Windows Server 2008, Windows Server 2008R2, Windows 7, Windows 8, Windows 8.1, Windows Server 2012, Windows Server 2012R2 Linux (all glibc2-based flavors) FreeBSD, NetBSD, OpenBSD Solaris HP-UX AIX 1.4 Where to get support Todo Add that solutions and FAQ can be found on wiki Forum, Facebook/Twitter/G+/IRC Links to NetXMS in social media: Forum Facebook Google+: Twitter: IRC: #netxms on freenode. List of servers Stay informed of new releases 1.5 Conventions The following typographical conventions are used in this manual. Sample Description Button Any GUI element: Button, Menu item Another Guide Reference to external manual or man page Control-M Keyboard shortcut DCI Term which could be found in glossary File Exit Menu selection path, you must click on File, then Exit 2 Chapter 1. Preface
 FreeBSD, NetBSD, OpenBSD Solaris HP-UX AIX 1.4 Where to get support Todo Add that solutions and FAQ can be found on wiki.")
9 1.6 Changelog Only major changes are lister here. Complete change log is available at Changelog 3

10 4 Chapter 1. Preface

11 CHAPTER TWO CONCEPTS 2.1 Architecture overview The system has three-tier architecture: the information is collected by monitoring agents (either our own highperformance agents or SNMP agents) and delivered to monitoring server for processing and storage. Network administrator can access collected data using cross-platform Management Console, Web Interface or Management Console for Android. Architecture scheme NetXMS server is daemon or service. It collects, process and stores data, does network discovery. Server is modular and can be extended with additional functionality. By it selves server can collect only some simple information about nodes or can use SNMP agent to collect data from SNMP-capable devices. NetXMS has special drivers for different types of SNMP devices that collect data like VLANs, interfaces and other default collected information. NetXMS server does not support horizontal scaling. For now it is possible only event exchange between servers. NetXMS agent is daemon or service that is installed on nodes to provide additional monitoring options and can be used like SNMP agent or NetXMS agent proxy. Agent implements communication with server and work with configuration. Agent functionality is extended with subagents. Server uses 4701 port to communicate with agents. There are default OS subagents and manually loaded like file manager, ping or others. There are different types of subagents. It can be just a library that is loaded by NetXMS agent or it can be application that uses NetXMS subagent library to provide required subagent interface. Library type of subagents can be run as one process with agent or as a separate process. It can be used when it is necessary to run them under different user privileges. Agent uses 4700 port to communicate with server. Subagent can be also run as a separate application. NetXMS also provides some command line tools like nxdbmgr(work with NetXMS database), nxencpasswd(password encryption) and others. Information about this tools can be found in Command line tools chapter. In further chapters will be described main NetXMS objects and concepts. 5

12 2.2 Objects All network infrastructure monitored by NetXMS inside monitoring system represented as a set of objects. Each object represents one physical or logical entity (like host or network interface), or group of them. Objects are organized into hierarchical structure. Each object has it s own access rights. Access rights are applied hierarchically on all children of object. For example if it grant Read access right for user on a Container, than user have Read right on all objects that contains this Container. Every object has set of attributes; some of them are common (like id and name or status), while other depends on object class for example, only Node objects have attribute SNMP community string. There are default attributes and custom attributes defined either by user or integrated application via NetXMS API. NetXMS has eight top level objects Entire Network, Service Root, Template Root, Policy Root, Network Map Root, Dashboard Root, Report Root, and Business Service Root. These objects served as an abstract root for appropriate object tree. All top level objects has only one editable attribute name. Object Class Description Valid Child Objects Entire Network Abstract object representing root of IP topology tree. All zone and subnet objects located under it. System can have only one object of this class. Zone (if zoning enabled) Subnet (if zoning disabled) Zone Subnet Node Cluster Object representing group of (usually interconnected) IP networks without overlapping addresses. Contains appropriate subnet objects. Object representing IP subnet. Typically objects of this class created automatically by the system to reflect system s knowledge of IP topology. The system places Node objects inside an appropriate Subnet object based on an interface configuration. Subnet objects have only one editable attribute - Name. Object representing physical host or network device(such as routers and switches). These objects can be created either manually by administrator or automatically during network discovery process. They have a lot of attributes controlling all aspects of interaction between NetXMS server and managed node. For example, the attributes specify what data must be collected, how node status must be checked, which protocol versions to use etc. Node objects contain one or more interface objects. The system creates interface objects automatically during configuration polls. Object representing cluster consisted of two or more hosts. Subnet Node Interface Network Service VPN Connector Node Interface Interface objects represent network interfaces of managed computers and devices. These objects created automatically by the system during configuration polls or can be created manually by user. Continued on next page 6 Chapter 2. Concepts

13 Table 2.1 continued from previous page Object Class Description Valid Child Objects Network Service VPN Connector Service Root Object representing network service running on a node (like http or ssh), which is accessible online (via TCP IP). Network Service objects are always created manually. Currently, the system works with the following protocols - HTTP, POP3, SMTP, Telnet, SSH and Custom protocol type. Object representing VPN tunnel endpoint. Such objects can be created to add VPN tunnels to network topology known y NetXMS server. VPN Connector objects are created manually. In case if there is a VPN connection linking two different networks open between two firewalls that are added to the system as objects, a user can create a VPN Connector object on each of the firewall objects and link one to another. The network topology will now show that those two networks are connected and the system will take this condition into account during problem analysis and event correlation. Abstract object representing root of your infrastructure service tree. System can have only one object of this class. Cluster Condition Container Mobile Device Node Subnet Container Grouping object which can contain nodes, subnets, clusters, conditions, or other containers. With help of container objects you can build object s tree which represents logical hierarchy of IT services in your organization. Cluster Condition Container Mobile Device Node Subnet Condition Template Root Object representing complicated condition like cpu on node1 is overloaded and node2 is down for more than 10 minutes. Conditions may represent more complicated status checks because each condition can have a script attached. Interval for evaluation of condition status is configured in Server Configuration Variables as ConditionPollingInterval with default value 60 seconds. Abstract object representing root of your template tree. Template Template Group Continued on next page 2.2. Objects 7

14 Table 2.1 continued from previous page Object Class Description Valid Child Objects Template Group Grouping object which can contain templates or other template groups. Template Template Group Template Data collection template. See Data Collection section for more information about templates. Mobile Device Node Root Network Map Abstract object representing root of your network map tree. Network Map Network Map Group Network Group Map Grouping object which can contain network maps or other network map groups. Network Map Network Map Group Network Map Dashboard Root Network map. Abstract object representing root of your dashboard tree. Dashboard Dashboard Dashboard. Can contain other dashboards. Dashboard Business Service Root Abstract object representing root of your business service tree. System can have only one object of this class. Business Service Business Service Object representing single business service. Can contain other business services, node links, or service checks. Business Service Node Link Service Check Node Link Link between node object and business service. Used to simplify creation of node-related service checks. Service Check Service Check Object used to check business service state. One business service can contain multiple checks Object status Each object has a status. Status of the object calculated based on polling results, status of underlying objects, associated alarms and status DCIs. For some object classes, like Report or Template, status is irrelevant. Status 8 Chapter 2. Concepts

15 for such objects is always Normal. Object s status can be one of the following: Nr. Status Description 0 Normal Object is in normal state. 1 Warning Warning(s) exist for the object. 2 Minor Minor problem(s) exist for the object. 3 Major Major problem(s) exist for the object. 4 Critical Critical problem(s) exist for the object. 5 Unknown Object s status is unknown to the management server. 6 Unmanaged Object is set to unmanaged state. 7 Disabled Object is administratively disabled (only applicable to interface objects). 8 Testing Object is in testing state (only applicable to interface objects). 2.3 Event Processing NetXMS is event based monitoring system. Events can come from different sources (polling processes (status, configuration, discovery, and data collection), SNMP traps, and directly from external applications via client library.) and all are forwarded to NetXMS Event Queue. All events are processed by NetXMS Event Processor one-by-one, according to the processing rules defined in Event Processing Policy. As a result of event processing, preconfigured actions can be executed, and/or event can be shown up as alarm. Usually alarm represents something that needs attention of network administrators or network control center operators, for example low free disk space on a server. NetXMS provides one centralized location, the Alarm Browser, where the alarms are visible. It can be configured which events should be considered important enough to show up as alarm. Figure 2.1: Event flow inside the monitoring system 2.3. Event Processing 9
. 2.3 Event Processing NetXMS is event based monitoring system.")
16 2.4 Polling For some type of objects NetXMS server start gathering status and configuration information as soon as they are added to the system. These object types are: nodes, conditions, clusters, business services. This process called polling. There are multiple polling types, usually performed with different intervals: Type Status Configuration Topology Discovery Routing Purpose Determine current status of an object Determine current configuration of an object (list of interfaces, supported protocols, etc.) Gather information related to network topology Find potential new nodes during network discovery cycles Gather information about IP routing 2.5 Data Collection One of NetXMS important parts is Data Collection. Every Node can have many metrics, like CPU utilization, amount of free memory or disk space usage. NetXMS server can collect these parameters, check them for threshold violations and store them in the database. Configuration for metric collection is called Data Collection Item. There can be different sources for metrics. Table bellow lists possible sources and gives some simple description about them. Source Internal NetXMS Agent SNMP Push SM-CLP Windows Performance counters Check Point SNMP Script Description This type of source does not require any node configuration. It is collected by server. This type of source required NetXMS agent installation on a node. This list can be supplemented with subagents. Metrics are requested by server. This type of source requires SNMP configuration on device and server. This type of source requires installation of nxpush command line tool and script creation that will run this tool in requested intervals and will provide to server metric data. This type of source requires creation of script in Script Library that will be executed according to schedule to gent next value. Collected data can be analyzed manually by viewing it with help of History table, graph, displayed on Dashboard or on Network Map. Other option to use collected data is to configure threshold. Each threshold is executed on a new coming data and generates user predefined event if data meets threshold rules. Generated event will be processed with other events. 2.6 Discovery Network discovery NetXMS is capable of discovering your network automatically. Network discovery module can operate in two modes - passive and active. In passive mode, information about new hosts and devices obtained from ARP tables and routing tables of already known devices. NetXMS starts with it s own ARP cache and routing table. In active discovery mode, NetXMS server will send an ICMP echo requests to all IP addresses in given range, and consider each responding address for adding to database. For each new device found NetXMS server tries to gather additional information using SNMP and NetXMS agent, and then adds it to database. By default NetXMS server will add all discovered devices to database, but you can limit it by using discovery filters. 10 Chapter 2. Concepts

17 2.6.2 Service discovery TBD (not implemented yet) 2.7 Security There are described some concepts of NetXMS that are connected with data protection. Messages between NetXMS agent and NetXMS server can be encrypted, encryption between them can be forced by NetXMS configuration. There can be also added Shared Secret that is checked on agent-server connection and in case server does not know secret of an agent, connection will not be established. Another possibility to control access to the agent is choosing the correct server access level in agent configuration properties (MasterServers, Servers, ControlServers). There can be set different access levels for different servers. When it is required to write password or Shared Secret in agent configuration file, there is possibility to encrypt it. All passwords can be encrypted with help of nxencpasswd command line tool and added in configuration in encrypted way Security 11
.")
18 12 Chapter 2. Concepts

19 CHAPTER THREE INSTALLATION 3.1 Planing Operating system Supported operating systems for NetXMS server: Windows Server 2003, Windows Vista, Windows Server 2008, Windows Server 2008R2, Windows 7, Windows 8, Windows 8.1, Windows Server 2012, Windows Server 2012R2 RedHat Enterprise Linux, SUSE Linux, CentOS, Debian Linux, Ubuntu Linux FreeBSD, NetBSD, OpenBSD Solaris 10, 11 HP-UX 11.23, AIX Supported operating systems for NetXMS agent: Windows XP, Windows Server 2003, Windows Vista, Windows Server 2008, Windows Server 2008R2, Windows 7, Windows 8, Windows 8.1, Windows Server 2012, Windows Server 2012R2 Linux (all glibc2-based flavors) FreeBSD, NetBSD, OpenBSD Solaris HP-UX AIX If you wish to compile NetXMS server with encryption support on UNIX, you must have OpenSSL package installed Server Minimum requirements: Intel Pentium III 500 MHz, 256MB RAM, 256MB of free disk space. Note: In free disk space requirements is taken into account only initial server size, without Database and possible files that can be loaded to server(agent update packages, pictures, etc). Recommended on ~1000 nodes: Intel Xeon Processor E5502, 4GB RAM, 8GB of free disk space. Note: In free disk space requirements is taken into account server size, without Database. Additional RAM may be required for large installations (1000+ nodes). For non-intel platforms, an equivalent hardware must be used. 13

20 3.1.3 Database Supported DBMS engines for NetXMS server: Microsoft SQL MySQL Oracle 11g, 12 PostgreSQL 8+ DB/2 SQLite(it is highly recommended use this option only for test purpose) Database size and load is very hard to predict, because it is dependent on a number of monitored nodes and collected parameters. If you plan to install database engine on the same machine as NetXMS server, increase your hardware requirements accordingly. Link to Excel file that allows roughly estimate the size that will be required for database: Agent Agent can run on any device where OS can run. 3.2 Installing on Debian or Ubuntu We provide deb packages for Debian users at which is our public APT repository. Packages are signed, so you ll need to install additional encryption key for signature verification. Note: At the moment (23/3/15) we provide binary packages for Debian only, Ubuntu support will be shortly. There are 2 options for server and agent installation on Debian/Ubuntu systems: using APT repository or from source. There will be described instruction only for APT repository. I installation using source tarball is described there Adding our APT repository There are two options to add APT repository. Using recommended way of adding APT repository you will not have errors in case if keys will be changed. After repository is added run package update command: apt-get update Recommended Install netxms-release_1.0-1_all.deb package that contain description of NetXMS repository (this package should support all Debian and Ubuntu systems): wget dpkg -i netxms-release_1.0-1_all.deb 14 Chapter 3. Installation

21 Usual Add the repository to your sources.list (change wheezy to correct distro name): deb wheezy main Fetch and install the GnuPG key: wget -q -O - sudo apt-key add Installing packages Server To install server use this command: apt-get install netxms-server Server does not include server drivers. They should be installed with separate command: apt-get install DRIVER_NAME Change DRIVER_NAME to driver name that you need: netxms-server-mysql - MySQL driver netxms-server-odbc - DB/2 and Microsoft SQL drivers netxms-server-oracle - Oracle driver netxms-server-pgsql - PostgreSQL driver Agent To install agent use this command: apt-get install netxms-agent Management console Desktop Management Console: 1. Download the latest version from You will need Linux installer(named nxmc-version-linux-gtk-x86.tar.gz or nxmc-version-linux-gtk-x64.tar.gz, for example nxmc linux-gtk-x64.tar.gz). 2. Expand package to your preferred directory using command: tar zxvf nxmc-version-linux-gtk-x86.tar.gz -C /DIRECTORY 3. Run nxmc file form extracted catalog. Web Management Console: NetXMS web interface is java based and should be deployed into servlet container to run. Tested containers: Tomcat7, Jetty7. 1. Install one of servlet containers that support servlet-api version Download latest version of WAR file from Web Interface Binaries section (named nxmc-version.war, for example nxmc war). 3. Copy nxmc.war to webapps directory, in a few seconds it will be autodeployed and available at Tomcat default folder: /var/lib/tomcat6/webapps 3.2. Installing on Debian or Ubuntu 15
22 Jetty default folder: $JETTY_HOME/webapps/ 3.3 Installing on Red Hat, Fedora, CentOS or ScientificLinux Agent and server for this systems can be installed only from source Adding our YUM repository Note: YUM repository for this systems will be created soon Installing Server Installing server using source archive: If you wish to compile NetXMS server with encryption support on UNIX, you must have OpenSSL package installed. 1. Download the latest version from if you don t have it. You will need source archive (named netxms-version.tar.gz, for example netxms tar.gz). Please note that in the following steps VERSION will be used as a substitution for an actual version number. 2. Unpack the archive: tar zxvf netxms tar.gz 3. Change directory to netxms-version and run configure script: cd netxms sh./configure with-server with-mysql with-agent Important arguments: prefix=directory: installation prefix, all files go to the specified directory; with-server: build server. Don t forget to add at least one DB Driver as well; with-pgsql: build Postgres DB Driver (if you plan to use PostgreSQL as backend database); with-mysql: build MySQL DB Driver (if you plan to use MySQL as backend database); with-odbc: build ODBC DB driver (if you plan to connect to your backend database via ODBC; you will need UNIX ODBC package to do that); with-sqlite: build SQLite DB driver (if you plan to use embedded SQLite database as backend database); with-agent: build monitoring agent. It is strongly recommended to install agent on a server box; disable-encryption: Disable encryption support. To learn more about possible configure parameters, run it with help option. 4. Run make and make install: make make install 16 Chapter 3. Installation
23 5. Copy sample config files to desired locations: cp contrib/netxmsd.conf-dist /etc/netxmsd.conf cp contrib/nxagentd.conf-dist /etc/nxagentd.conf By default, both server and agent will look for configuration files in /etc directory. If you wish to place configuration files in a different location, don t forget to use c command line switch for agent and config-file command-line switch for server to specify an alternate location. 6. Check that database and user for it are created. Database 7. Modify server configuration file (default is /etc/netxmsd.conf). It should look the following way: DBDriver = mysql.ddr DBServer = localhost DBName = netxms DBLogin = netxms DBPassword = PaSsWd LogFile = /var/log/netxmsd LogFailedSQLQueries = yes More information about each configuration parameter can be found there: Server configuration parameters. 8. Modify agent s configuration file (/etc/nxagentd.conf). For detailed description of possible parameters, please consult NetXMS User s Manual. For the normal server s operation, you should add at least the following line to your agent s configuration file: MasterServers = , your_server_ip_address 9. Initialise this database with nxdbmgr utility using sql-script in sql/dbinit_dbtype.sql. DB- TYPE can be mssql, mysql, pgsql, oracle, or sqlite. MySQL example: $ /usr/local/bin/nxdbmgr init /usr/local/share/netxms/sql/dbinit_mysql.sql 10. Run agent and server: $ /usr/local/bin/nxagentd -d $ /usr/local/bin/netxmsd -d Database Create Database and User with access rights to this database. Example for MySQL: mysql -u root -p mysql mysql> CREATE DATABASE netxms; mysql> GRANT ALL ON netxms.* TO netxms@localhost IDENTIFIED BY 'PaSsWd'; mysql> \q Example for Oracle 11g. Please note that database user you have created should have rights to create new tables. Agent Installing agent using source archive: If you wish to compile NetXMS agent with encryption support on UNIX, you must have OpenSSL package installed Installing on Red Hat, Fedora, CentOS or ScientificLinux 17
24 1. Download the latest version from if you don t have it. You will need source archive (named netxms-version.tar.gz, for example netxms tar.gz). Please note that in the following steps VERSION will be used as a substitution for an actual version number. 2. Unpack the archive: tar zxvf netxms tar.gz 3. Change directory to netxms-version and run configure script: cd netxms sh./configure with-agent Important arguments: prefix=directory: installation prefix, all files go to the specified directory; with-agent: build monitoring agent. It is strongly recommended to install agent on a server box; disable-encryption: Disable encryption support. To learn more about possible configure parameters, run it with help option. By default all available subagents, that have required libraries are included in build. 4. Run make and make install: make make install 5. Copy sample config files to desired locations: cp contrib/nxagentd.conf-dist /etc/nxagentd.conf By default, agent will look for configuration files in /etc directory. If you wish to place configuration files in a different location, don t forget to use c command line switch for agent. 6. Modify agent s configuration file (/etc/nxagentd.conf). For the normal agent s operation, you should add at least the following line to your agent s configuration file: MasterServers = your_server_ip_address LogFile = log_file More configuration parameters can be found there: :ref:`agent_configuration_file`. 10. Run agent: $ /usr/local/bin/nxagentd -d Management Console Desktop Management Console: 1. Download the latest version from You will need Linux installer(named nxmc-version-linux-gtk-x86.tar.gz or nxmc-version-linux-gtk-x64.tar.gz, for example nxmc linux-gtk-x64.tar.gz). 2. Expand package to your preferred directory using command: tar zxvf nxmc-version-linux-gtk-x86.tar.gz -C /DIRECTORY 3. Run nxmc file form extracted catalog. 18 Chapter 3. Installation

25 Web Management Console: NetXMS web interface is java based and should be deployed into servlet container to run. Tested containers: Tomcat7, Jetty7. 1. Install one of servlet containers that support servlet-api version Download latest version of WAR file from Web Interface Binaries section (named nxmc-version.war, for example nxmc war). 3. Copy nxmc.war to webapps directory, in a few seconds it will be autodeployed and available at Tomcat default folder: /var/lib/tomcat6/webapps Jetty default folder: $JETTY_HOME/webapps/ 3.4 Installing on Windows Installing Server 1. Download the latest version from if you don t have it. You will need Windows installer (named netxms-version.exe or netxms-version-x64.exe, for example netxms exe). Please note that in following steps VERSION will be used as a substitution for an actual version number. 2. Run the installer package on your server machine. Installation wizard will be shown. Follow the prompts until the Select Components window opens. 3. On the Select Components window, select NetXMS Server option and an appropriate database client library. You do not have to install database client library from NetXMS package, if it is already installed on the machine Installing on Windows 19
26 If you plan to run NetXMS console from the same machine, select Administrator s Console option as well. 4. Follow the prompts until Ready to Install window opens. 5. On Ready to Install window, check whether everything is correct, then press the Install button. 6. After copying files, Server Configuration Wizard will open: Press the Next button to start NetXMS server configuration. 7. Database selection window will open: Select the desired database engine and driver. For most databases, you will have two drivers available native and ODBC. Please note that if you select ODBC, you will have to manually configure ODBC source. Enter the name of database server or ODBC source. In DBA login name and DBA password fields, enter database administrator s login name and password. You have to fill these fields only if you have chosen Create new database option. Enter the desired database name, database user name and password. If you are not using ODBC, the wizard will create database and a user for you. If ODBC is used, database and user should be created beforehand. Microsoft SQL note: If you wish to use Windows authentication for database connectivity, use * (asterisk) as a login name and leave the password field blank. If you specify asterisk as DBA login, user with which you are logged in to Windows should have administrative rights to the database server. If you use asterisk as DB login, you should run NetXMS Server service as a user with appropriate rights to the database. 20 Chapter 3. Installation
27 Oracle note: We recommend to use native database driver (oracle.ddr). 8. On the next window, you will be prompted for various polling parameters: Check Run IP autodiscovery process check-box, if you wish NetXMS server to automatically discover your IP network. Increase number of status and configuration pollers if you plan to monitor large number of nodes. 9. On the next window, enter address of your SMTP server. NetXMS will use it to send notification s. If you have mobile phone attached to management server via serial cable or USB, select mobile phone driver and COM port; otherwise, select <none>. 10. Then next window will prompt you for logging method. Either check Event Log or select file, and press the Next button. 11. Windows service configuration window will appear: In most situations, you can run NetXMS server under Local System account. You may need to run it under specific account if you are using Microsoft SQL database and Windows authentication, or for security reasons. 12. Windows service dependency window will appear: If you have database engine running on same server, you can find it in service list and mark, so NetXMS server s service will depend on database service and service startup order will be correct. 13. Follow the prompts until server configuration will be complete. After successful server configuration, installation will be finished, and you will have NetXMS server up and running Installing on Windows 21
28 22 Chapter 3. Installation
. 2. Run the installer package on target server. Installation wizard will be shown.")
29 Agent 1. Download the latest version from if you don t have it. You will need Windows Agent installer (named nxagent-version.exe or nxagent-version-x64.exe, for example nxagent exe). 2. Run the installer package on target server. Installation wizard will be shown. Follow the prompts until the NetXMS Server window opens: Enter IP address or host name of your NetXMS server. You can specify multiple management servers, separating them by commas. Press the Next button to continue. 3. Subagent Selection window will open: In this window, you can select which subagents you wish to load. Each subagent extends agent s functionality, as described below: Subagent Description ping.nsm Adds possibility to send ICMP pings from monitored host. Ping round-trip times can be collected by management server. portcheck.nsm Adds possibility to check network services (like FTP or HTTP) from monitored host. winperf.nsm Provides access to Windows performance counters. This subagent is required if you need to collect CPU utilization from monitored host. wmi.nsm Provides access to WMI data. ups.nsm Adds support for UPS monitoring. UPS can be attached to host via serial cable or USB. For more information about subagents, please refer to Subagents. 4. Follow the prompts to complete the installation. Management console Desktop Management Console: 1. Download the latest version from You will need Linux installer(named 3.4. Installing on Windows 23

30 24 Chapter 3. Installation
31 nxmc-version-win32-x86.zip or nxmc-version-win32-x64.zip, for example nxmc win32- x64.zip). 2. Extract zip in preferred directory. 3. Run nxmc file form extracted catalog. Web Management Console: Windows have 2 options: to install manually servlet container and just download tar and the second one is to use netxms-webui-version.exe installer. Installer will install by himself jetty and copy into required folder tar file. There will be described only automated way of installation: 1. Download the latest version from You will need Windows installer netxms-webui-version-x64.exe or netxms-webui-version.exe (exmple: netxms-webui x64.exe). 2. Run the installer package on your server machine. Installation wizard will be shown. Follow the prompts. While installation it will be possible to change installation path and port. 3. After installation procedure is finished check that WEB GUI is available at Install on Android Agent To install Android agent download netxms-mobile-agent-version.apk (example: netxms-mobile-agent apk) file form page. Check that installation of applications from unknown sources is allowed in security settings of your phone. Run this installer on required device. After agent is installed go to settings and activate agent. After agent activation it should be set next parameters: server address, port, user name, password. They can be found in under main menu, parameters section. Note: User that is used for connection should have Login as mobile device user right. Mobile device should be manually added to server. Find more information there: Monitoring mobile devices Console To install Android console download netxms-console-version.apk (example: netxms-console apk) file form page. Check that installation of applications from unknown sources is allowed in security settings of your phone. Run this installer on required device. After agent is installed go to settings and in main menu, connection part set all required connection credentials: server address, port, user name, password. Note: User that is used for connection should have Login as mobile device user right. 3.6 Generic installation, upgrade and downgrade using source tarball Server If you wish to compile NetXMS server with encryption support on UNIX, you must have OpenSSL package installed Install on Android 25
32 1. Download the latest version from if you don t have it. You will need source archive (named netxms-version.tar.gz, for example netxms tar.gz). Please note that in the following steps VERSION will be used as a substitution for an actual version number. 2. Unpack the archive: tar zxvf netxms tar.gz 3. Change directory to netxms-version and run configure script: cd netxms sh./configure with-server with-mysql with-agent Important arguments: prefix=directory: installation prefix, all files go to the specified directory; with-server: build server. Don t forget to add at least one DB Driver as well; with-pgsql: build Postgres DB Driver (if you plan to use PostgreSQL as backend database); with-mysql: build MySQL DB Driver (if you plan to use MySQL as backend database); with-odbc: build ODBC DB driver (if you plan to connect to your backend database via ODBC; you will need UNIX ODBC package to do that); with-sqlite: build SQLite DB driver (if you plan to use embedded SQLite database as backend database); with-agent: build monitoring agent. It is strongly recommended to install agent on a server box; disable-encryption: Disable encryption support. To learn more about possible configure parameters, run it with help option. 4. Run make and make install: make make install 5. Copy sample config files to desired locations: cp contrib/netxmsd.conf-dist /etc/netxmsd.conf cp contrib/nxagentd.conf-dist /etc/nxagentd.conf By default, both server and agent will look for configuration files in /etc directory. If you wish to place configuration files in a different location, don t forget to use c command line switch for agent and config-file command-line switch for server to specify an alternate location. 6. Check that database and user for it are created. Database 7. Modify server configuration file (default is /etc/netxmsd.conf). It should look the following way: DBDriver = mysql.ddr DBServer = localhost DBName = netxms DBLogin = netxms DBPassword = PaSsWd LogFile = /var/log/netxmsd LogFailedSQLQueries = yes More information about each configuration parameter can be found there: Server configuration parameters. 26 Chapter 3. Installation
33 8. Modify agent s configuration file (/etc/nxagentd.conf). For detailed description of possible parameters, please consult NetXMS User s Manual. For the normal server s operation, you should add at least the following line to your agent s configuration file: MasterServers = , your_server_ip_address 9. Initialise this database with nxdbmgr utility using sql-script in sql/dbinit_dbtype.sql. DB- TYPE can be mssql, mysql, pgsql, oracle, or sqlite. MySQL example: $ /usr/local/bin/nxdbmgr init /usr/local/share/netxms/sql/dbinit_mysql.sql 10. Run agent and server: $ /usr/local/bin/nxagentd -d $ /usr/local/bin/netxmsd -d Agent If you wish to compile NetXMS agent with encryption support on UNIX, you must have OpenSSL package installed. 1. Download the latest version from if you don t have it. You will need source archive (named netxms-version.tar.gz, for example netxms tar.gz). Please note that in the following steps VERSION will be used as a substitution for an actual version number. 2. Unpack the archive: tar zxvf netxms tar.gz 3. Change directory to netxms-version and run configure script: cd netxms sh./configure with-agent Important arguments: prefix=directory: installation prefix, all files go to the specified directory; with-agent: build monitoring agent. It is strongly recommended to install agent on a server box; disable-encryption: Disable encryption support. To learn more about possible configure parameters, run it with help option. By default all available subagents, that have required libraries are included in build. 4. Run make and make install: make make install 5. Copy sample config files to desired locations: cp contrib/nxagentd.conf-dist /etc/nxagentd.conf By default, agent will look for configuration files in /etc directory. If you wish to place configuration files in a different location, don t forget to use c command line switch for agent and config-file command-line switch for server to specify an alternate location. 6. Modify agent s configuration file (/etc/nxagentd.conf). For detailed description of possible parameters, please consult NetXMS User s Manual. For the normal server s operation, you should add at least the following line to your agent s configuration file: 3.6. Generic installation, upgrade and downgrade using source tarball 27
34 MasterServers = your_server_ip_address LogFile = log_file More configuration parameters can be found there: :ref:`agent_configuration_file`. 10. Run agent: $ /usr/local/bin/nxagentd -d 3.7 Cryptographic verification of installation files Synopsis Importing the Phusion Software Signing key Verifying the Phusion Software Signing key Verifying the gem and tarball Verifying Git signatures Verifying DEB and RPM packages Revocation 3.8 Customizing the compilation process Adding additional compiler or linker flags (e.g. fixing atomics) 3.9 WebUI additional configuration Installing web interface on remote system By default nxmc.war will try to connect to NetXMS server at address To change that, create configuration file called nxmc.properties as following: server = sessiontimeout = 120 enableadvancedsettings = true Change server property to IP address or host name of your NetXMS server and put properties file to class path of your application server. Default locations for different servers are following: Jetty Tomcat Depending on version and Linux distribution. For Debian it will be /usr/share/tomcat7/lib. Oracle Weblogic $WEBLOGIC_HOME/user_projects/domains/YOURDOMAIN 28 Chapter 3. Installation
35 3.9.2 Custom logo on login screen It is possible to change default logo on login screen to custom image by setting loginformimage property in nxmc.properties file. Image file must be located within application server s class path and file name must be given relative to class path root with leading slash. For example, if custom image is in file logo.jpg located in the same directory as nxmc.properties, correct entry will be: loginformimage = /logo.jpg 3.9. WebUI additional configuration 29
36 30 Chapter 3. Installation
37 CHAPTER FOUR UPGRADE 4.1 Upgrading on Debian or Ubuntu Upgrading packages To update all NetXMS packages run command: apt-get update && apt-get upgrade Management console Desktop Management Console: 1. Download the latest version from You will need Linux installer(named nxmc-version-linux-gtk-x86.tar.gz or nxmc-version-linux-gtk-x64.tar.gz, for example nxmc linux-gtk-x64.tar.gz). 2. Extract and replace old management console with the new one. tar zxvf nxmc-version-linux-gtk-x86.tar.gz -C /DIRECTORY 3. Run nxmc file form extracted catalog. Web Management Console: 1. Download latest version of WAR file from Web Interface Binaries section (named nxmc-version.war, for example nxmc war). 2. Replace old WAR file with the new one. 4.2 Upgrading on Red Hat, Fedora, CentOS or ScientificLinux Adding our YUM repository Upgrading Server 1. Download the latest version from if you don t have it. You will need source archive (named netxms-version.tar.gz, for example netxms tar.gz). Please note that in the following steps VERSION will be used as a substitution for an actual version number. 2. Unpack the archive: $ tar zxvf netxms tar.gz 31
38 3. Change directory to netxms-version and run configure script: $ cd netxms $ sh./configure with-server with-mysql Be sure to include all options that were used at installation time. 4. Run make: $ make 5. Stop NetXMS server. 6. Stop NetXMS agent. 7. Check database for possible inconsistencies: $ nxdbmgr check Proceed to the next step only if database checker does not report any errors! 8. Run make install: $ make install 9. Upgrade database: $ nxdbmgr upgrade 10. Start NetXMS agent. 11. Start NetXMS server. Agent 1. Download the latest version from if you don t have it. You will need source archive (named netxms-version.tar.gz, for example netxms tar.gz). Please note that in the following steps VERSION will be used as a substitution for an actual version number. 2. Unpack the archive: tar zxvf netxms tar.gz 3. Change directory to netxms-version and run configure script: cd netxms sh./configure with-agent Be sure to include all options that were used at installation time. 4. Run make and make install: make 5. Stop NetXMS agent. 6. Run make install: make install 7. Run agent: $ /usr/local/bin/nxagentd -d 32 Chapter 4. Upgrade
39 Management console Desktop Management Console: 1. Download the latest version from You will need Linux installer(named nxmc-version-linux-gtk-x86.tar.gz or nxmc-version-linux-gtk-x64.tar.gz, for example nxmc linux-gtk-x64.tar.gz). 2. Extract and replace old management console with the new one. tar zxvf nxmc-version-linux-gtk-x86.tar.gz -C /DIRECTORY 3. Run nxmc file form extracted catalog. Web Management Console: 1. Download latest version of WAR file from Web Interface Binaries section (named nxmc-version.war, for example nxmc war). 2. Replace old WAR file with the new one. 4.3 Upgrading on Windows Upgrade Server 1. Download the latest version from if you don t have it. You will need Windows installer (named netxms-version.exe, for example netxms exe). 2. Stop NetXMS server. 3. Check database for possible inconsistencies: C:\NetXMS\bin> nxdbmgr check Proceed to the next step only if database checker does not report any errors! 4. Run NetXMS installer and follow the prompts. Normally, you will not need to change any settings on installation wizard windows. Alternatively, you can run the installer with /SILENT option to disable any prompts: C:\Download> netxms exe /SILENT 5. Check whether NetXMS Server service is running again. If it s not, most likely you have to upgrade your database to newer version. To upgrade database, use nxdbmgr utility: C:\NetXMS\bin> nxdbmgr upgrade 6. Start NetXMS server, if it is not already started. Agent We highly recommend using centralized agent upgrade feature for agent upgrades. However, if you decide to upgrade agent manually, it can be done in just a few steps: 1. Download the latest version from if you don t have it. You will need Windows Agent installer (named nxagent-version.exe or nxagent-version-x64.exe, for example nxagent exe). 2. Run NetXMS agent installer and follow the prompts. Normally, you will not need to change any settings on installation wizard dialog windows. Alternatively, you can run installer with /SILENT option to disable any prompts: 4.3. Upgrading on Windows 33
40 C:Download> nxagent exe /SILENT Management console Desktop Management Console: 1. Download the latest version from You will need Windows installer(named nxmc-version-win32-x86.zip or nxmc-version-win32-x64.zip, for example nxmc win32-x64.zip). 2. Replace old old folder with content of the zip. 3. Run nxmc.exe file form extracted catalog. Web Management Console: 1. Download latest version of WAR file from Web Interface Binaries section (named nxmc-version.war, for example nxmc war). 2. Replace old WAR file with the new one. Default path: INSTALLATION_DIRwebapps. 4.4 Generic upgrade using source tarball Server 1. Download the latest version from if you don t have it. You will need source archive (named netxms-version.tar.gz, for example netxms tar.gz). Please note that in the following steps VERSION will be used as a substitution for an actual version number. 2. Unpack the archive: $ tar zxvf netxms tar.gz 3. Change directory to netxms-version and run configure script: $ cd netxms $ sh./configure with-server with-mysql Be sure to include all options that were used at installation time. 4. Run make: $ make 5. Stop NetXMS server. 6. Stop NetXMS agent. 7. Check database for possible inconsistencies: $ nxdbmgr check Proceed to the next step only if database checker does not report any errors! 8. Run make install: $ make install 9. Upgrade database: $ nxdbmgr upgrade 10. Start NetXMS agent. 11. Start NetXMS server. 34 Chapter 4. Upgrade
41 4.4.2 Agent 1. Download the latest version from if you don t have it. You will need source archive (named netxms-version.tar.gz, for example netxms tar.gz). Please note that in the following steps VERSION will be used as a substitution for an actual version number. 2. Unpack the archive: tar zxvf netxms tar.gz 3. Change directory to netxms-version and run configure script: cd netxms sh./configure with-agent Be sure to include all options that were used at installation time. 4. Run make and make install: make 5. Stop NetXMS agent. 6. Run make install: make install 7. Run agent: $ /usr/local/bin/nxagentd -d 4.5 Centralized agent upgrade Steps to update agent remotely: 1. Download NetXMS agent installer from 2. Download the appropriate NPI file for your agent installer(npi file is just a reference to actual package file. You should have it as well in the same directory as NPI file.) 3. Open Package Manager 4. Chose Install new package Browse for NPI file 6. When new package appeared - right click on it and chose Deploy to managed nodes Select the nodes you want to upgrade by holding CTRL key 4.5. Centralized agent upgrade 35
42 36 Chapter 4. Upgrade
43 CHAPTER FIVE QUICK START In this section will be described basic configuration that should be done after server and agent clean install. Also will be shown monitoring configuration for some common metrics like CPU of FS. 5.1 Default Credentials Server login default credentials Login: admin Password: netxms 5.2 Basic agent configuration Minimal configuration that should be set for agent is server address and path to log file. Action differ depending on a platform where agent is installed. On Windows systems configuration file is automatically generated and populated by installer, on UNIX systems it should be created/edited manually. Minimal required configuration is done for agent Windows In case if while installation MasterServer was set correctly no action is required form user. Automatically generated configuration file can be found there: installation directory \etc\nxagentd.conf. Configuration file for Windows should look like this: # # Sample agent s configuration file # MasterServers = LogFile = {syslog} UNIX/Linux After agent is installed on a UNIX/Linux system it is required to create/edit file /etc/nxagentd.conf. This file should contain at least this information: # # Sample agent s configuration file # MasterServers = LogFile = /var/log/nxagentd 37
44 5.3 Basic server tuning Server has 2 types of configuration: configuration file parameters and server configuration variables. For server configuration file minimal requirements are path to log file, database driver name and all required credentials depending on database. Location and required actions depends on what OS is used. More about OS specific configuration search in OS subsections of this chapter. List of possible database drivers: db2.ddr informix.ddr mssql.ddr mysql.ddr Driver for MySQL database. odbc.ddr ODBC connectivity driver (you can connect to MySQL, PostgreSQL, MS SQL, and Oracle via ODBC). oracle.ddr Driver for Oracle database. pgsql.ddr Driver for PostgreSQL database. sqlite.ddr Driver for embedded SQLite database. There are quite a few important server parameters to be set right after installation. These parameters are accessible through the Server Configuration window in the console. To open it, click on Configuration Server Configuration. To edit a setting, double click on the row in the table or right-click and select Edit. The following parameters may need to be changed: Parameter PollerThreadPoolMaxSize PollerThreadPoolBaseSize Description This parameter represents maximum thread pool size. From this pool will be taken threads for all types of polls: Status poll, Configuration poll, etc. In case of big load on a server number of threads will be increased till this size. When load come back to normal, number of threads will be automatically decreased to base size. If you plan to monitor large number of hosts increase this parameter from the default value to approximately 1/5 of host count. This parameter represents base thread pool size. From this pool will be taken threads for all types of polls: Status poll, Configuration poll, etc. This is minimal number of threads that will always run. If you plan to monitor large number of hosts increase this parameter from the default value to approximately 1/10 of host count. NumberOfDataCollectors If you plan to monitor large number of hosts, to approximately 1/10 1/5 of host number. Use larger value if you plan to gather many DCIs from each host. EnableSyslogDaemon Minimal required configuration is done for server. Set this parameter to 1 if you want to enable NetXMS built-in syslog server Windows For Windows systems this information is added to configuration file while installation procedure. It can be check that all data was set correctly in this file: installation directory \etc\nxagentd.conf. Example of sample Windows configuration for mysql: # # Sample configuration file for NetXMS server # 38 Chapter 5. Quick start
45 DBDriver = mysql.ddr DBServer = localhost DBName = netxms_db DBLogin = netxms DBPassword = password LogFailedSQLQueries = yes LogFile = {syslog} UNIX/Linux For UNIX based systems /etc/netxmsd.conf file should be created/populated manually. Configuration file example for oracle database: DBDriver = oracle.ddr DBServer = ServerIP/Hostname.DomainName #Here is service (full database name), not SID DBName = netxms DBLogin = netxms DBPassword = PaSwD LogFailedSQLQueries = yes LogFile = /var/log/netxmsd 5.4 SMTP SMTP configuration is done to create actions that will send s on defined events. This configuration is done through the Server Configuration window in the console. To open it, click on Configuration Server Configuration. To edit a setting, double click on the row in the table or right-click and select Edit. The following parameters may need to be changed: Parameter SMTPFromAddr SMTPFromName SMTPRetryCount SMTPServer Description Address that will be shown as a sender address when notification from NetXMS will come. Name that will be shown as a sender name when notification from NetXMS will come. Number of retries that NetXMS will try to do in case if message sending will fail. Server IP address or DNS name where NetXMS will send request for message dispatch. 5.5 SNMP Defaults For SNMP can be configured some default values for authorization. It is required if you will have many SNMP devices with similar credentials. This information is set on Network Discovery view SNMP Communities In this section you can add SNMP community strings to be tested during connection to the SNMP device that requires authorization SMTP 39
46 5.5.2 SNMP USM Credentials In this section you can add SNMP version 3 credentials to be tested during connection to the SNMP device that requires authorization. 5.6 Actions and Alarms In this section will be shown how to configure alarm and notifications generation on predefined SYS_THRESHOLD_REACHED event. And alarm resolve on SYS_THRESHOLD_REARMED event. First it should be created Send action in Action Configuration view. There we will set recipient of , subject and body of . In body of will be used Macros for Event Processing. It means that when message will be sent, macros %n will be substituted with name of the node and %m will be substituted with event message. Value of event message is personal for each event and can be found in event description. Next step is to add processing policies. It is done in Event Processing Policy view. We will add this rules before all other rules as it it is planed that this rules will be most commonly used ones. It should be added rule that will send and create Alarm on SYS_THRESHOLD_REACHED rule from any node. In alarm message is added key that will be used in alarm resolve. Key is combined from text id SYS_THRESHOLD_REACHED_, id of DCI and ID of node. This should be enough to resolve correct alarm. After that should be created one more rule for alarm resolve with the same key as for alarm creation. After all configuration is done Event Processing Policy view should be saved. 40 Chapter 5. Quick start
47 5.7 Passive discovery It is recommended to enable passive discovery when it is required to add all nodes in local network. In case if NetXMS server has access to switches and routers via SNMP, all devices in network will be added automatically by discovery process. To enable passive network discovery open Network Discovery view. There in General section select Passive only option and check that all default SNMP credentials are set as described in SNMP Defaults section. Other options that can be set depending on requirements: Option to use SNMP trap source for further network discovery Option to set filer that will define rules for not adding nodes to NetXMS server In our configuration we will not use filter to add all node available on our network and turn on option to use SNMP trap source address for discovery. After all configuration is done remember to save it Notes If you have enabled automatic network discovery, wait for initial network discovery completion. This process can take time, depending on size and complexity of your network. For large networks, we recommend that you let NetXMS run over night to gather the majority of network information available. You can watch discovery progress in a real time using NetXMS Management Console. Go to Object Browser or open default network map and see for new devices and networks. Please note that for successful network discovery your network must meet the following requirements: NetXMS server must have access to switches and routers via SNMP. All your network devices credentials(community string and password for v3) should be added to default credential list in Network Discovery view Passive discovery 41
48 5.8 Manually add node If the automatic network discovery does not detect all of your hosts or devices, or you decide not to use network discovery at all, you may need to manually add monitored nodes to the system. The easiest way to accomplish this is to right-click on Infrastructure Services in the Objects pane and select Create node. You will be presented with the following dialog window: Figure 5.1: Create Node window Please note that adding a new node object may take some time, especially if a node is down or behind a firewall. After successful creation, a new node object will be placed into appropriate subnets automatically. As soon as you add a new node to the system, NetXMS server will start regular polling to determine the node status. 42 Chapter 5. Quick start

49 5.9 Add DCI thresholds In this section is described how to configure CPU usage monitoring using agent metric and using SNMP metric and interface incoming traffic. There will be also shown threshold configuration for each DCI. This threshold will generate SYS_THRESHOLD_REACHED event when defined condition is meet and SYS_THRESHOLD_REARMED when collected data exists range of condition. Earlier we already described how to configure notifications and alarm generation, resolve based on this events. In this chapter is described data collection and event generation based on collected data. To add DCI for a node open Data Collection Configuration view from object menu. And select form drop-down menu New parameter CPU usage Add CPU usage metric form agent parameters: 1. Check that as origin is selected NetXMS Agent. 2. Click on Select button 3. Type in the input box CPU 4. Select System.CPU.Usage 5. Go to Threshold tab 6. Click Add Figure 5.2: Parameter Selection 7. Set that if last one polled value is gather than 85, then generate SYS_THRESHOLD_REACHED event, when value is back to normal generate SYS_THRESHOLD_REARMED event. 8. Click OK 5.9. Add DCI thresholds 43
50 Figure 5.3: Properties 44 Chapter 5. Quick start
51 Figure 5.4: Threshold Add CPU usage metric form SNMP parameters: 1. Check that as origin is selected NetXMS Agent. 2. Click on Select button 3. Type in the input box (this OID can may be not available for some devices) 4. Click Walk 5. Select CPU that should be monitored in our case it is Click OK 7. Go to Threshold tab 8. Click Add 9. Set that if last one polled value is gather than 85, then generate SYS_THRESHOLD_REACHED event, when value is back to normal generate SYS_THRESHOLD_REARMED event. 10. Click OK Now you configured data collection of metric System.CPU.Usage that will be collected every 60 seconds, data will be stored for 30 days, with 1 threshold that will be activated when CPU usage is mote than 85% Interface traffic There is shortcut to create all required DCIs for interface traffic. Select interfaces for which should be created traffic collection DCIs and select form drop-down menu Create data collection items. There can be created automatically all required DCIs by selecting required checkbooks Add DCI thresholds 45
52 Figure 5.5: Mib Walk Result Figure 5.6: Select Window For SNMP DCI 46 Chapter 5. Quick start
53 Figure 5.7: Properties 5.9. Add DCI thresholds 47
54 Figure 5.8: Threshold 48 Chapter 5. Quick start
55 5.9. Add DCI thresholds 49
56 50 Chapter 5. Quick start
57 CHAPTER SIX AGENT MANAGEMENT 6.1 Introduction NetXMS agent is daemon or service that runs on a node to provide additional monitoring options. This is optional for installation, but it s installation gives next advantages: Centralized configuration - you can change configuration of agent from management console; if needed, you can even store agent configs on NetXMS server More secure: communications between NetXMS server and agent can be encrypted, additional authentication on agent can be configured TCP instead of UDP is used for communications with agent - this can help in case of slow and poor quality links Remote command execution - agents can be used to execute commands on managed systems as a reaction to certain events Proxy functionality: agent can be used as a proxy to reach agents on hosts not directly accessible by NetXMS server SNMP proxy: agent can be used as a proxy to reach remote SNMP devices SNMP Trap proxy: agent can be used as a proxy to get messages from remote SNMP device Extensible: you can add new parameters very easy using configuration option like ExternalParamer or by writing your own subagents Easy upgrade - you can upgrade all agents at once from console Provides file management possibilities on agent. 6.2 Agent configuration files Agent have 2 types of configuration files: master configuration file and additional configuration file(agent Policies files). Only master configuration file is mandatory file. Minimal configuration for master configuration file is server address. To afterwards be able to apply all other changes from the server, address of it should be should be given as MasterServers. After configuration file change agent should be restarted to apply new changes Master configuration file File nxagentd.conf is a master configuration file for NetXMS agent. It contains all information necessary for agent s operation. Default location for this file is /etc/nxagentd.conf on UNIX systems and installation directory \etc\nxagentd.conf on Windows. The file can contain one or more parameters in Parameter = Value form, each parameter should be on its own line. Comments can be inserted after # sign. This file can also contain configuration for subagents. In this case, subagents parameters should be 51
58 placed in separate sections. Beginning of the section is indicated by * sign, followed by a section name or in section name in braces(example: [sectionname] ). If build configuration was done with prefix= prefix parameter, then configuration file will be searched in the following order (UNIX): 1. $NETXMS_HOME/etc/nxagentd.conf 2. prefix /etc/nxagentd.conf 3. /etc/nxagentd.conf 4. /Database/etc/nxagentd.conf 5. /usr/etc/nxagentd.conf For Windows systems: 1. installation directory \etc\nxagentd.conf For Windows location of NetXMS config can be change in registry. If configuration file is placed in different location or named in different way, then it s location and file name can be given to agent with -c parameter. Detailed list of parameters can be found there: Agent configuration file (nxagentd.conf). Configuration file example: # # Sample agent s configuration file # MasterServers = LogFile = {syslog} SubAgent = winperf.nsm # Below is a configuration for winperf subagent, in separate section *WinPerf EnableDefaultCounters = yes Additional configuration files Additional configuration files override or supplement configuration parameters form main file. They are used to store applied Policies configuration, but can be also created and updated manually. More information about Policies can be read there: Agent Policies. If configuration of build was done with prefix= prefix parameter, then config will be searched in next order(unix): 1. $NETXMS_HOME/etc/nxagentd.conf.d 2. prefix /etc/nxagentd.conf.d 3. /etc/nxagentd.conf.d 4. /Database/etc/nxagentd.conf.d 5. /usr/etc/nxagentd.conf.d For Windows systems: 1. installation directory \etc\nxagentd.conf 52 Chapter 6. Agent management
59 6.3 Agent configuration options from server Edit configuration file remotely Right click on node, select from menu: Edit agent s configuration file. On View exit there will be present dialog. New configuration apply is performed on agent restart. So to immediately apply new configuration on config exit select Save and Apply. This option will save config and automatically restart the agent. If just Save is selected, then agent should be manually restarted to apply new configuration Agent configuration files on server Agent master configuration files can be stored on server side and requested by agent with parameter -M <server- Adress>. On config request server goes through config list from beginning till the end and one by one checks if this config is the requested one by executing filter scripts. If server have found appropriate configuration file then it is sent to agent and old nxagentd.conf file is overwritten with incoming one or created new one if there is no nxagentd.conf When agent can t connect to server or server hasn t found right config, the agent is started with the old one. In case when old configuration file does not exist and it is not possible to get new one from server - agent fails to start. New in version Configuration Each config has a name, filter and config content. Name just identifies config. Filter is check on config request to define witch configuration file to give back. Filter is defined with help of NXSL. To configuration are given next parameters: $1 - IP address $2 - platform $3 - major version number $4 - minor version number $5 - release number Configuration file is a content of returned configuration file Agent Policies Agent policies can be configured on server in Policies part. There can be used the same parameters as in main configuration file in XML or key = value format. To create policy in menu of container where should be created policy select Create agent policy(configuration file) and give required object name and press OK. Than in newly created object s properties add configuration parameters in Configuration File tab. In XML format general tag should be <config> and then can be added any agent or subagent parameter as a tag. Example: <config> <agent> <-- there can be added comment --> <MasterServers> </MasterServers> <SubAgent>netsvc.nsm</SubAgent> <SubAgent>dbquery.nsm</SubAgent> 6.3. Agent configuration options from server 53
60 <SubAgent>filemgr.nsm</SubAgent> </agent> <DBQUERY> <Database>id=myDB;driver=mysql.ddr;server= ;login=netxms;password=xxxxx;dbname=netxms< <Query>dbquery1:myDB:60:SELECT name FROM images</query> <ConfigurableQuery>dbquery2:myDB:Comment in param :SELECT name FROM images WHERE name like?</ <ConfigurableQuery>byID:myDB:Comment in param :SELECT name FROM users WHERE id=?</configurable </DBQUERY> <filemgr> <RootFolder>/</RootFolder> </filemgr> </config> Example: After policy is created it should be installed on required nodes. Node and agent on it should be up and running and all folder path to additional configuration files and register should exist. Nodes should be manually restarted after policy was applied to run it with new configuration. To install policy in object menu select Install..., select Install on nodes selected below, select required nodes in object browser and click OK. Installed policy configurations are stored as additional config files. List of applied policies is stored in Windows registry on in registry file in UNIX. If policy is successfully applied on a node it will be seen under this policy. Example: If Policies have changed it should be reapplied manually. Is is done with command in object menu Install..., then select Install on all nodes where this policy already installed and click OK. Policy can be also uninstalled. To do this right click on policy object and select Uninstall..., select node from witch this policy will be removed and click OK. In this case additional configuration file and registry recored connected to this policy are removed from node. In order to apply the changes it is required manually to restart agent. 54 Chapter 6. Agent management

61 6.3. Agent configuration options from server 55
62 Advantage of creating configuration in policies - if configuration for nodes is changed, then it should be changed only once for all nodes on witch it is applied Agent Policies vs. Agent Configuration Files on Server A short lists of main points to compare both options: Agent Configuration Files on Server: Agent Policies: Assignment is Rule based Config download from server is each time the agent starts (if option -M servername ) When config is found on server, local Master config is overwritten, if not existing Master config is used Works with Master config Do not required initial config(can be started without config), but in this case agent will fail if nothing will be returned from server Not possible for bootstrap agent Also possible via proxy Assignment is only direct to nodes, not rule based Can be in XML or key = value format SubAgent config sections also possible Changed policies must be reinstalled on nodes (in console) and need agent restart At minimum the server connection parameters must be in Master config to be able to start agent Works with Additional configuration files(policies) If policy and master config have same parameter that can be set only once like(masterservers or LogFile), then policy will overwrite master config configuration If policy and master config have same parameter that can be set multiple times like(target for PING subagent or Query for DBQUERY), then policy will merge lists of configs 6.4 Agent registration There are few ways to register agent: 1. To enter it manually by creating a node 2. Run the network discovery and enter the range of IP addresses. 3. Register agent on management server nxagentd -r <addr>, where <addr> is the IP address of server. To register agents using this option also EnableAgentRegistration parameter should be set to Security Agent < > server message encryption Server encryption policy is configured in Server Configuration view by selecting one of 4 options for Default- EncryptionPolicy parameter. Default Policy is 1. Policy types: 56 Chapter 6. Agent management
63 0 - Forbid encryption. Will communicate with agents only using plain text messages. If agent force encryption(set RequireEncryption agent configuration parameter to yes), server will not connect with this agent. 1 - Allow encryption. Will communicate with agents using plain text messages if for exact node is not defined encryption force by setting RequireEncryption agent configuration parameter to yes or by selecting Force encryption option in Communication properties of node object. 2 - Encryption preferred. Will communicate with agent using encryption. In case if agent does not support encryption will communicate with it using plain text. 3 - Encryption required. Will communicate with agent using encryption. In case if agent does not support encryption will not establish connection. Figure 6.1: Force encryption option for node. Note: Configuration will be simplified in next releases Security 57
64 6.5.2 Server access levels Depending on how server s IP address(or domain) is added to in nxagentd.conf, it will have different access level. It is preferred to use MasterServers. There are 3 levels of access for an agent: 1. MasterServers - full access 2. ControlServers - can read data and execute predefined actions, but cannot change config nor install policies. 3. Servers - read only access In case if server IP is not listed in one of this parameters agent will not enable connection with it Shared secret Shared secret is another level of server verification. By default authentication is disabled. To enable Shared Secret verification on agent set RequireAuthentication agent configuration parameter to yes. In SharedSecret agent configuration parameter set password what should be used for authentication. If authentication for agent is enabled, then while connection agent requested shared secret from the server. Server check if password was set for this specific node in Shared secret field in communication properties of node. In case if there is no shared secret server sends content of AgentDefaultSharedSecret server configuration variable as shared secret. In case shared secrets are not identical connection is not established Password encryption When it is required to write password or Shared Secret in agent configuration file, there is possibility to encrypt it. All passwords can be encrypted with help of nxencpasswd command line tool and added in configuration file in encrypted way. 6.6 Subagents Subagents are used to extend agent functionality. NetXMS subagent are libraries that are loaded by agent. By default all subagents are included in agent build. Subagent may be not included in build only if on time of the build there were no required libraries for subagent build. To enable subagent is require just to add line in main agent configuration file(example: Subagent=dbquery.nsm ). More about configuration and usage of subagents will be described in Common monitoring tasks (rename this chapter!) chapter. There is list of available manually loaded NetXMS subagents: DB2 FileMGR DBQuery ECS Informix Java lm-sensors ODBCQuery Oracle Ping PortCheck 58 Chapter 6. Agent management
65 Figure 6.2: Shared secret field in node communication properties Subagents 59
66 netsvc UPS WinPref WMI MongoDB Load of subagent as separate process Load of subagent as separate process can be used in case it is necessary to load agent and subagent under different users. It can be done by adding ExternalSubagent parameter with unique ID that will represent connection name between agent and subagent. Create second configuration file for this subagent and add there ExternalMasterAgent parameter with same ID and run instance of nxagentd with this config. Now external subagent will communicate with master agent using Named Pipe. Only master agent will communicate with server. 6.7 Agent Proxy node configuration In case it is required to monitor nodes behind firewall, it can be configured access to one of subnet nodes and used this node as a proxy node for others. Proxy node can be set while node creation or in Communications tab of node properties. To configure proxy node select node in object selector NetXMS Agent Proxy Agent configuration To enable NetXMS Agent proxy EnableProxy agent configuration parameter should be set to yes. 6.8 Agent External Metrics Other option to define new Metric that can be collected form node is to use ExternalParameter/ExternalParameterShellExec, or ExternalList, or ExternalParametersProvider configuration parameters to define command that will be executed on a node and it s output will be provided as a Metric. In such way can be added parameter and list metrics ExternalParameter/ExternalParameterShellExec ExternalParameter defines name of the metric and command that is executed synchronously when this metric is requested by server. There can be provided parameters form DCI configuration, that will be available like $1, $2, $3..., $9 variables. To accept arguments metric name should contain (*) symbols after name. Only first line of script output will be given as a result of execution(metric value). ExternalParameterShellExec has same meaning as ExternalParameter with exception that agent will use shell to execute specified command instead of system process exeution API. This difference presented only on Windows system, on other systems ExternalParameter and ExternalParameterShellExec behaves identically. To add multiple parameters, you should use multiple ExternalParameter/ExternalParameterShellExec entries. As this commands are executed synchronously, long commands may cause timeout. In this case ExecTimeout configuration parameter can be set to change external parameter execution timeout or ExternalParametersProvider can be used. 60 Chapter 6. Agent management
67 6.8. Agent External Metrics 61
68 62 Chapter 6. Agent management
69 # Exaple # Woithout DCI parameters ExternalParameter=Name:command ExternalParameterShellExec=Name:command # With DCI parameters ExternalParameter=Name(*):command $1 $2 ExternalParameterShellExec=Name(*):command $1 $2 #Real examples ExternalParameter = Test:echo test ExternalParameter = LineCount(*):cat $1 wc -l ExternalList ExternalList defines name of the list metric and command that is executed synchronously when this metric is requested by server. There can be provided parameters form DCI configuration, that will be available like $1, $2, $3..., $9 variables. To accept arguments metric name should contain (*) symbols after name. Lines of list are separated with new line. # Exaple # Woithout DCI parameters ExternalList=Name:command # With DCI parameters ExternalList=Name(*):command $1 $ ExternalParametersProvider ExternalList defines command(script) and execution interval in seconds. Defined script will be executed as per interval and agent will cache parameter list. When server will request one of provided parameters it s value will be read from the agent cache. Main purpose is to providing data from long-running processes, or return multiple values at once. This approach can be also used for getting table database results in parameter way(like columnname=value). Script should print one or more Parameter=Value pairs to standard output. Multiple pairs should be separated by new line. If parameter takes argument, it should be included in Parameter(...). Example of the script:.. code-block:: shell #!/bin/sh echo Parameter1=Value1 echo Parameter2=Value2 echo ParameterWithArgs(AAA)=Value3 echo ParameterWithArgs(BBB)=Value4 Example of agent configuration:.. code-block:: cfg #Exaple ExternalParametersProvider=PATH_TO_PROVIDER_SCRIPT:POLL_TIME_IN_SECONDS #Example (run /tmp/test.sh every 5 seconds) ExternalParametersProvider=/tmp/test.sh: Agent External Metrics 63
70 64 Chapter 6. Agent management
71 CHAPTER SEVEN SERVER MANAGEMENT 7.1 Configuration file File netxmsd.conf is a configuration file for NetXMS server. It contains information necessary for establishing database connection, and some optional server parameters. Default location for this file is /etc/netxmsd.conf on UNIX systems and InstalationPathetcnetxmsd.conf on Windows. The file can contain one or more parameters in Parameter = Value form, each parameter should be on its own line. Comments can be inserted after # sign. Detailed list of parameters can be found there: Server configuration file (netxmsd.conf). Configuration file example: # # Sample configuration file for NetXMS server # DBDriver = mysql.ddr DBServer = localhost DBName = netxms_db DBLogin = netxms DBPassword = password LogFailedSQLQueries = yes LogFile = {syslog} 7.2 Configuration variables Global server parameters can be found in This variables are stored in database and can be changed using Server Configuration Editor view accessing it Configuration Server Configuration or with help of nxdbmgr (example: :code: nxdbmgr set <name> <value>). Detailed description of each configuration can be found there: Server configuration parameters. Please note that changes to most of the settings will take effect only after server restart. 7.3 Synchronization between servers NetXMS does not provide horizontal scalability for server. But there is option to exchange with events between servers. Information about configuration can be found there: Forward event. Event forward does not work with zones. 65
72 7.4 netxmsd commandline options Command Description -e Run database check on startup -c <file> Set non-default configuration file Default is {search} -d Run as daemon/service -D <level> Set debug level (valid levels are 0..9) -h Display help and exit -p <file> Specify pid file. -q Disable interactive console -v Display version and exit 7.5 Server debug console Server debug console can be opened in Java console. It can be found in Tools -> Server Console. It can be used to check debug messages or to execute one of server commands like ldap sync. Server commands can be executed also through XMPP. To execute server command through XMPP should be fulfill next requirements: 1. Server connection with XMPP should be configured in server configuration variables: XMPPLogin, XMPP- Password, XMPPPort, XMPPServer, EnableXMPPConnector. 2. XMPP user that will send commands should be connected with NetXMS user by pointing it s XMPP name in XMPP ID filed of General tab of NetXMS user properties. 3. NetXMS user that will execute this commands should also have Execute commands via XMPP access right. Execution is done sending server command like a message to the user defined in XMPPLogin server configuration variable. 66 Chapter 7. Server management
73 7.5.1 Server commands Command Description debug [<level> off] Set debug level (valid range is 0..9) down Shutdown NetXMS server exec <script> [<params>] Executes NXSL script from script library exit Exit from remote session kill <session> Kill client session get <variable> Get value of server configuration variable help Display this help ldapsync Synchronize ldap users with local user database poll <type> <node> Initiate node poll raise <exception> Raise exception set <variable> <value> Set value of server configuration variable show components <node> Show physical components of given node show dbcp Show active sessions in database connection pool show fdb <node> Show forwarding database for node show flags Show internal server flags show index <index> Show internal index show modules Show loaded server modules show objects Dump network objects to screen show pollers Show poller threads state information show queues Show internal queues statistics show routing-table <node> Show cached routing table for node show sessions Show active client sessions show stats Show server statistics show topology <node> Collect and show link layer topology for node show users Show users show vlans <node> Show cached VLAN information for node show watchdog Display watchdog information trace <node1> <node2> Show network path trace between two nodes 7.6 Configuring self-monitoring 7.7 Database connection pool 7.8 ICMP proxy To used ICMP proxy Ping subagent should be loaded for ICMP proxy node. This proxy is used to check node availability when Zones are used Configuring self-monitoring 67
74 68 Chapter 7. Server management
75 CHAPTER EIGHT SNMP 8.1 MIB Explorer MIB browser shows all loaded MIB configurations, and allows to run SNMP walk on a selected node nodes. Node can be selected in browser by selecting Set node object... option in view menu or by opening MIB Explorer from node menu. To run walk user should select line of tree from were will be requested all data. By walk will be requested all OID subtree of selected item. After walk is done it s results will shown in the table below. There are next options available for results: Copy result line to clipboard 69
76 Copy name of selected line to clipboard Copy type of selected line to clipboard Copy value of selected line to clipboard Export selected lines to CSV Show selection in MIB tree Create DCI form selected item 8.2 SNMP Trap Configuration In this view is configured which event will be generated on exact trap OID and which OID data will be used as event parameter data. In SNMP Trap mapping configuration window can be set next parameters: Description of mapping rule Trap OID or trap OID group with many subtree OIDs, matching OID will be given to event as $1 parameter Event that will be generated on selected Trap OID User Tag is special event attribute, that can be got by %u macros or as attribute of event class. This attribute can be set there or by script. Parameters - OID values that will be passed to event as $2, $3, $4... parameters In parameter configuration(edit SNMP Trap Parameter Mapping) can be configured next things: Description of a parameter Select if parameter should be found by OID or by position in the message 70 Chapter 8. SNMP
 it will be automatically converted to hex string, this option is required to prevent auto conversion. 8.")
77 Option not to convert value to hex string. If string contains not readable symbols(symbol number less than space symbol number) it will be automatically converted to hex string, this option is required to prevent auto conversion. 8.3 Setting default SNMP credentials Default SNMP credentials can be set in Network Discovery section. It does not matter if credentials are used for adding nodes manually, through network discovery or with help of agent registration - in each case Network Discovery configuration value will be checked. More about Network Discovery view can be found there. 8.4 Using iftable and ifxtable There are 2 types of subtree that provides information about interfaces: old one iftable and new one ifxtable. Sometimes usage of new one creates error situations. In this situation ifxtable can be disabled. This can be done in Properties of node in Polling. Or this configuration can be set globally by changing UseIfXTable server configuration parameter. 8.5 Configure SNMP Proxy If there is need to monitor nodes behind firewall using SNMP, there is option to install on one of the nodes NetXMS agent, open all required ports for this node and send SNMP request to other nodes in this subnet through installed agent. Proxy configuration can be done wile creation of node of for already created node can be change in Communications tab of node properties. To configure proxy node select node in object selector SNMP Proxy Agent configuration To enable SNMP proxy EnableSNMPProxy parameter should be set to yes Setting default SNMP credentials 71
78 72 Chapter 8. SNMP
79 8.5. Configure SNMP Proxy 73
80 74 Chapter 8. SNMP
81 8.6 Configure SNMP Trap Proxy It is possible to proxy SNMP traps. In this case as a destination of traps should be set the proxy node Agent configuration To enable trap proxy EnableSNMPTrapProxy parameter should be set to yes. Optionally can be configured also SNMPTrapListenAddress and SNMPTrapPort. checked there: Master configuration file Default values can be Server configuration By default traps are accepted only from known nodes. To accept all traps set LogAllSNMPTraps server configuration variable to 1. To correctly send response for SNMPv3, it should be also configured the proxy node for the sender node. It is done in sender node properties in Communications tab, SNMP section. 8.7 Import MIB MIB files (MIBs) describe structure of information transferred via SNMP. Every device can support multiple MIBs, some of them are standard and public, other can be proprietary and vendor specific. NetXMS uses compiled MIBs to allow you to select OID and see its description (for example when selecting SNMP data for DCI collection). You do not need to compile new MIBs if you are OK with direct input of OID Compiling MIBs Change suffix of your new MIB file to.txt Copy your MIB file to /usr/share/netxms/mibs Use nxmibc binary to create a new compiled MIB file from all MIBs in directory. Add parameter -z for compressed output file. nxmibc -d /usr/share/netxms/mibs -o /usr/share/netxms/mibs/netxms.mib Parameters recognized by nxmibc: nxmibc [options] source1... sourcen Valid options: -d <dir> : Include all MIB files from given directory to compilation -o <file> : Set output file name (default is netxms.mib) -P : Pause before exit -s : Strip descriptions from MIB objects -z : Compress output file Troubleshooting If nxmibc fails, it may be caused by syntax or import errors in your MIB. Try to check it with smilint (part of net-snmp package) and correct any errors on level Configure SNMP Trap Proxy 75
82 76 Chapter 8. SNMP
83 CHAPTER NINE USER MANAGEMENT 9.1 Introduction NetXMS has it s own user database. All NetXMS user accounts stored in backend SQL database. Each account has it s own unique login name and identifier. The account may also have a password. 9.2 Terms and Definitions Users NetXMS has the following attributes for users: Unique identifier Unique login name First name Last name Description Authentication method Password Certificate Not all attributes are mandatory. Superuser NetXMS has built-in superuser with ID 0, which always has full access to the system. Default login name for superuser is admin. Default password is netxms and user will be forced to change it on first login. Superuser account can be renamed or disabled, but cannot be deleted Groups Each user can be member of several groups. Groups are the preferred way to organize access permissions. You should always grant permission to groups instead of using individual users. That way you will get a much shorter access control list which is easier to handle. Access rights from multiple groups are summarized to calculate effective user access rights. 77
84 Everyone Group NetXMS has built-in virtual group called Everyone. This group always contains all users in the system. It cannot be deleted, and it s members list cannot be edited System Access Rights System access rights used to grant access to system-wide configuration (like Event processing) and functions (like agent registration). The following system access rights can be granted: 78 Chapter 9. User management
85 Access Right Access server console Configure event templates Configure object tools Configure server actions Configure situations Configure SNMP traps Control user sessions Edit event processing policy Edit server configuration variables Execute commands via XMPP Login as mobile device Manage agent configurations Manage DCI summary table Manage image library Manage mapping tables Manage packages Manage server files Manage script library Manage users Read server files Register agents Send SMS Unlink helpdesk tickets View audit log View event log View event templates configuration View SNMP trap log Description Allow user to access server s debug console. Server debug console Allow user to configure event templates. Event processing Allow user to configure object tools. Object Tools Allow user to configure server actions. Event processing Allow user to configure situations. Event processing Allow user to configure SNMP trap mapping. Allow user to see active user sessions and force terminate them. (Not yet implemented) Allow user to edit Event Processing Policy. Event processing Allow user to edit server configuration variables. Allows user to execute commands via XMPP Allows user to login with help of mobile application Allow user to create, edit, and delete agent configurations stored on server. Agent configuration options from server Allows user to manage DCI summary table Summary table Allows user to manage image library Image library Allows user to manage mapping tables Allow user to install, remove, and deploy agent packages. agent-remote-update Allow user to upload files to server and delete files stored on server. Server File Managment Allow user to manage scripts in Script Library. Allow user to manage user accounts. Please note that user having this access right granted can modify own account to get any other system right granted. Allow user to read files stored on server and upload to agents (user still needs appropriate object rights for upload). Server File Managment Allow user to register NetXMS agents. Allow user to send SMS via NetXMS server. This access right has no effect unless server configuration variable AllowDirectSMS set to 1. Allow user to unlink alarm from external heldesk system Integration with external HelpDesk Allow user to view audit log. Allow user to view event log, alarm log. Allow user to view configured event templates. Allow user to view SNMP trap log Terms and Definitions 79
86 9.3 User Authentication Internal Password This is the default method for user authentication. Password provided by user compared against password stored in NetXMS database. Password Policy Various restrictions can be put on internal passwords to force users to choose stronger passwords. The following server configuration variables controls password policy: Variable Description Default MinPasswordLength Default minimum password length for a NetXMS user. The default applied only if 0 per-user setting is not defined. Password- Required pasword complexity. See table bellow for details. 0 Complexity PasswordExpiration Password expiration time in days. If set to 0, password expiration is disabled. Has 0 no effect on users with Password never expired flag set. PasswordHistoryLength Number of previous passwords to keep. Users are not allowed to set password if it matches one from previous passwords list. 0 Possible flags for PasswordComplexity: Value Description 1 Password must contain digits 2 Password must contain uppercase letters 4 Password must contain lowercase letters 8 Password must contain special characters 16 Forbid alphabetical sequences (password considered invalid if it contains alphabetical sequence of 3 or more letters of same case). 32 Forbid keyboard sequences (password considered invalid if it contains sequence of 3 or more characters that are located on keyboard next to each other, like ASDF). Complexity flags can be added together to get desired restrictions. For example, to force passwords to contain uppercase and lowercase letters, PasswordComplexity variable must be set to 6 (2 + 4). Changes to these configuration variables becomes effective immediately and does not require NetXMS server restart RADIUS If RADIUS authentication method selected password provided by user sent to RADIUS server for validation. User is granted access if RADIUS server responds with Access-Accept. Communication between NetXMS server and RADIUS server controlled by the following server configuration variables: 80 Chapter 9. User management

87 Variable Description Default value RADIUSNumRetries The number of retries for RADIUS authentication. 5 RADIUSPort Port number used for connection to primary RADIUS server RADIUSSecondaryPort Port number used for connection to secondary RADIUS server RADIUSSecondarySecret Shared secret used for communication with secondary RADIUS netxms server. RADIUSSecondary- Host name or IP address of secondary RADIUS server. none Server RADIUSSecret Shared secret used for communication with primary RADIUS netxms server. RADIUSServer Host name or IP address of primary RADIUS server. none RADIUSTimeout Timeout in seconds for requests to RADIUS server 3 Changes to these configuration variables becomes effective immediately and does not require NetXMS server restart Certificate Authentication This type of authentication can be selected manually in user preferences. Login process using certificate is following: 1. Server send random challenge to client 2. Client sign server s challenge with his certificate s private key and send signed challenge along with public part of certificate to server 3. Server validates certificate using CA certificate 4. If certificate is valid, server validates challenge signature using certificate s public key 5. If signature is valid, server compares certificate subject with mapping data from user record 6. If mapping data match with certificate subject, access is granted So, to login successfully, user must posses valid certificate with private key. Authentication by certificate also allows smart card login - you just need to store certificate used for login on smart card instead of local certificate store. Certificate management CA certificates can be managed in Certificate Manager view. Certificate can be added, deleted and edited. Edit window allows to change comment and to copy the subject of certificate. Certificate subject is one of the ways to link a certificate with a user User Authentication 81
88 Link certificate and user In User Manager view select user properties for required user. Then go to Authentication part. In Authentication Method section: Certificate, Certificate or Password, Certificate or RADIUS. Next two fields in combinations: Certificate mapping method: Subject Certificate mapping data: the subject of the CA. Can be taken from Certificate Manager view. Certificate mapping method: Public key Certificate mapping data: the public key of the certificate Certificate mapping method: Common name Certificate mapping data: if no mapping data set, then linking certificate CN = user name, otherwise CN = mapping data 9.4 Integration with LDAP NetXMS can perform one-way synchronization of users and groups with external LDAP server. User list replica is refreshed automatically. 82 Chapter 9. User management
89 Already existing NetXMS users or groups will not be modified during initial synchronization (e.g. user admin or group Everyone ) LDAP synchronization configuration Server parameters controlling LDAP synchronization: 9.4. Integration with LDAP 83
90 Variable Description Default value LdapConnectionString * Comma- or whitespace-separated list of URIs in a format schema://host:port. Supported schemas: ldap://, ldaps:// (LDAP over TLS), ldapi:// (LDAP over IPC), and cldap:// (connectionless LDAP). Windows specific: for server based on Windows system this parameter should be set according to this rules: empty string(attempts to find the default LDAP server), a domain name, or a space-separated list of host names or dotted strings that represent the IP address of hosts running an LDAP server to which to connect. Each host name in the list can include an optional port number which is separated from the host itself with a colon (:). Note: most LDAP implementations except recent versions of OpenLDAP do not ldap://localhost:389 LdapSyncUser * LdapSyncUserPassword * LdapSearch- Base LdapSearch- Filter * Lda- puserdelete- Action * LdapMappingName * ** LdapMap- pingfull- Name ** LdapMappingDescription ** LdapGroup- Class LdapUser- Class * LdapSyncInterval * LdapPage- Size * support mixed schema types in the single connection string. User login for LDAP synchronization User password for LDAP synchronization The LdapSearchBase configuration parameter is the DN of the entry at which to start the search. The LdapSearchFilter is a string representation of the filter to apply in the search. This parameter specifies what should be done while synchronization with deleted from LDAP user/group. 0 - if user should be just deleted from NetXMS DB. 1 - if it should be disabled. If it is chosen to disable user, then on LDAP sync user will be disabled and it s description will be change on LDAP entry was deleted. Afterwards this user/group can be detached from LDAP and enabled if it is required or just deleted manually. There should be specified name of attribute that s value will be used as a user login name There should be specified name of attribute that s value will be used as a user full name There should be specified name of attribute that s value will be used as a user description There is specified which object class represents group objects. If found entry will not be of a user ot group class, it will be just ignored. There is specified which object class represents user objects. If found entry will not be of a user ot group class, it will be just ignored. 1 uid display- Name display- Name This parameter is for setting synchronization interval in minutes between 0 NetXMS server and LDAP server. If synchronization parameter is set to 0 - synchronization will not be done. Limit of records that can be returned in one search page * Required fields ** Could not be the same field Synchronization also can be done manually with ldapsync or just ldap command in server console. 84 Chapter 9. User management
91 9.4.2 LDAP users/groups relationships with native NetXMS users/groups LDAP users and groups are handled in exactly the same was as users from internal database. Only difference is that LDAP group membership is refreshed on each synchronisation and any non-ldap user will be removed from the group Login with help of LDAP user Login process is completely transparent for the user - user name should match attribute set by LdapMappingName and password should be current LDAP password for that user LDAP configuration debuging If users are not synchronized the reason can be found by running manually ldapsync or just ldap command in server console on debug lever 4. Log when LDAP sync passed correctly: [11-Sep :28:08.352] [DEBUG] LDAPConnection::initLDAP(): Connecting to LDAP server [11-Sep :28:08.353] [DEBUG] LDAPConnection::syncUsers(): Found entry count: 3 [11-Sep :28:08.354] [DEBUG] LDAPConnection::syncUsers(): Found dn: CN=Users,CN=Customers,DC [11-Sep :28:08.354] [DEBUG] LDAPConnection::syncUsers(): CN=Users,CN=Customers,DC=Northwind [11-Sep :28:08.354] [DEBUG] LDAPConnection::syncUsers(): Found dn: CN=zev333,CN=Users,CN=Cu [11-Sep :28:08.354] [DEBUG] LDAPConnection::syncUsers(): User added: dn: CN=zev333,CN=Users [11-Sep :28:08.354] [DEBUG] LDAPConnection::syncUsers(): Found dn: CN=user,CN=Users,CN=Cust [11-Sep :28:08.354] [DEBUG] LDAPConnection::syncUsers(): User added: dn: CN=user,CN=Users,C [11-Sep :28:08.354] [DEBUG] LDAPConnection::closeLDAPConnection(): Disconnect form ldap. [11-Sep :28:08.354] [DEBUG] UpdateLDAPUsers(): User added: dn: CN=zev333,CN=Users,CN=Custom [11-Sep :28:08.354] [DEBUG] UpdateLDAPUsers(): User added: dn: CN=user,CN=Users,CN=Customer [11-Sep :28:08.354] [DEBUG] RemoveDeletedLDAPEntry(): Ldap uid=john,ou=people,dc=nodomain e [11-Sep :28:08.354] [DEBUG] RemoveDeletedLDAPEntry(): Ldap uid=zev,ou=people,dc=nodomain en [11-Sep :28:08.354] [DEBUG] RemoveDeletedLDAPEntry(): Ldap uid=kasio,ou=people,dc=nodomain [11-Sep :28:08.355] [DEBUG] RemoveDeletedLDAPEntry(): Ldap uid=usr1,ou=people,dc=nodomain e Login credentials incorrect: [11-Sep :49:39.892] [DEBUG] LDAPConnection::initLDAP(): Connecting to LDAP server [11-Sep :49:39.896] [DEBUG] LDAPConnection::loginLDAP(): LDAP could not login. Error code: [11-Sep :49:39.896] [DEBUG] LDAPConnection::syncUsers(): Could not login. Search base is set incorrectly or sync user does not have access to it: [11-Sep :54:03.138] [DEBUG] LDAPConnection::initLDAP(): Connecting to LDAP server [11-Sep :54:03.140] [DEBUG] LDAPConnection::syncUsers(): LDAP could not get search results Integration with LDAP 85
92 9.4.5 LDAP configuration examples Active Directory Variable Value LdapConnectionString ldap:// :389 LdapSyncUser CN=user,CN=Users,CN=Customers,DC=Domain,DC=Extranet LdapSyncUserPassword xxxxxxxx LdapSearchBase CN=Customers,DC=Domain,DC=Extranet LdapSearchFilter (objectclass=*) LdapUserDeleteAction 1 LdapMappingName samaccountname LdapMappingFullName displayname LdapMappingDescription description LdapGroupClass group LdapUserClass user LdapSyncInterval 1440 Open LDAP Variable Value LdapConnectionString ldap:// :389 LdapSyncUser cn=admin,dc=nodomain LdapSyncUserPassword xxxxxxxx LdapSearchBase dc=nodomain LdapSearchFilter (objectclass=*) LdapUserDeleteAction 1 LdapMappingName cn LdapMappingFullName displayname LdapMappingDescription description LdapGroupClass groupofnames LdapUserClass inetorgperson LdapSyncInterval Managing User Accounts All NetXMS user accounts can be managed from User Manager view available at Configuration User Manager in NetXMS Console. Only users with granted system right Manage users can access User Manager. To create new user account, select Create new user from view menu or context menu. To create new group, select Create new group from view menu or context menu. To delete user account, select it in the list, right-click, and select Delete from pop-up menu. You can delete multiple accounts at a time. To modify properties of user or group, select it in the list, right-click, and select Properties from pop-up menu. To reset user s password, select user account in the list, right-click, and select Change password from pop-up menu. 9.6 Audit All important user actions are written to audit log. There are two audit logging modes - internal and external. Internal audit logging is on by default and writes audit records into table in NetXMS database. External audit 86 Chapter 9. User management
93 logging allows sending audit records to external system via syslog protocol. External audit logging is off by default. Audit logging controlled by the following server configuration variables: Variable Description Default value AuditLogRetentionTime Retention time in days for the records in internal audit log. All records older 90 than specified will be deleted by housekeeping process. EnableAudit- Enable (1) or disable (0) audit logging. 1 Log ExternalAuditFacility Syslog facility to be used in audit log records sent to external server. 13 ExternalAuditPort UDP port of external syslog server to send audit records to. 514 ExternalAuditServer External syslog server to send audit records to. If set to none, external audit none logging is disabled. ExternalAuditSeverity Syslog severity to be used in audit log records sent to external server. 5 ExternalAuditTag Syslog tag to be used in audit log records sent to external server. netxmsdaudit 9.6. Audit 87
94 88 Chapter 9. User management
95 CHAPTER TEN OBJECT MANAGEMENT 10.1 Object browser Object browser organize all existing objects in hierarchical structure. NetXMS has eight top level objects Entire Network, Service Root, Template Root, Policy Root, Network Map Root, Dashboard Root, Report Root, and Business Service Root. These objects served as an abstract root for appropriate object tree. All top level objects has only one editable attribute name. Overall description about objects can be found in concepts part: Objects Properties Object browser has next options: Show filter CTRL+F2, that shows search line that has special syntaxes for search. Syntaxes description can be found there: Filters. Show status indicator CTRL+F3 Hide unmanaged objects Hide check templates. This option will not show Business Services templates Filters Buy default search is done by node name. In this type of search can be used * and? symbols for pattern search. But there are few prefix that can be used for other search options: / - will search in comments > - will search by IP address 10.2 Objects Detailed information about objects, it s usage, parents and childes can be found in concept chapter, Objects. In this section will be described only actions and properties that can be applied on different object classes Subnet Property pages: Except common properties subnets has Map Appearance and Trusted Nodes tabs. Map Appearance tab defines images that will be used to display this object on a Network Map. Trusted Nodes is used to define object list that have access to this object from the script. 89
96 Menu items: Full subnet can be managed or unamanged. Management status will be applied to all subnet node. If subnet is deleted and is the only parent of a node, then node also will be deleted with the subnet. Upload file menu item will upload file from server to all nodes that have agent and have access to upload directory. Under Tools menu are available predefined object tools that will be executed on each subnet node. More about object tool configuration can be found there: Object Tools. Execute server script will open execute server script view. Were arbitrary script can be executed. Alarms menu item will open view with all subnet nodes alarms. And 802.1x port state will open table with port authentication states, that can be exported to CSV Node Property pages: Except common properties node has Communications tab that is responsible for communication options with this node(like host name, agent proxy and authentication, SNMP proxy and authentication and ICMP proxy), Polling tab is responsible for disabling pols for specific node, Location is used to configure location of the node, Map Appearance tab defines images that will be used to display this object on a Network Map. Menu items: Usually interfaces for nodes are created automatically by Configuration poll results, but they can be also created manually with help of menu item Create interface... This interface is a physical port is used just for information purposes. Information about service monitoring and Create network service... menu item can be found there: Service monitoring. 90 Chapter 10. Object management
97 When node is unmanaged/managed - all it s childes like interfaces and service monitoring are also unmanaged/managed. In unmanaged state metrics are not collected and no pols are scheduled. Node can be deleted from NetXMS by Delete menu item. Node is not deleted synchronously, but it is scheduled node deletion. While node deletion all data bout this node is also collected(like metrics). If zones are enabled, then zone can be changed using Change zone... item. File manager will open agent file manager view. By default this view will be empty, to configure it refer to Agent file management chapter. Upload file can be used to upload file from server to node. This action can be applied simultaneously to all nodes. Take screenshot for now halfway implemented functionality. For now screenshot can be taken only from Windows machines. Description of Edit agent s configuration functionality can be found in Edit configuration file remotely chapter. Poll options: Poll Name Status Configuration Configuration (full) Instance discovery Instance names Topology Description Under Tools menu are available predefined object tools that will be executed on selected node. More about object tool configuration can be found there: Object Tools. Execute server script will open execute server script view. Were arbitrary script can be executed. Node can be accessed with $node variable. MIB Explorer will open MIB expolorer view. If geolocation of the node is set, then with help of Geolocation item can be opened map with shown on it object location. Software Inventory will show full software list for nodes with Windows systems or Linux systems(that used rpn or deb packages) and have NetXMS agent installed. Service Dependency will build tree from this node with all container where this node is included. Alarms will open alarm view with alarms only for this specific node. Find switch port will open view with log of searchs of switch port that with witch this node is connected. Wile search we will check one by one interfaces and will show first successful result x port state will open table with port authentication states, that can be exported to CSV. Topology menu item contains all options of predefined network maps for this node and some other options: Routing table IP route from... will build network map with route form selected node to node that is selected form Object selector window. IP route to... will build network map with route to selected node from node that is selected form Object selector window. IP Neighbors will show all IP neighbors of this node. Switch forwarding database(mac address table) VLANs Layer 2 Topology Radio interface Wirless stations Last values will open Last Values view. Data Collection Configuration will open Data Collection Configuration view, that is used to configure collected metrics from node Mobile Device Mobile device objects are added manually. More information about required configuration to monitor mobile devices can be found there: Monitoring mobile devices. Property pages: Mobile Device object has only default property page configuration. Menu items: Objects 91
98 Each phone object can be managed/unmanaged and deleted. In umnanaged state metrics of this device are not collected and no pols are scheduled. When mobile object is deleted all it s data is also deleted. No history data will be left. Execute server script will open execute server script view. Were arbitrary script can be executed. Geolocation History will open view were will be shown history of displacement of this device. From the menu can be selected the period to show on history map. Geolocation will show last known location of this device. Alarms menu item will open view with all subnet nodes alarms. Last values will open Last Values view. Data Collection Configuration will open Data Collection Configuration view, that is used to configure collected metrics from node Rack Cluster Intrface Network Service VPN Connector Condition Conditions may represent more complicated status checks because each condition can have a script attached. Interval for evaluation of condition status is configured in Server Configuration Variables as ConditionPollingInterval with default value 60 seconds. Input values for the condition script can be set in object properties. Such values are accessible via $1, $2,... variables inside the script. If the script returns 0, an activation event with the defined severity is created. If the script returns any other value, then a deactivation event is created. Besides default property pages condition has also: Menu items: Events and Status, were can be set activation and deactivation events, shource of this objects and status of active and inactive condition. Data, were can be set DCI s that s data will be given to a script for condition status calculation. Script tab is used to write script that will calculate if condition should be activated or deactivated. Map Appearance tab defines images that will be used to display this object on a Network Map. Trusted Nodes is used to define object list that have access to this object from the script. Condition can be mangedunmanaged. If condition is unmanaged, evaluation of condition is not run. Condition can be deleted Container Containers can be created in Infrastructure Services tree. Existing nodes and subnets can be added to containers by using Bind operation, and removed by using Unbind operation. New nodes, conditions, clusters, containers, mobile devices and racks can also be created. They can be created using required menu item of container under witch this object should appear. Containers and nodes inside them can be moved by Move to another container menu item or using drag&drop. Besides default property pages condition has also: Automatic bind about this functionality can be found there Location is used to configure location of the node 92 Chapter 10. Object management
99 Menu items: Map Appearance tab defines images that will be used to display this object on a Network Map. Trusted Nodes is used to define object list that have access to this object from the script. There are special menu item for each object that can be created in container. Objects like rack, container, mobile device, cluster are manually created objects. Node can be manually created or found by network discovery. In case if it is required to add already existing object to container use Bind... menu item. To remove node from container, but do not delete it use Unbind... menu item. Using Manage/Unmanage all nodes will be managed/unmanaged under container. Container can be deleted. If deleted container was the only one parent of the object, then this object will be also deleted. Upload file... will upload file from server to all nodes under container, same as each tool under Tools menu item will be executed on each node. Execute server script will open execute server script view. Were arbitrary script can be executed. Geolocation will show location of container on geographic map. Alarms will open alarm view with all active alarms for all children of this container x port state will open table with port authentication states of all devices that are under this container. This information can be exported to CSV. Automatic bind option For each container can be configured automatic binding rules. This can be done in Automatic Bind Rules tab of container properties...figure:: _images/automatic_bind_rules.png There can be defined if script should be used for automatic binding, if script should be used for node unbinding and can be written script it selves. This script will be executed each configuration poll of each node Common object properties General Each object has General tab in properties. There can be checked object class and ID, and changed object name. Each object has unique ID in the system. Object can be accessed by this ID Custom attributes Every object can have custom attributes defined either by user or integrated application via NetXMS API. Custom attributes distinguished by names (an attribute name can contain up to 127 printable characters), and have string values of unlimited length. However, if you wish to access custom attributes in NXSL scripts as properties of node object, you should name them conforming to NXSL identifier naming constraints. To create or change value of custom attribute manually, right-click object in NetXMS console, and select Properties Custom Attributes tab Status calculation Each object has it s own status calculation properties. By default status is calculated based on polling results, status of underlying objects, associated alarms and status DCIs. But there can be used different options of status calculation. Status calculation has two configuration parts: status propagation and status calculation Common object properties 93
100 94 Chapter 10. Object management
101 10.3. Common object properties 95
102 For status propagation are available next options: Default Unchanged Fixed value: Normal, Warning, Minor, Major, Fixed Relative with offset Severity based For status calculation are available next options: Default Most critical Single threshold (%) Multiple thresholds Comments Each object in Object Tree can have comment. Comment can be set in Properties of the object. 96 Chapter 10. Object management
103 Access control Object access rights controls access to NetXMS objects. Permissions given to an object inherited by all child objects, unless specifically blocked by turning off Inherit access rights from parent object(s) option in object s access control properties. Permissions given at different levels of the object tree summarize to form effective user rights for the object. The following object access rights can be granted: Access Right Access control Acknowledge alarms Control Create child objects Create helpdesk tickets Delete Modify Push data Read Send events Terminate alarms View alarms Download file Upload file Manage files Description Modify access control list for this object. Please note that user with this access right can grant any other access rights to own account. Acknowledge alarms with this object as source. For node objects, execute object tools of type Remote Command. Create child objects (or bind existing) under this object. Create ticket in external helpdesk system Delete this object. Modify object s properties (except access control). Push data for DCIs on this object. View object in the tree and read it s information. For node objects, read access allows to view collected DCI data. Send events on behalf of this object. Terminate alarms with this object as source. View alarms with this object as source. Allow user to download files from this node(from paths defined by filemng subagent). This access right is check also when download or tail of file is done from object tools. Allow user to upload files to this node(from paths defined by filemng subagent) Allow user to move, rename, delete files from this node(from paths defined by filemng subagent) Common object properties 97
 and Comments. 10.4.1 Subnet 10.")
104 10.4 Object Details Object details view provides main information about object. Each object has Overview tab that gisplays general information about object (like: ID, GUID, Class, and status of the object) and Comments Subnet 10.5 Object Tools There can be created tools that will be executed on objects. Tools can be managed in Object Tools view. Tools are shown under Tools item of node menu. There are some predefined object tools: If object tool should be removed for some time it can be just disabled and then enabled when required. When object tool is disabled it is not shown under Tools item of node menu. There is also common option to set image for each object tool in the tool properties Internal Commands that are defined in Management Console. The only command available for now is Wakeup node Agent Command This tool will execute command on an agent node and will show it s output if Command generates output option will be enabled. Field name Description Name Name that will be shown in node menu. Submenu can be created with -> notation. Description Description is shown in Object Tools view. Should be used to describe tool purpose. Command Command name that should be executed on a agent node, this command should be defined in agent s config. To this command can be given parameters in format: commandname param1 param2 param3... Command generated If this option is selected, then on command execution will be opened window with output it s output. This tool requires If chosen, before execution of tool will be shown Yes/No pop-up with text from confirmation before Confirmation message field. execution Confirmation message Can be set the message that will be shown in confirmation pop-up. Show this tool in node If this option is selected, then this tool will be shown for applicable nodes on commands Object Details view as node command. Command name This will be shown as a name of the command. Command short name Is used when usual name is too long for display. Disable Object Tool If chosen, tool is not shown in node menu. 98 Chapter 10. Object management
105 SNMP Table SNMP Table is used to get SNMP table from node on which it is executed and then show results in the table form. Field name Name Description Title Use as index for second and subsequent columns OID suffix of first column Use as index for second and subsequent columns Value of first column This tool requires confirmation before execution Confirmation message Show this tool in node commands Command name Command short name Disable Object Tool Description Name that will be shown in node menu. Submenu can be created with -> notation. Description is shown in Object Tools view. Should be used to describe tool purpose. Title of view where table will be shown. This option defines that as suffix for columns OID s to match lines will be used suffix of columns OID This option defines that as suffix for columns OID s to match lines will be used value of columns OID If chosen, before execution of tool will be shown Yes/No pop-up with text from Confirmation message field. Can be set the message that will be shown in confirmation pop-up. If this option is selected, then this tool will be shown for applicable nodes on Object Details view as node command. This will be shown as a name of the command. Is used when usual name is too long for display. If chosen, tool is not shown in node menu Agent Table Agent Table is used to get agent list from node on which it is executed and then show results in the table form Object Tools 99
106 100 Chapter 10. Object management
107 Field name Description Name Name that will be shown in node menu. Submenu can be created with -> notation. Description Description is shown in Object Tools view. Should be used to describe tool purpose. Title Title of view where table will be shown. Parameter Name of list Regular expression Regular expression that will parse each line of list to separate it on columns defined in Columns tab. This tool requires confirmation before execution If chosen, before execution of tool will be shown Yes/No pop-up with text from Confirmation message field. Confirmation message Can be set the message that will be shown in confirmation pop-up. Show this tool in node commands If this option is selected, then this tool will be shown for applicable nodes on Object Details view as node command. Command name This will be shown as a name of the command. Command short name Is used when usual name is too long for display. Disable Object Tool If chosen, tool is not shown in node menu URL URL tool opens URL in web browser Object Tools 101
108 Field name Description Name Name that will be shown in node menu. Submenu can be created with -> notation. Description Description is shown in Object Tools view. Should be used to describe tool purpose. URL URL that should be passed to browser to be opened. This tool requires confirmation before execution If chosen, before execution of tool will be shown Yes/No pop-up with text from Confirmation message field. Confirmation message Can be set the message that will be shown in confirmation pop-up. Show this tool in node commands If this option is selected, then this tool will be shown for applicable nodes on Object Details view as node command. Command name This will be shown as a name of the command. Command short name Is used when usual name is too long for display. Disable Object Tool If chosen, tool is not shown in node menu Local Command Local Command tool will execute command on the local node and will show it s output if Command generates output option will be enabled. This tool type is not visible from Web Console as there is not possible to execute command on web page receiver s machine. 102 Chapter 10. Object management
109 Field name Description Name Name that will be shown in node menu. Submenu can be created with -> notation. Description Description is shown in Object Tools view. Should be used to describe tool purpose. Command Command that should be executed on a local machine Command generated output If this option is selected, then on command execution will be opened window with it s output. This tool requires confirmation before execution If chosen, before execution of tool will be shown Yes/No pop-up with text from Confirmation message field. Confirmation message Can be set the message that will be shown in confirmation pop-up. Show this tool in node commands If this option is selected, then this tool will be shown for applicable nodes on Object Details view as node command. Command name This will be shown as a name of the command. Command short name Is used when usual name is too long for display. Disable Object Tool If chosen, tool is not shown in node menu Server Command Server command tool can be used to execute command on a server Object Tools 103
110 Field name Description Name Name that will be shown in node menu. Submenu can be created with -> notation. Description Description is shown in Object Tools view. Should be used to describe tool purpose. Command Command that should be executed on a server Command generated output *Not yet implemented for server actions* This tool requires confirmation before execution If chosen, before execution of tool will be shown Yes/No pop-up with text from Confirmation message field. Confirmation message Can be set the message that will be shown in confirmation pop-up. Show this tool in node commands If this option is selected, then this tool will be shown for applicable nodes on Object Details view as node command. Command name This will be shown as a name of the command. Command short name Is used when usual name is too long for display. Disable Object Tool If chosen, tool is not shown in node menu Download File Download file tool can be used to monitor agent logs. This tool will retrieve the content of the file from agent. 104 Chapter 10. Object management
111 Field name Description Name Name that will be shown in node menu. Submenu can be created with -> notation. Description Description is shown in Object Tools view. Should be used to describe tool purpose. Remote File Name Name of file that will be retrieved. In Windows systems should be with double back slash as a separator(c:\\log\\log.log). Can be used strftime(3c) macros Limit initial download size Limits the size of download file. If is set not to 500 tool will retrieve last 500 bytes of requested file. If is set to 0, then will retrieve full file. Follow file changes If chosen, File View will be updated when file will be populated with new data. This tool requires confirmation before If chosen, before execution of tool will be shown Yes/No pop-up with text from Confirmation message field. execution Confirmation message Can be set the message that will be shown in confirmation pop-up. Show this tool in node commands If this option is selected, then this tool will be shown for applicable nodes on Object Details view as node command. Command name This will be shown as a name of the command. Command short name Is used when usual name is too long for display. Disable Object Tool If chosen, tool is not shown in node menu Macro Substitution Action, file download, local command, and URL tool types allows macro substitution. Any string enclosed into pair of percent signs considered macro name and is expanded. The following macros recognized: Name OBJECT_ID OBJECT_IP_ADDR OBJECT_NAME custom_attribute Description ID of selected node object. Primary IP address of selected node object. Name of selected node object. User defined attribute If object tool called from alarm s pop-up menu the following additional macros are available: Name ALARM_ID ALARM_MESSAGE ALARM_SEVERITY ALARM_SEVERITY_TEXT ALARM_STATE Description ID of selected alarm. Message text of the alarm. Alarm severity as a number. Alarm severity as text. Alarm state code (0 for outstanding, 1 for acknowledged, 2 for resolved). For any unknown macro name system will try to read custom attribute with given name (attribute search is case sensitive). If attribute with given name not found, empty string will be inserted Properties Filer Filters are used to chose on witch nodes to show object tool. There are 5 types of filtering. Show object tool: 1. if agent available on a node 2. if node supports SNMP 3. if node SNMP OID matches with provided string 4. if nodes OS matches provided comma separated regular expression list 5. if provided template name matches provided comma separated regular expression list Object Tools 105
112 106 Chapter 10. Object management
113 Access Control In Access Control tab can be defined witch users or groups can execute this action. If no list will be empty - only administrator will be able to execute this action. Columns Columns tab is used only for Agent Table and SNMP Table object tool types. For SNMP Table it describes name and type of matching OID from response message Predefined Object Tools NetXMS is deviled with some predefined Object Tools. There is full list of them: Predefined Object Tools 107

114 108 Chapter 10. Object management
115 Name Type Description Filter Connect Open web browser URL Open embedded web browser to node Connect->Open web browser (HTTPS) URL Open embedded web browser to node using HTTPS Info->Agent->Subagent list Agent Table Show list of loaded subagents NetXMS agent should be available Info->Agent->Configured ICMP targets Agent Table Show list of actions supported by agent NetXMS agent should be available Info->Agent->Supported actions Agent Table Show list of actions supported by agent NetXMS agent should be available Info->Agent->Supported lists Agent Table Show list of lists supported by agent NetXMS agent should be available Info->Agent->Supported parameters Agent Table Show list of parameters supported by agent NetXMS agent should be available Info->Process list Agent Table Show list of currently running processes NetXMS agent should be available Info->Routing table (SNMP) SNMP Table Show IP routing table NetXMS should support SNMP Info->Switch forwarding database (FDB) SNMP Table Show switch forwarding database NetXMS should support SNMP Info->Active user sessions Agent Table Show list of active user sessions NetXMS agent should be available Info->ARP cache (Agent) Agent Table Show ARP cache NetXMS agent should be available Info->Topology table (CDP) SNMP Table Show topology table (CDP) NetXMS should support SNMP Info->Topology table (LLDP) SNMP Table Show topology table (LLDP) NetXMS should support SNMP Info->Topology table (Nortel) SNMP Table Show topology table (Nortel protocol) NetXMS should support SNMP Restart system Action Restart target node via NetXMS NetXMS agent should agent Shutdown system Action Shutdown target node via NetXMS agent Wakeup node Internal Wakeup node using Wake-On-LAN magic packet Restart agent Action Restart NetXMS agent on target node be available NetXMS agent should be available NetXMS agent should be available Predefined Object Tools 109
116 110 Chapter 10. Object management
117 CHAPTER ELEVEN NETWORK DISCOVERY 11.1 Introduction NetXMS is capable of discovering your network automatically. Network discovery module can operate in two modes - passive and active. In passive mode, information about new hosts and devices obtained from ARP tables and routing tables of already known devices. NetXMS starts with it s own ARP cache and routing table. In active discovery mode, NetXMS server will send an ICMP echo requests to all IP addresses in given range, and consider each responding address for adding to database. For each new device found NetXMS server tries to gather additional information using SNMP and NetXMS agent, and then adds it to database. By default NetXMS server will add all discovered devices to database, but you can limit it by using discovery filters. Active discovery runs every 2 hours and passive every 15 minutes. Thees values can be change in ActiveDiscoveryInterval and DiscoveryPollingInterval server variables. Default number of discovery poller s threads is 1, this value can be change by NumberOfDiscoveryPollers parameter. More information about server variables can be found there Configuring Network Discovery To change network discovery settings, go to main menu of management console and choose Configuration Network Discovery. Configuration form will open: General In this section, you can choose network discovery mode, set default SNMP community string and chose if source node of SNMP Trap should be used for discovery Filter In this section, you can define filter for adding new nodes to NetXMS database. Filtering options are following: No filtering Any new device found will be added to database. This is the default setting. Custom script You can choose NXSL script from the Script Library to work as discovery filter. Custom filtering script will get object of class NewNode as first parameter (special variable $1), and should return true to allow node inclusion into database. Automatically generated script This option can be used if you need only simple filtering. When selected, additional options controls what nodes will be added to database: 111
118 Accept node if it has NetXMS agent Accept node if it has SNMP agent Accept node if it is within given range or subnet If checked, only nodes with NetXMS agent detected will pass the filter. If checked, only nodes with SNMP agent detected will pass the filter. Only accept nodes withing given address range or subnet. Address ranges can be configured in Address Filters section. Please note that first two options (NetXMS agent presence and SNMP agent presence) forms OR condition - if both are checked, any node with either SNMP agent or NetXMS agent will pass. Address range check and first two options forms AND condition - so if potential node does pass agent presence check, but is not in allowed IP address range, it will not be accepted. In other words, if all three options are checked, condition for new node to pass filter can be written as following: if (node has NetXMS agent or node has SNMP agent) and node within given range then pass Active Discovery Targets In this section, you can define address ranges for active discovery. NetXMS server will periodically send ICMP echo requests to these addresses, and consider for addition to database every responding device. This list has no effect if active discovery is off Address Filters In this section you can define address ranges for automatically generated discovery filter. This list has no effect if discovery is off or filter is not set to Automatically generated script. 112 Chapter 11. Network discovery
119 SNMP Communities In this section you can add SNMP community strings to be tested during configuration polls. NetXMS server first will try default community string defined in General section, and then all community strings from this list SNMP USM Credentials In this section you can add SNMP version 3 credentials to be tested during configuration polls Configuring Network Discovery 113
120 114 Chapter 11. Network discovery
121 CHAPTER TWELVE DATA COLLECTION 12.1 How data collection works Every node can have many data collection items configured (see Data Collection for detailed description). NetXMS server has a set of threads dedicated to data collection, called Data Collectors, used to gather information from the nodes according to DCI configuration. You can control how many data collectors will run simultaneously, by changing server configuration parameter NumberOfDataCollectors. All configured DCIs are checked for polling requirement every two seconds and if DCI needs to be polled, appropriate polling request is placed into internal data polling queue. First available data collector will pick up the request and gather information from the node according to DCI configuration. If a new value was received successfully, it s being stored in the database, and thresholds are checked. After threshold checking, data collector is ready for processing new request. Processing of a newly received parameter value is outlined on the figure below. Figure 12.1: Newly received parameter processing It is also possibility to push data to server. If DCI source is set to Push, server just waits for new values instead of polling himself data source. New in version 2.0-M5: Offline data collection. By default DCI data is not collected while connection between server and agent is broken as poll request could not get till agent. There is special configuration that allows to collect data and store it on agent till connection with server is restored and collected data is pushed to the server. This option is available for metrics, table metrics and proxy SNMP metrics. Not implemented for proxy SNMP table metrics. In case of this configuration agent stores DCI configuration locally and does all metric collection and dispatch by himself. DCI configuration is synchronized on connect, DCI configuration change or SNMP proxy server change. Information about configuration options can be found there: Offline data collection DCI configuration Basic configuration Data collection for a node can be configured using management console. To open data collection configuration window, right-click on node object in Object Browser or on a Network Map, and click Data Collection Configuration. You will see the list of configured data collection items. From here, you can add new or change existing parameters to monitor. Right click on the item will open pop-up menu with all possible actions. 115
122 Each DCI have multiple attributes which affects the way data is collected. attribute is given below. Detailed information about each Description Description is a free-form text string describing DCI. It is not used by the server and is intended for better information understanding by operators. If you use the Select button to choose a parameter from the list, description field will be filled automatically. Parameter Name of the parameter of interest, used for making a request to target node. For NetXMS agent and internal parameters it will be parameter name, and for SNMP agent it will be an SNMP OID. You can use the Select button for easier selection of required parameter name. Origin Origin of data (method of obtaining data). Possible origins are: NetXMS agent SNMP agent CheckPoint SNMP agent Windows Performance Counter Internal (data generated inside NetXMS server process) Push Agent Script (from script library, can be used instead of internal dummy) Push Agent origin is very different from all others, because it represents DCIs whose values are pushed to server by external program (usually via nxapush or nxpush command line tool) instead of being polled by the server based on the schedule. Data Type Data type for the parameter. Can be one of the following: Integer, Unsigned Integer, 64-bit Integer, 64-bit Unsigned Integer, Float (floating point number), or String. Selected data type affects collected data processing - for example, you cannot use operations like less than or greater than on strings. If you select parameter from the list using the Select button, correct data type will be set automatically. Polling Interval An interval between consecutive polls, in seconds. If you select the Use advanced scheduling option, this field has no meaning and will be disabled. Advanced Schedule If you turn on this flag, NetXMS server will use custom schedule for collecting DCI values instead of fixed intervals. This schedule can be configured on the Schedule page. Advanced schedule consists of one or more records; each representing desired data collection time in cron-style format. Record has five fields, separated by spaces: minute, hour, day of month, month, and day of week. Optionally, the sixth field can be specified for resolution in seconds (this is a non-standard extension which is not compatible with a regular cron format). Moreover, the sixth field (but not others) supports additional stepping 116 Chapter 12. Data collection
123 syntax with a percent sign (%), which means that the step in seconds calculated in absolute seconds since the Unix epoch (00:00:00 UTC, 1st of January, 1970). It s not recommended to use seconds in custom schedules as your main data collection strategy though. Use seconds only if it is absolutely necessary. Allowed values for each filed are: Field Value minute 0-59 hour 0-23 day of month 1-31 month 1-12 day of week 0-7 (0 and 7 is Sunday) seconds (optional) 0-59 A field may be an asterisk (*), which always stands for any. Examples Run five minutes after midnight, every day: 5 0 * * * Run at 14:15 on the first day of every month: * * Run every 5 minutes: */5 * * * Run every minute on 10th second: * * * * * 10 Run twice a minute (on seconds 0 and 45): * * * * * */45 Run every 45 seconds: * * * * * *%45 Associate with cluster resource In this field you can specify cluster resource associated with DCI. Data collection and processing will occur only if node you configured DCI for is current owner of this resource. This field is valid only for cluster member nodes. Retention Time This attribute specifies how long the collected data should be kept in database, in days. Minimum retention time is 1 day and maximum is not limited. However, keeping too many collected values for too long will lead to significant increase of your database size and possible performance degradation. Status DCI status can be one of the following: Active, Disabled, Not Supported. Server will collect data only if the status is Active. If you wish to stop data collection without removing DCI configuration and collected data, the Disabled status can be set manually. If requested parameter is not supported by target node, the Not Supported status is set by the server DCI configuration 117
124 Other Options 1. There is option to show last DCI value in object tooltip on a map. (Other Options -> Show last value in object tooltip) 2. DCI can be used to calculate object status. Such kind of DCI should return integer number from 0 till 4 representing object status. To use DCI for status calculation, there should be selected this option in it s properties (Other Options -> Use this DCI for node status calculation) Data Transformations In simplest case, NetXMS server collects values of specified parameters and stores them in the database. However, you can also specify various transformations for original value. For example, you may be interested in a delta value, not in a raw value of some parameter. Or, you may want to have parameter value converted from bytes to kilobytes. All transformations will take place after receiving new value and before threshold processing. Data transformation consists of two steps. On the first step, delta calculation is performed. You can choose four types of delta calculation: Function None Simple Average per second Average per minute Description No delta calculation performed. This is the default setting for newly created DCI. Resulting value will be calculated as a difference between current raw value and previous raw value. By raw value is meant the parameter value originally received from host. Resulting value will be calculated as a difference between current raw value and previous raw value, divided by number of seconds passed between current and previous polls. Resulting value will be calculated as a difference between current raw value and previous raw value, divided by number of minutes passed between current and previous polls. On the second step, custom transformation script is executed (if presented). By default, newly created DCI does not have a transformation script. If transformation script is presented, the resulting value of the first step is passed to the transformation script as a parameter; and a result of script execution is a final DCI value. Transformation script gets original value as first argument (available via special variable $1), and also has two predefined global variables: $node (reference to current node object), and $dci (reference to current DCI object). For more information about NetXMS scripting language, please consult Scripting chapter in this manual Push parameters NetXMS gives you ability to push DCI values when you need it instead of polling them on specific time intervals. To be able to push data to the server, you should take the following steps: 1. Set your DCI s origin to Push Agent and configure other properties as usual, excluding polling interval which is meaningless in case of pushed data. 2. Create separate user account or pick an existing one and give Push Data access right on the DCI owning node to that user. 3. Use nxapush or nxpush utility or client API for pushing data List DCIs Usually DCIs have scalar values. A list DCI is a special DCI which returns a list of values. List DCIs are mostly used by NetXMS internally (to get the list of network interfaces during the configuration poll, for example) but can also be utilized by user in some occasions. NetXMS Management Console does not support list DCIs directly but their names are used as input parameters for Instance Discovery methods. List DCI values can be also obtained with nxget command line utility (e.g. for use in scripts). 118 Chapter 12. Data collection
125 Table DCIs Table DCI collects and stores data in table format(multi row, column) Offline data collection Offilne data collection allow metric data to be obtained while connection between server and agent have been broken. This option is available for metrics, table metrics and proxy SNMP metrics. Not implemented for proxy SNMP table metrics. While break data is stored on agent, and on connect it is send to server. Detailed description can be found there: How data collection works. Agent side cache is configurable globally, on node level, and on DCI level. By default it s off. New in version 2.0-M5: Offline data collection Configuration It can be enabled: globally - set configuration parameter DefaultAgentCacheMode to 1. on node level - change Agent cache mode on in node properties on Polling page on DCI level - change Agent cache mode on in DCI properties on :guilabel: General page 12.4 Last DCI values View 12.5 Thresholds Overview For every DCI you can define one or more thresholds. Each threshold there is a pair of condition and event - if condition becomes true, associated event is generated. To configure thresholds, open the data collection editor for node or template, right-click on the DCI record and select Edit from the pop-up menu, then select the Thresholds page. You can add, modify and delete thresholds using buttons below the threshold list. If you need to change the threshold order, select one threshold and use arrow buttons located on the right to move the selected threshold up or down Instance Each DCI has an Instance attribute, which is a free-form text string, passed as a 6th parameter to events associated with thresholds. You can use this parameter to distinguish between similar events related to different instances of the same entity. For example, if you have an event generated when file system was low on free space, you can set the Instance attribute to file system mount point Threshold Processing As you can see from this flowchart, threshold order is very important. Let s consider the following example: you have DCI representing CPU utilization on the node, and you wish two different events to be generated - one when CPU utilization exceeds 50%, and another one when it exceeds 90%. What happens when you place threshold > 50 first, and > 90 second? The following table shows values received from host and actions taken by monitoring system (assuming that all thresholds initially unarmed): Offline data collection 119
126 Figure 12.2: Threshold processing algorithm 120 Chapter 12. Data collection

127 Value Action 10 Nothing will happen. 55 When checking first threshold (> 50), the system will find that it s not active, but condition evaluates to true. So, the system will set threshold state to active and generate event associated with it. 70 When checking first threshold (> 50), the system will find that it s already active, and condition evaluates to true. So, the system will stop threshold checking and will not take any actions. 95 When checking first threshold (> 50), the system will find that it s already active, and condition evaluates to true. So, the system will stop threshold checking and will not take any actions. Please note that second threshold actually is not working, because it s masked by the first threshold. To achieve desired results, you should place threshold > 90 first, and threshold > 50 second. You can disable threshold ordering by checking Always process all thresholds checkbox. If it is marked, system will always process all thresholds Threshold Configuration When adding or modifying a threshold, you will see the following dialog: First, you have to select what value will be checked: Thresholds 121
128 Last polled value Average value Mean deviation Diff with previous value Data collection error Last value will be used. If number of polls set to more then 1, then condition will evaluate to true only if it s true for each individual value of last N polls. An average value for last N polls will be used (you have to configure a desired number of polls). A mean absolute deviation for last N polls will be used (you have to configure a desired number of polls). Additional information on how mean absolute deviation calculated can be found here. A delta between last and previous values will be used. If DCI data type is string, system will use 0, if last and previous values match; and 1, if they don t. An indicator of data collection error. Instead of DCI s value, system will use 0 if data collection was successful, and 1 if there was a data collection error. You can use this type of thresholds to catch situations when DCI s value cannot be retrieved from agent. Second, you have to select comparison function. Please note that not all functions can be used for all data types. Below is a compatibility table: Type/Function Integer Unsigned Integer Int64 Unsigned Int64 Float String Less X X X X X X Less or equal X X X X X X Equal X X X X X X X Greater or equal X X X X X X Greater X X X X X X Not equal X X X X X X X Like X Not like X Third, you have to set a value to check against. If you use like or not like functions, value is a pattern string where you can use meta characters: asterisk (*), which means any number of any characters, and question mark (?), which means any character. Fourth, you have to select events to be generated when the condition becomes true or returns to false. By default, system uses SYS_THRESHOLD_REACHED and SYS_THRESHOLD_REARMED events, but in most cases you will change it to your custom events. You can also configure threshold to resend activation event if threshold s condition remain true for specific period of time. You have three options - default, which will use server-wide settings, never, which will disable resending of events, or specify interval in seconds between repeated events Thresholds and Events You can choose any event to be generated when threshold becomes active or returns to inactive state. However, you should avoid using predefined system events (their names usually start with SYS_ or SNMP_). For example, you set event SYS_NODE_CRITICAL to be generated when CPU utilization exceeds 80%. System will generate this event, but it will also generate the same event when node status will change to ::guilabel::critical. In your event processing configuration, you will be unable to determine actual reason for that event generation, and probably will get some unexpected results. If you need custom processing for specific threshold, you should create your own event first, and use this event in the threshold configuration. NetXMS has some preconfigured events that are intended to be used with thresholds. Their names start with DC_. The system will pass the following six parameters to all events generated as a reaction to threshold violation: 1. Parameter name (DCI s name attribute) 2. DCI description 3. Threshold value 4. Actual value 5. Unique DCI identifier 6. Instance (DCI s instance attribute) 122 Chapter 12. Data collection
129 For example, if you are creating a custom event that is intended to be generated when file system is low on free space, and wish to include file system name, actual free space, and threshold s value into event s message text, you can use message template like this: File system %6 has only %4 bytes of free space (threshold: %3 bytes) For events generated on threshold s return to inactive state (default event is SYS_THRESHOLD_REARMED), parameter list is different: 1. Parameter name (DCI s name attribute) 2. DCI description 3. Unique DCI identifier 4. Instance (DCI s instance attribute) 12.6 Templates What is template Often you have a situation when you need to collect same parameters from different nodes. Such configuration making may easily fall into repeating one action many times. Things may became even worse when you need to change something in already configured DCIs on all nodes - for example, increase threshold for CPU utilization. To avoid these problems, you can use data collection templates. Data collection template (or just template for short) is a special object, which can have configured DCIs similar to nodes. When you create template and configure DCIs for it, nothing happens - no data collection will occur. Then, you can apply this template to one or multiple nodes - and as soon as you do this, all DCIs configured in the template object will appear in the target node objects, and server will start data collection for these DCIs. If you then change something in the template data collection settings - add new DCI, change DCI s configuration, or remove DCI - all changes will be reflected immediately in all nodes associated with the template. You can also choose to remove template from a node. In this case, you will have two options to deal with DCIs configured on the node through the template - remove all such DCIs or leave them, but remove relation to the template. If you delete template object itself, all DCIs created on nodes from this template will be deleted as well. Please note that you can apply an unlimited number of templates to a node - so you can create individual templates for each group of parameters (for example, generic performance parameters, MySQL parameters, network counters, etc.) and combine them, as you need Creating template To create a template, right-click on Template Root or Template Group object in the Object Browser, and click Create Template. Enter a name for a new template and click OK Configuring templates To configure DCIs in the template, right-click on Template object in the Object Browser, and select Data Collection from the pop-up menu. Data collection editor window will open. Now you can configure DCIs in the same way as the node objects Applying template to node To apply a template to one or more nodes, right-click on template object in Object Browser and select Apply from pop-up menu. Node selection dialog will open. Select the nodes that you wish to apply template to, and click OK (you can select multiple nodes in the list by holding Control key). Please note that if data collection editor is Templates 123

130 open for any of the target nodes, either by you or another administrator, template applying will be delayed until data collection editor for that node will be closed Removing template from node To remove a link between template and node, right-click on Template object in the Object Browser and select Unbind from pop-up menu. Node selection dialog will open. Select one or more nodes you wish to unbind from template, and click OK. The system will ask you how to deal with DCIs configured on node and associated with template: If you select Unbind DCIs from template, all DCIs related to template will remain configured on a node, but association between the DCIs and template will be removed. Any further changes to the template will not be reflected in these DCIs. If you later reapply the template to the node, you will have two copies of each DCI - one standalone (remaining from unbind operation) and one related to template (from new apply operation). Selecting Remove DCIs from node will remove all DCIs associated with the template. After you click OK, node will be unbound from template Macros in template items You can use various macros in name, description, and instance fields of template DCI. These macros will be expanded when template applies to node. Macro started with %{ character combination and ends with } character. The following macros are currently available: Macro node_id node_name node_primary_ip script:name Expands to Node unique id Node name Node primary IP address String returned by script name. Script should be stored in script library (accessible via Configuration Script Library). Inside the script, you can access current node s properties via $node variable. For example, if you wish to insert node s IP address into DCI description, you can enter the following in the description field of template DCI: My IP address is %{node_primary_ip} When applying to node with primary IP address , on the node will be created DCI with the following description: My IP address is Please note that if you change something in the node, name for example, these changes will not be reflected automatically in DCI texts generated from macros. However, they will be updated if you reapply template to the node. 124 Chapter 12. Data collection
131 12.7 Instance Discovery Sometimes you may need to monitor multiple instances of some entity, with exact names and number of instances not known or different from node to node. Typical example is file systems or network interfaces. To automate creation of DCIs for each instance you can use instance discovery mechanism. First you have to create master DCI. Create DCI as usual, but in places where normally you would put instance name, use the special macro {instance}. Then, go to Instance Discovery tab in DCI properties, and configure instance discovery method and optionally filter script Discovery Methods There are four different methods for instance discovery: Method Agent List Agent Table SNMP Walk - Values SNMP Walk - OIDs Input Data List name Table name Base OID Base OID Description Read list from agent and use it s values as instance names. Read table from agent and use it s instance column values as instance names. Do SNMP walk starting from given OID and use values of returned varbinds as instance names. Do SNMP walk starting from given OID and use IDs of returned varbinds as instance names Instance Filter You can optionally filter out unneeded instances and transform instance names using filtering script written in NXSL. Script will be called for each instance and can return TRUE (to accept instance), FALSE (to reject instance), and array of two elements - first is TRUE and second is new value for instance name Working with collected data Once you setup DCI, data starts collecting in the database. You can access this data and work with it in different ways. Data can be visualized in three ways: in graphical form, as a historical view(textual format) and as DCI summary table, this layout types can be combined in Dashboards. More detailed description about visualization and layout can be found there: Data and Network visualisation Instance Discovery 125
132 126 Chapter 12. Data collection
, which determines if the rule is appropriate for the current event,")
133 CHAPTER THIRTEEN EVENT PROCESSING 13.1 Event Processing Policy Actions taken by event processor for any specific event determined by set of rules called Event Processing Policy. Figure 13.1: Event Processing Policy Screen Every rule has two parts - a matching part (called Condition in the rule configuration dialog), which determines if the rule is appropriate for the current event, and an action part, which determines actions to be taken for matched events. Each event passes through all rules in the policy, so if it matches to more than one rule, actions specified in all matched rules will be executed. You can change this behavior by setting Stop Processing flag for the rule. If this flag is set and rule matched, processing of current event will be stopped. 127

134 You can create and modify Event Processing Policy using Event Processing Policy Editor. To access the Event Processing Policy Editor window, press F4 or select Tools Event Processing Policy menu. To create event policy right click on entry before or after witch new Event Processing Policy should appear and select Insert before or Insert after. Figure 13.2: Edit buttons To edit Event Processing Policy, filter or action click on icon in right corner of an entry, it will open general properties of Event Processing Policy. Figure 13.3: Edit buttons In EPP properties there are following sections: 128 Chapter 13. Event processing
135 Section Comments Condition Condition > Source Objects Condition > Events Condition > Severity Filter Condition > Filtering Script Action Action > Alarm Action > Situations Action > Server Actions Description There can be added comment about this policy that will be displayed like EPP name. This part determines if the rule is appropriate for the current event. There can be disabled check of this EPP. One or more event s source objects. This list can be left empty, which matches any node, or contain nodes, subnets, or containers. If you specify subnet or container, any node within it will be matched. Event code. This field can be left empty, which matches any event, or list of event codes. Event s severity. This field contains selection of event severities to be matched. Optional matching script written in NXSL. If this field is empty, no additional checks performed. Otherwise, the event will be considered as matched only if the script returns non-zero (TRUE) return code. For more information about NetXMS scripting language please refer to the chapter Scripting in this manual. In action part you can set what action should be done if event meets condition. There also can be set flag Stop event processing, that will stop check on this rule. There can be set rules connected with alarm generation. Alarm can be created, resolved or terminated ore done nothing. NXLS Persistent Storage TODO functionality will be changed to NXSL Pers. Store There is defined list of actions to be executed if condition is met. For action configuration refer to Actions chapter. *After all manipulations are done - save changes by pressing save icon.* Examples This rule defines that for every major or critical event originated from a node named IPSO two actions must be executed Alarms Alarms Overview As a result of event processing some events can be shown up as alarms. Usually alarm represents something that needs attention of network administrators or network control center operators, for example low free disk space on a server. All alarm events are logged to alarm log. A number of days the server keeps an alarm history can be configured by AlarmHistoryRetentionTime server configuration parameter. Alarm log can be viewied in Alarm Log View (Alt+F8). This view give option to query in alarm log required information. Every alarm has the following attributes: Attribute Creation time Last change time State Message Severity Source Key Possible alarm states: Description Time when alarm was created. Time when alarm was last changed (for example, acknowledged). Current state of the alarm, see table bellow Message text (usually derived from originating event s message text). Alarm s severity - Normal, Warning, Minor, Major, or Critical. Source node (derived from originating event). Text string used to identify duplicate alarms and for automatic alarm termination Alarms 129

136 Figure 13.4: Event Processing Policy properties Figure 13.5: Description of EPP toolbar form left to right: save changes, expand all, collapse all, horizontal layout, vertical layout, cut EPP, copy EPP, paset EPP, delete EPP 130 Chapter 13. Event processing

137 Figure 13.6: Example 1 Outstanding Acknowledged Sticky Acknowledged for time Sticky Acknowledged Resolved Terminated New alarm. When network administrator sees an alarm, he may acknowledge it to indicate that somebody already aware of that problem and working on it. A new event with the same alarm ID will reset the alarm state back to outstanding Alarm will remain acknowledged for given time interval even after new matching events, after time will pass alarm will be moved to outstanding state. This option can be used like snooze. When you know that there will be new matching events, but it will not change the situation. But after some time someone should check this problem. For example, if you have problem that cannot be solved until next week, so this alarm can be sticky acknowledged for 7 days. After 7 days this problem again will be in outstanding state. This type of acknowledge can be disabled by parameter EnableTimedAlarmAck in server configuration view. Alarm will remain acknowledged event after new matching events. This can be useful when you know that there will be new matching events, but it will not change the situation. For example, if you have network device which will send new SNMP trap every minute until problem solved, sticky acknowledge will help to eliminate unnecessary outstanding alarms. Network administrator sets this state when the problem is solved. Inactive alarm. When problem is solved, network administrator can terminate alarm. This will remove alarm from active alarms list and it will not be seen in console, but alarm record will remain in database. There are 2 types of alarm state flows: strict and not strict. This option can be configured in Preference page of Alarms or on server configuration page, parameter StrictAlarmStatusFlow. The difference between them is that in strict mode Terminate can be done only after Resolve state Alarm Melodies On each severity of alarm can be set melody to play. This melody will be played when new alarm in state outstanding will occur. Melody that should be played should exist on server in wav format. See instruction there: Upload file on server. By default there are no sounds on alarms. To set sound open preferences, there select Alarms Alarm Sounds tab. There in drop-down will be seen all possible options. If sound will not be chosen, alarm with this severity will come silently Alarm Comments For each alarm can be created comments in Alarm Details or Alarm Comments views. Comment can be created, edited or deleted. All comments will be deleted after alarm termination Alarms 131
138 Figure 13.7: Not strict(default) 132 Chapter 13. Event processing

139 Figure 13.8: Strict Alarms 133
140 134 Chapter 13. Event processing
141 Generating Alarms To generate alarms from events, you should edit Alarm field in appropriate rule of Event Processing Policy. Alarm configuration dialog will look like this: You should select Generate new alarm radio button to enable alarm generation from current rule. In the Message field enter alarm s text, and in the alarm key enter value which will be used for repeated alarms detection and automatic alarm termination. In both fields you can use macros described in the Macros for Event Processing section. You can also configure sending of additional event if alarm will stay in Outstanding state for given period of time. To enable this, enter desired number of seconds in Seconds field, and select event to be sent. Entering value of 0 for seconds will disable additional event sending Automatic Alarm Termination/Resolve You can terminate or resolve all active alarms with given key as a reaction for the event. To do this, select Terminate alarm radio button or Resolve alarm radio button in alarm configuration dialog and enter value for alarm key. For that field you can use macros described in the Macros for Event Processing chapter Alarms 135
142 Escalation As it was described in Generating Alarms chapter there is possibility to generate new event if alarm stay in Outstanding state for too long. Escalation is built on this option. When alarm was generated, but no action was done from operator in predefined time, new event can be generated and this time or SMS can be sent to operator or to it s manager. This escalation process can have as many steps as it is required. Example 1: TODO: create example of escalation with screenshot of EPP 13.3 Actions In addition to alarm generation server can perform various types of actions as a reaction to an event. Action types available in NetXMS are described in the following sections. Each action can be separately disabled in action configuration Execute command on management server Executes provided command on server node. Check that user under witch netxmsd process run has permission to run this command Execute command on remote node Executes provided command name defined in this nodes agent configuration file. To this command can be given parameters in format: commandname param1 param2 param3... Check that user under witch nxagentd process run has permission to run this command Send Send to one or more recipients. Multiple recipients can be separated by semicolons. Required server configuration parameters to send s: SMTPFromAddr, SMTPFromName, SMTPRetryCount, SMTPServer. For detailed description of parameters check Server configuration parameters. In message text can be used Macros for Event Processing Send SMS Send SMS to one or more recipients. Multiple recipients can be separated by semicolons. Server will use SMS driver for actual message sending. In message text can be used Macros for Event Processing Send XMPP message Sends XMPP/Jabber message to one or more recipients. Multiple recipients can be separated by semicolons. equired server configuration parameters to send XMPP message: XMPPLogin, XMPPPassword, XMPPPort, XMPPServer, EnableXMPPConnector. For detailed description of parameters check Server configuration parameters. In message text can be used Macros for Event Processing. 136 Chapter 13. Event processing
143 Execute NXSL script This action executes script form scrip library. In action configuration should be defined name of script. Information about scripting and library can be found there Forward event NetXMS does not support configuration synchronization between two NetXMS servers(distributed Monitoring). But it is possible to forward events from one server to another. This option allow synchronize events between servers but there are some limitation. Configuration Source server configuration: 1. Create new action of type forward event - it will have destination server address property. 2. Create a rule in event processing policy with filter for events you want to forward and add forwarding action as action. Destination server configuration: 1. Enable EnableISCListener and ReceiveForwardedEvents in server configuration. 2. Open port Check that receiving server have all events as on a sending server Limitation Limitations of event forwarding: 1. Event template with same event code or event name must exist on recipient server 2. Node object with same IP address as event s source node s address must exist on recipient server 3. Does not work with zones Events not met these conditions are discarded. It is possible to check if and why incoming events are discarded if turn on level 5 debug on receiving server. There can be used one of two options if it is required to disable polling of sender server nodes on recipient server: disable all polling protocols or unmanage nodes. Chose depends on how you wish to see node s status. For unmanaged node, it always be unmanaged, regardless of active alarms. If you disable polling, node s status will be unknown unless there will be active alarms for that node - in that case node s status will change to severity of most critical alarm NXLS Persistent Storage Todo Once will be implemented - update functionality description Situations Overview Situations is a special type of event processing objects which allow you to track current state of your infrastructure and process events accordingly. Each situation has one or more instances, and each instance has one or more attributes. Situation objects allow you to store information about current situation in attributes and then use this NXLS Persistent Storage 137
144 information in event processing. For example, if you have one service (service A) depending on another (service B), and in case of service B failure you wish to get alarm about service B failure, and not about consequent service A failure. To accomplish this, you can do the following: 1. Create situation object named ServiceStatus 2. In event processing policy, for processing of event indicating service B failure, add situation attribute update: update situation ServiceStatus, instance Service_B, set attribute status to failed 3. In event processing policy, for rule generating alarm in case of service A failure, add additional filtering using script - to match this rule only if service B is not failed. Your script may look like the following: sub main() { s = FindSituation("ServiceStatus", "Service_B"); if (s!= NULL) { if (s->status == "failed") return 0; // Don't match rule } return 1; // Match rule } Defining Situations Situations can be configured via management console. To open situations editor, select Configuration Situations Manager. You will see situations tree. At the top of the tree is an abstract root element. Below are all defined situations - initially there are no situations, so you will see only root element. You can create situation either by right-clicking root element and selecting Create from pop-up menu. Next level in the tree below situations is situation instances. Initially it is empty, but when situations start updating, you will see existing instances for each situation Updating Situations Situations can be updated via Event Processing Policy. To update situation, you can edit Situation field in appropriate rule. Situation update dialog will looks like following: You can select situation to update, and enter instance name and attributes to be set. In instance name and attributes values you can use same macros as in alarm generation Macros for Event Processing On various stages of event processing you may need to use macros to include information like event source, severity, or parameter in your event texts, alarms, or actions. You may use the following macros to accomplish this: Macro Description %n Name of event source object. %a IP address of event source object. %g Globally unique identifier (GUID) of event source object. %i Unique ID of event source object in hexadecimal form. Always prefixed with 0x and contains exactly 8 digits (for example 0x000029AC). %I Unique ID of event source object in decimal form. %t Event s timestamp is a form day-month-year hour:minute:second. Continued on next page 138 Chapter 13. Event processing
145 Table 13.1 continued from previous page Macro Description %T Event s timestamp as a number of seconds since epoch (as returned by time() function). %c Event s code. %N Event s name. %s Event s severity code as number. Possible values are: 0 - Normal 1 - Warning 2 - Minor 3 - Major 4 - Critical %S Event s severity code as text. %v NetXMS server s version. %u User tag associated with the event. %m Event s message text (meaningless in event template). %A Alarm s text (can be used only in actions to put text of alarm from the same event processing policy rule). %M Custom message text. Can be set in filtering script by setting CUSTOM_MESSAGE variable. %[name] Value returned by script. You should specify name of the script from script library. %{name} Value of custom attribute. %<name> Event s parameter with given name. %1 - %99 Event s parameter number %% Insert % character. If you need to insert special characters (like carriage return) you can use the following notations: Char Description \t Tab Character (0x09) \n New line, CR/LF character pair \\ Backslash character Event s parameter with given name %<dciid> %<dciname> %<dcidescription> %<thresholdvalue> %<currentvalue> %<instance> %<isrepeatedevent> Macros for Event Processing 139
146 140 Chapter 13. Event processing
147 CHAPTER FOURTEEN DATA AND NETWORK VISUALISATION 14.1 Network maps Network map objects can be found in Object browser under Network Maps. There can be created and deleted maps and map groups. Maps can be organized in groups Creating Maps There are 3 types of map that can be created: Custom - will be created empty map. Layer 2 Topology - will create map(if possible) with layer 2 topology of selected object. IP Topology - will create map with known IP Topology of selected object. (More about network topology can be found there Network topology) Type of created map affects only on initial map setup Edit Maps Adding Objects Objects to map can be added in tow ways: 1. Just drag and drop object to map from object browser. 2. Add object... from menu. To remove object from map: Select object, right click and select Remove from map option. 141
148 142 Chapter 14. Data and Network visualisation
149 Adding Links between Objects Objects can be linked with a line. To link objects: Select two of objects with help of CTRL button and press Link selected objects button. To remove the link: Link properties: Select line, right click and select Remove from map option. Select line, right click and select Properties. There can be configured: Line name Line comments shown near each connected object Line colour Default - grey Based on object status - object should be selected Custom colour Routing algorithm Map Default - will be taken default selection for whole map Direct - straight line without bend points Manhattan - line with automatic bend points Bend points - bend point can be done manually with double click on the line (can be used to do dual link) Data Source(there can be configured DCI values and text near them that will be displayed on a link) For each Data Source can be configured: Data collection item, name, java format string(like Text: %.4f, syntax in case of table DCI also column and instance Example of DCI data displayed on a link: Network maps 143

150 Decorations To map can be added also decorations like picture and group box. To add picture it should be uploaded to Image Library before. Creating group box you should specify it s size, colour and name DCI Container DCI Container is part of decorations. It can be used to display separate dci values on a map. Container properties: Background colour Text colour If border should be shown and it s colour Data Source - there can be configured DCI values and text near them that will be displayed 144 Chapter 14. Data and Network visualisation

151 More examples: For each Data Source can be configured: Data collection item, name, format string(like Text: %.4f ), in case of table DCI also column and instance DCI Image DCI Image is part of decorations. It can be used to display DCI status change in pictures. DCI image properties Data source - DCI witch data will be taken to process picture display rules Column - required only for table DCI Network maps 145
152 Hints: Instance - required only for table DCI Default image - image that will be displayed if no rule is applicable on current value Rules For each rule can be configured: operation, value, comment and image that will be displayed if this rule is applicable To use image it should be first uploaded to image library. Rules are processed from up to down, so if you want to describe in rules something like: DCI > 3 => image1 DCI > 2 => image2 DCI > 4 => image3 They should go in this sequence: DCI > 4 => image3 DCI > 3 => image1 DCI > 2 => image Object Layout and display options All object layout properties and display options are applicable only on objects, not on decorations. Grid Align to grid - will move all objects to grids Snap to grid - all objects will be moved in grids and it will not be possible to place them not inside grid. Show grid - will show grid according to which objects are located. Layout Objects can be placed manually on a map or can be chosen one of automatic layouts: Spring Radial Horizontal tree Vertical tree 146 Chapter 14. Data and Network visualisation
153 Sparse vertical tree If there is chosen automatic layout, then after each refresh object best matching place will be recalculated. So if new object is add - it is just required to refresh map to have correctly placed objects. If there is chosen manual layout, then after each object movement map should be saved, to save the new place of object. Object status Show status background - will display background behind object image according to it s state. Show status icon - will display icon of object state near each object Show status frame - will display frame around object icon according to it s state Routing Default routing type for whole map: Direct Manhattan Zoom Map can be zoomed in and out with help of top menu buttons and to predefined percentage selected from menu. Object display options Objects can be displayed in 3 ways: Icons Small labels Large labels Map Background It can be set background for map: Colour Image - image should be uploaded to Image Library before. Geographic Map - place on map is chose with help of zoom and coordinates This can be used to show object physical please on map or on building plan. Examples: 14.2 Dashboards Dashboards are defined by administrator and allow to combine any available visualization components with data from multiple sources in order to create high-level views to see network (or parts of it) health at a glance. For example, below is a dashboard showing traffic information from core router, as well as CPU usage from vital nodes: There are two ways to access dashboards: Dashboards 147

154 148 Chapter 14. Data and Network visualisation

155 Open dashboard from Object Browser Open dashboard from Object Browser Switch to Dashboard perspective and select dashboard with left-click Configuration Dashboards is a special type of objects created in Dashboards tree. To create a new dashboard, right click on Dashboards root object or any other existing dashboard and select Create dashboard. To configure dashboard content, open object s properties and go to Dashboard Elements:guilabel: page. Here you can define number of columns and manage list of elements. Press Add:guilabel: to add new element. You will be prompted with element type selection dialog: When new element added, you can edit it by double-clicking on record in elements list, or by pressing Edit button. Each element have Layout property page which controls element s layout inside dashboard, and one or more element type specific pages to control element s appearance and displayed information. The following element types are available: Dashboards 149
156 Type Alarm Viewer Availability Chart Bar Chart Bar Chart for Table DCI Custom Widget Dashboard Dial Chart Geo Map Label Line Chart Network Map Pie Chart Pie Chart for Table DCI Separator Status Chart Status Indicator Tube Chart Tube Chart for Table DCI Web Page Description List of alarms for given object subtree. Pie chart showing availability percentage for given business service. Bar chart. Bar chart built from data collected via single table DCI. Custom widget provided by third party console plugin. Another dashboard object (or multiple objects) rendered as element of this dashboard. Dial chart. Geographic map centered at given location. Text label with configurable text and colors. Line chart. Network map object rendered as dashboard element. Pie chart. Pie chart built from data collected via single table DCI. Separator, can be shown as line, box, or simply empty space. Bar chart which shows current status distribution for nodes under given root. Shows current status of selected object. Tube chart. Tube chart built from data collected via single table DCI. Web page at given URL rendered within dashboard Element Property Pages Chart Chart page is available for all chart type elements: Bar Chart, Bar Chart for Table DCI, Dial Chart, Line Chart, Pie Chart, Pie Chart for Table DCI, Tube Chart, and Tube Chart for Table DCI. It defines basic properties of a chart. Data Sources Data sources page is available for all DCI based elements: Bar Chart, Dial Chart, Line Chart, Pie Chart, and Tube Chart. Here you can define what DCIs should be used as data sources for the chart. Up to 16 DCIs can be added to single chart. You can configure multiple properties for each data source. To edit data source, either double click on appropriate item in the list, or press Edit button. Data source configuration dialog looks like following: Property Data collection item Display name Color Area chart Show thresholds Description DCI object to be used. Name for this data source to be used in chart s legend. If left empty, DCI description will be used. Allows you to define specific color for this data source or let system to pick one automatically. This option is valid only for line charts and toggles data source display as filled area instead of line. This option is valid only for line charts and toggles display of configured thresholds. 150 Chapter 14. Data and Network visualisation
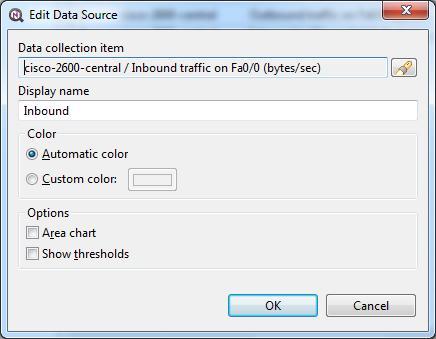
157 14.2. Dashboards 151

158 152 Chapter 14. Data and Network visualisation

159 Layout Property Horizontal alignment Vertical alignment Horizontal span Vertical span Width hint Height hint Description Horizontal alignment for this element. Possible values are FILL, CENTER, LEFT, and RIGHT. Vertical alignment for this element. Possible values are FILL, CENTER, TOP, and BOTTOM. Specify how many grid cells this element will occupy horizontally. Specify how many grid cells this element will occupy vertically. Hint for element s width in pixels. Default value of -1 means that layout manager will decide width for element. Hint for element s height in pixels. Default value of -1 means that layout manager will decide width for element. See detailed information about layout in section Understanding Element Layout. Web Page :guilabel Web Page property page is available for web page type elements. Here you can define URL to be displayed and optional title. If title is not empty, it will be displayed above page content Understanding Element Layout Dashboard uses grid concept to layout it s elements. Available space divided into rows and columns, and each element occupies one or more cells. Number of columns configured in dashboard object properties, and number of rows calculated automatically based on number of columns, number of elements, and number of cells occupied by each element. Elements are laid out in columns from left to right, and a new row is created when there are no space left for next element on current row. Each element has horizontal and vertical alignment properties. Default for both is FILL. Possible alignment values are following: Value Description FILL Make element to fill whole cell. Also causes to grab excess free space available inside dashboard. If more than one element is trying to grab the same space, then the excess space is shared evenly among the grabbing elements. CENTER Center element within cell. LEFT/TOP Align element to left/top of the cell. RIGHT/BOTTOM Align element to right/bottom of the cell. This configuration will be rendered into this layout: Dashboards 153

160 Figure 14.1: Complex layout configuration 154 Chapter 14. Data and Network visualisation

161 Dashboard Rotation To create configuration when console displays multiple dashboards one by one in a loop, follow these steps: Create all dashboards you want to show Create additional dashboard object, with single element of type Dashboard inside Add all dashboards you want to show to dashboard list of that element and set desired time between changing dashboards. Figure 14.2: Sample configuration of two dashboards displayed in a loop for 40 seconds each Graphs You can view collected data in a graphical form, as a line chart. To view values of some DCI as a chart, first open either Data Collection Editor or Last Values view for a host. You can do it from the Object Browser or map by selection host, right-clicking on it, and selecting Data collection or Last DCI values. Then, select one or more DCIs (you can put up to 16 DCIs on one graph), right-click on them and choose Graph from the pop-up menu. You will see graphical representation of DCI values for the last hour. When the graph is open, you can do various tasks: Graphs 155

162 Select different time interval By default, you will see data for the last hour. You can select different time interval in two ways: 1. Select new time interval from presets, by right-clicking on the graph, and then selecting Presets and appropriate time interval from the pop-up menu. 2. Set time interval in graph properties dialog. To access graph properties, right-click on the graph, and then select Properties from the pop-up menu. Alternatively, you can use main application menu: Graph Properties. In the properties dialog, you will have two options: select exact time interval (like 12/10/2005 from 10:00 to 14:00) or select time interval based on current time (like last two hours) Turn on automatic refresh You can turn on automatic graph refresh at a given interval in graph properties dialog. To access graph properties, right-click on it, and select Properties from the pop-up menu. Alternatively, you can use main application menu: Graph Properties. In the properties dialog, select the Refresh automatically checkbox and enter a desired refresh interval in seconds in edit box below. When automatic refresh is on, you will see Autoupdate message in the status bar of graph window Change colors You can change colors used to paint lines and graph elements in the graph properties dialog. To access graph properties, right-click on it, and select Properties from the pop-up menu. Alternatively, you can use main application menu: Graph Properties. In the properties dialog, click on colored box for appropriate element to choose different color Save current settings as predefined graph You can save current graph settings as predefined graph to allow quick and easy access in the future to information presented on graph. Preconfigured graphs can be used either by you or by other NetXMS users, depending on settings. To save current graph configuration as predefined graph, select Save as predefined from graph view menu. The following dialog will appear: In Graph name field, enter desired name for your predefined graph. It will appear in predefined graph tree exactly as written here. You can use -> character pair to create subtree. For example, if you name your graph NetXMS Server->System->CPU utilization (iowait) it will appear in the tree as following: You can edit predefined graph by right-clicking on it in predefined graph tree, and selecting Properties from context menu. On Predefined Graph property page you can add users and groups who will have access to this graph. Note that user creating the graph will always have full access to it, even if he is not in access list. If you need to delete predefined graph, you can do it by right-clicking on it in predefined graph tree, and selecting Delete from context menu. 156 Chapter 14. Data and Network visualisation
163 14.4 History You can view collected data in a textual form, as a table with two columns - timestamp and value. To view values of some DCI as a table, first open either Data Collection Editor or Last Values view for a host. You can do it from the Object Browser or map by selection host, right-clicking on it, and selecting Data collection or Last DCI values. Then, select one or more DCIs (each DCI data will be shown in separate view), right-click on them and choose Show history from the pop-up menu. You will see the last 1000 values of the DCI. Todo Export DCI data 14.5 Summary table It is possible to see DCI data as a table where each line is one node and each column is a DCI. It can be configured for each summary table witch DCIs should be present on it Configuration DCI summary table can be configured in Configuration -> Summary Table. In general part: Menu path - path where this summary table can be found. You can use -> character pair to create subtree like Linux->System information. Title - title of view History 157
 menu under Summary tables. 158 Chapter 14.")
164 In columns part: There are added DCI s shat should be shown on the summary table. Where Name is name of column and DCI Name is parameter of DCI Usage After DCI summary table is configured it can be accessed in container object(subnet, container...) menu under Summary tables. 158 Chapter 14. Data and Network visualisation
165 CHAPTER FIFTEEN COMMON MONITORING TASKS (RENAME THIS CHAPTER!) 15.1 Operating System There are separate subagent for each operating system type. This subagent is loaded automatically on agent start. They hide distinctions of similar function implementation on different platforms. They provide options to monitor agent statistic, processes statistic, file system, interface statistics, CPU, memory statistic. List of subagents: linux aix hpux winnt (Windows) sunos darwin (MacOS) freebsd netbsd openbsd Full list of parameters and compatibility between different platforms available there. In this section will be shown most common metric configurations Example In examples will be shown only DCI configuration with threshold. Generated event processing options can be found in Event processing chapter. Process monitoring In this example will be configured monitoring of running mysqld process. And one threshold: when process count is less then 1(process is not running). Create DCI for Process.Count(*) metric to monitor mysqld process count. Create threshold. It will be triggered when process count is not equal to 1(process is not running). As prerequisite it was created 2 events. As in message of error is used Instance parameter, it should be set in Threshold window. 159

166 Figure 15.1: Events 160 Chapter 15. Common monitoring tasks (rename this chapter!)
167 Figure 15.2: Threshold Operating System 161
168 162 Chapter 15. Common monitoring tasks (rename this chapter!)
169 Disk free space monitoring In this example will be configured monitoring of free space in percents for / disk and two thresholds: when disk space less then 15% and less then 7%. Create DCI for FileSystem.FreePerc(*) metric to monitor space on /. Create 2 thresholds. One will be triggered when free space is less than 15% and other one when free space is less than 7%. Before threshold creation was created 3 events: As in message of error is used Instance parameter, it should be set in Threshold window. CPU usage This example will show how to configure monitoring of CPU usage and create event when CPU usage is more than 90% for more than 5 minutes. Create DCI for System.CPU.LoadAvg metric. Create threshold that will create event in case if last 5 values are more than 90 (last 5 minutes CPU usage is more than 90%) Operating System 163
170 Figure 15.3: Events Figure 15.4: Threshold Chapter 15. Common monitoring tasks (rename this chapter!)
171 Figure 15.5: Threshold Operating System 165
172 Figure 15.6: Both 15.2 File meta information Monitoring of file system is implemented by OS subagents. Full description of this functions can be found there. There is provided option to get file hash, creation, last edit and other timestamps, file size and number of files in the directory. In this sections will be shown only the most commonly used configurations Examples In examples will be shown only DCI configuration with threshold. Generated event processing options can be found in Event processing chapter. Example 1 In this example will be shown how to check that specific folder exceed specified size. Create DCI for File.Size(*) metric to monitor folder size. Required parameters: /path,*,1. In threshold it should be checked that last value is less than 2 GB. That mean that returned value should be less than bytes. Example 2 In this example will be configured monitoring that in exact folder exist files that was modified less then half an hour ago. 166 Chapter 15. Common monitoring tasks (rename this chapter!)
173 15.2. File meta information 167
174 Figure 15.7: Events Create DCI for File.Count(*) metric to monitor file count in folder /path, that match any pattern, folder should be checked recursively, file match any size, files are created less than 30 minutes ago. This conditions will be given to metric as this parameters: path,*,1,0, In threshold it should be checked that at least one file meeting conditions exists. That mean that file count should be more than 1. Prerequisite is to create 2 events. As in message of error is used Instance parameter, it should be set in Threshold window Log monitoring With NetXMS you can monitor changes in text log files, Windows Event Log, and built-in syslog server. All log monitoring done by agents, except for built-in syslog server. In general, log processing goes as following: 1. When new line added to log file, it is passed to appropriate log parser 2. If line matched one of the patterns, event associated with this pattern sent to server 3. Server receives event and passes to event processing policy as usual, with event source set to node from which event was received Agent Configuration for Log Monitoring To be able to monitor logs with NetXMS agent, you should load LOGWATCH subagent and define parser configuration for each log file you wish to monitor. Example of agent configuration file: SubAgent = logwatch.nsm # Below is log parsers definitions *LOGWATCH Parser = C:\NetXMS\parser1.xml Parser = C:\NetXMS\parser2.xml 168 Chapter 15. Common monitoring tasks (rename this chapter!)
175 Figure 15.8: Threshold Log monitoring 169
176 170 Chapter 15. Common monitoring tasks (rename this chapter!)
177 Figure 15.9: Threshold Log monitoring 171
178 172 Chapter 15. Common monitoring tasks (rename this chapter!)
179 Figure 15.10: Events Syslog Monitoring NetXMS has built-in syslog server, which can be used to receive logs from network devices and servers. It is also possible to parse incoming syslog messages in a way similar to Windows Event Log monitoring. To parse syslog messages, LOGWATCH subagent is not required parsing is done by the server itself. You only need to define monitoring rules in Configuration Syslog Parser Parser Definition File Parser definition file is an XML document with the following structure: <parser> <file>file name</file> <macros> <macro name="name">macro body</macro> <!-- more <macro> tags can follow --> </macros> <rules> <rule> <match>regexp</match> <id>event id</id> <level>severity level</level> <source>event source</source> <event>event</event> <context>context</context> </rule> <!-- more <rule> tags can follow --> </rules> </parser> Entire <macros> section can be omitted, and inside <rule> tag only <match> is mandatory Log monitoring 173
180 Figure 15.11: Threshold 174 Chapter 15. Common monitoring tasks (rename this chapter!)
181 15.3. Log monitoring 175
182 Global Parser Options In the <parser> tag you can specify the following options: <file> Tag In the <file> tag you should specify log file to apply this parser to. To specify Windows Event Log, prepend it s name with asterisk (*), for example *System Macros In the <macros> section you can define macros for use in matching rules. For example, it can be useful to define macro for a timestamp preceding each log record and use it in matching rules instead of actual regular expression. You can define as many macros as you wish, each within it s own <macro> tag. Each macro should have unique name, defined in name attribute, and can be used in matching rules in Example: you need to parse log file where each line starts with timestamp in format dd/mm/yy HH:MM:SS. You can define the following macro: <rules> <rule> <match>@{timestamp}.*([a-za-z]+) failed.*</match> <event>12345</event> </rule> <rule> <match>@{timestamp}.*error.*</match> <event>45678</event> </rule> </rules> Please note that <macros> section always should be located before <rules> section in parser definition file Matching rules In the <rules> section you define matching rules for log records. Each rule placed inside it s own <rule> tag. Each rule can have additional options: break Default value 0 context Description If this option set to 1 and curent line match to regular expression in the rule, parser will stop processing of current line, even if global parser option processall was set to 1. If this option set to 0 (which is default), processing will stop according to processall option settings. Name of the context this rule belongs to. If this option is set, rule will be processed only if given context was already activated with <context> tag in one of the rules processed earlier (it can be either same line or one of the previous lines). Option Description Default value pro- If this option set to 1, parser will always pass log record through all rules. If this option 0 ces- sall set to 0, processing will stop after first match. trace Trace level 0 Option empty Inside the <rule> section there are the following additional tags: <match>, <description>, <event>, and <context>. Only <match> section is mandatory it specifies regular expression against which log record should be matched. All other tags are optional and define parser behavior if a record matches the regular expression. 176 Chapter 15. Common monitoring tasks (rename this chapter!)
183 <match> Tag Tag <match> contains a POSIX regular expression that is used to match log records. Parts enclosed in parenthesis can be extracted from log record and passed as arguments of generated event. You can use macros defined in Macros section. Also, it is possible to define inverted match rules (rules when log record considered matching if it does not match regular expression). Inverted match can be set by setting attribute invert to 1. Some examples: <match>^error: (.*)</match> This regular expression will match any line starting with word Error:, and everything after this word will be extracted from the log record for use with an event. <match>[0-9]{3}</match> This regular expression will match any line containing at least 3 consecutive digits. <match invert="1">abc</match> This regular expression will match any line not containing character sequence abc. <id> Tag Tag <id> can be used to filter records from Windows Event Log by event ID. You can specify either single event ID or ID range (by using two numbers separated with minus sign). For example: <id>7</id> will match records with event ID equal 7, and <id>10-20</id> will match records with ID in range from 10 to 20 (inclusive). This tag has no effect for text log files, and can be used as a synonym for <facility> tag for syslog monitoring. <source> Tag Tag <source> can be used to filter records from Windows Event Log by event source. You can specify exact event source name or pattern with * and? meta characters. Some examples: <source>tcpip</source> will match records with event source "Tcpip (case-insensitive), and <source>x*</source> will match records with event source started from letter X. This tag has no effect for text log files, and can be used as a synonym for <tag> tag for syslog monitoring. <level> Tag Tag <level> can be used to filter records from Windows Event log by event severity level (also called event type in older Windows versions). Each severity level has it s own code, and to filter by multiple severity levels you should specify sum of appropriate codes. Severity level codes are following: Log monitoring 177
184 Code Severity 1 Error 2 Warning 4 Information 8 Audit Success 16 Audit Failure Some examples: <level>1</level> will match all records with severity level Error, and <level>6</level> will match all records with severity level Warning or Information. This tag has no effect for text log files, and can be used as a synonym for <severity> tag for syslog monitoring. <facility> Tag Tag <facility> can be used to filter syslog records (received by NetXMS built-in syslog server) by facility code. The following facility codes can be used: Code Facility 0 kernel messages 1 user-level messages 2 mail system 3 system daemons 4 security/authorization messages 5 messages generated internally by syslogd 6 line printer subsystem 7 network news subsystem 8 UUCP subsystem 9 clock daemon 10 security/authorization messages 11 FTP daemon 12 NTP subsystem 13 log audit 14 log alert 15 clock daemon 16 local use 0 (local0) 17 local use 1 (local1) 18 local use 2 (local2) 19 local use 3 (local3) 20 local use 4 (local4) 21 local use 5 (local5) 22 local use 6 (local6) 23 local use 7 (local7) You can specify either single facility code or facility code range (by using two numbers separated by minus sign). For example: <facility>7</facility> will match records with facility code equal 7, and <facility>10-20</facility> will match records with facility code in range from 10 to 20 (inclusive). This tag has no effect for text log files, and can be used as a synonym for <id> tag for Windows Event Log monitoring. 178 Chapter 15. Common monitoring tasks (rename this chapter!)
185 <tag> Tag Tag <tag> can be used to filter syslog records (received by NetXMS built-in syslog server) by content of tag field. You can specify exact value or pattern with * and? meta characters. Some examples: <tag>httpd</tag> will match records with tag httpd (case-insensetive), and <tag>x*</tag> will match records with tag started from letter X. This tag has no effect for text log files, and can be used as a synonym for <source> tag for Windows Event Log monitoring. <severity> Tag Tag <severity> can be used to filter syslog records (received by NetXMS built-in syslog server) by severity level. Each severity level has it s own code, and to filter by multiple severity levels you should specify sum of appropriate codes. Severity level codes are following: Code Severity 1 Emergency 2 Alert 4 Critical 8 Error 16 Warning 32 Notice 64 Informational 128 Debug Some examples: <severity>1</severity> will match all records with severity level Emergency, and <severity>6</severity> will match all records with severity level Alert or Critical. This tag has no effect for text log files, and can be used as a synonym for <level> tag for Windows Event Log monitoring. <description> Tag Tag <description> contains textual description of the rule, which will be shown in parser trace. <event> Tag Tag <event> defines event to be generated if current log record match to regular expression defined in <match> tag. Inside <event> tag you should specify event code to be generated (or event name if you configure serverside syslog parsing). If you wish to pass parts of log record text extracted with regular expression as event s parameters, you should specify correct number of parameters in params attribute. <context> Tag Tag <context> defines activation or deactivation of contexts. It has the following format: Log monitoring 179
186 <context action="action" reset="reset mode">context name</context> Possible actions are: Action clear set Description Deactivate (clear active flag of) given context. Activate (set active flag of) given context. Reset mode determines how context will be deactivated (reset). Possible values for reset mode are: Reset mode auto manual Description Deactivate context automatically after first match in context (match rule with context attribute set to given context). Context can be deactivated only by explicit <context action="clear"> statement. Both action and reset attributes can be omitted; default value for action is set, and default value for reset is auto Examples of Parser Definition File Generate event with code if line in the log file /var/log/messages contains word error: <parser> <file>/var/log/messages</file> <rules> <rule> <match>error</match> <event>100000</event> </rule> </rules> </parser> Generate event with code if line in the log file C:\demo.log contains word process: and is immediately following line containing text process startup failed; everything after word process: will be sent as event s parameter: <parser> <file>c:\demo.log</file> <rules> <rule> <match>process startup failed</match> <context action="set" reset="auto">startup_failed</context> </rule> <rule context="startup_failed"> <match>process:(.*)</match> <event params="1">200000</event> </rule> </rules> </parser> 15.4 Service monitoring There are two options to add service monitoring: the first one is to add it through menu option Create Network Service... as an object with the status that will be propagated on a node, and the second one is to add it s monitoring as DCI. 180 Chapter 15. Common monitoring tasks (rename this chapter!)
187 Network Service Object representing network service running on a node (like http or ssh), which is accessible online (via TCP IP). Network Service objects are always created manually. Currently, the system works with the following protocols - HTTP, POP3, SMTP, Telnet, SSH and Custom protocol type. For Custom protocol, a user should define the TCP port number and the system will be checking whether that port is available. For the predefined standard services the system will also check whether an appropriate response is returned. In case of SMTP, the system will send a test mail, in case of POP3 try to log in with a certain user, in case of HTTP check whether the contents of a desired web page correspond to a certain given template. As soon as the Network Service object is created, it will be automatically included into the status poll. Each time when the status poll for the particular node is carried out, all Network Service objects are polled for a reply. If an object s reply corresponds to a certain condition, its status is set as NORMAL. If an object is not responding, its status will be hanged to CRITICAL. Wile network service creation there can be also created DCI that will collect service status. In default configuration request is done with help of Port Check subagent on the server node. If it should be done through different node is should be changed in it s properties after service creation by selecting Poller node. There is also possibility to set quantity of polls that is required to be sure that state have changed Service monitoring using DCI Second option is to use DCI to monitor service. There are 2 subagents that provide service monitoring metrics: PortCheck and NetSVC. It is recommended to use NetSVC for all curl supported protocols. As it can check not only availability, but also response. For unsupported protocols can be used Custom check of PortCheck subagent. For HTTP services there is also option to use ECS subagent. This subagent has only 3 Metrics. Two of them calculate hash and last one measure time Service monitoring 181
188 182 Chapter 15. Common monitoring tasks (rename this chapter!)
189 PortCheck configuration This subagent can be used to check TCP ports and specifically implements checks for common services. It is highly recommended to use netsvc subagent especially for HTTP and HTTPS monitoring. When loaded, PORTCHECK subagent adds the following Metrics to node Metric list: All of the ServiceCheck.* parameters return the following values: Value Description 0 Success, target was connected to an returned expected response. 1 Invalid arguments were passed. 2 Cannot connect to target. 3 Invalid / Unexpected response from target. All configuration parameters related to PORTCHECK subagent should be placed into *PORTCHECK section of agent s configuration file. The following configuration parameters are supported: Configuration example: Parameter Description ServiceCheck.Custom(target,port[,timeout]) timeout in milliseconds. This is a very simple test that does nothing more Check that TCP port is open on target. Optional argument timeout specifies than check the port is open. ServiceCheck.HTTP(target,[port],URI,hostHeader[,regex[,timeout]]) specifies the to connect with, otherwise 80 will be used. The URI is Check that HTTP service is running on target. Optional argument port NOT a URL it is the host header request URI. As an example to test URL enter hostheader is currently not used, but may be the Host option at some point in the request made. Optional argument regex is the regular expression to check returned from the request, otherwise ^HTTP/1.[01] 200.* will be used. Optional argument timeout specifies timeout in milliseconds. ServiceCheck.POP3(target,username,password[,timeout) using the supplied username and password. Optional argument timeout Check that POP3 service is running on target and that we are able to login specifies timeout in milliseconds. ServiceCheck.SMTP(target,toAddress[,timeout]) to toaddress. The will be from noreply@domainname using Check that SMTP service is running on target and that it will accept an the DomainName option in the config file or its default value (see below). Optional argument timeout specifies timeout in milliseconds. ServiceCheck.SSH(target[,port[,timeout]]) specifies the port to connect with, otherwise 22 will be used. Optional Check that SSH service is running on target. Optional argument port argument timeout specifies timeout in milliseconds. ServiceCheck.Telnet(target[,port[,timeout]]) specifies the port to connect with, otherwise 23 will be used. Optional Check that Telnet service is running on target. Optional argument port argument timeout specifies timeout in milliseconds. Parameter Domain- Name Timeout Format Description Default value string Set default domain name for processing. Currently this is only used by netxms.org SMTP check to set the from address. mil- Set response timeout to milliseconds lisec- onds # This sample nxagentd.conf instructs agent to: # 1. Load PORTCHECK subagent # 2. Set domain name for from to netxms.demo # 3. Default timeout for commands set to 5 seconds (5000 milliseconds) MasterServers = netxms.demo SubAgent = /usr/lib/libnsm_portcheck.so Service monitoring 183
190 *portcheck DomainName = netxms.demo Timeout = 5000 NetSVC configuration This subagent can be used to check network services supported by libcurl. More about syntaxes can be found there: This subagent will add this Metrics to node Metric list: Parameter Description Service.Check(,) ServiceCheck.Custom(target,port[,timeout]) timeout in milliseconds. This is a very simple test that does nothing more than Check that TCP port is open on target. Optional argument timeout specifies check the port is open. HTTP check example: Service.Check( 200.*) ^HTTP/1.[01] 200.* - this is default value and may be missed in expression. Note: If agent is build from sources, then libcurl-dev should be installed to build netsvc subagent. ECS This subagent works with HTTP only. It can be used to measure page load time and checking page hash. Request timeout for this subageint is 30 seconds. Parameter ECS.HttpSHA1(URL) ECS.HttpMD5(URL) ECS.HttpLoadTime(URL) MasterServers = netxms.demo Subagent = ecs.nsm Description Calculates SHA1 hash of provided URL Calculates MD5 hash of provided URL Measure load time for provided URL 15.5 Database monitoring There are created few specialized monitoring subagents: Oracle, DB2, MongoDB. Further will be described how to configure and use this subagents. Besides this there is opportunity to monitor also other types of databases supported by NetXMS server(link to supported database list) using database query suabgent as this databases support receiving performance parameters using queries. This subagent details are described in Application Database Monitoring chapter Oracle NetXMS subagent for Oracle DBMS monitoring (further referred to as Oracle subagent) monitors one or more instances of Oracle databases and reports various database-related parameters. All parameters available from Oracle subagent gathered or calculated once per minute thus it s recommended to set DCI poll interval for these items to 60 seconds or more. All parameters are obtained or derived from the data available in Oracle s data dictionary tables and views through regular select queries. Oracle subagent does not monitor any of the metrics related to lower level database layers, such as database processes. Monitoring of such parameters can be achieved through the standard NetXMS functionality. 184 Chapter 15. Common monitoring tasks (rename this chapter!)
191 Pre-requisites An Oracle user with the role select_catalog_role assigned. Required rights can be assigned to user with the following query: grant select_catalog_role to user; Where user is the user configured in Oracle subagent for database access. Configuration file Oracle subagent can be configured using XML configuration file (usually created as separate file in configuration include directory), or in simplified INI format, usually in main agent configuration file. XML configuration: You can specify multiple databases in the oracle section. Each database description must be surrounded by database tags with the id attribute. It can be any unique integer and instructs the Oracle subagent about the order in which database sections will be processed. Each database definition supports the following parameters: Parameter Id Name Username Password EncryptedPassword Description Database identifier. It will be used to address this database in parameters. Database TNS name or connection string. User name for connecting to database. Database user password. Database user password encrypted with nxencpasswd. Sample Oracle subagent configuration file in XML format: <config> <agent> <subagent>oracle.nsm</subagent> </agent> <oracle> <databases> <database id="1"> <id>db1</id> <tnsname>test</tnsname> <username>nxmonitor</username> <password>nxmonitor</password> </database> <database id="2"> <id>db2</id> <tnsname>prod</tnsname> <username>netxms</username> <password>password</password> </database> </databases> </oracle> </config> INI configuration: You can specify only one database when using INI configuration format. If you need to monitor multiple databases from same agent, you should use configuration file in XML format. ORACLE section can contain the following parameters: Database monitoring 185
192 Parameter Id Name Username Password EncryptedPassword Description Database identifier. It will be used to address this database in parameters. Database TNS name or connection string. User name for connecting to database. Database user password. Database user password encrypted with nxencpasswd. Sample Oracle subagent configuration file in INI format: *ORACLE ID = DB1 TNSName = TEST Username = NXMONITOR Password = NXMONITOR Parameters When loaded, Oracle subagent adds the following parameters to agent (all parameters requires database ID as first argument): Parameter Oracle.CriticalStats.AutoArchivingOff(dbid) Oracle.CriticalStats.DatafilesNeedMediaRecovery(dbid) Oracle.CriticalStats.DFOffCount(dbid) Oracle.CriticalStats.FailedJobs(dbid) Oracle.CriticalStats.FullSegmentsCount(dbid) Oracle.CriticalStats.RBSegsNotOnlineCount(dbid) Oracle.CriticalStats.TSOffCount(dbid) Oracle.Cursors.Count(dbid) Oracle.DataFile.AvgIoTime(dbid, datafile) Oracle.DataFile.Blocks(dbid, datafile) Oracle.DataFile.BlockSize(dbid, datafile) Oracle.DataFile.Bytes(dbid, datafile) Oracle.DataFile.FullName(dbid, datafile) Oracle.DataFile.MaxIoReadTime(dbid, datafile) Oracle.DataFile.MaxIoWriteTime(dbid, datafile) Oracle.DataFile.MinIoTime(dbid, datafile) Oracle.DataFile.PhysicalReads(dbid, datafile) Oracle.DataFile.PhysicalWrites(dbid, datafile) Oracle.DataFile.ReadTime(dbid, datafile) Oracle.DataFile.Status(dbid, datafile) Oracle.DataFile.Tablespace(dbid, datafile) Oracle.DataFile.WriteTime(dbid, datafile) Oracle.DBInfo.CreateDate(dbid) Oracle.DBInfo.IsReachable(dbid) Oracle.DBInfo.LogMode(dbid) Oracle.DBInfo.Name(dbid) Oracle.DBInfo.OpenMode(dbid) Oracle.DBInfo.Version(dbid) Oracle.Dual.ExcessRows(dbid) Oracle.Instance.ArchiverStatus(dbid) Oracle.Instance.Status(dbid) Oracle.Instance.ShutdownPending(dbid) Oracle.Instance.Version(dbid) Oracle.Objects.InvalidCount(dbid) Oracle.Performance.CacheHitRatio(dbid) Oracle.Performance.DictCacheHitRatio(dbid) Oracle.Performance.DispatcherWorkload(dbid) Description Archive logs enabled but auto archiving off (YES/NO) Number of datafiles that need media recovery Number of offline datafiles Number of failed jobs Number of segments that cannot extend Number of rollback segments not online Number of offline tablespaces Current number of opened cursors system-wide Average time spent on single I/O operation for datafile in milliseconds datafile size in blocks datafile block size datafile size in bytes datafile full name Maximum time spent on a single read for datafile in milliseconds Maximum time spent on a single write for datafile in milliseconds Minimum time spent on a single I/O operation for datafile in milliseco Total number of physical reads from datafile Total number of physical writes to datafile Total read time for datafile in milliseconds datafile status datafile tablespace Total write time for datafile in milliseconds Database creation date Database is reachable (YES/NO) Database log mode Database name Database open mode Database version Excessive rows in DUAL table Archiver status Database instance status Is shutdown pending (YES/NO) DBMS Version Number of invalid objects in DB Data buffer cache hit ratio Dictionary cache hit ratio Dispatcher workload (percentage) Continued on next pa 186 Chapter 15. Common monitoring tasks (rename this chapter!)
193 Table 15.1 continued from previous page Parameter Description Oracle.Performance.FreeSharedPool(dbid) Free space in shared pool (bytes) Oracle.Performance.Locks(dbid) Number of locks Oracle.Performance.LogicalReads(dbid) Number of logical reads Oracle.Performance.LibCacheHitRatio(dbid) Library cache hit ratio Oracle.Performance.MemorySortRatio(dbid) PGA memory sort ratio Oracle.Performance.PhysicalReads(dbid) Number of physical reads Oracle.Performance.PhysicalWrites(dbid) Number of physical writes Oracle.Performance.RollbackWaitRatio(dbid) Ratio of waits for requests to rollback segments Oracle.Sessions.Count(dbid) Number of sessions opened Oracle.Sessions.CountByProgram(dbid, program) Number of sessions opened by specific program Oracle.Sessions.CountBySchema(dbid, schema) Number of sessions opened with specific schema Oracle.Sessions.CountByUser(dbid, user) Number of sessions opened with specific Oracle user Oracle.TableSpace.BlockSize(dbid, tablespace) tablespace block size Oracle.TableSpace.DataFiles(dbid, tablespace) Number of datafiles in tablespace Oracle.TableSpace.FreeBytes(dbid, tablespace) Free bytes in tablespace Oracle.TableSpace.FreePct(dbid, tablespace) Free space percentage in tablespace Oracle.TableSpace.Logging(dbid, tablespace) tablespace logging mode Oracle.TableSpace.Status(dbid, tablespace) tablespace status Oracle.TableSpace.TotalBytes(dbid, tablespace) Total size in bytes of tablespace Oracle.TableSpace.Type(dbid, tablespace) tablespace type Oracle.TableSpace.UsedBytes(dbid, tablespace) Used bytes in tablespace Oracle.TableSpace.UsedPct(dbid, tablespace) Used space percentage in tablespace Lists When loaded, Oracle subagent adds the following lists to agent: List Description Oracle.DataFiles(dbid) All known datafiles in database identified by dbid. Oracle.DataTags(dbid) All data tags for database identified by dbid. Used only for internal diagnostics. Oracle.TableSpaces(dbid) All known tablespaces in database identified by dbid. Tables When loaded, Oracle subagent adds the following tables to agent: Table Description Oracle.DataFiles(dbid) Datafiles in database identified by dbid. Oracle.Sessions(dbid) Open sessions in database identified by dbid. Oracle.TableSpaces(dbid) Tablespaces in database identified by dbid DB2 NetXMS subagent for DB2 monitoring is designed to provide a way to extract various parameters known as Data Collection Items (DCI) from an instance or several instances of DB2 database. Configuration DB2 subagent can be configured in two ways. The first one would be a simple INI file and the second one would be an XML configuration file. Please note that to use the XML configuration, you first need to declare the XML file in the DB2 section of the INI configuration file. The details are below. The configuration section in INI file looks like the following: Database monitoring 187
194 SubAgent = db2.nsm *DB2 DBName = dbname DBAlias = dbalias UserName = dbuser Password = mypass123 QueryInterval = 60 ReconnectInterval = 30 Parameters: milliseconds milliseconds ReconnectInterval Parameter Format Description Default value DBName string The name of the database to connect to DBAlias string The alias of the database to connect to UserName string The name of the user for the database to connect to Password string The password for the database to connect to Encrypted- string The encrypted password for the database to connect to (use Password QueryInterval nxencpasswd for encryption) The interval to perform queries with 60 The interval to try to reconnect to the database if the connection was lost or could not be established XML configuration allows the monitoring of several database instances. To be able to use the XML configuration file, you first need to specify the file to use in the DB2 section of the INI file. The syntax is as follows: 30 SubAgent *DB2 ConfigFile = db2.nsm = /myhome/configs/db2.xml Parameter Format Description Default value ConfigFile string The path to the XML configuration file The XML configuration file itself should look like this: <config> <db2sub> <db2 id="1"> <dbname>dbname</dbname> <dbalias>dbalias</dbalias> <username>dbuser</username> <password>mypass123</password> <queryinterval>60</queryinterval> <reconnectinterval>30</reconnectinterval> </db2> <db2 id="2"> <dbname>dbname1</dbname> <dbalias>dbalias1</dbalias> <username>dbuser1</username> <password>mypass456</password> <queryinterval>60</queryinterval> <reconnectinterval>30</reconnectinterval> </db2> </db2sub> </config> As you can see, the parameters are the same as the ones from the INI configuration. Each database declaration 188 Chapter 15. Common monitoring tasks (rename this chapter!)
195 must be placed in the db2sub tag and enclosed in the db2 tag. The db2 tag must have a numerical id which has to be a positive integer greater than 0. Provided parameters To get a DCI from the subagent, you need to specify the id from the db2 entry in the XML configuration file (in case of INI configuration, the id will be 1). To specify the id, you need to add it enclosed in brackets to the name of the parameter that is being requested (e.g., db2.parameter.to.request(**1**)). In the example, the parameter db2.parameter.to.request from the database with the id 1 will be returned. Parameter Arguments Return type Description DB2.Instance.Version(*) Database id DCI_DT_STRING DBMS version DB2.Table.Available(*) Database id DCI_DT_INT The number of available tables DB2.Table.Unavailable(*) Database id DCI_DT_INT The number of unavailable tables DB2.Table.Data.LogicalSize(*) Database id DCI_DT_INT64 Data object logical size in kilobytes DB2.Table.Data.PhysicalSize(*) Database id DCI_DT_INT64 Data object physical size in kilobytes DB2.Table.Index.LogicalSize(*) Database id DCI_DT_INT64 Index object logical size in kilobytes DB2.Table.Index.PhysicalSize(*) Database id DCI_DT_INT64 Index object physical size in kilobyte DB2.Table.Long.LogicalSize(*) Database id DCI_DT_INT64 Long object logical size in kilobytes DB2.Table.Long.PhysicalSize(*) Database id DCI_DT_INT64 Long object physical size in kilobyte DB2.Table.Lob.LogicalSize(*) Database id DCI_DT_INT64 LOB object logical size in kilobytes DB2.Table.Lob.PhysicalSize(*) Database id DCI_DT_INT64 LOB object physical size in kilobytes DB2.Table.Xml.LogicalSize(*) Database id DCI_DT_INT64 XML object logical size in kilobytes DB2.Table.Xml.PhysicalSize(*) Database id DCI_DT_INT64 XML object physical size in kilobyte DB2.Table.Index.Type1(*) Database id DCI_DT_INT The number of tables using type-1 in DB2.Table.Index.Type2(*) Database id DCI_DT_INT The number of tables using type-2 in DB2.Table.Reorg.Pending(*) Database id DCI_DT_INT The number of tables pending reorga DB2.Table.Reorg.Aborted(*) Database id DCI_DT_INT The number of tables in aborted reorg DB2.Table.Reorg.Executing(*) Database id DCI_DT_INT The number of tables in executing re DB2.Table.Reorg.Null(*) Database id DCI_DT_INT The number of tables in null reorgani DB2.Table.Reorg.Paused(*) Database id DCI_DT_INT The number of tables in paused reorg DB2.Table.Reorg.Alters(*) Database id DCI_DT_INT The number of reorg recommend alte DB2.Table.Load.InProgress(*) Database id DCI_DT_INT The number of tables with load in pro DB2.Table.Load.Pending(*) Database id DCI_DT_INT The number of tables with load pend DB2.Table.Load.Null(*) Database id DCI_DT_INT The number of tables with load statu DB2.Table.Readonly(*) Database id DCI_DT_INT The number of tables in Read Access DB2.Table.NoLoadRestart(*) Database id DCI_DT_INT The number of tables in a state that w DB2.Table.Index.Rebuild(*) Database id DCI_DT_INT The number of tables with indexes th DB2.Table.Rid.Large(*) Database id DCI_DT_INT The number of tables that use large r DB2.Table.Rid.Usual(*) Database id DCI_DT_INT The number of tables that don t use l DB2.Table.Rid.Pending(*) Database id DCI_DT_INT The number of tables that use large r DB2.Table.Slot.Large(*) Database id DCI_DT_INT The number of tables that use large s DB2.Table.Slot.Usual(*) Database id DCI_DT_INT The number of tables that don t use l DB2.Table.Slot.Pending(*) Database id DCI_DT_INT The number of tables that use large s DB2.Table.DictSize(* Database id DCI_DT_INT64 Size of the dictionary in bytes DB2.Table.Scans(*) Database id DCI_DT_INT64 The number of scans on all tables DB2.Table.Row.Read(*) Database id DCI_DT_INT64 The number of reads on all tables DB2.Table.Row.Inserted(*) Database id DCI_DT_INT64 The number of insertions attempted o DB2.Table.Row.Updated(*) Database id DCI_DT_INT64 The number of updates attempted on DB2.Table.Row.Deleted(*) Database id DCI_DT_INT64 The number of deletes attempted on DB2.Table.Overflow.Accesses(*) Database id DCI_DT_INT64 The number of r/w operations on ove DB2.Table.Overflow.Creates(*) Database id DCI_DT_INT64 The number of overflowed rows crea DB2.Table.Reorg.Page(*) Database id DCI_DT_INT64 The number of page reorganizations DB2.Table.Data.LogicalPages(*) Database id DCI_DT_INT64 The number of logical pages used on DB2.Table.Lob.LogicalPages(*) Database id DCI_DT_INT64 The number of logical pages used on DB2.Table.Long.LogicalPages(*) Database id DCI_DT_INT64 The number of logical pages used on DB2.Table.Index.LogicalPages(*) Database id DCI_DT_INT64 The number of logical pages used on Database monitoring 189
196 Table 15.2 conti Parameter Arguments Return type Description DB2.Table.Xda.LogicalPages(*) Database id DCI_DT_INT64 The number of logical pages used on DB2.Table.Row.NoChange(*) Database id DCI_DT_INT64 The number of row updates that yield DB2.Table.Lock.WaitTime(*) Database id DCI_DT_INT64 The total elapsed time spent waiting DB2.Table.Lock.WaitTimeGlob(*) Database id DCI_DT_INT64 The total elapsed time spent on globa DB2.Table.Lock.Waits(*) Database id DCI_DT_INT64 The total amount of locks occurred DB2.Table.Lock.WaitsGlob(*) Database id DCI_DT_INT64 The total amount of global locks occ DB2.Table.Lock.EscalsGlob(*) Database id DCI_DT_INT64 The number of lock escalations on a DB2.Table.Data.Sharing.Shared(*) Database id DCI_DT_INT The number of fully shared tables DB2.Table.Data.Sharing.BecomingShared(*) Database id DCI_DT_INT The number of tables being in the pro DB2.Table.Data.Sharing.NotShared(*) Database id DCI_DT_INT The number of tables not being share DB2.Table.Data.Sharing.BecomingNotShared(*) Database id DCI_DT_INT The number of tables being in the pro DB2.Table.Data.Sharing.RemoteLockWaitCount(*) Database id DCI_DT_INT64 The number of exits from the NOT_S DB2.Table.Data.Sharing.RemoteLockWaitTime(*) Database id DCI_DT_INT64 The time spent on waiting for a table DB2.Table.DirectWrites(*) Database id DCI_DT_INT64 The number of write operations that DB2.Table.DirectWriteReqs(*) Database id DCI_DT_INT64 The number of request to perform a d DB2.Table.DirectRead(*) Database id DCI_DT_INT64 The number of read operations that d DB2.Table.DirectReadReqs(*) Database id DCI_DT_INT64 The number of request to perform a d DB2.Table.Data.LogicalReads(*) Database id DCI_DT_INT64 The number of data pages that are log DB2.Table.Data.PhysicalReads(*) Database id DCI_DT_INT64 The number of data pages that are ph DB2.Table.Data.Gbp.LogicalReads(*) Database id DCI_DT_INT64 The number of times that a group buf DB2.Table.Data.Gbp.PhysicalReads(*) Database id DCI_DT_INT64 The number of times that a group buf DB2.Table.Data.Gbp.InvalidPages(*) Database id DCI_DT_INT64 The number of times that a group buf DB2.Table.Data.Lbp.PagesFound(*) Database id DCI_DT_INT64 The number of times that a data page DB2.Table.Data.Lbp.IndepPagesFound(*) Database id DCI_DT_INT64 The number of group buffer pool (GB DB2.Table.Xda.LogicalReads(*) Database id DCI_DT_INT64 The number of data pages for XML s DB2.Table.Xda.PhysicalReads(*) Database id DCI_DT_INT64 The number of data pages for XML s DB2.Table.Xda.Gbp.LogicalReads(*) Database id DCI_DT_INT64 The number of times that a data page DB2.Table.Xda.Gbp.PhysicalReads(*) Database id DCI_DT_INT64 The number of times that a group buf DB2.Table.Xda.Gbp.InvalidPages(*) Database id DCI_DT_INT64 The number of times that a page for a DB2.Table.Xda.Lbp.PagesFound(*) Database id DCI_DT_INT64 The number of times that an XML st DB2.Table.Xda.Gbp.IndepPagesFound(*) Database id DCI_DT_INT64 The number of group buffer pool (GB DB2.Table.DictNum(*) Database id DCI_DT_INT64 The number of page-level compressio DB2.Table.StatsRowsModified(*) Database id DCI_DT_INT64 The number of rows modified since t DB2.Table.ColObjectLogicalPages(*) Database id DCI_DT_INT64 The number of logical pages used on DB2.Table.Organization.Rows(*) Database id DCI_DT_INT The number of tables with row-organ DB2.Table.Organization.Cols(*) Database id DCI_DT_INT The number of tables with column-or DB2.Table.Col.LogicalReads(*) Database id DCI_DT_INT The number of column-organized pag DB2.Table.Col.PhysicalReads(*) Database id DCI_DT_INT The number of column-organized pag DB2.Table.Col.Gbp.LogicalReads(*) Database id DCI_DT_INT The number of times that a group buf DB2.Table.Col.Gbp.PhysicalReads(*) Database id DCI_DT_INT The number of times that a group buf DB2.Table.Col.Gbp.InvalidPages(*) Database id DCI_DT_INT The number of times that a column-o DB2.Table.Col.Lbp.PagesFound(*) Database id DCI_DT_INT The number of times that a column-o DB2.Table.Col.Gbp.IndepPagesFound(*) Database id DCI_DT_INT The number of group buffer pool (GB DB2.Table.ColsReferenced(*) Database id DCI_DT_INT The number of columns referenced d DB2.Table.SectionExecutions(*) Database id DCI_DT_INT The number of section executions tha MongoDB New in version 2.0-M3. NetXMS subagent for MongoDB monitoring. Monitors one or more instances of MongoDB databases and reports various database-related parameters. All parameters available from MongoDB subagent gathered or calculated once per minute thus it s recommended to set DCI poll interval for these items to 60 seconds or more. It is supposed that by one agent will be monitored databases with same version. 190 Chapter 15. Common monitoring tasks (rename this chapter!)
197 Building mongodb subagent Use with-mongodb=/path/to/mongoc driver parameter to include MongoDB subagent in build. Was tested with mongo-c-driver Agent Start While start of subagent at least one database should be up and running. Otherwise subagent will not start. On start subagent requests serverstatus to get list of possible DCI. This list may vary from version to version of MongoDB. Configuration file Parameters There are 2 types of parameters: serverstatus parameters, that are generated form response on a subagent start and predefined for database status. Description of serverstatus parameters can be found there: serverstatus. In this type of DCI should be given id of server from where parameter should be taken. Description of database status parameters can be found there: dbstats. Parameter Description MongoDB.collectionsNum(id,databaseName) Contains a count of the number of collections in that database. MongoDB.objectsNum(id,databaseName) database across all collections. Contains a count of the number of objects (i.e. documents) in the MongoDB.avgObjSize(id,databaseName) The average size of each document in bytes. MongoDB.dataSize(id,databaseName) padding factor. The total size in bytes of the data held in this database including the MongoDB.storageSize(id,databaseName) database for document storage. The total amount of space in bytes allocated to collections in this MongoDB.numExtents(id,databaseName) collections. Contains a count of the number of extents in the database across all MongoDB.indexesNum(id,databaseName) the database. Contains a count of the total number of indexes across all collections in MongoDB.indexSize(id,databaseName) The total size in bytes of all indexes created on this database. MongoDB.fileSize(id,databaseName) The total size in bytes of the data files that hold the database. MongoDB.nsSizeMB(id,databaseName) The total size of the namespace files (i.e. that end with.ns) for this database. List Parameter MongoDB.ListDatabases(id) Description Returns list of databases existing on this server 15.6 Application monitoring Process monitoring Platform subagents support process monitoring. Process metrics have Process.* format. Metrics differ between different OS. Detailed description of each metric can be found in List of supported metrics Application monitoring 191
198 Application Database Monitoring For application database monitoring can be used database monitoring subagents or database query subagents. Information about database monitoring subagents can be found there. In this chapter will be described only DBQuery subagents usage and configuration. This subagent supports all databases that are supported by NetXMS server link to supported database list. This type of Metrics provide DBQuery subagent. This subagent has 2 types of Metrics: one that periodically executes SQL queries and returns results and error codes as Metric parameters and second execute queries by Metric request(synchronously). SQL queries are specified in the agent configuration. Background query can be also executed per request. Synchronously executed query can have parameters that are passes to it by DCI configuration. New in version 2.5: Synchronously executed queries For time consuming SQL requests it is highly recommended to use background execution. Heavy SQL can cause request timeout for synchronous execution. Parameters When loaded, DBQuery subagent adds the following parameters to agent: Parameter Description DB.Query(dbid,query) Result of immediate execution of the query query in database identified by dbid. Database with given name must be defined in configuration file. DB.QueryResult(name) Last result of execution of the query name. Query with given name must be defined in configuration file. DB.QueryStatus(name) Status of last execution of the query name. Query with given name must be defined in configuration file. Value returned is native SQL error code. DB.QueryStatusText(name) of last execution of the query name as a text. Query with given name must be defined in configuration file. queryname Result of immediate execution of query defined in agent config file with name queryname. query- Result of immediate execution of query defined in agent config file with name queryname Name(param1, like ConfigurableQuery parameter. Where param1, param2... are parameters to bind into param2...) defined query. Tables When loaded, DBQuery subagent adds the following tables to agent: Table Description DB.Query(dbid,query) Result of immediate execution of the query query in database identified by dbid. Database with given name must be defined in configuration file. DB.QueryResult(name) Last result of execution of the query name. Query with given name must be defined in configuration file. queryname Result of immediate execution of query defined in agent config file with name queryname. query- Result of immediate execution of query defined in agent config file with name queryname Name(param1, like ConfigurableQuery parameter. Where param1, param2... are parameters to bind into param2...) defined query. Configuration file All configuration parameters related to DBQuery subagent should be placed into *DBQUERY section of agent s configuration file. The following configuration parameters are supported: 192 Chapter 15. Common monitoring tasks (rename this chapter!)
199 Parameter Format Description Database semicolon separated option list Define new database connection (See database connection options section below). Query name:dbid:interval:query Define new query. This parameter can be specified multiple times to define multiple queries. Fields in query definition have the following meaning: name Query name which will be used in parameters to retrieve collected data. dbid Database ID (defined by Database parameter) interval Polling interval in seconds. query SQL query to be executed. Database connection options Status optional mandatory optional mandatory optional optional optional Name dbname driver encrypted- Password id login password server ConfigurableQuery name:dbid:description:query Define new query. This parameter can be specified multiple times to define multiple queries. Fields in query definition have the following meaning: name Query name which will be used in parameters to retrieve collected data. dbid Database ID (defined by Database parameter) description Description that will be shown in agents parameter description. query SQL query to be executed. Description Database name. Database driver name. Available drivers are: - db2.ddr - informix.ddr - mssql.ddr - mysql.ddr - odbc.ddr - oracle.ddr - pgsql.ddr - sqlite.ddr Database password in encrypted form (use nxencpasswd command line tool to encrypt passwords). This option takes precedence over password option. Database connection ID which will be used to identify this connection in configuration and parameters. Login name. Database password in clear text form. Database server name or IP address Application monitoring 193
200 Configuration Example # This sample nxagentd.conf instructs agent to: # 1. load DBQuery subagent # 2. Define two databases - db1 (Oracle) and db2 (MySQL). # 3. Execute query "SELECT f1 FROM table1" in database db1 every 60 seconds # 4. Execute query "SELECT f1 FROM table2 WHERE f2 LIKE ':%'" on DSN2 every 15 seconds MasterServers = netxms.demo SubAgent = dbquery.nsm *DBQUERY Database = id=db1;driver=oracle.ddr;server= ;login=netxms;encryptedpassword=h02kxyckadxcpgp Database = id=db2;driver=mysql.ddr;server= ;dbname=test_db;login=netxms;password=netxms1 Query = query1:db1:60:select f1 FROM table1 Query = query2:db2:15:select f1 FROM table2 WHERE f2 LIKE ':%' ConfigurableQuery = query3:db2:comment in param:select name FROM images WHERE name like? Log monitoring Application logs can be added to monitoring. For log monitoring configuration refer to Log monitoring chapter External Metrics It is possible to define External metrics that will get metric data from the script that is executed on the agent. This option can be used to get status from some command line tools or from self made scripts. Information about options and configuration is available in Agent External Metrics chapter ICMP ping This subagent can be used to measure ICMP ping response times from one location to another Metrics When loaded, PING subagent adds the following parameters to agent: 194 Chapter 15. Common monitoring tasks (rename this chapter!)
201 Parameter Description Icmp.AvgPingTime(target) Average ICMP ping response time from target for last minute. Argument target can be either IP address or name specified in Target configuration record (see below). Icmp.LastPingTime(target) ICMP ping response time from target. Argument target can be either IP address or name specified in Target configuration record (see below). Icmp.PacketLoss(target) ICMP ping packet loss (in percents) for target. Argument target can be either IP address or name specified in Target configuration record (see below). Icmp.Ping(target,*timeout*,*psize*) ICMP ping response time from target. Agent will send echo request as soon as it receives request for paramter s value, and will return response time for that particular request. Argument target should be an IP address. Optional argument timeout specifies timeout in milliseconds. Default timeout is 1 second. Optional argument psize specifies packet size in bytes, including IP header. If this argument is omited, value from DefaultPacketSize configuration parameter will be used. Please note that other parameters just returns result of background ping process, while this parameter waits for actual ping completion and then returns the result. Because of this behavior, it is not recommended to use Icmp.Ping parameter for instant monitoring, only for occasional tests. For instant monitoring, you should configure targets for background ping and use Icmp.AvgPingTime or Icmp.LastPingTime parameters to retrieve results. Icmp.PingStdDev(target) [ Standard deviation] of ICMP ping response time for target. Argument target can be either IP address or name specified in Target configuration record (see below) Metric Lists List Description Icmp.TargetList of configured ping targets. Each line has the following fields, separated by spaces: * IP address * Last response time (milliseconds) * Average response time (milliseconds) * Packet loss (percents) * Configured packet size * Name Configuration file All configuration parameters related to PING subagent should be placed into *PING section of agent s configuration file. The following configuration parameters are supported: Timeout Configuration example: Description bytes Set default packet size to bytes. 46 Default value Default- Packet- Size PacketRate Target packets below or above will be adjusted automatically. Set ping packet rate per minute. Allowed values are from 1 to 60 and values ip:name:psize Add target with IP address ip to background ping target list and assign an optional name name to it. Target will be pinged using packets of psize bytes size. Name and packet size fields are optional and can be omited. This parameter can be given multiple times to add multiple targets. mil- Set response timeout to milliseconds. Allowed values are from 500 to 5000 lisec- onds and values below or above will be adjusted automatically. Parameter Format # This sample nxagentd.conf instructs agent to: # 1. load PING subagent # 2. Ping target with default size (46 bytes) packets and with 1000 bytes pack # 3. Timeout for ping set to 1 second and pings are sent 12 times per minute (each 5 seconds) MasterServers = netxms.demo 4 none ICMP ping 195
202 SubAgent = ping.nsm *PING Timeout = 1000 PacketRate = 12 Target = :target_1 Target = :target_2:1000 Note: PING subagent uses value of to indicate timed out requests Monitoring hardware(sensors) NetXMS has subagents that allow to monitor hardware sensors. lm-sensors - Can collect data from all sensors that are supported by lm-sensors drivers on Luinux. DS18x20 - This subagent collects temperature data form ds18x20 sensors. Linux only. RPI - This subagent is created for Raspberry Pi. It can collect data from dht22 sensor and get status of any GPO pin lm-sensors This subagent can be used to read hardware status using lm_sensors package. Pre-requisites Package lm_sensors should be installed and configured properly. Output of sensors command should produce meaningful output (see example below). alk@b08s02ur:~$ sensors w83627dhg-isa-0290 Adapter: ISA adapter Vcore: V (min = V, max = V) in1: V (min = V, max = V) ALARM AVCC: V (min = V, max = V) VCC: V (min = V, max = V) in4: V (min = V, max = V) ALARM in5: V (min = V, max = V) in6: V (min = V, max = V) ALARM 3VSB: V (min = V, max = V) Vbat: V (min = V, max = V) fan1: 3308 RPM (min = 1188 RPM, div = 8) fan2: 6250 RPM (min = RPM, div = 8) ALARM fan3: 0 RPM (min = 5273 RPM, div = 128) ALARM fan4: 0 RPM (min = RPM, div = 128) ALARM fan5: 0 RPM (min = RPM, div = 128) ALARM temp1: C (high = +4.0 C, hyst = +1.0 C) ALARM sensor = diode temp2: C (high = C, hyst = C) sensor = diode temp3: C (high = C, hyst = C) ALARM sensor = thermistor cpu0_vid: V coretemp-isa-0000 Adapter: ISA adapter Core 0: C (high = C, crit = C) coretemp-isa Chapter 15. Common monitoring tasks (rename this chapter!)
203 Adapter: ISA adapter Core 1: C (high = C, crit = C) Parameters When loaded, lm_sensors subagent adds the following parameters: Parameter Description LMSensors.Value(chip, label) Current value returned by hardware sensor Configuration file All configuration parameters related to lm_sensors subagent should be placed into *LMSENSORS section of agent s configuration file. The following configuration parameters are supported: Parameter Use- Fahrenheit Config- File Format Description Boolean If set to yes, all temperature reading will be converted to Fahrenheit Default value String Path to sensors.conf none, use system default (usually /etc/sensors3.conf) no Configuration example MasterServers = netxms.demo SubAgent = lmsensors.nsm *LMSENSORS UseFahrenheit = yes ConfigFile = /etc/sensors.netxms.conf Sample usage (based on output of sensors from Pre-requisites section) alk@b08s02ur:~$ nxget netxms.demo 'LMSensors.Value(coretemp-isa-0001,Core 1)' alk@b08s02ur:~$ nxget netxms.demo 'LMSensors.Value(w83627dhg-isa-0290,AVCC)' DS18x20 This subagent collects temperature from DS18x20 sensor. Subagent available for Linux only. To use this subagent 1-Wire driver should be installed. Parameters Parameter Type Meaning Sensor.Temperature(*) Float Sensor temperature Monitoring hardware(sensors) 197
204 Configuration file All configuration parameters related to lm_sensors subagent should be placed into *DS18X20 section of agent s configuration file. The following configuration parameters are supported: Parameter Format Description Sensor String Sensor identification in format sensorname:uniqueid Configuration example MasterServers = netxms.demo SubAgent = DS18X20.nsm *DS18X20 Sensor = sensorname:uiniqueid RPI This subagent collects data from Raspberry Pi dht22 sensor and status of GPO pins. Parameters Parameter Type Meaning GPIO.PinState(pinNumber) Integer State of pin with given number. This pin number should be enabled in agent configuration file. Sensors.Humidity Integer Sensors data for humidity Sensors.Temperature Integer Sensors data for temperature Configuration file All configuration parameters related to lm_sensors subagent should be placed into *RPI section of agent s configuration file. The following configuration parameters are supported: Parameter Format Description DisableDHT22 Boolean Disables dht22 sensor if yes. By default no. EnabledPins Coma separated list of numbers List of pins that are enabled for status check. Configuration example MasterServers = netxms.demo SubAgent = rpi.nsm *RPI DisableDHT22 = no EnabledPins = 1,4,5, UPS monitoring There are two options to monitor UPS: first is through USB or serial connection with help of subagent and second one is through the network with help of SNMP. 198 Chapter 15. Common monitoring tasks (rename this chapter!)
205 Subagent can be used for monitoring UPS (Uninterruptible Power Supply) attached to serial or USB port on computer where NetXMS agent is running. USB-attached devices currently supported only on Windows platform, serial is supported on all platforms. One subagent can monitor multiple attached devices USB or serial UPS monitoring You can monitor UPS devices attached to the hosts via serial cable or USB via UPS subagent. Once you have your UPS attached to the host and NetXMS agent installed, you should configure UPS subagent. First, add the following line to agent s configuration file main section: SubAgent = ups.nsm Second, configure attached UPS devices. Create UPS section, and for each UPS device attached to the host add line in the following format: Device = id:port:protocol where id is a number in range which will be used in requests to identify device; port is a communication port for serial connection or UPS serial number for USB connection; and protocol is a communication protocol used by connected device. Protocol can be either APC (for APC devices), BCMXCP (for devices using BCM/XCP protocol for example, HP, Compaq, or PowerWare devices), or USB for USB-attached devices. Below is an example of UPS configuration section for two devices attached via serial ports, one is APC device (configured as device 0) and one is HP device (configured as device 1): # UPS subagent configuration section *UPS Device = 0:/dev/ttyS0:APC Device = 1:/dev/ttyS1:BCMXCP Once UPS subagent is configured, you can start to monitor UPS devices status via parameters provided by it: UPS monitoring 199
206 Parameter Type Meaning UPS.BatteryLevel(*) Integer Battery charge level in percents. UPS.BatteryVoltage(*) Float Current battery voltage. UPS.ConnectionStatus(* Integer Connection status between agent and device. Can 0 - Agent is communication with the device 1 - Comunication with the device has been lost UPS.EstimatedRuntime(*) Integer Estimated on-battery runtime in minutes. UPS.Firmware(*) String Device s firmware version. UPS.InputVoltage(*) Float Input line voltage. UPS.LineFrequency(*) Integer Input line frequency in Hz. UPS.Load(*) Integer Device load in percents. UPS.MfgDate(*) String Device manufacturing date. UPS.Model(*) String Device model name. UPS.NominalBatteryVoltage(*) Float Nominal battery voltage. UPS.OnlineStatus(*) Integer Device online status. Can have the following valu 0 - Device is online. 1 - Device is on battery power. 2 - Device is on battery power and battery level is low. UPS.OutputVoltage(*) Float Output line voltage. UPS.SerialNumber(*) String Device s serial number. UPS.Temperature(*) Integer Internal device temperature. Please note that not all parameters supported by all UPS devices. Many old or simple models will support only basic things like UPS.OnlineStatus parameter. Most typical approach is to monitor UPS.OnlineStatus for going to 1 or 2, and then send notifications to administrators and shutdown affected hosts if needed. You can also monitor UPS.EstimatedRuntime parameter for the same purposes if your devices support it. Simple Scenario Consider the following simple scenario: you have two servers, Node_A and Node_B, connected to one UPS device. UPS device is APC Smart UPS 1700, connected with serial cable to Node_A on first COM port. Both nodes are running Windows operating system. You need to notify administrator if UPS goes to battery power, and shutdown both nodes in case of low battery condition. We assume that both nodes have NetXMS agent installed. To accomplish this, do the following: Step 1. Configure UPS monitoring subagent on Node_A. Add the following line to main agent s config section: SubAgent = ups.nsm At the end of configuration file, create UPS subagent configuration section: # UPS subagent configuration section *UPS Device = 0:"COM1:":APC 200 Chapter 15. Common monitoring tasks (rename this chapter!)
207 SNMP UPS monitoring Other option to monitor UPS is using SNMP. NetXMS already includes MIBs for some UPS, like APC UPS and standard UPS MIB. Description for possible OIDs and some additional information for APC UPS configuration can be found on a NetXMS wiki. Please check Import MIB for MIB loadding and DCI configuration for metric collection Cluster monitoring Monitoring mobile devices NetXMS has mobile agent for Android devices running version 2.2. and later. Currently, a very limited set of info can be monitored and reported to a NetXMS server Metrics Unlike other metrics mobile ones are provided with Internal origin as they are not collected by server, but pushed from mobile agent. Parameter MobileDevice.BattaryLevel MobileDevice.DeviceId MobileDevice.LastReportTime MobileDevice.Model MobileDevice.OS.Name MobileDevice.OS.Version MobileDevice.SerialNumber MobileDevice.UsedId MobileDevice.Vendor Description Battery charging level in percents. Id of device Last time device reported data Phone model Operating system mane Operating system version Serial number Mobile device vendor GUI Main Window Sections: 1. Agent status. In case agent is active, reports the basic info about configuration such as scheduler for new location acquisition and connection to server where to update info collected. 2. Last location section reports info about the last location acquired (date/time, source provider, geo coordinates and estimated accuracy Cluster monitoring 201
208 3. Last connection section reports info about the status of last connection: date/time and status of connection to the server:port specified in the configuration section. In case of errors during connection, here is reported also the error message. 4. Next connection section reports info about the next scheduled connection. 5. Device ID section reports the device ID (IMEI in case of devices with phone). 6. Device Serial section reports the device serial number. Main menu Reconnect: select this item to force a reconnection to the server to send new collected data. Disconnect & Exit: select this item to stop the agent and exit from the app. Settings: select this item to configure the agent. Settings This section is used to configure the behaviour of the agent. Global settings Activate agent: when set makes the agent operational. Autostart on boot: automatically starts the agent on boot (to be effective, agent must be set to be active). Scheduler: provides the ability to define a one range daily on which the agent is operational. Out of the specified ran 1. Daily activation on: start time for daily activation. 2. Daily activation off : stop time for daily activation. Connection Parameters: allows selecting the parameters used to connect to the server: 1. Server: address of the server (IP or name). 2. Port: port of the server (default 4747). 3. User name: username to connect to the server. 4. Password: password to connect to the server. 5. Encrypt connection: when selected challenges an encryption strategy with the server (depending on supported/configured providers). Frequency: amount of time, in minutes, that has to elapse between each tentative of connection to the server to send the gathered info. Override frequency: when selected overrides the previous frequency values and forces a new connection to the server (thus resetting the timer) every time a new connection is detected. NB if you are in a situation where connection is not stable it is advised to clear this flag to avoid multiple connections that will drain the battery. 202 Chapter 15. Common monitoring tasks (rename this chapter!)
209 Location Force position update: when cleared instruct the agent to relay on position updates made from other apps in the system (this means that position can be very old if no other apps are trying to get a new fix). When set, instructs the agent to try to gather a new position. Frequency (min): amount of time, in minutes, that has to elapse before trying to acquire a new position (Force position update set) or before trying to check if someone else updated a position. Duration (min): maximum amount of time, in minutes, that has to elapse before giving up on acquiring a new position. Location strategy: allows selecting the source provider that has to be used to acquire a new position, allowed providers 1. Network only: tries to acquire position from network provider. Network provider is usually fast in acquiring a new position but it is not much accurate, especially using data connection (range from 1Km to 2Km, depending on antennas deployment), the service is not available all around the world. Wi-Fi connection seems to guarantee much higher precision due to a correlation between last known position acquired from GPS. 2. GPS only: tries to acquire position from GPS provider. GPS provider is usually slow in acquiring a new position, time depends on several factors such as how much time has elapsed since last position, number of satellites in free view (inside buildings can be really had to get a position). 3. Network and GPS: tries to acquire a position from Network provider or GPS provider, the first one that gives a position is considered ok. There is no special algorithm to evaluate accuracy, the unique criteria is the speed of the fix. Note: Please note that on 2G networks (GPRS/EDGE) data connection is not available while you are busy in a conversation, position acquisition will fail. On 3G networks (UMTS/HSxPA) data connection is available and so the position acquisition. However, if the agent is not able to get a new fix within the time-frame specified, it will try to gather a position from any available provider that has a valid cached position to provide. Notification Toast notification: when set allows the agent to display toast notifications to the user (such as pushing data to the server, inform user about the start of the agent, etc.) Monitoring mobile devices 203
210 204 Chapter 15. Common monitoring tasks (rename this chapter!)

211 CHAPTER SIXTEEN NETWORK TOPOLOGY 16.1 Introduction NetXMS server automatically creates and maintains network model on different layers. All necessary information taken from ARP cache, routing tables, and switch forwarding database of managed nodes. Topology data provided by CDP, LLDP, and NDP (SONMP) protocols also used in building network model. Having network model instantly available allows NetXMS users to perform various network topology tasks much faster and easier How topology information built 16.3 Find where node is connected It is possible to find switch port where any given node is connected (sometimes called connection point in management console). To find out node s connection point, right-click on node object, and select Find switch port in pop-up menu. Message box with search results will pop up, and if port is found, search results view will be opened (or updated if already open). Search results view looks like this: Columns have the following meaning: 205
212 Seq. Search result sequence number Node Name of end node object In- Name of node s interface object ter- face MAC Interface s MAC address IP Interface s IP address Switch Name of switch node object Port Name of interface object representing switch port Type Connection type - direct or indirect. Direct connection type means that NetXMS server did not detect any other devices on sdame switch port, and most likely end node connected directly to the switch. Indirect means that some other devices was detected on same switch port. Virtual machines and virtual machine host will always be detected as indirect Find MAC address It is possible to find location of any known MAC address in the network. To do this, select Tools Find MAC address. Results of a search will be displayed in the same results view. It is not necessary that node with given MAC address be managed by NetXMS server, but if it is, appropriate details will be displayed Find IP address It is possible to find location of any known IP address in the network. To do this, select Tools Find IP address. Results of a search will be displayed in the same results view. It is not necessary that node with given IP address be managed by NetXMS server, but if it is, appropriate details will be displayed. 206 Chapter 16. Network topology
213 CHAPTER SEVENTEEN BUSINESS SERVICES AND SLA 17.1 Introduction In a nutshell, Business Services is a tool for availability monitoring of logical services. Company , web site, server farm, call center - all are examples of logical services. Moreover, the services can be combined together to define a broader logical service. Company , web site, name server and firewall all can be referred to as Company Internet Services and monitored for availability as a whole. So if the name server goes down then the Company Internet Services do not function properly as a whole. This feature can be used both for internal QA and external Service Level Agreement (SLA) monitoring Services, node links, service checks Service Business Services represented with a tree-like hierarchy of nested logical services, nodes and service checks. One can think of a service as a container consisting of other services, service checks and nodes linked to service checks. In NetXMS terminology the last is called node link. For each service in the hierarchy, NetXMS calculates availability percentage and keeps track of all downtime cases. To check availability at any particular level, select it in the Object Browser or choose Availability Chart from the context menu Node link Node link is a reference to any node with one or more service checks attached to this node Service check Service check is a test whose result is used to define the state of the service. A service check may belong to the specific node (node link) or directly to the service. A service check object contains NXSL script which either returns success (the test result ok) or failure (the service has failed). There are the following special variables and constants which can be used in NXSL scripts for service checks: $node - points to the current node the check is being executed for $reason - the script may set the reason of failure OK - constant, indicates success FAIL - constant, indicates failure 207

214 Service check templates To avoid redefinition of the same service check multiple times (for multiple nodes) you can create service check templates. The principle behind service check template is very similar to Templates. There are two notable differences though: A service check template is always applied automatically to every new node (node link) added to the service A service check template is applied to nodes in the current level in the service tree and in all levels below 17.3 Configuration and usage For both configuration and monitoring use Business Service container in the Object Browser view. Figure 17.1: Object Browser with Services Configuration To define a new service select Create business service from the context menu in Object Browser and enter the service name. Then under newly created service you may want to define other services, checks or node links. You can examine or alter properties of the service. If your service check relies on specific nodes then you need to create node links by selecting Create node link from the context menu: One or more service checks must be defined for every node link. Service check can be also defined at a business service level. In the latter case it is not connected to any particular node and can be used for some general calculations (e.g. based on some server stats). To create a check select Create service check from the context menu, enter the check name and navigate to Script tab in object properties: Monitoring All business service calculations performed in real time. The system calculates uptime values for a day, a week and a month for each business service defined. As soon as the uptime value changes it shows in the Object Details screen for the service: 208 Chapter 17. Business services and SLA

215 Figure 17.2: Create Node Link Figure 17.3: Service Check Properties Configuration and usage 209
216 Alternatively you can view the availability screen in a slightly different format by selecting Availability chart from the context menu. 210 Chapter 17. Business services and SLA
217 CHAPTER EIGHTEEN REMOTE FILE MANAGEMENT 18.1 Agent file management Introduction This section describes possibilities to manage files on remote nodes using agent and required configuration for it Required Configuration Subagent configuration To do any manipulations with files on a node it is required to load filemng subagent and configure accessible paths. It provides possibility to upload, download, delete, move and rename files. All configuration parameters related to filemng subagent should be placed into *filemgr section of agent s configuration file. The following configuration parameters are supported: Parameter Format Description Default value RootFolder String The folder to witch will be given access. no Agent s configuration file example: MasterServers = netxms.demo SubAgent = filemgr.nsm [filemgr] RootFolder = /home/zev RootFolder = /home/zev/etc RootFolder = /logs Access rights To view File Manager View it s enough to have Read access to node. To download files from file manager of through multiple file download there should be Download file access for this node and for multiple download Read server files access. To upload file from subagent there should be Upload file access for this node. For moving, renaming and deleting files from node it is required Manage files access to node File Manager view For each configured node is possible to open File Manager. In it will be displayed all configured root folders with option to expand and see their content. 211
218 File menu Download... : downloads file to selected folder on local computer Show : shows file with tail option on Rename : renames file Delete : deletes file Folder menu Upload file... : uploads local file to selected folder in view Upload folder... : uploads local folder to selected folder in view (not supported on web console) Download... : download folder to selected folder on local computer (on web console will be advised to save as a zip of the selected folder) Rename : renames folder Delete : deletes folder and all it s content Refresh this folder : refreshes content of selected folder in view Other options It is possible to move files and folders with help of drag and drop. To refresh all view should be used view refresh button(not form folder menu). But in this case all expanded folders will be closed. 212 Chapter 18. Remote file management

219 File upload to multiple nodes There is possibility to upload one file from server storage to multiple nodes in few clicks. 1. File should be uploaded to server for instruction check Upload file on server section. 2. From object tree should be selected nodes to which upload will be done. Selection can be done with help of Ctrl key. 3. Right click on one of selected nodes and chose Upload file There will be asked to provide path were to download file and server file that will be uploaded. (If destination will not be set then as a destination will be taken from agent s config parameter FileStore ) Server File Managment Access Rights There are 2 access rights that can be granted: Read server files : possibility to see files that are download on server Manage server files : possibility to remove or upload on server files Upload file on server It can be done in Server File List view or Tools -> Upload file to server Server File Managment 213
220 214 Chapter 18. Remote file management
221 CHAPTER NINETEEN REPORTING Reporting module is an optional component, build on top of well known JasperReports library, which can produce pixel-perfect documents in variety of formats based on historical data collected by NetXMS. Reporting module consist of two main parts: user interface and standalone Reporting Server, which handles all scheduling, execution, and optional document delivery to end users. Report generation is two step process: first step is to collect and process input data, then render output files in desired format. This separation exist for a reason: unlike rendering step, data collection could take hours to complete and it make no sense to repeat same processing process to render Excel file instead of PDF. When first step is finished, all processed information is saved into intermediate file on the reporting server and available for rendering at any time (e.g. user can render and download report from last year, even if source data is already purged). Reports execution and rendering can be initiated both manually and on schedule User Interface All reporting-related operations are available in separate Reporting perspective. Perspective contains two main areas list of available reports on the left and report details view on the right. Details view show information about currently selected report. Figure 19.1: Reporting perspective. 215
222 Details view contains tree main areas: Parameters, Schedules, and Results Parameters Figure 19.2: Execution parameters for report (in this example: Start date) In this section, user can set all input parameters required for report execution, for example data range or list of objects which should be included in the report. List of required parameters is extracted from report definition file and can be empty, if particular report do not require any input data to operate Schedules Each report can have one or more schedules, which define when it should be executed, and optionally rendered. Reporting server can also notify users that new report is executed and available for download, or send resulting file as an attachment. Figure 19.3: List of scheduled executions To add new schedule, click on Add Schedule down below, this will open schedule editor. General tab contains four scheduling options: 1. Once - execute report once at specified date and time 2. Daily - execute report every day at specified time 3. Weekly - execute report every week on selected days of week at specified time 4. Monthly - execute report every month on selected days at specified time Notification tab allows to control notifications and report delivery to list of recipients. To enable notifications, select Send notification on job completion checkbox. If checkbox Attach rendered report checkbox is enabled, report will be rendered into selected format and attached to notification Chapter 19. Reporting

223 Figure 19.4: Schedule editor with two tabs, General and Notifications Results section This section contains list of all generated reports, which are stored on the server and can be rendered on request. To render report in desired format, right click on the record and select Render to PDF or Render to Excel. If report is no longer needed, right click on record and select Delete to completely remove it from server Configuration NetXMS Server NetXMS server maintain persistent connection with reporting server on localhost:4710, but if can be changed in configuration. Configuration Parameter Description Default Value EnableReportingServer Boolean on/off switch which enable integration 0 ReportingServerHostname IP address or hostname of the reporting server localhost ReportingServerPort Port number of the reporting server Reporting Server Report definitions are loaded from the file system by scanning workspace folder, expected structure: $WORKSPACE/definitions/$REPORT_GUID. Each report folder should contain file main.jrxml, any additional files (images, translation files) should be referenced in main.jrxml with relative paths. Sample directory listing: workspace/definitions/6eb9c41c-e9f0-4e17-ac57-de747e16e480/i18n.properties workspace/definitions/6eb9c41c-e9f0-4e17-ac57-de747e16e480/main.jrxml workspace/definitions/6eb9c41c-e9f0-4e17-ac57-de747e16e480/logo.png Configuration 217

224 Figure 19.5: Notifications tab of Schedule editor 218 Chapter 19. Reporting

225 Figure 19.6: List of generated reports Server behaviour is controlled by two files: logback.xml (logger configuration) and nxreporting.properties. Format of logback.xml is described in Logback manual. nxreporting.properties is a standard Java property file in key=value format. Parameter Description nxreporting.workspace Path to workspace with deployed reports system.datasource.driverclassname JDBC class name, for example org.postgresql.driver system.datasource.url JDBC connection string, for example jdbc:postgresql:// /netxms system.datasource.dialect Hibernate dialect, for example org.hibernate.dialect.postgresqldialect. More information in JavaDoc system.datasource.username system.datasource.password report.datasource.driverclassname report.datasource.url report.datasource.username report.datasource.password org.quartz.jobstore.datasource org.quartz.datasource.myds.driver org.quartz.datasource.myds.url org.quartz.datasource.myds.user org.quartz.datasource.myds.password org.quartz.datasource.myds.maxconnections Access Control Configuration 219
226 220 Chapter 19. Reporting
227 CHAPTER TWENTY IMAGE LIBRARY 20.1 Introduction All images used on map should be first uploaded to Image Library. It can be done through Image Library View Image Library View There is possible to upload, delete and update images. They can be organized by different categories. View can be zoomed in or zoomed out(library zoom is saved). Tips: Images on map are displayed full size. Size of images predefined by NetXMS is 48x48 221
228 222 Chapter 20. Image library
229 CHAPTER TWENTYONE MOBILE CONSOLE NetXMS mobile console is a monitoring tool for Android devices running version 2.2. and later. Currently, only a small subset of the functions present in the Desktop/Web edition are implemented, mainly read/only operations. The next paragraphs briefly describes each section Main window Here you can see how appears the main window and the underneath levels. From the main window it is possible to get access to the following menu items: Settings: select this item to configure the console. Reconnect: select this item to force a reconnection to the server to gather new collected data. Disconnect & Exit: select this item to stop the console and exit from the app. Underneath levels have menu that are context dependent, a detailed description can be found in each section Alarms Alarms section is used to list and manage all pending alarms, eventually filtered on a particular node/container. Through this view it is possible to manage alarms: Actions: Sort: Acknowledge: acknowledge the alarm. Sticky acknowledge: sticky acknowledge the alarm. Resolve: resolve the alarm. Terminate: terminate the alarm. View last values: jump to the node info section to view the last values for the node that generated the alarm. Sort by severity ascending: sort list using event severity as criteria, ascending. Sort by severity descending: sort list using event severity as criteria, descending. Sort by date ascending: sort list using date of event as criteria, ascending. Sort by date descending: sort list using date of event as criteria, descending. Sort by node name ascending: sort list using node name that generated the event as criteria, ascending. 223
230 224 Chapter 21. Mobile Console
231 21.2. Alarms 225
232 226 Chapter 21. Mobile Console
233 21.2. Alarms 227
234 228 Chapter 21. Mobile Console
235 21.2. Alarms 229
236 Sort by node name descending: sort list using node name that generated the event as criteria, descending. Select all: select all the alarms from the list Unselect all: clear any selection of alarms from the list 21.3 Dashboard Dashboards are defined by administrator and allow to combine any available visualization components with data from multiple sources in order to create high-level views to see network (or parts of it) health at a glance. Not all elements are currently available for the mobile console, dashboards are properly refreshed according to their schedule. Due to dashboard size, keep in mind that Smartphones cannot be the best device to show them, a tablet is much more suitable device. Here an example: 21.4 Nodes This section is used to list and manage all nodes (all network infrastructure monitored by NetXMS are represented as a set of objects. Each object represents one physical or logical entity, or group of them). Objects can be organized into hierarchical structure, the Nodes section is used to explore them. In the right bottom corner of the icon there is a symbol that indicates the status of the node/container following the same simbology used on the desktop console. Clicking on a container will show the items inside, continuing to click up to an object will show a set of swipeable pages: Overview: here are presented the main info associated to this node, such as the name, the primary IP, the status, etc. Alarms: here are presented the list of pending alarms (if any) for this node, with the possibility to manage them with th Actions: * Acknowledge: acknowledge the alarm. * Sticky acknowledge: sticky acknowledge the alarm. * Resolve: resolve the alarm. * Terminate: terminate the alarm. * View last values: jump to the node info section to view the last values for the node that generated the alarm. Select all: select all the alarms from the list Unselect all: clear any selection of alarms from the list Last values: here are presented the DCI collected for this node, as well as the possibility to draw the following graphics Last half hour: draw one or more line graphs for the last half hour collected values Last hour: draw one or more line graphs for the last hour collected values Last two hours: draw one or more line graphs for the last two hours collected values Last four hours: draw one or more line graphs for the last four hours collected values Last day: draw one or more line graphs for the last day collected values Last week: draw one or more line graphs for the last week collected values Bar chart: draw a bar chart with the last collected value Pie chart: draw a pie chart with the last collected value 230 Chapter 21. Mobile Console
237 21.4. Nodes 231
238 Interfaces: here are presented all the interfaces associated to this node. For each interface it is possible to instruct the f Manage: interface will be put in manage state Unanage: interface will be put in unmanage state Change expected state: change the expected interface state, possible values: * UP: interface expected state will be put in UP state * DOWN: interface expected state will be put in DOWN state * IGNORE: interface expected state will be put in IGNORE state Find switch port: will start the search for a connection point (if available) 21.5 Graphics Predefined graphics are defined by administrator and can be used to view collected data in a graphical form (as a line chart). Currently, the mobile console doesn t autorefresh the content of the graphic selected. Here an example of a predefined graphs: 21.6 MACaddress This section is used to list previously searched MAC addresses or to start a new search by scanning a barcode value (this feature needs the installation of Barcode Scanner from Zxing Team freely available on the Google Play), by input it manually or by getting it directly from a node via the Find Switch port command Settings This section is used to configure the behaviour of the console Global settings Autostart on boot: check to automatically start the agent on boot (to be effective, app must not be moved to SD card) Connection Parameters Allows selecting the parameters used to connect to the server: Server: address of the server (IP or name). Port: port of the server (default 4701). User name: username to connect to the server. Password: password to connect to the server. Encrypt connection: when selected challenges an encryption strategy with the server (depending on supported/configured providers). 232 Chapter 21. Mobile Console
239 21.9. Connection 233
240 234 Chapter 21. Mobile Console
241 21.9. Connection 235
242 236 Chapter 21. Mobile Console
243 21.9. Connection 237
244 Scheduler Enables the possibility to define periodic connections to the server. If the scheduler is not enabled the app will try to connect to the server every time it detects a new connection (data or WiFi) and remains always connected as far as the connection remains active: Enable scheduler: check this to enable the scheduler. Frequency (min): amount of time, in minutes, that has to elapse between each tentative of connection to the server to send the gathered info. Duration (min): amount of time, in minutes, that has to elapse before disconnect from the server. Daily scheduler: provides the ability to define a one range daily on which the agent is operational. Out of the specifie Daily activation on: start time for daily activation. Daily activation off : stop time for daily activation Notifications Connection status This section is to manage the notifications related to the connection status. Notification behaviour: defines which kind of action should trigger notifications to the user. Possible options: Never: ignore connection status When connected: notify when connection is successful When disconnected: notify when connection is unsuccessful Always: notify either connection successful and connection unsuccessful Toast notification: provides connection notification via toast, behaviour is defined by Notification behaviour.<br /> Icon notification: provides connection notification via icon in the status bar, behaviour is defined by Notification behaviour Alarms Alarms notification: select to enable alarms notification in the status bar. Alarms sound by severity: for each of the following categories: Normal Warning Minor Major Critical 238 Chapter 21. Mobile Console
245 21.11 Interface Multipliers Allows to select the preferred multipliers to be used to show values. Allowed options: * None: do not apply multiplier, values are extended. * Decimal: applies a decimal multiplier (power of 10, e.g > 1K, > 1M,...) * Binary: applies a binary multiplier (power of 2, e.g > 1Ki, > 1Mi,...) Graph text size Allows to set the text size to be used for axis labels (if the default value is too small for high density devices) Show legend in graphs Allows to select to show or not the legend in the top right angle of the graphs. Since legend can be intrusive, especially when there are several lines plotted, user can select to disable the legend Interface 239
246 240 Chapter 21. Mobile Console
247 CHAPTER TWENTYTWO ADVANCED TOPICS 22.1 Zones As NetXMS server keeps track of an IP topology, it is important to maintain the configuration in which IP addresses do not overlap and that two IP addresses from same subnet are really within one subnet. Sometimes, however, it is needed to monitor multiple sites with overlapping IP address ranges. To correctly handle such situation, zoning must be used. Zone in NetXMS is a group of IP subnets which form non-overlapping IP address space. There is always zone 0 which contains subnets directly reachable by management server. For all other zones server assumes that subnets within that zones are not reachable directly, and proxy must be used Enable Zoning Zoning support is off by default. To turn it on you must set server s configuration variable EnableZoning to 1 and restart server. After restart, server will create default zone with ID 0 and put all existing subnets into that zone. Subnet tree will looks like this: Setting communication options for zones Server have to know proxy nodes to be able to communicate with nodes in remote zones. Default proxy settings for all nodes in the zone can be set on Communications page in zone object properties: On this page you can set default proxy node for NetXMS agents, SNMP, and ICMP. Note that proxy node must be in default zone and must have primary IP reachable by NetXMS server Moving nodes between zones To move existing node to another zone, select Change zone from nodes context menu, then select target zone in zone selection dialog that will appear. After move to another zone, server will immediately do configuration poll on the node Integration with external HelpDesk NetXMS provides possibility to create issues in external helpdesk system directly from NetXMS management console, based on pending alarms. In this situation NetXMS and external helpdesk system will have synchronized issue workflow. For now integration is done only with JIRA JIRA Module This module provide integration between NetXMS and JIRA. 241

248 242 Chapter 22. Advanced topics

249 22.1. Zones 243
VERSION 9.02 INSTALLATION GUIDE. www.pacifictimesheet.com
 VERSION 9.02 INSTALLATION GUIDE www.pacifictimesheet.com PACIFIC TIMESHEET INSTALLATION GUIDE INTRODUCTION... 4 BUNDLED SOFTWARE... 4 LICENSE KEY... 4 SYSTEM REQUIREMENTS... 5 INSTALLING PACIFIC TIMESHEET
OnCommand Performance Manager 1.1
 OnCommand Performance Manager 1.1 Installation and Setup Guide For Red Hat Enterprise Linux NetApp, Inc. 495 East Java Drive Sunnyvale, CA 94089 U.S. Telephone: +1 (408) 822-6000 Fax: +1 (408) 822-4501
24x7 Scheduler Multi-platform Edition 5.2
 24x7 Scheduler Multi-platform Edition 5.2 Installing and Using 24x7 Web-Based Management Console with Apache Tomcat web server Copyright SoftTree Technologies, Inc. 2004-2014 All rights reserved Table
Installing The SysAidTM Server Locally
 Installing The SysAidTM Server Locally Document Updated: 17 October 2010 Introduction SysAid is available in two editions: a fully on-demand ASP solution and an installed, in-house solution for your server.
Online Backup Client User Manual
 Online Backup Client User Manual Software version 3.21 For Linux distributions January 2011 Version 2.0 Disclaimer This document is compiled with the greatest possible care. However, errors might have
AVG 9.0 Internet Security Business Edition
 AVG 9.0 Internet Security Business Edition User Manual Document revision 90.5 (16. 4. 2010) C opyright AVG Technologies C Z, s.r.o. All rights reserved. All other trademarks are the property of their respective
Kaspersky Endpoint Security 8 for Linux INSTALLATION GUIDE
 Kaspersky Endpoint Security 8 for Linux INSTALLATION GUIDE A P P L I C A T I O N V E R S I O N : 8. 0 Dear User! Thank you for choosing our product. We hope that this documentation will help you in your
Heroix Longitude Quick Start Guide V7.1
 Heroix Longitude Quick Start Guide V7.1 Copyright 2011 Heroix 165 Bay State Drive Braintree, MA 02184 Tel: 800-229-6500 / 781-848-1701 Fax: 781-843-3472 Email: support@heroix.com Notice Heroix provides
AVG 8.5 Anti-Virus Network Edition
 AVG 8.5 Anti-Virus Network Edition User Manual Document revision 85.2 (23. 4. 2009) Copyright AVG Technologies CZ, s.r.o. All rights reserved. All other trademarks are the property of their respective
NMS300 Network Management System
 NMS300 Network Management System User Manual June 2013 202-11289-01 350 East Plumeria Drive San Jose, CA 95134 USA Support Thank you for purchasing this NETGEAR product. After installing your device, locate
Freshservice Discovery Probe User Guide
 Freshservice Discovery Probe User Guide 1. What is Freshservice Discovery Probe? 1.1 What details does Probe fetch? 1.2 How does Probe fetch the information? 2. What are the minimum system requirements
1. Product Information
 ORIXCLOUD BACKUP CLIENT USER MANUAL LINUX 1. Product Information Product: Orixcloud Backup Client for Linux Version: 4.1.7 1.1 System Requirements Linux (RedHat, SuSE, Debian and Debian based systems such
RecoveryVault Express Client User Manual
 For Linux distributions Software version 4.1.7 Version 2.0 Disclaimer This document is compiled with the greatest possible care. However, errors might have been introduced caused by human mistakes or by
Online Backup Client User Manual Linux
 Online Backup Client User Manual Linux 1. Product Information Product: Online Backup Client for Linux Version: 4.1.7 1.1 System Requirements Operating System Linux (RedHat, SuSE, Debian and Debian based
Online Backup Client User Manual
 For Linux distributions Software version 4.1.7 Version 2.0 Disclaimer This document is compiled with the greatest possible care. However, errors might have been introduced caused by human mistakes or by
Quick Start Guide for VMware and Windows 7
 PROPALMS VDI Version 2.1 Quick Start Guide for VMware and Windows 7 Rev. 1.1 Published: JULY-2011 1999-2011 Propalms Ltd. All rights reserved. The information contained in this document represents the
Quick Start Guide for Parallels Virtuozzo
 PROPALMS VDI Version 2.1 Quick Start Guide for Parallels Virtuozzo Rev. 1.1 Published: JULY-2011 1999-2011 Propalms Ltd. All rights reserved. The information contained in this document represents the current
Running custom scripts which allow you to remotely and securely run a script you wrote on Windows, Mac, Linux, and Unix devices.
 About Foglight NMS Foglight NMS is a comprehensive device, application, and traffic monitoring and troubleshooting solution. It is capable of securely monitoring single and multi-site networks of all sizes,
http://docs.trendmicro.com
 Trend Micro Incorporated reserves the right to make changes to this document and to the products described herein without notice. Before installing and using the product, please review the readme files,
STEALTHbits Technologies, Inc. StealthAUDIT v5.1 System Requirements and Installation Notes
 STEALTHbits Technologies, Inc. StealthAUDIT v5.1 System Requirements and Installation Notes June 2011 Table of Contents Overview... 3 Installation Overview... 3 Hosting System Requirements... 4 Recommended
Kaseya 2. User Guide. for Network Monitor 4.1
 Kaseya 2 Ping Monitor User Guide for Network Monitor 4.1 June 5, 2012 About Kaseya Kaseya is a global provider of IT automation software for IT Solution Providers and Public and Private Sector IT organizations.
There are numerous ways to access monitors:
 Remote Monitors REMOTE MONITORS... 1 Overview... 1 Accessing Monitors... 1 Creating Monitors... 2 Monitor Wizard Options... 11 Editing the Monitor Configuration... 14 Status... 15 Location... 17 Alerting...
Online Backup Linux Client User Manual
 Online Backup Linux Client User Manual Software version 4.0.x For Linux distributions August 2011 Version 1.0 Disclaimer This document is compiled with the greatest possible care. However, errors might
Kony MobileFabric. Sync Windows Installation Manual - WebSphere. On-Premises. Release 6.5. Document Relevance and Accuracy
 Kony MobileFabric Sync Windows Installation Manual - WebSphere On-Premises Release 6.5 Document Relevance and Accuracy This document is considered relevant to the Release stated on this title page and
Features Overview Guide About new features in WhatsUp Gold v12
 Features Overview Guide About new features in WhatsUp Gold v12 Contents CHAPTER 1 Learning about new features in Ipswitch WhatsUp Gold v12 Welcome to WhatsUp Gold... 1 What's new in WhatsUp Gold v12...
User Manual. Onsight Management Suite Version 5.1. Another Innovation by Librestream
 User Manual Onsight Management Suite Version 5.1 Another Innovation by Librestream Doc #: 400075-06 May 2012 Information in this document is subject to change without notice. Reproduction in any manner
QuickStart Guide for Managing Computers. Version 9.2
 QuickStart Guide for Managing Computers Version 9.2 JAMF Software, LLC 2013 JAMF Software, LLC. All rights reserved. JAMF Software has made all efforts to ensure that this guide is accurate. JAMF Software
Postgres Enterprise Manager Installation Guide
 Postgres Enterprise Manager Installation Guide January 22, 2016 Postgres Enterprise Manager Installation Guide, Version 6.0.0 by EnterpriseDB Corporation Copyright 2013-2016 EnterpriseDB Corporation. All
http://docs.trendmicro.com
 Trend Micro Incorporated reserves the right to make changes to this document and to the products described herein without notice. Before installing and using the product, please review the readme files,
WhatsUpGold. v3.0. WhatsConnected User Guide
 WhatsUpGold v3.0 WhatsConnected User Guide Contents CHAPTER 1 Welcome to WhatsConnected Finding more information and updates... 2 Sending feedback... 3 CHAPTER 2 Installing and Configuring WhatsConnected
insync Installation Guide
 insync Installation Guide 5.2 Private Cloud Druva Software June 21, 13 Copyright 2007-2013 Druva Inc. All Rights Reserved. Table of Contents Deploying insync Private Cloud... 4 Installing insync Private
Avira Update Manager User Manual
 Avira Update Manager User Manual Table of contents Table of contents 1. Product information........................................... 4 1.1 Functionality................................................................
Laptop Backup - Administrator Guide (Windows)
") Laptop Backup - Administrator Guide (Windows) Page 1 of 86 Page 2 of 86 Laptop Backup - Administrator Guide (Windows) TABLE OF CONTENTS OVERVIEW PREPARE COMMCELL SETUP FIREWALL USING PROXY SETUP FIREWALL
Laptop Backup - Administrator Guide (Windows) Page 1 of 86 Page 2 of 86 Laptop Backup - Administrator Guide (Windows) TABLE OF CONTENTS OVERVIEW PREPARE COMMCELL SETUP FIREWALL USING PROXY SETUP FIREWALL
StruxureWare Data Center Expert 7.2.1 Release Notes
 StruxureWare Data Center Expert 7.2.1 Release Notes Table of Contents Page # Part Numbers Affected...... 1 Minimum System Requirements... 1 New Features........ 1 Issues Fixed....2 Known Issues...2 Upgrade
Server Manager Help 10/6/2014 1
 Server Manager Help 10/6/2014 1 Table of Contents Server Manager Help... 1 Getting Started... 7 About SpectorSoft Server Manager... 8 Client Server Architecture... 9 System Requirements... 10 Screencasts...
mbits Network Operations Centrec
 mbits Network Operations Centrec The mbits Network Operations Centre (NOC) is co-located and fully operationally integrated with the mbits Service Desk. The NOC is staffed by fulltime mbits employees,
JAMF Software Server Installation Guide for Linux. Version 8.6
 JAMF Software Server Installation Guide for Linux Version 8.6 JAMF Software, LLC 2012 JAMF Software, LLC. All rights reserved. JAMF Software has made all efforts to ensure that this guide is accurate.
User's Guide - Beta 1 Draft
 IBM Tivoli Composite Application Manager for Microsoft Applications: Microsoft Hyper-V Server Agent vnext User's Guide - Beta 1 Draft SC27-2319-05 IBM Tivoli Composite Application Manager for Microsoft
JAMF Software Server Installation and Configuration Guide for Linux. Version 9.2
 JAMF Software Server Installation and Configuration Guide for Linux Version 9.2 JAMF Software, LLC 2013 JAMF Software, LLC. All rights reserved. JAMF Software has made all efforts to ensure that this guide
PZVM1 Administration Guide. V1.1 February 2014 Alain Ganuchaud. Page 1/27
 V1.1 February 2014 Alain Ganuchaud Page 1/27 Table of Contents 1 GENERAL INFORMATION... 3 1.1 System Overview... 3 1.2 Software... 5 2 GETTING STARTED... 6 2.1 Deploy OVF... 6 2.2 Logging On... 7 2.3 Configure
WhatsUp Gold v11 Features Overview
 WhatsUp Gold v11 Features Overview This guide provides an overview of the core functionality of WhatsUp Gold v11, and introduces interesting features and processes that help users maximize productivity
EventTracker Enterprise v7.3 Installation Guide
 EventTracker Enterprise v7.3 Installation Guide Publication Date: Sep 11, 2012 EventTracker 8815 Centre Park Drive Columbia MD 21045 www.eventtracker.com Abstract This guide will help the users to install
A CrossTec Corporation. Instructional Setup Guide. Activeworx Security Center Quick Install Guide
 A CrossTec Corporation Instructional Setup Guide Activeworx Security Center Quick Install Guide PREPARED BY GARY CONKLE Activeworx Basic Installation and Configuration Guide CrossTec Corporation 500 NE
ENC Enterprise Network Center. Intuitive, Real-time Monitoring and Management of Distributed Devices. Benefits. Access anytime, anywhere
 Scalability management up to 2,000 devices Network and device auto-discovery Firmware upgrade/backup and device configurations Performance alerts and monitoring ZyXEL switch specialized in RMON management
NNMi120 Network Node Manager i Software 9.x Essentials
 NNMi120 Network Node Manager i Software 9.x Essentials Instructor-Led Training For versions 9.0 9.2 OVERVIEW This course is designed for those Network and/or System administrators tasked with the installation,
Smart Business Architecture for Midsize Networks Network Management Deployment Guide
 Smart Business Architecture for Midsize Networks Network Management Deployment Guide Introduction: Smart Business Architecture for Mid-sized Networks, Network Management Deployment Guide With the Smart
Installation and configuration of Real-Time Monitoring Tool (RTMT)
") Installation and configuration of Real-Time Monitoring Tool (RTMT) How to install and upgrade RTMT, page 1 Services, servlets, and service parameters on server, page 5 Navigation of RTMT, page 6 Nonconfigurable
Installation and configuration of Real-Time Monitoring Tool (RTMT) How to install and upgrade RTMT, page 1 Services, servlets, and service parameters on server, page 5 Navigation of RTMT, page 6 Nonconfigurable
Centralized Orchestration and Performance Monitoring
 DATASHEET NetScaler Command Center Centralized Orchestration and Performance Monitoring Key Benefits Performance Management High Availability (HA) Support Seamless VPX management Enables Extensible architecture
StruxureWare Data Center Expert 7.2.4 Release Notes
 StruxureWare Data Center Expert 7.2.4 Release Notes Table of Contents Page # Part Numbers Affected...... 1 Minimum System Requirements... 1 New Features........ 1 Issues Fixed....3 Known Issues...3 Upgrade
NetCrunch 6. AdRem. Network Monitoring Server. Document. Monitor. Manage
 AdRem NetCrunch 6 Network Monitoring Server With NetCrunch, you always know exactly what is happening with your critical applications, servers, and devices. Document Explore physical and logical network
Command Center 5.0 2015-05-15 13:29:23 UTC. 2015 Citrix Systems, Inc. All rights reserved. Terms of Use Trademarks Privacy Statement
 Command Center 5.0 2015-05-15 13:29:23 UTC 2015 Citrix Systems, Inc. All rights reserved. Terms of Use Trademarks Privacy Statement Contents Command Center 5.0... 11 Command Center 5.0... 13 Release Notes...
User's Guide - Beta 1 Draft
 IBM Tivoli Composite Application Manager for Microsoft Applications: Microsoft Cluster Server Agent vnext User's Guide - Beta 1 Draft SC27-2316-05 IBM Tivoli Composite Application Manager for Microsoft
Installation and Configuration Guide for Windows and Linux
 Installation and Configuration Guide for Windows and Linux vcenter Operations Manager 5.0.3 This document supports the version of each product listed and supports all subsequent versions until the document
SMART Vantage. Installation guide
 SMART Vantage Installation guide Product registration If you register your SMART product, we ll notify you of new features and software upgrades. Register online at smarttech.com/registration. Keep the
AlienVault Unified Security Management (USM) 4.x-5.x. Deploying HIDS Agents to Linux Hosts
 4.x-5.x. Deploying HIDS Agents to Linux Hosts") AlienVault Unified Security Management (USM) 4.x-5.x Deploying HIDS Agents to Linux Hosts USM 4.x-5.x Deploying HIDS Agents to Linux Hosts, rev. 2 Copyright 2015 AlienVault, Inc. All rights reserved. AlienVault,
AlienVault Unified Security Management (USM) 4.x-5.x Deploying HIDS Agents to Linux Hosts USM 4.x-5.x Deploying HIDS Agents to Linux Hosts, rev. 2 Copyright 2015 AlienVault, Inc. All rights reserved. AlienVault,
Architecture and Mode of Operation
 Software- und Organisations-Service Open Source Scheduler Architecture and Mode of Operation Software- und Organisations-Service GmbH www.sos-berlin.com Scheduler worldwide Open Source Users and Commercial
Pearl Echo Installation Checklist
 Pearl Echo Installation Checklist Use this checklist to enter critical installation and setup information that will be required to install Pearl Echo in your network. For detailed deployment instructions
Security Correlation Server Quick Installation Guide
 orrelogtm Security Correlation Server Quick Installation Guide This guide provides brief information on how to install the CorreLog Server system on a Microsoft Windows platform. This information can also
Installation Notes for Outpost Network Security (ONS) version 3.2
 version 3.2") Outpost Network Security Installation Notes version 3.2 Page 1 Installation Notes for Outpost Network Security (ONS) version 3.2 Contents Installation Notes for Outpost Network Security (ONS) version 3.2...
Outpost Network Security Installation Notes version 3.2 Page 1 Installation Notes for Outpost Network Security (ONS) version 3.2 Contents Installation Notes for Outpost Network Security (ONS) version 3.2...
Getting Started. Symantec Client Security. About Symantec Client Security. How to get started
 Getting Started Symantec Client Security About Security Security provides scalable, cross-platform firewall, intrusion prevention, and antivirus protection for workstations and antivirus protection for
KASPERSKY LAB. Kaspersky Administration Kit version 6.0. Administrator s manual
 KASPERSKY LAB Kaspersky Administration Kit version 6.0 Administrator s manual KASPERSKY ADMINISTRATION KIT VERSION 6.0 Administrator s manual Kaspersky Lab Visit our website: http://www.kaspersky.com/
SYMANTEC BACKUPEXEC2010 WITH StorTrends
 SYMANTEC BACKUPEXEC2010 WITH StorTrends 1 Index 1. Introduction 3 2. Test Environment 3 3. System Requirement 4 4. Storage Requirement 4 5. Installation of Symantec Backup EXEC 2010 4 6. Installing Backup
SysPatrol - Server Security Monitor
 SysPatrol Server Security Monitor User Manual Version 2.2 Sep 2013 www.flexense.com www.syspatrol.com 1 Product Overview SysPatrol is a server security monitoring solution allowing one to monitor one or
Desktop : Ubuntu 10.04 Desktop, Ubuntu 12.04 Desktop Server : RedHat EL 5, RedHat EL 6, Ubuntu 10.04 Server, Ubuntu 12.04 Server, CentOS 5, CentOS 6
 201 Datavoice House, PO Box 267, Stellenbosch, 7599 16 Elektron Avenue, Technopark, Tel: +27 218886500 Stellenbosch, 7600 Fax: +27 218886502 Adept Internet (Pty) Ltd. Reg. no: 1984/01310/07 VAT No: 4620143786
IBM WebSphere Application Server Version 7.0
 IBM WebSphere Application Server Version 7.0 Centralized Installation Manager for IBM WebSphere Application Server Network Deployment Version 7.0 Note: Before using this information, be sure to read the
Enterprise Manager. Version 6.2. Installation Guide
 Enterprise Manager Version 6.2 Installation Guide Enterprise Manager 6.2 Installation Guide Document Number 680-028-014 Revision Date Description A August 2012 Initial release to support version 6.2.1
Technical Specification Data
 Equitrac Office 4.1 SOFTWARE SUITE Equitrac Office Software Suite Equitrac Office Suite Equitrac Office Small Business Edition (SBE) Applications Any size network with single or multiple accounting and/or
RUGGEDCOM NMS for Linux v1.6
 Welcome to RNMS 1 Installation 2 RUGGEDCOM NMS for Linux v1.6 Notes on RNMS 3 Installation Upgrades 4 09/2013 Copyright 2013 Siemens AG All rights reserved. Dissemination or reproduction of this document,
IceWarp to IceWarp Server Migration
 IceWarp to IceWarp Server Migration Registered Trademarks iphone, ipad, Mac, OS X are trademarks of Apple Inc., registered in the U.S. and other countries. Microsoft, Windows, Outlook and Windows Phone
Consolidated Monitoring, Analysis and Automated Remediation For Hybrid IT Infrastructures. Goliath Performance Monitor Installation Guide v11.
 Consolidated Monitoring, Analysis and Automated Remediation For Hybrid IT Infrastructures Goliath Performance Monitor Installation Guide v11.5 (v11.5) Document Date: March 2015 www.goliathtechnologies.com
JAMF Software Server Installation and Configuration Guide for OS X. Version 9.2
 JAMF Software Server Installation and Configuration Guide for OS X Version 9.2 JAMF Software, LLC 2013 JAMF Software, LLC. All rights reserved. JAMF Software has made all efforts to ensure that this guide
Volume SYSLOG JUNCTION. User s Guide. User s Guide
 Volume 1 SYSLOG JUNCTION User s Guide User s Guide SYSLOG JUNCTION USER S GUIDE Introduction I n simple terms, Syslog junction is a log viewer with graphing capabilities. It can receive syslog messages
Monitoring Windows Servers and Applications with GroundWork Monitor Enterprise 6.7. Product Application Guide October 8, 2012
 Monitoring Windows Servers and Applications with GroundWork Monitor Enterprise 6.7 Product Application Guide October 8, 2012 Table of Contents Introduction...3 Definitions and Abbreviations...3 GroundWork
In order to upload a VM you need to have a VM image in one of the following formats:
 What is VM Upload? 1. VM Upload allows you to import your own VM and add it to your environment running on CloudShare. This provides a convenient way to upload VMs and appliances which were already built.
Network Discovery Preparing for Installation
 Peregrine Network Discovery Preparing for Installation PART NO: PND-5.0.1-ENG-01011-00284 Copyright 2003 Peregrine Systems, Inc. or its subsidiaries. All rights reserved. Information contained in this
Remote Application Server Version 14. Last updated: 25-02-15
 Remote Application Server Version 14 Last updated: 25-02-15 Information in this document is subject to change without notice. Companies, names, and data used in examples herein are fictitious unless otherwise
Legal Notes. Regarding Trademarks. 2012 KYOCERA Document Solutions Inc.
 Legal Notes Unauthorized reproduction of all or part of this guide is prohibited. The information in this guide is subject to change without notice. We cannot be held liable for any problems arising from
CDH installation & Application Test Report
 CDH installation & Application Test Report He Shouchun (SCUID: 00001008350, Email: she@scu.edu) Chapter 1. Prepare the virtual machine... 2 1.1 Download virtual machine software... 2 1.2 Plan the guest
HP AppPulse Active. Software Version: 2.2. Real Device Monitoring For AppPulse Active
 HP AppPulse Active Software Version: 2.2 For AppPulse Active Document Release Date: February 2015 Software Release Date: November 2014 Legal Notices Warranty The only warranties for HP products and services
LifeSize Control Installation Guide
 LifeSize Control Installation Guide April 2005 Part Number 132-00001-001, Version 1.0 Copyright Notice Copyright 2005 LifeSize Communications. All rights reserved. LifeSize Communications has made every
Ad-Aware Management Server Installed together with Ad-Aware Business Client... 19 Ad-Aware Update Server... 19 Before You Start the Deployment...
 Table of Contents Using This Guide... 9 Purpose and Intended Audience... 9 How to Use This Guide... 9 Conventions Used in This Guide... 10 Typographical Conventions... 10 Admonitions... 10 About Ad-Aware
Application Discovery Manager User s Guide vcenter Application Discovery Manager 6.2.1
 Application Discovery Manager User s Guide vcenter Application Discovery Manager 6.2.1 This document supports the version of each product listed and supports all subsequent versions until the document
JAMF Software Server Installation and Configuration Guide for OS X. Version 9.0
 JAMF Software Server Installation and Configuration Guide for OS X Version 9.0 JAMF Software, LLC 2013 JAMF Software, LLC. All rights reserved. JAMF Software has made all efforts to ensure that this guide
Installation and Configuration Guide for Windows and Linux
 Installation and Configuration Guide for Windows and Linux vcenter Operations Manager 5.7 This document supports the version of each product listed and supports all subsequent versions until the document
Server Monitoring. AppDynamics Pro Documentation. Version 4.1.7. Page 1
 Server Monitoring AppDynamics Pro Documentation Version 4.1.7 Page 1 Server Monitoring......................................................... 4 Standalone Machine Agent Requirements and Supported Environments............
RDS Directory Synchronization
 RDS Directory Synchronization Installation and Setup Guide Software Version 3.1.1 For Windows, Linux and UNIX operating systems September 16, 2009 RepliWeb, Inc., 6441 Lyons Road, Coconut Creek, FL 33073
Remote Application Server Version 14. Last updated: 06-02-15
 Remote Application Server Version 14 Last updated: 06-02-15 Information in this document is subject to change without notice. Companies, names, and data used in examples herein are fictitious unless otherwise
Installation Guide for Pulse on Windows Server 2008R2
 MadCap Software Installation Guide for Pulse on Windows Server 2008R2 Pulse Copyright 2014 MadCap Software. All rights reserved. Information in this document is subject to change without notice. The software
EventSentry Overview. Part I About This Guide 1. Part II Overview 2. Part III Installation & Deployment 4. Part IV Monitoring Architecture 13
 Contents I Part I About This Guide 1 Part II Overview 2 Part III Installation & Deployment 4 1 Installation... with Setup 5 2 Management... Console 6 3 Configuration... 7 4 Remote... Update 10 Part IV
McAfee Firewall for Linux 8.0.0
 Release Notes McAfee Firewall for Linux 8.0.0 Contents About this release Features Installation Known issues Find product documentation About this release This document contains important information about
bbc Installing and Deploying LiveCycle ES2 Using JBoss Turnkey Adobe LiveCycle ES2 November 30, 2011 Version 9
 bbc Installing and Deploying LiveCycle ES2 Using JBoss Turnkey Adobe LiveCycle ES2 November 30, 2011 Version 9 2011 Adobe Systems Incorporated and its licensors. All rights reserved. Installing and Deploying
WhatsUp Gold v16.3 Installation and Configuration Guide
 WhatsUp Gold v16.3 Installation and Configuration Guide Contents Installing and Configuring WhatsUp Gold using WhatsUp Setup Installation Overview... 1 Overview... 1 Security considerations... 2 Standard
Installation Guide. McAfee VirusScan Enterprise for Linux 1.9.0 Software
 Installation Guide McAfee VirusScan Enterprise for Linux 1.9.0 Software COPYRIGHT Copyright 2013 McAfee, Inc. Do not copy without permission. TRADEMARK ATTRIBUTIONS McAfee, the McAfee logo, McAfee Active
Deploying System Center 2012 R2 Configuration Manager
 Deploying System Center 2012 R2 Configuration Manager This document is for informational purposes only. MICROSOFT MAKES NO WARRANTIES, EXPRESS, IMPLIED, OR STATUTORY, AS TO THE INFORMATION IN THIS DOCUMENT.
Installation Guide for FTMS 1.6.0 and Node Manager 1.6.0
 Installation Guide for FTMS 1.6.0 and Node Manager 1.6.0 Table of Contents Overview... 2 FTMS Server Hardware Requirements... 2 Tested Operating Systems... 2 Node Manager... 2 User Interfaces... 3 License
Using WhatsUp IP Address Manager 1.0
 Using WhatsUp IP Address Manager 1.0 Contents Table of Contents Welcome to WhatsUp IP Address Manager Finding more information and updates... 1 Sending feedback... 2 Installing and Licensing IP Address
Intelligent Power Protector User manual extension for Microsoft Virtual architectures: Hyper-V 6.0 Manager Hyper-V Server (R1&R2)
") Intelligent Power Protector User manual extension for Microsoft Virtual architectures: Hyper-V 6.0 Manager Hyper-V Server (R1&R2) Hyper-V Manager Hyper-V Server R1, R2 Intelligent Power Protector Main
Intelligent Power Protector User manual extension for Microsoft Virtual architectures: Hyper-V 6.0 Manager Hyper-V Server (R1&R2) Hyper-V Manager Hyper-V Server R1, R2 Intelligent Power Protector Main
Applications Manager Best Practices document
 Applications Manager Best Practices document This document will list the AdventNet ManageEngine Applications Manager best practices 1. Hardware and Software requirements 2. Configuring Applications Manager
Partek Flow Installation Guide
 Partek Flow Installation Guide Partek Flow is a web based application for genomic data analysis and visualization, which can be installed on a desktop computer, compute cluster or cloud. Users can access