CSA Guide - RobecoSAM s Corporate Sustainability Assessment Methodology
|
|
|
- Carol Marshall
- 8 years ago
- Views:
Transcription
1 CSA Guide - RobecoSAM s Corporate Sustainability Assessment Methodology Version April 2015 RobecoSAM AG Josefstrasse Zurich - Switzerland Phone Fax

2 1. RobecoSAM The Sustainability Indices The Corporate Sustainability Assessment A Structured Approach A Comprehensive Analysis with an Industry-specific Focus What is RobecoSAM looking for? Questionnaire & response rates Industry Group Classification The Scoring Methodology Scoring the Questions Calculating the Total Sustainability Score Assessing Companies exclusively on Publicly Available Information Scoring Questions where no Information is available Financial Materiality & Methodology Media and Stakeholder Analysis (MSA) Integration of the MSA into the CSA Impact of the MSA on Index Inclusion or Weight Calculation of the MSA Score for a specific case Updating the Questionnaire Raising the Bar External Verification Leveraging Sustainability Insights Annual timeline Contact Contact RobecoSAM 23 2 / 24
... 18 5.1 Integration of the MSA into the CSA 18 5.2 Impact of the MSA on Index Inclusion or Weight 18 5.")
3 1. RobecoSAM As an investment boutique focused exclusively on sustainability investing, RobecoSAM has always believed that financial analysis is incomplete if it ignores material extra-financial factors. Sustainability trends such as resource scarcity, climate change or an aging population continuously reshape a company s competitive environment. RobecoSAM is convinced that companies that can adapt to such challenges through innovation, quality and productivity enhance their ability to generate long-term shareholder value. For this reason, RobecoSAM developed the annual Corporate Sustainability Assessment (CSA) in 1999 in order to identify companies that are better equipped to recognize and respond to emerging sustainability opportunities and challenges presented by global and industry trends. RobecoSAM pursues a truly integrated approach to analyzing sustainability performance. An interdisciplinary team of analysts designs, monitors and refines the CSA with the purpose of generating additional insights into the value creating and risk mitigating potential of companies, ensuring that the assessment focuses on sustainability criteria that are financially relevant to corporate performance, valuation and security selection. Not only does this make the results of the CSA assessment particularly relevant for investors, but it also helps companies to focus on sustainability issues that are more directly linked to their success as a business. RobecoSAM s approach is also unique in that it is based on information provided by the companies directly through the online questionnaire. This allows RobecoSAM to analyze sustainability at a much deeper level than frameworks based on public disclosure alone. RobecoSAM is often asked how the CSA works and how a company s Total Sustainability Score is calculated. This paper seeks to offer some insights into how the questionnaire is structured, how the score is calculated, and by using examples from three different industries, how specific questions can have an impact on a company s Total Sustainability Score. 3 / 24
 in 1999 in order to identify companies that are better equipped to recognize and respond to emerging")
4 2. The Sustainability Indices Since the launch of the DJSI World in 1999, several other indices and index families that use RobecoSAM s Corporate Sustainability Assessment (CSA) results have followed to meet a range of investor specific needs. As a result of the various objectives of these index families, index component selection rules as well as scoring methodology have had to be adapted. This document aims to address some of the key differences between the two main sustainability index families in terms of assessment methodology. The document also aims to provide further insight into how the Media & Stakeholder Analysis (MSA) affects scores and clarify how RobecoSAM determines which companies will be assessed in any given year. RobecoSAM and S&P Dow Jones Indices offer a range of sustainability indices that investors can chose from depending on their sustainability objectives versus their diversification requirements. Currently, two different index families use the RobecoSAM CSA data: DJSI and DJSI Diversified. The DJSI are a family of benchmarks that uses a best-in-class approach to select sustainability leaders from each of the 59 RobecoSAM industries. RobecoSAM has observed that industry leaders are most likely to make the effort to fill out the questionnaire and make sustainability information available in the public domain. The DJSI is for investors who have a strong sustainability conviction and are willing to accept certain regional/size biases to gain exposure to sustainability leaders. The DJSI Diversified family seeks to provide a benchmark consisting of a balanced allocation of sustainable companies derived from standard market benchmarks, closely tracking their respective benchmark in terms of risk-return profile while also ensuring high sustainability standards. The DJSI Diversified targets investors who want to gain exposure to sustainability leaders, but have certain risk control guidelines that they cannot breach. Due to the different objectives that they are trying to meet, each of the two sustainability index families uses a different version of a sustainability score, although still all derived from the CSA. The DJSI family uses the Total Sustainability Score resulting from the CSA without further adjustment as described in the DJSI Guidebooks. For the DJSI Diversified, the Total Sustainability Scores are adjusted for sector and size bias as described in the DJSI Diversified Guidebook. 4 / 24
 affects scores and clarify how RobecoSAM determines which companies will be assessed in any given")
5 3. The Corporate Sustainability Assessment 3.1 A Structured Approach Each year, RobecoSAM invites the world s largest 2,500 1 publicly traded companies, measured by float adjusted market capitalization based on the S&P Global BMI Index, to participate in the annual CSA. An industry specific questionnaire featuring approximately questions (depending on the industry) on financially relevant economic, environmental and social factors is the starting point for RobecoSAM s annual assessment. Because this information is also integrated into financial analysis for asset management products, RobecoSAM focuses on sustainability factors that can have an impact on companies long-term value creation potential. Based on the sustainability data collected through the CSA, RobecoSAM identifies companies that are more likely to outperform as a result of their adoption of sustainability best practices. Since 1999, RobecoSAM has been conducting the annual Corporate Sustainability Assessment (CSA), which serves as the framework for measuring corporate sustainability performance and forms the research backbone for the construction of the Dow Jones Sustainability Indices (DJSI) The world s largest 2,500 2 publicly traded companies are invited to participate in RobecoSAM s CSA for possible inclusion in the Dow Jones Sustainability World Index (DJSI World) 59 RobecoSAM industries derived from the GICS industry classification system are analyzed using industry-specific questionnaires No industries are excluded from the assessment Companies are evaluated based on a range of financially relevant sustainability criteria covering the economic, environmental and social dimensions Companies receive a Total Sustainability Score between and are ranked against other companies in their industry The top 10% of companies within each industry are selected for inclusion in the DJSI World 3 The DJSI identify sustainability leaders across all industries, enabling investors to track their performance and integrate sustainability considerations into their portfolios The CSA is designed to capture both general and industry-specific criteria covering the economic, environmental and social dimensions. Each of the three dimensions consists of, on average 6 10 criteria, and each criterion can contain between 2 10 questions, totaling approximately questions, depending on the industry. Each criterion is worth up to 100 points, and is assigned a weight (percentage) of the total questionnaire. The criteria within each dimension roll up to the dimension weight. For each company, a Total Sustainability Score of up to 100 points is calculated based on the predefined weights established for each question and criterion. Figure 1 offers an overview of the general structure of the CSA. 1 Additional companies are invited for the regional Dow Jones Sustainability Indices, totaling approximately 3,300 companies. 2 Additional companies are invited for the regional Dow Jones Sustainability Indices, totaling approximately 3,300 companies. 3 The threshold for inclusion in the various DJSI Indices and the index component selection process can be found in the DJSI Guidebook which can be found at 5 / 24
 on financially relevant economic, environmental and social factors is the starting point for")
6 3.2 A Comprehensive Analysis with an Industry-specific Focus Based on major global sustainability challenges identified by RobecoSAM s analysts, general criteria relating to standard management practices and performance measures such as Corporate Governance, Human Capital Development and Risk & Crisis Management are defined and applied to each of the 59 industries. The general criteria account for approximately 40 50% of the assessment, depending on the industry as illustrated in Figure 2 4. At least 50% of the questionnaire covers industry specific risks and opportunities that focus on economic, environmental and social challenges and trends that are particularly relevant to companies within that industry. This focus on industry-specific criteria reflects RobecoSAM s conviction that industry-specific sustainability opportunities and risks play a key role in a company s long-term success and allows RobecoSAM to compare companies against their own peers in order to identify sustainability leaders. For instance, a manufacturing company s management of its exposures to climate change risks cannot be 4 Criteria and weights are based on the 2011 CSA for the Banking, Electric Utilities and Pharmaceutical industries and are provided for illustrative purposes only. Criteria and weights will differ for other industries. Specific criteria and their corresponding weights for subsequent years may change. 6 / 24

7 compared to a bank s response to climate change. Therefore, for industries with complex supply chains and logistics, the assessment focuses on evaluating their efforts to manage carbon emissions, whereas for financial services providers, the assessment focuses on whether companies address climate change through their financial products or by offering innovative funding schemes that encourage a transition towards a low-carbon economy. 7 / 24

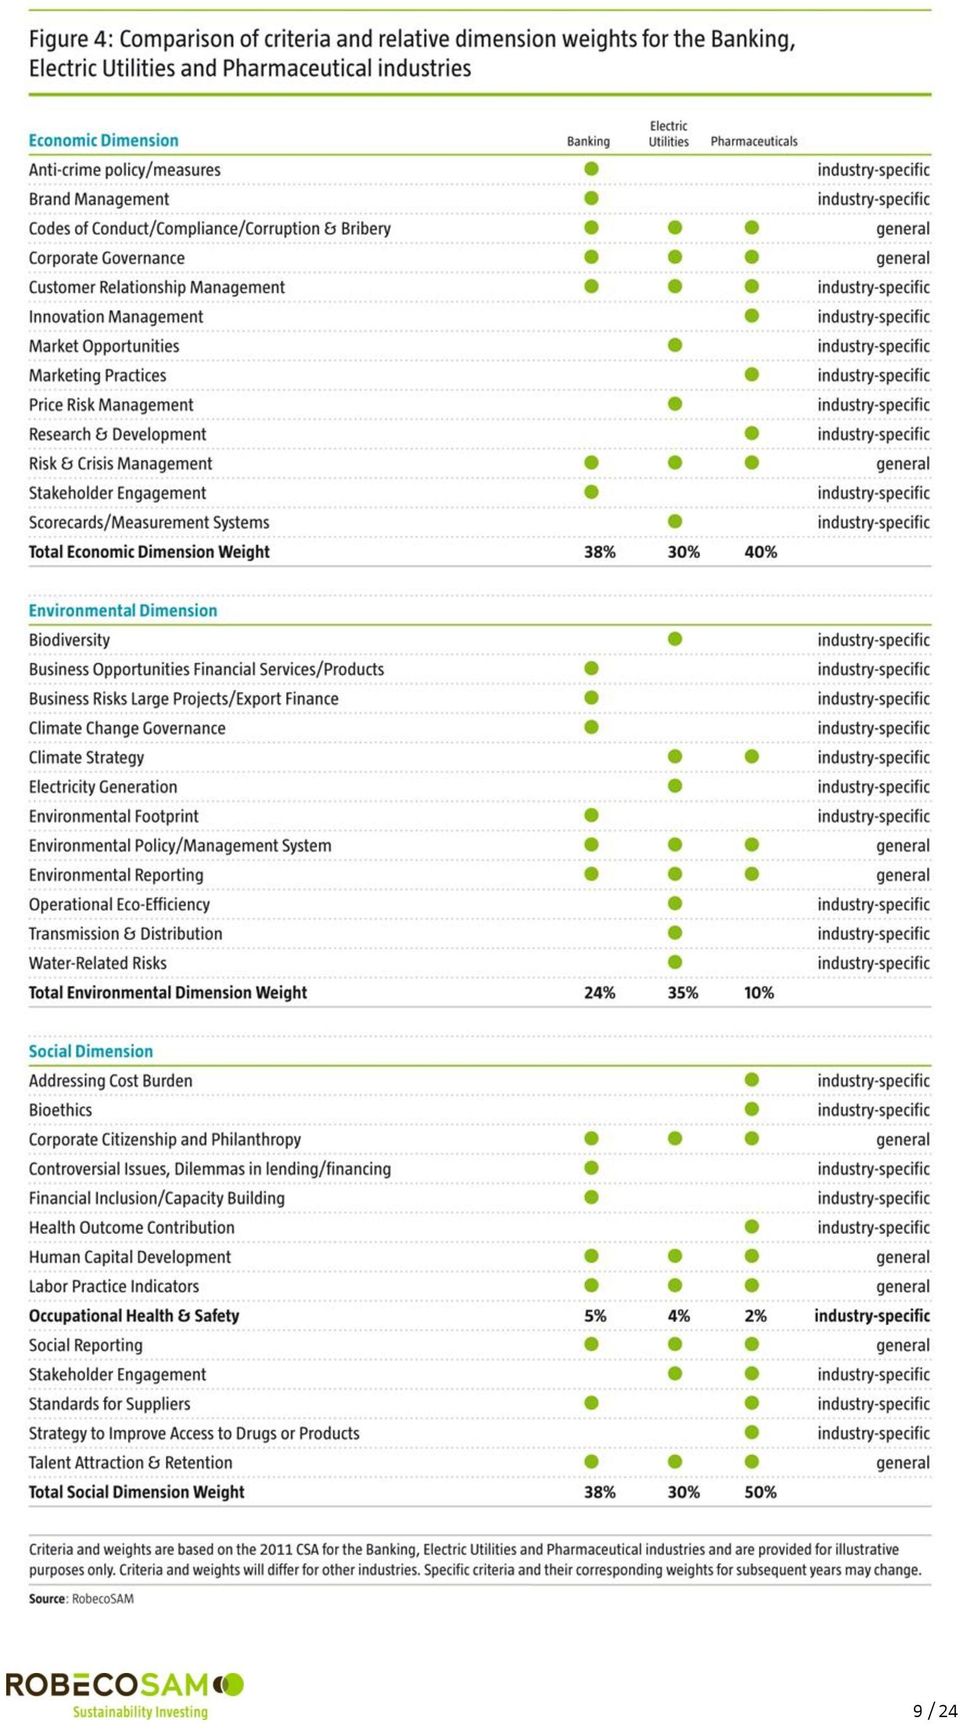
8 The relative weights of the economic, environmental and social dimension of the questionnaire vary by industry. For example, as shown in Figure 3 5, the environmental dimension warrants a higher weighting in the Electric Utilities industry than in the Banking or Pharmaceutical industries. Criteria within the questionnaire will vary from industry to industry to reflect industry-specific drivers, as shown in Figure 4, which provides a comparison of the criteria applied to the Banking, Electric Utilities and Pharmaceutical industries. Moreover, certain criteria even when applied to more than one industry can have different weights within the CSA. For example, the Banking, Electric Utilities and Pharmaceutical industries each contain the Occupational Health & Safety criterion within the social dimension of their respective questionnaires, but the relative weight assigned to Occupational Health & Safety is 5%, 4%, and 2%, respectively. These differences stem from RobecoSAM research analysts fundamental bottom-up analysis of each industry. Furthermore, the same criterion, when applied to different industries, may contain a slightly different set of questions to reflect industry-specific issues. 5 Criteria and weights are based on the 2011 CSA for the Banking, Electric Utilities and Pharmaceutical industries and are provided for illustrative purposes only. Criteria and weights will differ for other industries. Specific criteria and their corresponding weights for subsequent years may change. 8 / 24

9 9 / 24
10 3.3 What is RobecoSAM looking for? In line with RobecoSAM s conviction that material nonfinancial factors contribute to better informed investment decisions, the methodology focuses on long-term sustainability factors that are relevant to each industry, material to the company s financial performance and under-researched in conventional financial analysis. Within each criterion, RobecoSAM looks for evidence of a company s awareness of sustainability issues and for indications that it has implemented strategies to address them. RobecoSAM also evaluates the company s progress in implementing such strategies as well as the quality of its reporting on these issues. Therefore, the questions within each criterion are structured to capture and evaluate the following elements: 1. Awareness of the importance of these factors to its financial success 2. Determination of the potential financial impact (i.e. materiality) of its exposure to sustainability factors 3. Implementation of strategies to manage these sustainability risks or to capitalize on related opportunities in a manner that is consistent with its business models 4. Measurement of results in relation to stated KPIs in order to evaluate the effectiveness of its sustainability strategy 5. Validation or external audit of stated results 6. Transparent communication of its corporate sustainability strategies and extent to which stated targets have been met. This framework for evaluating corporate sustainability performance enables RobecoSAM to develop a more robust understanding of a company s quality of management. 3.4 Questionnaire & response rates The CSA is based on 59 unique online questionnaires which differ from industry to industry as sustainability drivers and indicators vary depending on a company s area of business. The 59 RobecoSAM industries are derived from the industry and sub-industry levels of the GICS classification. At the industry group level, RobecoSAM uses the standard GICS classification. The eligibility and index component selection rules are explained in detail in the respective index guidebook. A list of companies invited to participate in the assessment is published on each February. From March to August every year RobecoSAM assesses all participating companies and existing DJSI members with a market cap above USD 0.5 billion. Additional companies are assessed based exclusively on public information to ensure that 50% of the market cap in the 59 industries in each region (or country for Australia and Korea) is covered. In addition to this, from September to February of the following year all DJSI Diversified members with a market cap above USD 0.5 billion that are not already covered in the March to August period, are assessed based on publicly available information. In this period, coverage is extended to every developed market company with a market cap larger than USD 1 billion to ensure more than 50% of the market cap in the 10 GICS Sectors in each country is covered (provided that companies report in English). In 10 / 24

11 emerging markets, at least 90% of the market cap in the 10 GICS Sectors in each country is covered (provided that these companies stocks have at least a 10% average daily trading volume and report in English). 11 / 24

12 3.5 Industry Group Classification The 59 RobecoSAM industries roll up into the 24 GICS Industry Groups as indicated in the following table: Figure 5: RobecoSAM Industries GICS Industry Group Automobiles & Components Banks Capital Goods Commercial & Professional Services Consumer Durables & Apparel Consumer Services Diversified Financials Energy Food & Staples Retailing Food Beverage & Tobacco Health Care Equipment & Services Household & Personal Products Insurance Materials Media Pharmaceuticals, Biotechnology & Life Sciences Real Estate Retailing Semiconductors & Semiconductor Equipment Software & Services Technology Hardware & Equipment Telecommunication Services Transportation Utilities RobecoSAM Industry ATX Auto Components AUT Automobiles BNK Banks ARO Aerospace & Defense BLD Building Products CON Construction & Engineering ELQ Electrical Components & Equipment IDD Industrial Conglomerates IEQ Machinery and Electrical Equipment TCD Trading Companies & Distributors ICS Commercial Services & Supplies PRO Professional Services DHP Household Durables HOM Homebuilding LEG Leisure Equipment & Products and Consumer Electronics TEX Textiles, Apparel & Luxury Goods CNO Casinos & Gaming CSV Diversified Consumer Services REX Restaurants & Leisure Facilities TRT Hotels, Resorts & Cruise Lines FBN Diversified Financial Services and Capital Markets COL Coal & Consumable Fuels OIE Energy Equipment & Services OIX Oil & Gas PIP Oil & Gas Storage & Transportation FDR Food & Staples Retailing BVG Beverages FOA Food Products TOB Tobacco HEA Health Care Providers & Services MTC Health Care Equipment & Supplies COS Personal Products HOU Household Products INS Insurance ALU Aluminum CHM Chemicals COM Construction Materials CTR Containers & Packaging FRP Paper & Forest Products MNX Metals & Mining STL Steel PUB Media BTC Biotechnology DRG Pharmaceuticals LIF Life Sciences Tools & Services REA Real Estate RTS Retailing SEM Semiconductors & Semiconductor Equipment SOF Software TSV IT services & Internet Software and Services CMT Communications Equipment ITC Electronic Equipment, Instruments & Components THQ Computers & Peripherals and Office Electronics TLS Telecommunication Services AIR Airlines TRA Transportation and Transportation Infrastructure ELC Electric Utilities GAS Gas Utilities MUW Multi and Water Utilities 12 / 24

13 4. The Scoring Methodology 4.1 Scoring the Questions The questionnaire is designed to ensure objectivity by limiting qualitative answers through predefined multiple- choice questions in which each potential answer is assigned a number of points between For questions in which qualitative answers are allowed, RobecoSAM analysts evaluate the response using a predefined appraisal method, and convert the response into a quantitative score. In addition, companies must submit documentation to support the answers they have provided. For many questions, companies will only receive the maximum score for the question if they have provided adequate supporting material. In the following pages, we provide examples of specific questions from two different industries, and show how a company s response to these questions has an impact on the Total Sustainability Score. 13 / 24

14 14 / 24

15 4.2 Calculating the Total Sustainability Score Total Sustainability Score = Σ (Number of Question points received x Question Weight x Criterion Weight) A company s Total Sustainability Score at the highest aggregated level is the sum of all Question Scores. Each company receives a Total Sustainability Score ranging from Once the Total Scores have been calculated, companies within the same industry are ranked against their peers in order to determine which companies are eligible for inclusion in the Dow Jones Sustainability Indices (DJSI). In addition, the 59 industries roll up into 24 global industry groups, and the top scoring company from each is named the Industry Group Leader and is profiled on the DJSI website. CSA scores are derived from questionnaires that the invited companies complete online, on a voluntary basis. RobecoSAM aims to (i) identify, on a global basis, those companies that have a strong 15 / 24
.")
16 commitment to sustainability; and (ii) quantify that commitment, across the key dimensions of sustainability (environmental, social, economic), so that such companies can be compared with each other over time. Therefore, it is reasonable to assume that the companies most inclined to respond to the CSA Questionnaire are also those that have the highest commitment to and awareness of sustainability. In addition, the CSA also includes a large group of companies whose sustainability performance is evaluated by RobecoSAM based purely on publicly available information. This ensures that the coverage of the CSA is representative of the broader, global market for mid and large cap companies, both in terms of commitment to sustainability, and in terms of size, industry and country exposure. RobecoSAM believes that self-reporting allows sustainability analysis at a much deeper level than frameworks based on public disclosure alone. For instance, the CSA Questionnaire asks about confidential matters that companies would typically not disclose publicly, such as internal risk management systems, human resource indicators/compensation systems or a company s innovation management framework. Furthermore, RobecoSAM has taken a number of measures to ensure the accuracy of self-reporting: Statements regarding sustainability policies must be supported by official documents that the company provides separately. Most statements regarding actual performance (as opposed to policies) for which publicly available sources exist are verified against these sources. For standardized data and reporting, RobecoSAM looks for third party verification or assurance in addition to the performance figures. An example of this would be environmental performance indicators such as Scope 1 CO2 emissions. The Media and Stakeholder Analysis (MSA), which is based on data provided by specialized media monitoring company RepRisk, serves as a cross-check between a company s stated policies and its actual involvement in and response to violations, law suits and controversies. Deloitte provides annual assurance on the application of the CSA and Corporate Sustainability Monitoring methodology as described in the DJSI Guidebooks. 4.3 Assessing Companies exclusively on Publicly Available Information In order to ensure that the CSA covers a representative group of companies by region, industry sector and market cap size RobecoSAM calculates Total Sustainability Scores for certain invited companies who choose not to participate in the CSA. Non-participating companies questionnaires are completed based exclusively on publicly available information. Public sustainability disclosures are often more limited than the information that can be obtained directly from participating companies. In this context, it is worth noting also that comparability of publicly available information varies due to differences in measurement and time periods, for example. Nevertheless, a great deal of relevant and valid information regarding sustainability performance can be obtained from public disclosures. Representativeness and breadth of coverage are clearly important features of any sustainability scoring methodology. Therefore, while the questionnaires for nonparticipating companies may contain some information gaps, they still provide valuable information related to the sustainability efforts of those companies. 16 / 24

17 4.4 Scoring Questions where no Information is available Under the unadjusted approach, RobecoSAM assigns a zero score to any question where no information is available, as it is unknown whether the company has the applicable measure in place. This approach errs on the side of caution in granting sustainability scores: in the absence of any hard data, it grants the lowest possible score. While in some cases this may be a legitimate assumption, it is also true that this approach penalizes companies for not publicly disclosing information such as business strategies and competitive intelligence, but that may quite legitimately be considered confidential. This approach effectively treats the level of disclosure in the questionnaires of the participating companies as the gold standard and sets the bar very high for companies whose score is based exclusively on public disclosures. It is best used in cases where the index user is more concerned with the level of sustainability performance itself, and less with representation of the underlying benchmark. 4.5 Financial Materiality & Methodology RobecoSAM pursues a truly integrated approach to analyzing sustainability performance. An interdisciplinary team of analysts designs, monitors and refines the CSA with the purpose of generating additional insights into the value creating and risk mitigating potential of companies, ensuring that the assessment focuses on sustainability criteria that are financially relevant to corporate performance, valuation and security selection. Not only does this make the results of the CSA assessment particularly relevant for investors, but it also helps companies to focus on sustainability issues that are more directly linked to their success as a business. RobecoSAM s approach is also unique in that it is based on information provided by the companies directly through the online questionnaire. This allows RobecoSAM to analyze sustainability at a much deeper level than frameworks based on public disclosure alone. At least 50% of the questionnaire covers industry-specific risks and opportunities. This focus on industryspecific criteria reflects RobecoSAM s conviction that industry-specific sustainability opportunities and risks play a key role in a company s long-term success and allows RobecoSAM to compare companies against their own peers in order to identify sustainability leaders. RobecoSAM s CSA identifies the leading sustainability companies within the eligible universe from each RobecoSAM industry. 17 / 24

18 5. Media and Stakeholder Analysis (MSA) 5.1 Integration of the MSA into the CSA An integral component of the Corporate Sustainability Assessment is the ongoing monitoring of media and stakeholder commentaries and other publicly available information from consumer organizations, NGOs, governments or international organizations to identify companies involvement and response to environmental, economic and social crisis situations that may have a damaging effect on their reputation and core business. Throughout the year, RobecoSAM monitors news coverage of companies in the universe on a daily basis using media stories compiled and pre-screened by RepRisk, a leading provider of media monitoring tools. News stories covered by the Media and Stakeholder Analysis (MSA) include a range of issues such as economic crime or corruption, fraud, illegal commercial practices, human rights issues, labor disputes, workplace safety, catastrophic accidents or environmental disasters. RobecoSAM also reports or initiates MSA cases through the RepRisk system. An MSA case is created if a company has been the subject of a specific allegation that can harm its reputation, resulting in financial consequences ranging from lost business, lost customers and declining sales, to liabilities, litigation or fines. Such a case therefore requires a reaction from the company in order to address the issue and minimize the negative impact of the crisis. In order to evaluate the quality of the company s response to the situation, RobecoSAM continues to monitor news flow related to the incident until it has been resolved, which in some cases may take over a year. The MSA is built into the corporate sustainability assessment. For selected criteria within the questionnaire, predefined weights have been set aside for potential MSA cases that may arise during the year. The specific weight assigned to the MSA component will vary by criterion and from industry to industry, depending on the materiality of the potential impact on the company. 5.2 Impact of the MSA on Index Inclusion or Weight The MSA is integrated into the CSA questionnaires by treating each MSA case as if it were a question-- with a pre-defined weight, within a given criterion--to which a score is applied. The specific weight assigned to the MSA question will vary by criterion, and from industry to industry, depending on the potential material impact on the company. Each company starts the year with a score of 100 for such MSA questions. However, as a result of an MSA case, a company will typically receive a lower score, leading to a reduction in its Total Sustainability Score. The results of the MSA analysis can reduce a company s Total Sustainability Score and thus affect its inclusion or weight in any of the DJSI Indices. If a company has been part of recent controversies, scandals, allegations or disputes that negatively affected its reputation and/or financial performance it can lead to index exclusion in two ways: (i) by reducing the Total Sustainability Score causing the company to underperform its peers at the time of the review and (ii) through an index committee decision in exceptional cases at any time during the year when the issue is so severe that the company is removed from the index regardless of its score. 18 / 24

19 The chart in Figure 6 provides an overview of how a specific MSA case is identified, evaluated and integrated into the CSA. Figure 6: Overview of MSA Process: From Identification to Resolution 5.3 Calculation of the MSA Score for a specific case Based on the example outlined in Figure 6, Bank X receives an MSA Score of 30/100. This score is then applied to the weight that has been allotted to the MSA component of the Codes of Conduct / Compliance/Corruption & Bribery criterion, as shown in Figure 7. Figure 7: Calculation of MSA Score 19 / 24

20 The same scoring process is applied to all other criteria that have been linked to the MSA case in question. If no MSA cases have been identified during the course of the year, then the company will receive the full 100 points allotted to the MSA component for each criterion, and will have no negative impact on its total score. The results of the MSA can reduce a company s Total Sustainability Score and thus affect its inclusion in any of the DJSI Indices. In addition, severe incidents and breaches that cast strong doubts on a company s procedures and ability to handle the situation can be escalated to the DJSI Index Committee by the analyst. During the course of the MSA evaluation, the analyst may contact companies to clarify any open points that may arise from the MSA case, thus allowing the analyst to include the company s responses when making a recommendation to the DJSI Index Committee. The Committee consists of two RobecoSAM representatives and two S&P Dow Jones Indices representatives and meets on a quarterly basis. Following a thorough analysis, the DJSI Index Committee may decide to change a company s eligibility immediately, regardless of the company s Total Sustainability Score. 5.4 Updating the Questionnaire Raising the Bar Each year following the announcement of the DJSI components, the CSA is reviewed and adjustments are made to the questions and their relative weights in order to capture new sustainability issues that are expected to have an impact on companies competitive landscape Overall responsibility for updating the questionnaire and ensuring the assessment process runs smoothly lies with the Methodology Committee, the Sustainability Investing Research (SI Research) team and the Sustainability Application & Operations team. Analysts are assigned to specific industries and draw upon knowledge gained through their participation in industry conferences, roundtable discussions with industry organizations, as well as direct contact with companies throughout the course of the year in order to determine which industry-specific criteria warrant a review. As a general rule, analysts rely on their financial expertise to determine which sustainability opportunities and challenges are most likely to have an impact on a company s financial performance. In addition, specialized analysts are assigned general and cross-industry criteria such as Supply Chain Management, Occupational Health & Safety and Corporate Governance. These analysts are responsible for staying informed on sustainability developments related to their assigned criteria and ensuring that the questions connected to the specific topic are also current. During the annual methodology review process, analysts can propose adjustments to weights, as well as additions or deletions of specific questions. In parallel, the Sustainability Application & Operations team, which is responsible for the implementation of the CSA methodology changes, conducts a statistical analysis of companies scores to identify questions that merit further review. Questions in which all (or almost all) companies received 100 or 0 points, or questions that have a very low statistical distribution of scores are subject to further discussion. This analysis provides RobecoSAM with an indication of which questions may be outdated, which corporate sustainability practices have been widely adopted by companies, or which ones may need to be refined in order to more adequately distinguish the leaders from the laggards. The Methodology Committee is responsible for ensuring consistency of the methodology and is the decision making body within the governance structure that has been put in place for the annual review of the CSA. RobecoSAM aims to limit changes to approximately 10-20% of the questionnaire. An overview of the methodology review process is provided in Figure / 24

21 Figure 8: Updating the CSA 5.5 External Verification Information provided in the questionnaire is verified for accuracy by crosschecking companies answers with the supporting documentation they have provided, checking publicly available information, and by verifying a company s track record on crisis management with media and stakeholder reports. In addition, to ensure quality and objectivity of the CSA, independent third party Deloitte conducts an external audit of the assessment process each year. 5.6 Leveraging Sustainability Insights In addition to determining the components of the full range of the DJSI and DJSI Diversified index families, the insights derived from the CSA are fully integrated into our asset management offering and sustainability benchmarking activities. Data from the CSA also form the basis for the sustainability information that our parent company Robeco integrates in its mainstream fundamental and quantitative investment activities. Furthermore, RobecoSAM uses the results of the CSA to determine the companies that are eligible for inclusion in The Sustainability Yearbook a reference guide to the world s sustainability leaders. The Sustainability Yearbook provides extensive qualitative analysis highlighting current and future challenges shaping the competitive landscape for each of the 59 industries. In addition, The Sustainability Yearbook contains statistical information indicating the total number of companies assessed for each industry, as well as the average and top scores at the dimension level. 21 / 24
22 It is very important to note that, in addition to the CSA scores being used as inputs for the various sustainability indices and the Sustainability Yearbook, RobecoSAM uses the aggregated CSA findings as research support and as one of the inputs in the research process leading to the selection and weighting of portfolio constituents of its own asset management business and that of its parent company Robeco. Data is also used to conduct empirical in-house research or in cooperation with academic institutions to measure the impact of corporate sustainability performance on financial performance. 5.7 Annual timeline Figure 9: Timeline of CSA Process 22 / 24
23 6. Contact 6.1 Contact RobecoSAM RobecoSAM Indices for index licenses and requests: Tel.: (during Central European Time business hours). RobecoSAM DJSI Helpline for companies with questions related to the CSA: Tel.: (during Central European Time business hours) / 24
24 Disclaimer No warranty This publication is derived from sources believed to be accurate and reliable, but neither its accuracy nor completeness is guaranteed. The material and information in this publication are provided "as is" and without warranties of any kind, either expressed or implied. RobecoSAM AG and its related, affiliated and subsidiary companies disclaim all warranties, expressed or implied, including, but not limited to, implied warranties of merchantability and fitness for a particular purpose. Any opinions and views in this publication reflect the current judgment of the authors and may change without notice. It is each reader's responsibility to evaluate the accuracy, completeness and usefulness of any opinions, advice, services or other information provided in this publication. Limitation of liability All information contained in this publication is distributed with the understanding that the authors, publishers and distributors are not rendering legal, accounting or other professional advice or opinions on specific facts or matters and accordingly assume no liability whatsoever in connection with its use. In no event shall RobecoSAM AG and its related, affiliated and subsidiary companies be liable for any direct, indirect, special, incidental or consequential damages arising out of the use of any opinion or information expressly or implicitly contained in this publication. Copyright Unless otherwise noted, text, images and layout of this publication are the exclusive property of RobecoSAM AG and/or its related, affiliated and subsidiary companies and may not be copied or distributed, in whole or in part, without the express written consent of RobecoSAM AG or its related, affiliated and subsidiary companies. No Offer The information and opinions contained in this publication constitutes neither a solicitation, nor a recommendation, nor an offer to buy or sell investment instruments or other services, or to engage in any other kind of transaction. The information described in this publication is not directed to persons in any jurisdiction where the provision of such information would run counter to local laws and regulation. The Dow Jones Sustainability Indices are a joint product of S&P Dow Jones Indices LLC and/or its affiliates and RobecoSAM AG ( RobecoSAM ). S&P is a registered trademark of Standard & Poor s Financial Services LLC, Dow Jones is a registered trademark of Dow Jones Trademark Holdings LLC ( Dow Jones ) and RobecoSAM is a registered trademark of Robeco Groep N.V. The trademarks have been licensed to S&P Dow Jones Indices LLC and its affiliates. Inclusion of a company within a Dow Jones Sustainability Index is not a recommendation to buy, sell, or hold such company, nor is it investment advice. S&P Dow Jones Indices, Dow Jones, S&P, RobecoSAM and their respective affiliates (collectively SPDJI parties ) do not sponsor, endorse, sell or promote any investment fund or other investment vehicle that is offered by third parties and that seeks to provide an investment return based on the performance of any index. This document does not constitute an offer of services in jurisdictions where the SPDJI Parties do not have the necessary licenses. The SPDJI Parties may receive compensation in connection with licensing its indices to third parties. 24 / 24
DJSI Diversified Family
 DJSI Diversified Family RobecoSAM DJSI Diversified Family 06/2015 RobecoSAM AG www.sustainability-indices.com www.robecosam.com Investment Rationale The Dow Jones Sustainability Diversified Indices (DJSI
RobecoSAM DJSI Family 09/2013 RobecoSAM AG www.sustainability-indices.com www.robecosam.com
 DJSI Family RobecoSAM DJSI Family 09/2013 RobecoSAM AG www.sustainabilityindices.com www.robecosam.com Investment Rationale The Dow Jones Sustainability Indices (DJSI) are a family of benchmarks for investors
Impact Investing TAILORED, TRANSPARENT SOLUTIONS
 We set the standard for Impact Investing and are the first-choice partner for asset owners seeking to understand and control their global impact. Build your impact strategy with us - see inside for details.
Dow Jones Sustainability Chile Index Methodology
 Dow Jones Sustainability Chile Index Methodology S&P Dow Jones Indices: Index Methodology October 2015 Table of Contents Introduction 3 Highlights 3 Eligibility Criteria and Index Construction 5 Sustainability
GICS system sectors and industries
 GICS system sectors and industries In studying the share markets any where around the world, it can be useful to compare companies that are somewhat similar in what they do. That is, for example, to compare
Dow Jones Sustainability Emerging Markets Index Guide
 Dow Jones Sustainability Emerging Markets Index Guide Version 1.0 21 February 2013 RobecoSAM AG Josefstrasse 218-8005 Zurich - Switzerland - www.robecosam.com - Phone +41 44 653 18 00 - Fax +41 44 653
Valuation: S&P 500 Sectors & Industries Forward P/Es
 Valuation: S&P Sectors & Industries Forward P/Es February, 16 Dr. Edward Yardeni 16-972-7683 eyardeni@ Joe Abbott 732-497-6 jabbott@ Mali Quintana 48-664-1333 aquintana@ Please visit our sites at www.
Universe Index Transition for Dow Jones Titans Indices
 Universe Transition for Dow Jones Titans Indices S&P Dow Jones Indices (S&P DJI) is conducting a consultation with members of the investment community. S&P DJI is currently reviewing the universe indices
Stock Market Briefing: S&P 500 Profit Margins, Sectors & Industries
 Stock Market Briefing: S&P Profit Margins, Sectors & Industries February, 1 Dr. Edward Yardeni 1-- eyardeni@ Joe Abbott -- jabbott@ Please visit our sites at www. blog. thinking outside the box Table Of
S&P DOW JONES INDICES AND MSCI ANNOUNCE FURTHER REVISIONS TO THE GLOBAL INDUSTRY CLASSIFICATION STANDARD (GICS ) STRUCTURE IN 2016
 STRUCTURE IN 2016") S&P DOW JONES INDICES AND MSCI ANNOUNCE FURTHER REVISIONS TO THE GLOBAL INDUSTRY CLASSIFICATION STANDARD (GICS ) STRUCTURE IN 2016 New York, November 2, 2015 - S&P Dow Jones Indices, a leading provider
S&P DOW JONES INDICES AND MSCI ANNOUNCE FURTHER REVISIONS TO THE GLOBAL INDUSTRY CLASSIFICATION STANDARD (GICS ) STRUCTURE IN 2016 New York, November 2, 2015 - S&P Dow Jones Indices, a leading provider
The First Decade: 1999-2009. Dow Jones Sustainability Indexes
 The First Decade: 1999-2009 Dow Jones Sustainability Indexes The first decade Since 1999, a growing number of investors have started identifying sustainability issues as key factors for financial success.
Smart ESG Integration: Factoring in Sustainability
 Smart ESG Integration: Factoring in Sustainability Abstract Smart ESG integration is an advanced ESG integration method developed by RobecoSAM s Quantitative Research team. In a first step, an improved
Profit Margins. Yardeni Research, Inc. April 3, 2012. Dr. Edward Yardeni. Mali Quintana. thinking outside the box. 516-972-7683 eyardeni@yardeni.
 Profit Margins April, 1 Dr. Edward Yardeni 1-- eyardeni@ Mali Quintana --1 aquintana@ Please visit our sites at www. blog. thinking outside the box Table Of Contents Table Of Contents Pricing & Unit Labor
Maps of Global Industry Classification Standard (GICS) to proposed GRI Business Activity Groups
 to proposed GRI Business Activity Groups") Additional information about the project can be found at https://www.globalreporting.org/reporting/sector-guidance/topics-research/pages/default.aspx Maps of Global Industry Classification Standard ()
Additional information about the project can be found at https://www.globalreporting.org/reporting/sector-guidance/topics-research/pages/default.aspx Maps of Global Industry Classification Standard ()
Technical Note: Global Industry Classification Standards (GICS) CDP info@cdp.net +44 (0) 20 7970 5660 www.cdp.net
 CDP info@cdp.net +44 (0) 20 7970 5660 www.cdp.net") Technical Note: Global Industry Classification Standards (GICS) CDP info@cdp.net +44 (0) 20 7970 5660 www.cdp.net 1 The Global Industry Classification Standard structure consists of 10 sectors, 24 industry
Technical Note: Global Industry Classification Standards (GICS) CDP info@cdp.net +44 (0) 20 7970 5660 www.cdp.net 1 The Global Industry Classification Standard structure consists of 10 sectors, 24 industry
SECTOR SUB-SECTOR BRANCH SUB-BRANCH
 01000 Energy 01100 Energy 01110 Energy & 01000 01100 01110 01112 01000 01100 01120 Oil, Gas & Consumable Fuels 01000 01100 01120 01122 01111 Oil & Gas Drilling Oil & Gas & 01121 Integrated Oil & Gas Oil
S&P Environmental and Socially Responsible Indices
 EQUITY 101 Global CONTRIBUTORS Sabrina Salemi Manager Strategy and Global Equity Indices sabrina.salemi@spdji.com Philip Murphy, CFA Vice President North American Equities philip.murphy@spdji.com Alka
How To Understand Gics
 September 2008 GLOBAL INDUSTRY CLASSIFICATION STANDARD METHODOLOGY Table of Contents Introduction 3 Highlights 3 GICS Classification Methodology 4 About GICS 4 GICS Structure 4 GICS Compliant Indices 5
Does corporate gender equality lead to outperformance?
 Does corporate gender equality lead to outperformance? Executive summary Gender equality from a corporate perspective encompasses issues of workforce diversity as well as equal pay and career opportunities.
MSCI CHINA AND USA INTERNET TOP 50 EQUAL WEIGHTED INDEX
 INDEX METHODOLOGY MSCI CHINA AND USA INTERNET TOP 50 EQUAL WEIGHTED INDEX September 2014 SEPTEMBER 2014 CONTENTS 1 Introduction... 3 2 Constructing the MSCI China and USA Internet Top 50 Equal Weighted
Map of Industry Classification Benchmark (ICB) to proposed GRI Business Activity Groups
 to proposed GRI Business Activity Groups") Additional information about the project can be found at https://www.globalreporting.org/reporting/sector-guidance/topics-research/pages/default.aspx Map of Industry Classification Benchmark (ICB) to proposed
Additional information about the project can be found at https://www.globalreporting.org/reporting/sector-guidance/topics-research/pages/default.aspx Map of Industry Classification Benchmark (ICB) to proposed
THE U.S. INFRASTRUCTURE EFFECT INTERVIEW BY CAROL CAMERON
 This interview originally appeared in the Summer 24 edition of InSIGHTS, a quarterly publication from S&P Dow Jones Indices. THE U.S. INFRASTRUCTURE EFFECT INTERVIEW BY CAROL CAMERON Every four years,
Insight Inspires Action ROBECOSAM S SUSTAINABILITY SERVICES YOUR KEY TO EFFECTIVE SUSTAINABILITY BENCHMARKING
 Insight Inspires Action ROBECOSAM S SUSTAINABILITY SERVICES YOUR KEY TO EFFECTIVE SUSTAINABILITY BENCHMARKING Is it time to rethink the sustainability of your strategy? Sustainability can be a critical
Alpha from Sustainability
 Alpha from Sustainability RobecoSAM White Paper ROBECOSAM SI RESEARCH & DEVELOPMENT ROBECO QUANTITATIVE STRATEGIES RobecoSAM s Alpha from Sustainability 06/2014 RobecoSAM AG www.robecosam.com RobecoSAM
Der Finanzsektor als CSR -Treiber und -Partner? Stéphanie Engels. Forum EnviComm Stuttgart, 27. April 2009
 Der Finanzsektor als CSR -Treiber und -Partner? Stéphanie Engels Forum EnviComm Stuttgart, 27. April 2009 SAM in Brief Specialised Investment Group for Sustainability Investments Founded 1995 Strategic
Performance 2015 S&P 500 Sectors & Industries
 Performance 21 S&P Sectors & Industries November 2, 21 Dr. Edward Yardeni 16-972-7683 eyardeni@ Joe Abbott 732-497-36 jabbott@ Mali Quintana 48-664-1333 aquintana@ Please visit our sites at www. blog.
Defining Materiality: What Matters to Reporters and Investors
 Defining Materiality: What Matters to Reporters and Investors Do investors and reporters agree on what s material in the Technology Hardware & Equipment and Banks & Diverse Financials sectors? ABOUT GRI
Thomson Reuters Business Classification
 Classification Structure 2012 Economic Sector: 50 Energy 5010 Energy - Fossil Fuels 501010 Coal 50101010 Coal 501020 Oil & Gas 50102010 Integrated Oil & Gas 50102020 Oil & Gas Exploration and Production
S&P DOW JONES INDICES AND MSCI ANNOUNCE REVISIONS TO THE GLOBAL INDUSTRY CLASSIFICATION STANDARD (GICS ) STRUCTURE IN 2016
 STRUCTURE IN 2016") S&P DOW JONES INDICES AND MSCI ANNOUNCE REVISIONS TO THE GLOBAL INDUSTRY CLASSIFICATION STANDARD (GICS ) STRUCTURE IN 2016 New York, November 10, 2014 - S&P Dow Jones Indices, a leading provider of financial
S&P DOW JONES INDICES AND MSCI ANNOUNCE REVISIONS TO THE GLOBAL INDUSTRY CLASSIFICATION STANDARD (GICS ) STRUCTURE IN 2016 New York, November 10, 2014 - S&P Dow Jones Indices, a leading provider of financial
Performance 2016 S&P 500 Sectors & Industries
 Performance 216 S&P Sectors & Industries August 4, 216 Dr. Edward Yardeni 16-972-7683 eyardeni@ Joe Abbott 732-497-36 jabbott@ Mali Quintana 48-664-1333 aquintana@ Please visit our sites at www. blog.
AN INSIDE LOOK AT S&P MILA 40
 DID YOU KNOW? This article originally appeared in the Summer 2013 edition of INSIGHTS, a quarterly publication from S&P DJI, and summarizes key aspects of the S&P MILA 40 Index originally featured in Benchmarking
SELECT YOUR SECTORS. Respond to Market Cycles with Agility and Precision
 SELECT YOUR SECTORS Respond to Market Cycles with Agility and Precision ECONOMIC CYCLES & SECTORS The economy moves in cycles. Specific sectors may outperform or underperform during different phases, driven
S&P ESG Pan-Europe Developed Sovereign Bond Index. June 2015
 S&P ESG Pan-Europe Developed Sovereign Bond Index June 2015 Content 1 Introduction 2 RobecoSAM Country Sustainability Ranking 3 S&P ESG pan-europe Developed Sovereign Bond Index 4 Conclusion 2 Introduction
Global Industry Classification Standard (GICS )
") August 2006 Global Industry Classification Standard (GICS ) Table of Contents Introduction... 1 GICS Classification Methodology... 2 GICS Usage... 4 GICS Maintenance... 6 Changes to the GICS Structure...
August 2006 Global Industry Classification Standard (GICS ) Table of Contents Introduction... 1 GICS Classification Methodology... 2 GICS Usage... 4 GICS Maintenance... 6 Changes to the GICS Structure...
MSCI US REIT Index Methodology
 Index Construction and Maintenance Methodology for the MSCI US REIT Index Contents Introduction... 3 Section 1: Defining REITs and the MSCI US REIT Index Eligible REITs... 4 Section 2: Free Float-Adjusting
MSCI Core Infrastructure Indexes Methodology
 Index Methodology MSCI Core Infrastructure Indexes Methodology January 2015 msci.com Contents 1 Introduction... 3 2 Constructing MSCI Core Infrastructure Indexes... 3 2.1 Country and Constituent Selection...
Defining Materiality: What Matters to Reporters and Investors
 Defining Materiality: What Matters to Reporters and Investors Do investors and reporters agree on what s material in the Technology Hardware & Equipment and Banks & Diverse Financials sectors? ABOUT GRI
MSCI US REIT Index Methodology
 Index Construction and Maintenance Methodology for the MSCI US REIT Index 1. Introduction The MSCI US REIT Index is a free float market capitalization weighted index that is comprised of Equity REITs securities
Looking Down Under: An Approach to Global Equity Indexing in Australia
 January 2015 CONTRIBUTOR Michael Orzano, CFA Director, Global Equity Indices michael.orzano@spdji.com Looking Down Under: An Approach to Global Equity Indexing in Australia The benefits of incorporating
Pension fund beneficiaries in Switzerland call for sustainable investment strategies
 Pension fund beneficiaries in Switzerland call for sustainable investment strategies Representative study by RobecoSAM AG in conjunction with gfs-zürich Starting situation Sustainability is the most important
Results of MSCI 2015 Market Classification Review
 Results of MSCI 2015 Market Classification Review China A Shares on Track for Inclusion MSCI and CSRC Will Form Working Group to Address Remaining Issues Geneva June 9, 2015 MSCI Inc. (NYSE: MSCI), the
Map of proposed GRI Business Activity Groups to Thomson Reuters Business Classification (TRBC)
") Additional information about the project can be found at https://www.globalreporting.org/reporting/sector-guidance/topics-research/pages/default.aspx Map of proposed GRI Business Activity Groups to Thomson
Additional information about the project can be found at https://www.globalreporting.org/reporting/sector-guidance/topics-research/pages/default.aspx Map of proposed GRI Business Activity Groups to Thomson
INDEX METHODOLOGY MSCI REIT PREFERRED. Index Construction and Maintenance Methodology for the MSCI REIT Preferred Index.
 INDEX METHODOLOGY MSCI REIT PREFERRED INDEX METHODOLOGY Index Construction and Maintenance Methodology for the MSCI REIT Preferred Index December 2014 DECEMBER 2014 CONTENTS 1 Introduction... 3 2 Defining
To receive this report via e-mail, please go to: www.factset.com/data/news_research/researchdesk
 EARNINGS INSIGHT John Butters, VP, Sr. Earnings Analyst jbutters@factset.com Media Questions/Requests media_request@factset.com S&P 500 June 24, 2016 Key Metrics Earnings Growth: For Q2 2016, the estimated
Harnessing Innovation and Growth Within Tech
 SPDR SPOTLIGHT Harnessing Innovation and Growth Within Tech by David B. Mazza, Head of ETF and Mutual Fund Research, Matthew Bartolini, CFA, Research Strategist, and Jared Rowley, CFA, Research Strategist,
A cooperation of Dow Jones Indexes and SAM
 A cooperation of Dow Jones Indexes and SAM Content Key Facts Assessment 2010 Dow Jones Sustainability World Index Dow Jones Sustainability Europe Index Dow Jones Sustainability Asia Pacific Index Dow Jones
RoD Canada 50 Tracking Index Methodology July 2014
 RoD Canada 50 Tracking Index Methodology July 2014 Table of contents Introduction Introduction 3 Eligibility Criteria Additions RoD Canada 50 4 Deletions RoD Canada 50 5 Timing of Changes 6 Index Construction
Frequently Asked Questions MSCI ESG RESEARCH. FAQs for the Corporate Community October 2014. msci.com
 Frequently Asked Questions MSCI ESG RESEARCH for the Corporate Community MSCI ESG RESEARCH Frequently Asked Questions General: What is MSCI? MSCI is a leading provider of investment decision support tools
S&P 500 Low Volatility Index
 S&P 500 Low Volatility Index Craig J. Lazzara, CFA S&P Indices December 2011 For Financial Professional/Not for Public Distribution There s nothing passive about how you invest. PROPRIETARY. Permission
Taking the Pulse of the U.S. Healthcare Market
 February 2016 CONTRIBUTORS Glenn K. Doody, CFA Vice President Product Management glenn.doody@spdji.com Michael Taggart, FSA Consultant michael.taggart@spdji.com Taking the Pulse of the U.S. Healthcare
Mechanics of Currency Hedged Indices
 EQUITY 101 Global Mechanics of Currency Hedged Indices CONTRIBUTORS Sabrina Salemi Manager, Strategy and Global Equity Indices sabrina.salemi@spdji.com Philip Murphy, CFA Vice President, North American
MSCI AUSTRALIA SELECT HIGH DIVIDEND YIELD INDEX
 INDEX METHODOLOGY MSCI AUSTRALIA SELECT HIGH DIVIDEND YIELD INDEX March 2014 MARCH 2014 CONTENTS 1 Introduction... 3 2 Constructing the MSCI Australia Select High Dividend Yield Index... 4 3 Maintaining
Measuring Volatility in Australia
 CONTRIBUTOR Berlinda Liu Director Global Research & Design berlinda_liu@spdji.com How is VIX computed? Select first and second month OTM puts and OTM calls Compute implied volatility for each maturity
Goldman Sachs ActiveBeta Equity Indexes Methodology
 GOLDMAN SACHS ASSET MANAGEMENT Goldman Sachs ActiveBeta Equity Indexes Methodology Last updated 14 August 2015 Table of Contents I. Introduction... 1 A. Index Overview... 1 B. Index Details... 1 II. Index
Constructing a more dynamic portfolio with equity sector allocation
 Constructing a more dynamic portfolio with equity sector allocation This is not your father s stock market, where traditional methods were used to allocate the stock portion of a portfolio. Enter the more
S&P LTVC Global Index Methodology
 S&P LTVC Global Index Methodology S&P Dow Jones Indices: Index Methodology January 2016 Table of Contents Introduction 3 Index Construction 4 Index Universe 4 Constituent Selection 5 Index Maintenance
The Return on Disability Company
 The Return on Disability Company RoD Canada Index Methodology July 2012 Table of contents Introduction Introduction 3 Eligibility Criteria Additions RoD Canada 50 4 Deletions RoD Canada 50 5 Timing of
Fact Sheet. Dow Jones Sustainability TM World Enlarged Index ex Alcohol, Tobacco, Gambling, Armaments & Firearms and Adult Entertainment
 Dow Jones Sustainability TM World Enlarged Index ex Alcohol, Tobacco, Gambling, Armaments & Firearms and Adult Stated Objective The Dow Jones Sustainability TM World Enlarged Index ex Alcohol, Tobacco,
Integrating ESG criteria into fixed income investments
 WHITE PAPER May 2015 For professional investors Integrating ESG criteria into fixed income investments Making better informed investment decisions Edith Siermann Integrating ESG criteria into fixed income
2013 Distribution Summary Investor, Premium & e -Series Breakdown of Cumulative Distributions for the Period January 1, 2013 to December 31, 2013
 2013 Summary Breakdown of Cumulative s for the Period January 1, 2013 to December 31, 2013 TD Comfort Portfolios Investor Series TD Comfort Conservative Portfolio 0.070042 0.024999 0.040647 0.051698 0.187386
Sukuk Liquidity Trends
 PRACTICE ESSENTIALS SUKUK 21 GLOBAL Liquidity Trends CONTRIBUTOR Michele Leung Associate Director, Fixed Income Indices michele.leung@spdji.com While global sukuk issuance declined by 13% in 213, the liquidity
To receive this report via e-mail, please go to: www.factset.com/data/news_research/researchdesk
 EARNINGS INSIGHT John Butters, VP, Sr. Earnings Analyst jbutters@factset.com Media Questions/Requests media_request@factset.com S&P 500 August 5, 2016 Key Metrics Earnings Scorecard: With 86% of the companies
Exchange Traded Funds. An Introductory Guide. For professional clients only
 Exchange Traded Funds An Introductory Guide For professional clients only Exchange-Traded Funds (ETFs) started to be used in Europe in the early 2000s but over the past few years they have grown their
To receive this report via e-mail, please go to: www.factset.com/data/news_research/researchdesk
 EARNINGS INSIGHT John Butters, VP, Sr. Earnings Analyst jbutters@factset.com Media Questions/Requests media_request@factset.com S&P 500 July 1, 2016 Key Metrics Earnings Growth: For Q2 2016, the estimated
the distribution. Semtech and Paragon Offshore are ranked near or at the bottom of their current indices.
 Columbia Pipeline to Join the S&P 500; Other Changes to S&P MidCap 400 &S&P SmallCap 600 New York, NY, June 23, 2015 S&P Dow Jones Indices will make the following changes to the S&P 500, S&P MidCap 400
Listed Investment Companies (LICs) Research Methodology
 Research Methodology") Listed Investment Companies (LICs) Research Methodology May 2011 2011 Morningstar Australasia Pty Ltd. All information contained in this document is the property of Morningstar Australasia Pty Ltd ABN
Listed Investment Companies (LICs) Research Methodology May 2011 2011 Morningstar Australasia Pty Ltd. All information contained in this document is the property of Morningstar Australasia Pty Ltd ABN
Practice Essentials. Index-Linked Insurance Products 201 THE S&P MIDCAP 400 AND ITS ROLE IN INDEXED INSURANCE PRODUCTS
 Index-Linked Insurance Products 201 Practice Essentials THE S&P MIDCAP 400 AND ITS ROLE IN INDEXED INSURANCE PRODUCTS S&P Indices licenses insurance carriers to use the S&P 500 and the S&P MidCap 400 within
Protective Indexed Annuity II
 Protective Indexed Annuity II Fixed Indexed Annuity Profile PAC.5093 (02.14) Protective Life annuities are designed specifically to help you more effectively prepare for and experience retirement. The
MSCI PRIVATE ASSET INVESTMENT CONFERENCE
 MSCI PRIVATE ASSET INVESTMENT CONFERENCE Jun 30, 2015 Tokyo MSCI is pleased to invite you to the MSCI Private Asset Investment Conference which is widely reputed as the prime real estate investment event
National Credit Default Rates Continued Their Upward Trend in December 2014 According to the S&P/Experian Consumer Credit Default Indices
 National Credit Default Rates Continued Their Upward Trend in December 2014 According to the S&P/Experian Consumer Credit Default Indices Four of the Five Cities Saw Default Rates Increase in December
Operating Leases: Implications for Lessees Credit. Overview and Conclusions
 Special Report Overview and Conclusions Operating leases are widely used by businesses to gain control of assets, such as real estate or equipment, for a fixed duration less than the full economic life
To receive this report via e-mail, please go to: www.factset.com/data/news_research/researchdesk
 EARNINGS INSIGHT John Butters, VP, Sr. Earnings Analyst jbutters@factset.com Media Questions/Requests media_request@factset.com S&P 500 September 2, 2016 Key Metrics Earnings Scorecard: With 498 of the
Methodology Guide for NYSE Indexes
 Methodology Guide for NYSE Indexes > NYSE World Leaders Index SM (Symbol: NYL.ID) > NYSE U.S. 100 Index SM (Symbol: NY.ID) > NYSE International 100 Index SM (Symbol: NYI.ID) > NYSE TMT Index (Symbol: NYY.ID)
RATINGS* Vanguard Russell 1000 is an exchange-traded fund incorporated in the USA. The Fund seeks to track the performance of the Russell 1000 Index.
 Vanguard Russell 1000 Index Fund (VONE) Tearsheet as of 7:57 pm, May 02, 2014. Summary RATINGS* DIAMONDS* ETFG RISK RATING 2.65 ETFG REWARD RATING 4.09 Description Vanguard Russell 1000 is an exchange-traded
MSCI Global Minimum Volatility Indices Methodology
 MSCI Global Minimum Volatility Indices Methodology Table of Contents Section 1: Introduction... 3 Section 2: Characteristics of MSCI Minimum Volatility Indices... 3 Section 3: Constructing the MSCI Minimum
INDEX-BASED INVESTING
 PART 4 INDEX-BASED INVESTING N. (IN-DEKS BEYST IN-VEST-ING) AN INVESTMENT BASED ON PRODUCTS LINKED TO INDICES, SUCH AS INDEX MUTUAL FUNDS, ETFs AND OPTIONS CONTRACTS. 1 INDEX-BASED INVESTING Index-based
The Nuts and Bolts of Fixed Indexed Annuities
 PRACTICE ESSENTIALS INSURANCE 101 U.S. The Nuts and Bolts of Fixed Indexed Annuities CONTRIBUTORS Alan Grissom Global Head of Insurance Ryan Christianson Channel Management Associate ryan.christianson@spdji.com
MSCI Dividend Masters Indexes Methodology
 Index Methodology MSCI es Methodology July 2014 msci.com Contents 1 Introduction... 3 2 Index Construction Methodology... 3 Section 2.1: Applicable Universe... 3 Section 2.2: Security Selection... 3 Section
S&P Target Date Scorecard
 Year-End 15 CONTRIBUTORS A. Silvia Kitchener Director LatAm Equity Indices silvia.kitchener@spdji.com Philip Murphy, CFA Vice President U.S. and Canadian Equity Indices philip.murphy@spdji.com S&P Target
August 2010. State of Nevada Deferred Compensation Plan. Manager Due Diligence Education Session
 August 2010 State of Nevada Deferred Compensation Plan Manager Due Diligence Education Session Fiduciary Responsibility Investment prudence relies on process, not investment results Three investment principles
Strategic Research: Contracts For Difference
 Strategic Research: Contracts For Difference Ian Littlewood Contracts For Difference April 2007 Strategic Research reports from Thomson Financial are designed to enable strategic decision-making for investor
CONSUMER CREDIT DEFAULT RATES DECREASE IN SEPTEMBER 2015 ACCORDING TO THE S&P/EXPERIAN CONSUMER CREDIT DEFAULT INDICES
 CONSUMER CREDIT DEFAULT RATES DECREASE IN SEPTEMBER 2015 ACCORDING TO THE S&P/EXPERIAN CONSUMER CREDIT DEFAULT INDICES Four of the Five Cities Report Default Rate Decreases in September 2015 New York,
Laddering a Portfolio of Municipal Bonds
 CONTRIBUTORS J.R. Rieger Global Head Fixed Income Indices james.rieger@spdji.com Tyler Cling Senior Manager Fixed Income Indices tyler.cling@spdji.com Bond laddering is a strategy that calls for maturity
Mobilizing capital towards a low-carbon economy
 Mobilizing capital towards a low-carbon economy Anthony Hobley CEO, Carbon Tracker Initiative Bruegel, Brussels 27 th April 2015 Who Are We? Identity Mission Strategy Carbon Tracker is a non profit financial
Dow Jones Composite All REIT Indices Methodology
 Dow Jones Composite All REIT Indices Methodology August 2013 S&P Dow Jones Indices: Index Methodology Table of Contents Introduction 3 Highlights and Index Family 3 Eligibility Criteria 4 Index Eligibility
Workshop B: Credit Spread Trends In The Energy Sector
 Workshop B: Credit Spread Trends In The Energy Sector James West Director, FIOTC Product Management 26 November, 2014 Permission to reprint or distribute any content from this presentation requires the
The J.P. Morgan MOZAIC Index (USD)
") Nationwide New Heights Fixed Indexed Annuities Multi-asset Index Brochure The J.P. Morgan MOZAIC Index (USD) An index designed to achieve consistent, steady growth in a variety of market environments A
Nationwide New Heights Fixed Indexed Annuities Multi-asset Index Brochure The J.P. Morgan MOZAIC Index (USD) An index designed to achieve consistent, steady growth in a variety of market environments A
BlueBay Asset Management LLP Environmental, Social and Governance (ESG) Investment Risk Policy
 Investment Risk Policy") BlueBay Asset Management LLP Environmental, Social and Governance (ESG) Investment Risk Policy INTRODUCTION This policy document outlines BlueBay Asset Management LLP s ( BlueBay ) approach to integrating
BlueBay Asset Management LLP Environmental, Social and Governance (ESG) Investment Risk Policy INTRODUCTION This policy document outlines BlueBay Asset Management LLP s ( BlueBay ) approach to integrating
WTAS Valuation Services Group
 WTAS Valuation Services Group Information & Overview March 2014 Presented to 1 Table of Contents I. WTAS Valuation Services Overview II. WTAS Overview III. Services Offering IV. Approach V. Professionals
A Closer Look at Interest Rate Floors
 A Closer Look at Interest Rate Floors CONTRIBUTOR Vishal Arora Director Global Index Research & Design vishal.arora@spdji.com Currently, there is much debate in the market surrounding if and when interest
McKinley Capital U.S. Equity Income Prospects for Performance in a Changing Interest Rate Environment
 March 25, 2014 McKinley Capital U.S. Equity Income Prospects for Performance in a Changing Interest Rate Environment This paper analyzes the historic performance of the McKinley Capital Management, LLC
MSCI Quality Indices Methodology
 Methodology Contents Contents... 2 Section 1: Introduction... 3 Section 2: Index Construction Methodology... 4 Section 2.1: Applicable Universe... 4 Section 2.2: Determination of Quality Score... 4 Section
Active U.S. Equity Management THE T. ROWE PRICE APPROACH
 PRICE PERSPECTIVE October 2015 Active U.S. Equity Management THE T. ROWE PRICE APPROACH In-depth analysis and insights to inform your decision-making. EXECUTIVE SUMMARY T. Rowe Price believes that skilled
Cybersecurity companies, you are under attack
 02/2016 Cybersecurity companies, you are under attack The cyber threat is omnipresent. A quick look at newspaper headlines reveals that companies from a variety of sectors such as financial services provider
Retirement Chapters 10 SM Fixed Index Annuity
 Retirement Chapters 10 SM Fixed Index Annuity Personalized Hypothetical Annuity Illustration Prepared For Im A. Client Prepared On May 1, 2015 Prepared By Im A. Producer Producer Firm 123 Any Street Anyplace,
Guardian Life Insurance, Core Operating Subsidiaries 'AA+' Ratings Affirmed On Criteria Review, Outlook Negative
 Research Update: Guardian Life Insurance, Core Operating Subsidiaries 'AA+' Ratings Affirmed On Criteria Review, Outlook Negative Primary Credit Analyst: Neal I Freedman, New York (1) 212-438-1274; neal.freedman@standardandpoors.com
Target Date Versus Relative Risk: A Comparison of 2 Retirement Strategies
 Versus Relative Risk: A Comparison of 2 Retirement Strategies MARCH 2014 CONTRIBUTOR Peter Tsui Director, Index Research & Design peter.tsui@spdji.com Target date funds have grown significantly over the
Clime Capital Limited (CAM)
") Clime Capital Limited (CAM) Listed Managed Investments September 2012 Quarterly Review WHO IS IIR? Independent Investment Research Pty Ltd, IIR is an independent investment research house in Australia.
Clime Capital Limited (CAM) Listed Managed Investments September 2012 Quarterly Review WHO IS IIR? Independent Investment Research Pty Ltd, IIR is an independent investment research house in Australia.
Separately managed accounts
 FOR INSTITUTIONAL/WHOLESALE/PROFESSIONAL CLIENTS AND QUALIFIED INVESTORS ONLY - NOT FOR RETAIL USE OR DISTRIBUTION Separately managed accounts A J.P. Morgan Global Liquidity solution Separately managed
ESG and Fixed Income Investing
 ESG and Fixed Income Investing ESG and Fixed Income Investing Laura Nishikawa, Head of ESG Fixed Income Research CSR Investing Summit New York, NY 22 July 2014 3 Introducing MSCI ESG Research ESG ratings