City of Miami Comprehensive Neighborhood Master Plan TRANSPORTATION ELEMENT Data Inventory and Analysis November 2004
|
|
|
- Dominic Norman
- 8 years ago
- Views:
Transcription
1 City of Miami Comprehensive Neighborhood Master Plan TRANSPORTATION ELEMENT Data Inventory and Analysis November 2004

2 TABLE OF CONTENTS TRANSPORTATION ELEMENT DATA INVENTROY AND ANALYSIS 1 DEFINITION OF TERMS AND CONCEPTS 1 CLASSIFICATION OF MAJOR THOROUGHFARES 1 LEVEL OF SERVICE 2 EXISTING TRANSPORTATION DATA REQUIREMENTS 6 EXISTING TRANSPORTATION MAP SERIES 6 ANALYSIS OF EXISTING TRANSPORTATION SYSTEMS 25 FUTURE TRANSPORTATION DATA REQUIREMENTS 56 FUTURE TRANSPORTATION MAP SERIES 56 ANALYSIS OF FUTURE TRANSPORTATION SYSTEMS 67 i

3 MAPS Map TR-1: Major Thoroughfares by Number of Lanes (2004) 9 Map TR-2: Major Thoroughfares by Functional Classification (2004) 10 Map TR-3: Limited Access Facilities, Significant Parking Facilities (2004) 11 Map TR-4: Major Trip Generators and Attractors (2004) 12 Map TR-5: Existing Transit Facilities (2004) 13 Map TR-6: Existing Bicycle Facilities (2004) 14 Map TR-7: Existing Pedestrian Facilities (2004) 15 Map TR-8.1: Existing Peak Hour Vehicular LOS on Major Thoroughfares (2004) 16 Map TR-8.2: Existing Peak Hour Person Trip LOS on Major Thoroughfares (2004) 17 Map TR-9: Existing Bicycle Levels of Service (LOS) (2004) 18 Map TR-10: Existing Pedestrian Levels of Service (LOS) (2004) 19 Map TR-11: Freight/Passenger Rail Facilities (2004) 20 Map TR-12: Hurricane Evacuation Routes (2004) 21 Map TR-13: Existing Seaport Facilities (2004) 22 Map TR-14: Intermodal Terminals and Access to such Facilities (2004) 23 Map TR-15: Major Thoroughfares by Number of Lanes (2025) 24 Map TR-16: Major Thoroughfares by Functional Classification (2025) 58 Map TR-17: Limited Access Facilities, Significant Parking Facilities (2025) 59 ii
 17 Map TR-9: Existing Bicycle Levels of Service (LOS) (2004) 18 Map TR-10: Existing Pedestrian Levels of Service (LOS) (2004) 19")
4 Map TR-18: Major Trip Generators and Attractors (2025) 60 Map TR-19: Future Metrobus Transit Facilities (2025) 61 Map TR-20: Future Bicycle Facilities (2025) 62 Map TR-21: Future Pedestrian Facilities (2025) 63 Map TR-22.1: Future Peak Hour Vehicular LOS on Major Thoroughfares (2025) 64 Map TR-22.2: Future Peak Hour Person Trip LOS on Major Thoroughfares (2025) 65 Map TR-23: Future Intermodal Terminal and Access to such Facilities (2025) 66 iii
 65 Map TR-23: Future Intermodal Terminal and")
5 TABLES Table TR-1: Person Trip V/C Level of Service Classifications 4 Table TR-2: Bicycle Level of Service Classifications 5 Table TR-3: Pedestrian Level of Service Classifications 5 Table TR-4: Existing Traffic Volumes Vehicle Methodology 26 Table TR-5: Existing Traffic Volumes Person Trip Methodology 30 Table TR-6: Transit Service Characteristics 50 Table TR-7: Primary Land Uses Adjacent to Major Transportation Corridors 54 Table TE-1: Future 2025 AADT Estimates 72 Table TE-2: Future 2025 Peak Hour Volumes 78 Table TE-3: Future 2025 Peak Hour Two-way Roadway Capacity 84 Table TE-4: Future 2025 Peak Hour Roadway LOS 90 Table TE-5: Future 2025 Transit Capacity 96 Table TE-6: Future 2025 Transit Volume 102 Table TE-7: Future 2025 Person Trip LOS 108 Table TE-8: Combined LOS Methodology Results 114 iv

6 TRANSPORTATION ELEMENT DATA INVENTORY AND ANALYSIS Local governments that have all or part of their jurisdiction included within the urbanized area of a Metropolitan Planning Organization (MPO) are required to prepare and adopt a Transportation Element consistent with the provisions of Chapter 163, Part III of the Florida Statutes. The purpose of the Transportation Element is to plan for a multimodal transportation system that places emphasis on transportation mode choice within the City of Miami, particularly non-automobile. The objective of the Transportation Element Data Inventory and Analysis is to describe and analyze transportation resources within the City of Miami, project future conditions and prepare a foundation for the formulation of goals, objectives, policies and implementation programs. Data has been collected, analyzed and portrayed in text and graphic formats including a series of transportation maps. In this analysis, the City s Comprehensive Plan horizon year is The Transportation Element Data Inventory and Analysis presents: An analysis of the existing transportation systems, including the ability of transportation facilities and services to serve existing land uses and the adequacy of the existing and projected transportation system to provide adequate emergency evacuation routes; Growth trends and travel patterns, including relationships between land use and transportation systems; Projected transportation system levels of service; An analysis of local and state transportation programs; Maintenance of adopted level of service standards; and Land use policy implications of transportation management programs necessary to promote public transportation. DEFINITIONS OF TERMS AND CONCEPTS CLASSIFICATION OF MAJOR THOROUGHFARES Major thoroughfares are categorized into functional classification groups according to the character of service. The four functional classification groups for urban areas are principal arterials, minor arterials, collectors and local streets. The extent and degree of access control is a significant factor in defining the functional classification of a roadway. Regulated limitation of access is necessary on arterials to enhance their primary function of mobility, while the primary function of local streets is to provide access. Functional classifications for major thoroughfares are defined in A Policy on Geometric Design of Highways and Streets (American Association of State Highway and Transportation Officials, 2001). 1

7 Principal Arterials. The principal arterial system serves the major centers of activity and the highest volume traffic corridors of urbanized areas. Principal arterials typically serve longer distance trips. Although principal arterials constitute a small percentage of the total roadway network, they carry a high proportion of total urban traffic. The principal arterial system also carries most of the trips entering and leaving the urban area. Service on principal arterials is normally continuous with relatively high traffic volumes, long average trip lengths and high operating speeds. Service to abutting land is typically subordinate to the provision of travel service and major traffic movements. Typical principal arterials include interstates, freeways and other limited access facilities. Minor Arterials. The minor arterial system interconnects and supports the principal arterial system. It accommodates trips of moderate lengths at a lower level of mobility than provided on principal arterials. Minor arterials provide continuity among communities and may also carry local bus routes. Ideally, minor arterials do not penetrate identifiable neighborhoods. The spacing of minor arterials is typically not much greater than one mile in most urbanized areas. Collectors. The collector street system provides vehicular access to and mobility within residential neighborhoods, commercial and industrial areas. It differs from the arterial system in that it penetrates neighborhoods and distributes trips from arterials to their ultimate destinations. Conversely, collectors also transition vehicular traffic from local streets onto the arterial system. The collector street system may carry local bus routes. Service on collectors has relatively moderate traffic volumes, average trip lengths and average operating speeds. Local Streets. The local street system comprises all roadways not in one of the higher systems. It provides direct access to abutting land uses and connections to the higher order systems. It offers the lowest level of vehicular mobility and usually contains no bus routes. Service to through traffic is often discouraged on local streets. Service on local streets has relatively low average traffic volumes, short average trip length or minimal through traffic movements and high land access for abutting property. LEVEL OF SERVICE Level of Service (LOS) standards can be determined for various public facilities. Within the Miami urbanized area, level of service measurements are maintained for the automobile and for person trips for transportation corridors defined in the City s report entitled Transportation Corridors: Meeting the Challenge of Growth Management in Miami. In addition, the Miami-Dade Transportation Plan for the Year 2025 also places special emphasis on meeting the needs of those individuals who walk or bike for mobility. Therefore, the Long Range Transportation Plan (LRTP) conducted and inventory of existing conditions for all roads within the MPO s long range street network, including those in the City of Miami, to determine the bicycle and pedestrian levels of service for each roadway segment. Level of Service standards for automobile and person trip, bicycle and pedestrian travel modes are discussed below. 2

8 Automobile Level of Service. The Traffic Engineering Handbook (Institute of Transportation Engineers 1999) defines automobile level of service (LOS) for roadways as: A qualitative measure that characterizes operational conditions within a traffic stream and perception of these conditions by motorists and passengers. The descriptions of individual levels of service characterize these conditions in terms of factors such as speed and travel time, freedom to maneuver, traffic interruptions and comfort and convenience. The automobile LOS definition can be further simplified as the ratio of traffic volume to roadway capacity. The six (6) different levels of service (LOS) are described below: Level of Service A This LOS represents and ideal condition of primarily freeflow traffic operations at average travel speeds. Vehicles are completely unimpeded in their ability to maneuver within the traffic stream and delays at intersections are minimal. Level of Service B This LOS represents reasonably stable, unimpeded traffic flow at average travel speeds. The ability to maneuver within the traffic stream is only slightly restricted and stopped delays are not bothersome. Level of Service C Traffic flow is stable but drivers are becoming restricted in their choice of speeds and ability to maneuver. This service level is often selected as being an appropriate criterion for roadway design purposes. Level of Service D Most motorists would consider this LOS unsatisfactory, as traffic flow is unstable. Driving speeds are tolerable for short periods but are subject to sudden variance. Time delays do occur due to high volumes of traffic. The ability to maneuver and choose speed is severely restricted. Level of Service E Traffic flow is unstable as speeds and flow rates vary. Traffic flow has either stopped or is maintained at a low speed. There is little independence in selection of speeds or ability to maneuver. Driving comfort is low and accident potential is high due to limited space between vehicles and rapidly changing speeds. The roadway may act as a storage area resulting from downstream congestion. Generally, a facility at Level of Service E is operating at or above capacity. Level of Service F Traffic flow has generally come to a stopped condition, but will have slight inconsistent movement. No independence in selection of speeds or ability to maneuver exists at this level of service. Driving comfort is low and accident potential is high due to limited space between vehicles and rapidly changing speeds. The roadway is congested. Generally, a facility at Level of Service F is operating above capacity. 3

9 Person Trip Level of Service. The City of Miami has adopted through its Transportation Element a progressive method for measuring the capacity of a roadway for the purpose of transportation concurrency review in which the fundamental measure of travel is the person trip and not the vehicle trip. The transportation corridor capacity is the sum of two or more modes of converted to person trip travel (i.e. vehicle + public transit) instead of vehicle capacity alone. The calculated person trip levels of service within the Transportation Corridors yield letter grades A through F, as do those using the vehicle-based methodology, to denote utilization as a percent of total capacity. For the Transportation Corridors (TC) in Miami, the same categories for each letter-grade have been used, substituting the Transportation Corridor s person trips for vehicles in the V/C measurement methodology, as shown in Table TR-1. The approach takes into account that urban areas serve and provide many options for personal mobility. The goal is to find how many people a corridor can handle at particular service levels. Roadways have capacities derived from several factors including space constraints, intersection location and geometric configuration. Automobiles that travel on those roadways carry people, often more than one. Sidewalks provide the opportunity for people to walk, as the presence of bicycle lanes afford people the opportunity to bike. Transit, whether it be buses or trains has capacities for people based on physical dimensions and frequency of operation. Capacities can be increased or decreased dependant on the provision of these factors. As a community develops and becomes more mature, its land uses are able to support more alternative modes of transportation. The planning for these modes is integral to the full development of a healthy and vibrant community, from a quality of life perspective as well as an economic perspective. Failure to provide such basic infrastructure would lead to a competitive disadvantage in the marketplace. Table TR-1 Person Trip V/C Level of Service Level of Service TC Person Trip Volume as a percent of TC Person Trip Capacity A B C D E F Source: City of Miami, Transportation Corridors: Meeting the Challenge of Growth Management in Miami Bicycle Level of Service. Bicycle level of service measurements were preformed by the Miami-Dade County MPO to assign a level of service, A through F, to all arterial and collector streets within the City of Miami and Miami-Dade County. Level of service was calculated based on six factors including recorded traffic volumes, percent heavy vehicles, posted speed limit, pavement width and number of travel lanes, pavement 4

10 condition and presence of shoulder or bicycle lane. Each of these variables was weighted by coefficients derived by stepwise regression modeling importance. A numerical score, generally between 0.5 and 6.5, was determined using a regression equation and stratified to a level of service grade. The range of scores corresponding to the six (6) different levels of service for bicyclists is described in the Table TR-2. Table TR-2 Bicycle Level of Service Classifications Level of Service Range of Scores A 1.5 B >1.5 and 2.5 C >2.5 and 3.5 D >3.5 and 4.5 E >4.5 and 5.5 F >5.5 Source: 2002 FDOT Quality/Level of Service Manual Pedestrian Level of Service. Miami-Dade MPO assigned a level of service, A through F, to all arterial and collector streets within the City of Miami and Miami-Dade County. Level of service was calculated based on five factors including lateral separation between the vehicle and pedestrian, recorded traffic volumes, posted travel speed, vehicle mix and frequency of driveways along the road. Each of these variables was weighted by coefficients derived by stepwise regression modeling importance. A numerical score, generally between 0.5 and 6.5, was determined and stratified to a level of service grade. The range of scores corresponding to the six (6) different levels of service for pedestrians is described in the Table TR-3. Table TR-3 Pedestrian Level of Service Classifications Level of Service Range of Scores A 1.5 B >1.5 and 2.5 C >2.5 and 3.5 D >3.5 and 4.5 E >4.5 and 5.5 F >5.5 Source: 2002 FDOT Quality/Level of Service Manual 5

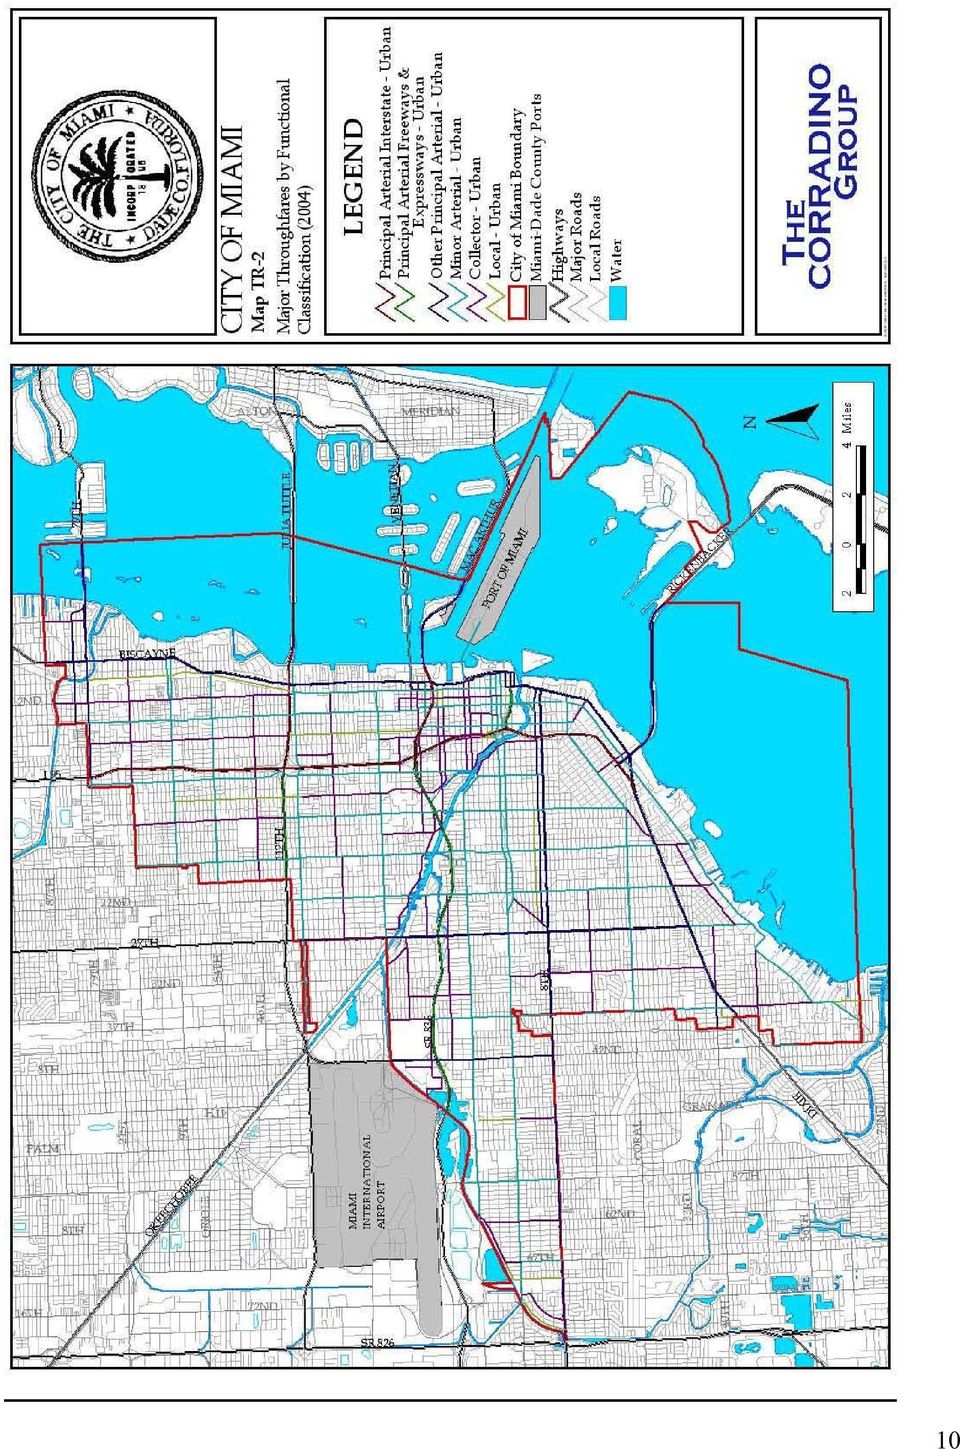
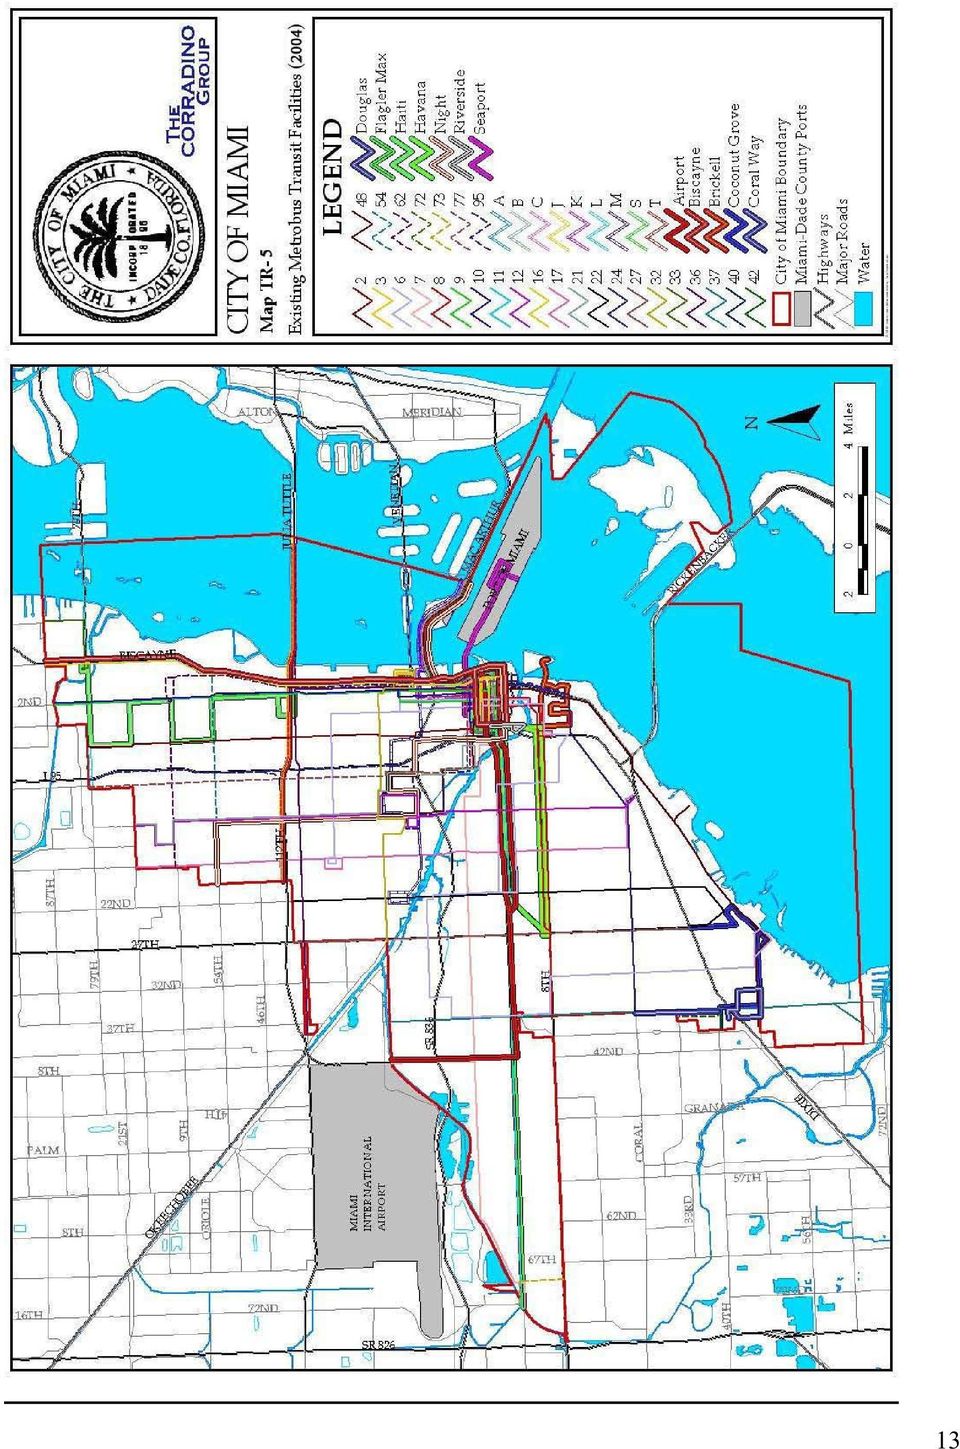
11 EXISTING TRANSPORTATION DATA REQUIREMENTS EXISTING TRANSPORTATION MAP SERIES The following series of maps represent existing conditions for the transportation network on a multi-modal basis. This includes the roadway system, public transit system and bicycle and pedestrian facilities within the City of Miami. Map TR-1: Major Thoroughfares by Number of lanes (2004) identifies each major thoroughfare within the City by the number of through lanes for the facility. Map TR-2: Major Thoroughfares by Functional Classification (2004) identifies arterial and collector streets and their functional classification for each facility. The functional classification system indicates the role of each thoroughfare in meeting current travel demands, assists in defining land use relationships, and reveals the jurisdiction responsible for maintenance. Map TR-3: Limited Access Facilities, Significant Parking Facilities (2004) delineates the location of Interstate 95, Interstate I95 (SR 112 Airport Expressway), Interstate 395 (SR 836 Dolphin Expressway), and State arterials which traverse the City of Miami. Significant parking facilities were also identified as the: Miami-Dade Community College Orange Bowl Government Center Miami Parking Authority Surface Lots Metrorail Stations Downtown Hospitals Significant parking facilities have been limited to facilities with more than 100 parking spaces. Significant parking facility information was obtained from the Miami Parking Authority. Map TR-4: Major Trip Generators and Attractors (2004) identifies the location of the major trip attractors in Miami including the Miami Convention Center, Miami Arena, American Airlines Arena, Bayside Marketplace, Bayfront Park, James L. Knight International Center, Performing Arts Center, Miami-Dade Community College, various government and judicial buildings, and the Development of Regional Impact Increment I. Map TR-4 also identifies the major trip generators in Miami primarily in the higher density residential areas. The areas shown have a density of ten dwelling units per acre or greater. Map TR-5: Existing Transit Facilities (2004) illustrates the public transit service within the City of Miami. Currently, 49 public transit bus routes (Metrobus) operate within the City, covering an extensive area. In addition, Miami is served by Metrorail and exclusively by Metromover. 6
 identifies arterial and collector streets and their functional classification for each facility.")
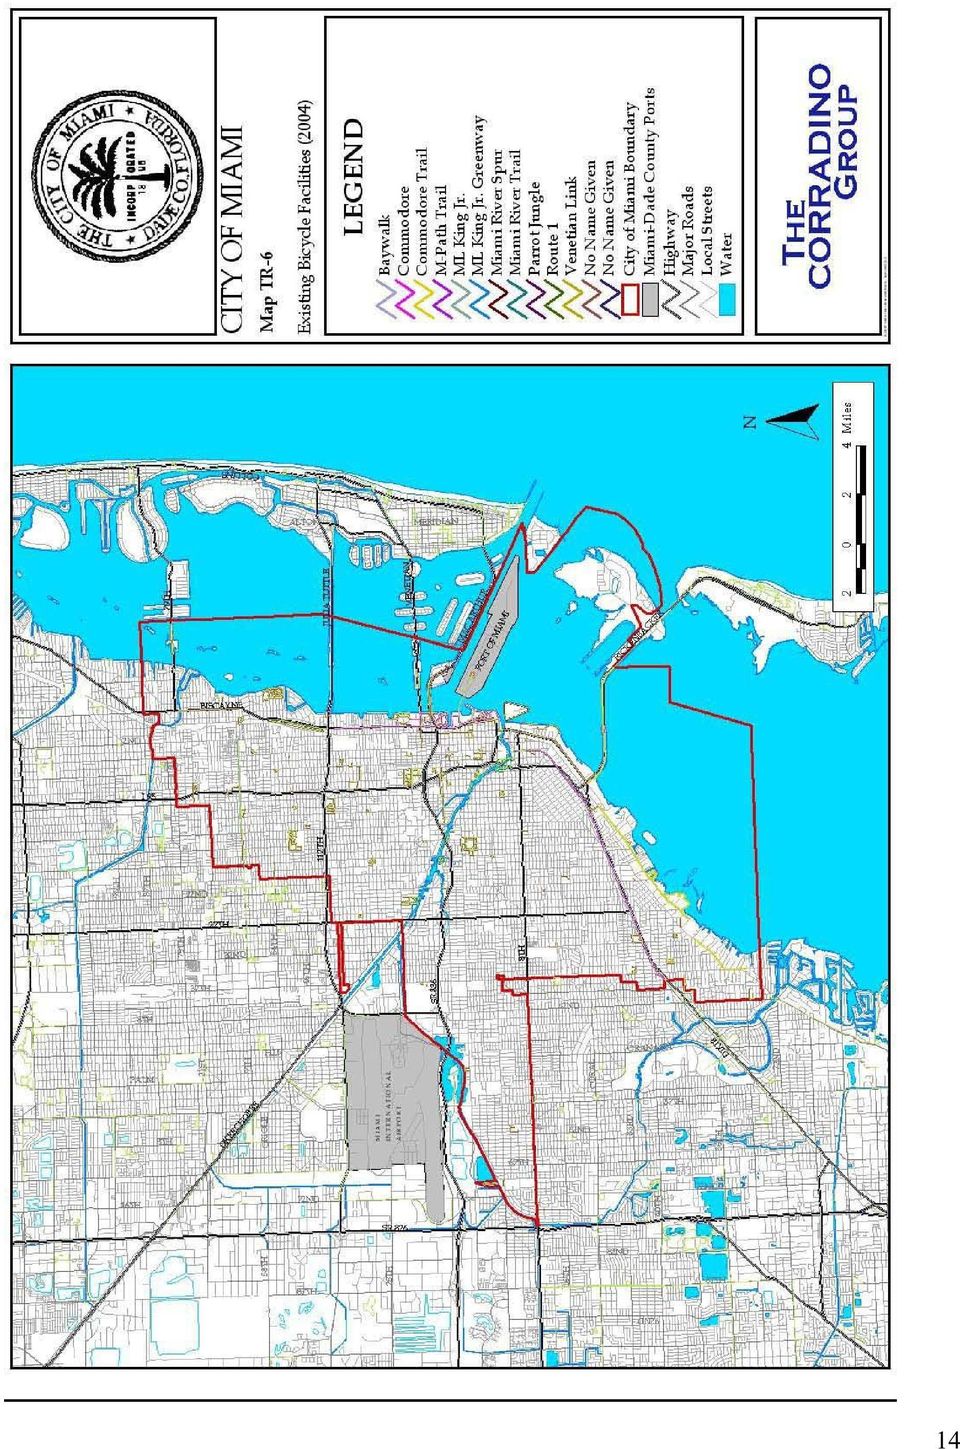
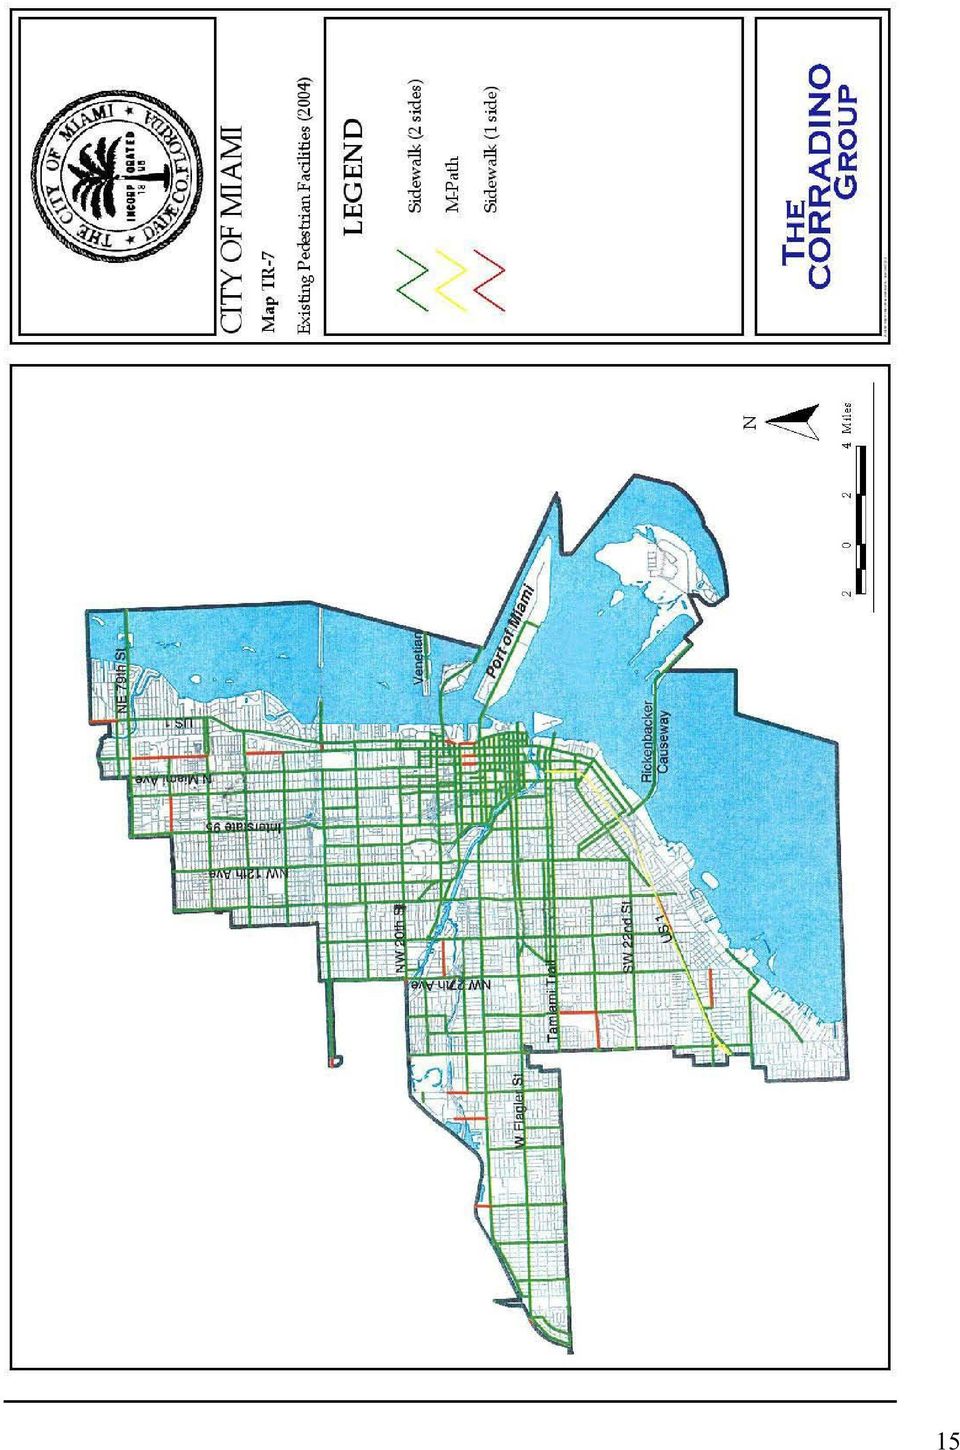
12 Map TR-6: Existing Bicycle Facilities (2004) identifies existing bicycle facilities located within the City of Miami. Several bicycle facilities were identified in the City. Principal bicycle facilities include the M-Path corridor under the Metrorail from Downtown to Dadeland and bicycle paths in the vicinity of Coconut Grove and Bayshore Drive. Map TR-7: Existing Pedestrian Facilities (2004) delineates the pedestrian facilities with Miami. The pedestrian network within the City is excellent with the majority of local and collector streets throughout the area offering sidewalks on both sides of the roadway. Map TR-8.1: Existing Vehicle Levels of Service (LOS) on Major Thoroughfares (2004) illustrates existing peak hour levels of service calculated for major roadways with the City of Miami. Map TR-8.2: Existing Person Trip Levels of Service (LOS) on Transportation Corridors (2004) illustrates the existing peak hour levels of service for defined transportation corridors within the City based upon the person trip methodology. Map TR-9: Existing Bicycle Levels of Service (LOS) (2004) illustrates level of service calculations conducted by the Miami-Dade County MPO for major roadways with the City of Miami. Map TR-10: Existing Pedestrian Levels of Service (LOS) (2004) illustrates level of service calculations conducted by the Miami-Dade County MPO for major roadways within the City of Miami. Map TR-11: Freight/Passenger Rail Facilities (2004) illustrates the Florida East Coast (FEC) Railroad rail corridor within the City of Miami and CSX rail corridor along the western portion of Miami, south of the Miami International Airport. Map TR-12: Hurricane Evacuation Routes (2004) delineates the County s designated local and regional transportation facilities critical to the evacuation of the coastal population prior to an impending storm. Major evacuation routes within Miami include Biscayne Boulevard (US 1/SR 5), Kennedy Causeway (SR 934), Julia Tuttle Causeway (I-195/SR 112), Venetian Causeway, MacArthur Causeway (I- 395/AiA/US 41), Rickenbacker Causeway, and Interstate 95. The graphic also includes the City s evacuation zones, as provided by the South Florida Regional Planning Council. Map TR-13: Existing Seaport Facilities (2004) illustrates the limits of the Port of Miami south of Interstate 395, and the area of the Miami River Port facilities located along the length of the River. Map TR-14: Intermodal Centers and Access to such Facilities (2004) illustrates the intermodal centers in the City of Miami including the Port of Miami, Downtown Bus Terminal, Omni Bus Terminal, and Greyhound Bus Terminals. Several intermodal 7

13 centers within the City connect Metrobus, Metrorail and Metromover services, including the Financial District Station, Brickell Station, Eighth Street Station, Third Street Station, Government Center Station, First Street Station, Arena/State Plaza Station, the College North Station, Eleventh Street Station, Omni Station, and the School Board Station. In addition, the proximity of the Miami International Airport is illustrated on Map TR-14 to show the influence of the airport on the City of Miami. Transportation Concurrency Exception Area Map TR-15: Transportation Concurrency Exemption Areas Boundary illustrates the boundaries where officials are working to establish a Transportation Concurrency Exception Area (TCEA) for the entire City of Miami (excluding Virginia Key, Watson Island, and the uninhabited islands of Biscayne Bay that have a land use classification of conservation consistent with Rule 9J-5.005(6) of the Florida Administrative Code) as a means to reduce the adverse impact transportation concurrency may have on potential urban infill development and redevelopment within the city. Airport Facilities. The City of Miami has no airport facilities within its municipal boundaries; therefore no associated data, analysis regarding these facilities are presented in the City s Transportation Element Data Inventory and Analysis. As previously mentioned, Map TR-14 illustrates the location of the Miami International Airport to show its proximity to the City and the need for coordination. 8

14 9

15 10
16 11

17 12

18 13
19 14
20 15
21 16
22 17
23 18
24 19
25 20
26 21
27 22
28 23
29 24
30 ANALYSIS OF EXISTING TRANSPORTATION SYSTEMS The Transportation Element for the City of Miami has been coordinated with the Miami- Dade Metropolitan Planning Organization and Miami-Dade County. These resources have been used for information that addresses countywide growth trends, travel patterns and countywide land use and transportation alternatives. Existing Traffic Volumes, Vehicle Trip Methodology. Table TR-4 presents peak hour trip volumes and level of service grades for major thoroughfares within the City of Miami based upon vehicle trip methodology. Existing Traffic Volumes, Person Trip Methodology. Table TR-5 presents person trip capacity information and level of service for transportation corridors within the City of Miami based upon person trip 25
31 26
32 27
33 28
34 29
35 30
36 31
37 32
38 33
39 34
40 35
41 Automobile Level of Service Calculation Methodology. Level of service evaluations for all major roadways within the City were performed using average traffic count information provided by Miami-Dade County and the Florida Department of Transportation. Traffic volumes were converted to peak-hour volumes using K- factors published on FDOT s 2002 Florida Traffic information CD. Many traffic volumes reported by Miami-Dade County were collected in the years 2000, 2001, and These volumes were adjusted to current conditions using the growth rates determined by comparing the 2015 FSUTMS model to the 1999 FSUTMS Validation model. Assumed level of service standards for City and County roadways set forth by Miami-Dade County for roadways located within the County s designated Urban Infill Area were used for the vehicular and person trip peak hour level of service analysis while roadways identified as part of the Florida Intrastate Highway System (FIHS) are assumed to maintain the minimum level of service standards established by the Florida Department of Transportation. The City of Miami recognizes this program for evaluating the traffic impacts to State and County roads that are associated with development petitions inside City limits. In accordance with the County s standards, local roadways within the UIA are allowed to exceed 100% of their traditional Level of Service E vehicle capacity where either public transit service exists and operates with headways less than twenty minutes (120% of LOS E) or where roadways are parallel to exceptional transit service, including commuter rail or express bus service (150% of LOS E). The minimum level of service standard established by the Florida Department of Transportation for limited access facilities is LOS D. Level of service for roadways was determined by comparing the reported traffic volume on the segment to the maximum service capacity listed for the specific facility type and cross section in the 2002 Quality/Level of Service Handbook (Table 4-4) published by the Florida Department of Transportation. Generalized service capacities reported in Table 4-1 of the FDOT Handbook were assigned to the individual roadways within the study area based on the observed traffic signal spacing or interchange spacing along the segment and adjusted using the Arterial/Non-State Roadway Adjustments reported in the table, where appropriate. Volume-to-capacity (V/C) statistics calculated for each segment are measured against volume-to-capacity (V/C) thresholds established for each level of service grade in the Miami-Dade Transportation Plan for the Year Level of service evaluations for roadway segments afforded increased capacity thresholds due to extraordinary transit service were evaluated based on Level of Service E capacities and adjusted to allowable increased levels of service (i.e. E+20/E+50) when the volume-to-capacity ratio was greater than 1.0. Based on this analysis, the Automobile Level of Service for each roadway in Table TR-4 was determined. Peak Hour Person Trip Level of Service Calculation Methodology. The City of Miami has adopted through its Transportation Element a new method for measuring the capacity of a roadway for the purpose of transportation concurrency review in which the fundamental measure of travel is the person trip and not the vehicle trip and 36
42 transportation corridor capacity is the sum of two or more modes of person trip travel (i.e. vehicle + public transit) instead of vehicle capacity alone. Level of service evaluations are performed for the major roadways within the City using person trip volumes developed from the corresponding vehicle trip evaluation tables and transit ridership data provided by Miami-Dade Transit. The level of service evaluations are based upon the best available information and the methodology for calculating peak hour person trip demand and capacity was validated by Miami-Dade Transit. Transit Demand Peak-hour bus ridership is calculated by comparing peak-hour boardings to average weekday boardings. Miami-Dade Transit Agency Bus Boarding Reports were collected for each bus route in the City for which information was available on January 29, This date represents a mid-weekday in peak-season, with school boardings, and for a month in which holidays would not significantly skew the average weekday ridership statistics. Boardings on all runs operating between 7:00 AM and 9:00 AM, and between 4:00 PM and 6:00 PM were totaled. An AM peakhour factor of 6.24 percent and a PM peak-hour factor of 6.08 percent were calculated. The PM factor was applied to average weekday ridership information to derive a peak-hour ridership volume similar to a k factor in vehicle trip methodology. Miami-Dade Transit agreed that this was an acceptable conversion. Peak-hour ridership for Metrorail is based on information published in Miami-Dade Transit s Ridership Technical Report for January The PM peak-hour of ridership is reported as 4:00 PM to 5:00 PM, with 10 percent of all daily boardings occurring during this hour. This peak-hour factor was applied to average weekday boardings. Miami-Dade Transit does not collect time-of-day information on Metromover boardings. Therefore, due to the intermodal connectivity of Metrorail and Metromover, the peak-hour factor of 10 percent reported for Metrorail was applied to Metromover average weekday boardings. Transit Capacity Peak hour bus capacity is based on peak-hour headways published in the Miami-Dade Transit Schedules dated October 2003, and bus capacities for each route as provided by Miami-Dade Transit. Metrorail capacity is based on six car train-sets each with a capacity of 164 passengers per car as directed by Miami-Dade Transit. A peak-hour Metrorail headway of six minutes is based on published information in the Miami- Dade Transit Schedules dated October Metromover capacity is based on individual cars with a capacity of 96 passengers operating on a 90-second headway per Miami-Dade Transit. Person Trips Vehicle trip volumes are converted to person trip volumes by multiplying the number of vehicle trips reported for the individual segment by the assumed vehicle occupancy rate plus the total average weekday transit ridership statistic reported for all routes serving the individual segment. The assumed occupancy rate is 1.34 for the baseline based upon the Southeast Florida Regional Travel Characteristics Study and 1.40 for the long range planning horizon (2025), a slightly higher occupancy rate in accordance with the provisions of the City of Miami Concurrency Management 37
43 System. Roadway links within one-half mile of the Metrorail or Metromover systems were considered to benefit from the remaining capacity of these transit systems. For the long range planning horizon (2025), a linear growth rate of percent is applied to existing (2004) transit ridership statistics reported for each roadway segment to account for some growth in general demand for the system. The growth rate for transit usage represents the annual calculated growth rate from system-wide Metrobus ridership data published by Miami-Dade Transit for Fiscal Year 1997 and Person Trip Capacity Maximum service capacities for measuring level of service are developed by multiplying the vehicle capacity by the assumed vehicle occupancy rate plus the net remaining daily person capacity available for future transit demand along the travel corridor. For the long range planning horizon (2025), the same linear growth rate of percent is applied to the statistic representing the remaining daily person capacity available for transit use. This reflects the assumption that Miami-Dade Transit will, at a minimum, continue to improve its service capacity within the study area in proportion to the increase in demand for transit service by identifying appropriate improvements within the Agency s Five Year Transit Development Plan. Although not included in the capacity calculations for this analysis, additional transit capacity within the study area is anticipated through the year 2008 and beyond to include increased service times, additional bus routes on a new grid routing system and additional municipal bus circulator programs. In discussions with MDT staff, these improvements can not be quantified as specific capacity improvements for roadway segments are not available at this time, but these general improvements are targeted in The Peoples Transportation Plan with funding secured through the halfcent sales tax referendum approved by Miami-Dade County voters. More information about The Peoples Transportation Plan is discussed in the Analysis of Future Transportation System section. Peak Hour Person Trip Level of Service Measurements. Similar to a traditional vehicle capacity methodology, peak hour person trip volume-to-capacity (V/C) statistics calculated for each roadway segment are measured against volume-tocapacity (V/C) thresholds established by the City of Miami for use in performing person trip capacity analysis. These thresholds are documented in a report entitled Transportation Corridors: Meeting the Challenge of Growth Management in Miami. Level of service evaluations for County and State roadway segments afforded increased capacity thresholds due to extraordinary transit service are evaluated based on Level of Service E capacities in the City s volume-to-capacity table for person trips and adjusted to allowable increased levels of service (i.e. E+20/E+50) when the volume-to-capacity ratio exceeds 1.0. Automobile and Person Trip Levels of Service and System Needs Based Upon Existing Design and Operating Capacities. The City of Miami designated a citywide Urban Infill Area (UIA) on November 16, 1999, by adopting policy LU into its Future Land Use Element (amended September 14, 2000, to exclude Virginia Key, Watson Island, and the uninhabited islands of Biscayne Bay that have a 38
44 land use and zoning designation of Conservation) pursuant to Miami-Dade County s designation of an Urban Infill Area lying generally east of the Palmetto Expressway and including all of the City of Miami. The City of Miami recognizes the Miami- Dade Service Concurrency Management Program for evaluating the traffic impacts to State and County roads, not recognized as Transportation Corridors, associated with development petitions inside the City limits. For Transportation Corridors, the City of Miami uses a person trip capacity methodology for calculating level of service. Whereby, this technique calculates the total person trip capacity of all transportation modes utilizing a transportation facility against the total person trip demand for travel on that facility, expressing the resulting ratio in letter grades LOS A through F in the same manner used by the conventional vehicles-over-capacity (V/C) methodology. The adopted level of service within the UIA is LOS E (100% of capacity). Where public transit service exists in the UIA operating with headways of 20 minutes or less, roadways located less than one-half mile of the service may operate at 120% of their capacity. Furthermore, on roadways parallel to exceptional transit service (i.e. commuter rail/express bus), the acceptable level of service is 150% of their capacity. For certain City streets, Miami utilizes a person trip methodology on specified transportation corridors, described above, to determine level of service for all transportation modes. The currently adopted level of service standard for all other transportation modes under the City s jurisdiction is Level of Service E, unless otherwise modified. Existing Modal Split and Vehicle Occupancy Rates. According to journey-to-work data collected in the 2000 Census, single occupant automobile trips account for 66.0 percent of all work trips to-and-from-work reported by residents in Miami. Carpools account for 16.5 percent, public transportation including bus or trolley account for 10.0 percent, other public transportation including streetcar, subway, railroad, and taxi account for 1.5 percent, bicycles account for 0.5 percent, walking for 4.0 percent, and other means including motorcycle account for 1.5 percent. In addition, approximately 2.5 percent of the residents in Miami report working at home. The information reported in the 2000 Census is generally consistent with results from the Southeast Florida Regional Travel Characteristics Study with the exception of transit ridership, in which residents in the City of Miami report much higher usage of public transportation for travel to-and-from-work as compared to the three-county area as a whole. In the Southeast Florida Study, the average vehicle occupancy for Miami- Dade County was reported to be 1.34 persons per vehicle. The vehicle occupancy rate of 1.34 was used for the baseline or existing modal split. However, a higher vehicle occupancy rate of 1.40 was used for the long range planning horizon (2025) in accordance with the provisions of the City of Miami Concurrency Management System and validated by the Florida Department of Transportation. Automobile travel continues to be the easiest and most convenient mode of travel for residents within the City of Miami. However, increasing congestion and limited right-of-way along area roadways, coupled with public transportation improvements targeted by Miami-Dade Transit, have induced higher public transportation usage for Miami residents as compared to the rest of Southeast Florida. Assuming this trend continues, the degrees of freedom and speed of travel found in the automobile may 39
45 lower over the long range planning horizon and therefore make public transportation more attractive to other residents in Miami for travel to-and-from-work. Existing Public Transit Facilities and Routes. The City of Miami has several transit options within its limits; Metromover, Metrorail, and Metrobus. Metrorail. Miami-Dade County s elevated rapid transit system runs from Kendall through South Miami, Coral Gables, and downtown Miami; to the Civic Center/Jackson Memorial Hospital area; and to Brownsville, Liberty City, Hialeah, and Medley in northwest Miami-Dade, with connections to Broward and Palm Beach counties at the Tri-Rail/Metrorail transfer station. The 11 accessible Metrorail stations within the City of Miami are about one-mile apart, providing easy access for bus riders, pedestrians, and passengers being dropped off and picked up. The stations in the City include Douglas Road, Coconut Grove, Vizcaya, Brickell, Government Center, Overtown/Arena, Culmer, Santa Clara, Allapattah, and Earlington Heights. Metrorail runs 24 hours a day, seven days a week. Trains arrive every six minutes during weekday rush hours, every 10 minutes at midday, and every minutes after 6 p.m. Weekday service after midnight is hourly. Weekend service runs every 15 minutes until approximately 8 p.m., then every 30 minutes until midnight. Service is hourly after midnight on weekends. Metromover. Metromover is a free automated people-mover system that serves downtown Miami from Omni to Brickell and connects with Metrorail at the Government Center and Brickell stations. Metromover links many of downtown Miami s major office buildings, hotels, and retail centers, the Stephen P. Clark Government Center, the Cultural Plaza (Miami Art Museum, Historical Museum, Main Library), and the Brickell business district. Metromover has a downtown inner loop and Omni and Brickell on the outer loop. Service on the outer loop ends at midnight. Service on the inner loop operates 24 hours a day. Metrobus. Forty-nine Metrobus routes serve the City of Miami, including Routes 2, 3, 6, 7, 8, 9, 10, 11, 12, 16, 17, 21, 22, 24, 27, 32, 33, 36, 37, 40, 42, 48, 54, 62, 72, 73, 77, 95, A, B, C, J, K, L, M, S, T, Flagler Max, Seaport Connection, Coconut Grove Circulator, Brickell Key Shuttle, Little Havana Connection, Little Haiti Circulator, Night Owl, Airport Owl, Coral Way Max, Douglas Bridge, Riverside Shuttle, and Biscayne Max. Six additional routes run along Intestate 95 in Miami providing rush hour service only. The forty-nine routes directly serving Miami are illustrated in Map TR-5 and described below: Route 2 provides service to the Mall at 163 rd Street, Parkway Regional Hospital, Overtown Metrorail Station, Downtown Miami Bus Terminal, Main Library, Historical Museum of South Florida, and the Miami Museum of Art. Headways are maintained at 15 minutes during the weekday, 60 minutes during the weeknight, 20 minutes on Saturday and 30 minutes on Sunday. Ridership data from Miami-Dade Transit shows that approximately 3,963 passengers per weekday and 96,730 monthly passengers access this route. 40
46 Route 3 provides service to the Wal-Mart and Diplomat Mall in Broward County, Mall at 163 rd Street, Aventura Mall, Omni Metro Mover Bus Terminal, Government Center Metrorail Station, Main Library, and the Downtown Miami Bus Terminal. Headways are maintained at 20 minutes throughout the weekday and Sunday, 60 minutes during the weeknight and 15 minutes on Saturdays and 20 minutes on Sundays. Ridership data indicates that approximately 12,881 passengers per weekday and 270,492 passengers per month use this route. Route 6 provides service from the Coconut Grove and Brickell Metrorail Stations, and the Miami Avenue Metromover Station as well as providing service from downtown Miami, Little Havana, and Musa Isle. Headways are maintained at 60 minutes during all operating periods. Ridership data indicates that approximately 230 passengers per weekday and 4,829 per month use this route. Route 7 provides service to the City of Sweetwater, Dolphin Mall, Miami International Mall, Mall of the Americas, City of Miami Springs, Miami International Airport, Little Havana, Downtown Miami Bus Terminal, MDC Downtown Campus, Overtown/Arena Metrorail Station, Main Library, Historical Museum of South Florida, and the Miami Art Museum. Headways are maintained at 20 minutes during the weekday peak period and Saturdays and 30 minutes on Sundays. Ridership data indicates that approximately 3,712 passengers per weekday and 102,560 passengers per month use this route. Route 8 provides service to the Florida International University Bus Terminal, FIU South Campus, Westchester Shopping Center, Little Havana, Calle Ocho, the Brickell Metrorail Station, MDC Downtown Campus Brickell Metrorail Station, and the Downtown Bus Terminal. Headways are maintained at 10 minutes during the weekday peak, 15 minutes on Saturdays and 20 minutes on Sundays. Ridership data indicates that approximately 7,536 passengers per weekday and 199,134 passengers per month use this route. Route 9 offers service from the Downtown Terminal and the Government Center Metrorail Station to the Mall at 163 rd Street, Aventura, North Miami, and North Miami Beach, Main Library, Miami Shores, and the Miami Art Museum. Route 9 operates seven days a week with headways of 10 minutes during the weekday peak period and 40 minutes curing the weekday off-peak period. Weekend service is provided every 40 minutes on Saturdays and 60 minutes on Sundays. Ridership information indicates that approximately 4,911 passengers per weekday and 110,192 monthly passengers use this service. Route 10 provides service form the Downtown Terminal and Government Center Metrorail Station, as well as from the Mall at 163 rd Street, North Miami, North Miami Beach, Main Library, and the Miami Art Museum. Service is provided seven days a week. Headways are 20 minutes during the weekday peak periods, 40 minutes during the off-peak periods, including Saturdays, 30 minutes on weekday evenings and 60 minutes on Sundays. Average monthly ridership totals 41
47 are 57,208 passengers over the month and approximately 2,533 passengers per weekday. Route 11 offers service to the Dade County Auditorium, Government Center Metrorail Station, Downtown Terminal, Mall of the Americas, and the FIU University Park Campus. Headways are 7.5 minutes during the weekday peak periods, 10 minutes during the off-peak and 60 minutes in the evening. Saturday headways are 12 minutes during the AM, 10 minutes at midday, and 60 minutes in the evening. Sunday headways are 15 minutes during daytime operating periods with 60 minutes in the evening. Ridership data indicates that approximately 12,783 passengers per weekday and 359,717 passengers per month use this route. Route 12 provides service to the Northside Metrorail Station, Allapattah Metrorail Station, Civic Center Metrorail Station, VA Hospital, Cedars Medical Center, UM/Jackson Memorial Hospitals, Vizcaya Metrorail Station, Mercy Hospital, and Coconut Grove. Headways are maintained at 30 minutes during the weekday, 60 minutes during the weeknight and they alternate between 20 and 40 minutes on the weekend. Ridership information indicates that approximately 3,083 passengers per weekday and approximately 36,996 passengers per month. Route 16 offers service to the Mall at 163 rd Street, Omni Metro Mover Terminal, Government Metrorail Station, Main Library, Miami Art Museum, Historical Museum of South Florida, and the Downtown Terminal Miami. This route operates seven days a week. Headways are established at 20 minutes during the weekday peak and off-peak periods and 30 minutes during the night and weekend periods. Approximately 20,776 people ride this route per month. Route 17 provides service to the Orange Bowl, Earlington Heights Metrorail Station, North Dade Health Center, and the Vizcaya Metrorail Station. Headways are maintained at 15 minutes during the weekday peak periods, 20 minutes during the off-peak with 60 minutes during late operations. Saturday and Sunday headways are maintained at 30 minutes. Ridership data indicates that approximately 5,465 passengers per weekday and 136,688 passengers per month use this route. Route 21 provides service to North Dade Health Center, Miami-Dade College North Campus, Northside Metrorail Station, Allapattah Metrorail Station, Santa Clara Metrorail Station, UM/Jackson Memorial Hospitals, Main Library, Historical Museum of South Florida, Miami Art Museum, and the Downtown Miami Bus Terminal. Headways are maintained at 30 minutes during the weekday, less than 90 minutes during the weeknight and they alternate between 20 and 40 minutes on the weekend. Ridership data indicates that approximately 2,408 passengers per weekday and 50,572 passengers per month use this route. 42
48 Route 22 provides service to the Coconut Creek Metrorail Station, Westchester Shopping Center, Earlington Heights Metrorail Station, Golden Glades Park and Ride lot, and North Miami Beach. Headways are maintained at 20 minutes during the peak weekday periods and 30 minutes during the off-peak periods with 60 minutes during the evening. Headways on Saturday and Sunday are kept at 30 minutes. Ridership data indicates that approximately 4,022 passengers per weekday and 101,095 passengers per month use this route. Route 24 enters Miami from the west via 22 nd Street with service to the Downtown Terminal, Vizcaya Metrorail Station, Miracle Mile, Westchester Shopping Center, Tamiami Park, and the FIU University Park Campus. Headways are maintained at 15 minutes during the peak and off-peak periods with 30 minute headways in the evening. Saturday and Sunday headways are 30 minutes and 60 minutes during the evening. Ridership data indicates that approximately 4,204 passengers per weekday and 111,760 passengers per month use this route. Route 27 offers service to the Coconut Grove Metrorail Station, the Brownsville Metrorail Station, Dr. Martin Luther King, JR. Metrorail Station, Miami-Dade Community College North Campus, Opa-Locka, Pro Player Stadium, and the Calder Race Course. Headways are maintained at 15 minutes during peak and off-peak periods with 60 minutes in the evening. Saturday headways are 20 minutes with 60 minutes in the evening and Sunday headways are 30 minutes with 60 minutes in the evening. Ridership data indicates that approximately 8,297 passengers per weekday and 217,414 passengers per month use this route. Route 32 provides service from the Opa-Locka Tri-Rail Station, Northside and Santa Clara Metrorail Stations, and Omni Bus Terminal. It also provides service from the Landmark Learning Center, St. Thomas University, Florida Memorial College, Miami-Dade Community College, MDCC North Campus, Northside Shopping Center, and North Bayshore Drive. It operates seven days a week with headways of 20 minutes during the weekday peak periods, 30 minutes during the off-peak periods, 60 minutes on weekday evenings and Sundays and 40 minutes on Saturdays. Ridership data indicates that approximately 3,328 passengers per weekday and 89,414 passengers per month use this route. Route 33 enters the City form the north along NE 10 th Avenue and the 79 th Street Causeway and provides service to the North Shore Hospital, Hialeah, and the Hialeah Gardens. Headways are 30 minutes during all operating periods except the evening operation which is 60 minutes. Ridership data indicates that approximately 2,104 passengers per weekday and 51,043 passengers per month use this route. Route 36 offers service from the Allapattah Metrorail Station and the Omni Bus Terminal, as well as the Koger Office Park, Miami Springs, and North Bayshore Drive. Headways are maintained at 10 minutes during the peak period and 30 minutes during the off-peak periods, nights and weekends. Ridership data 43
49 indicates that approximately 3,422 passengers per weekday and 86,383 passengers per month use this route. Route 37 provides service to the City of Hialeah, Department of Children and Families, Hialeah Metrorail Station, Tri-Rail Airport Station, Miami International Airport, Douglas Road Metrorail Station, City of South Miami, Cocoplum Circle, and South Miami Metrorail Station. Headways are maintained at 30 minutes for all operating periods seven days a week. Ridership data indicates that approximately 3,782 passengers per weekday and 79,425 passengers per month use this route. Route 40 offers service to Bird Road, City of Coral Gables, and the Douglas Road Metrorail Station. Headways are maintained at 20 minutes during the weekday with 60 minute evening service and 30 minutes on the weekend with 60 minute evening service. Ridership data indicates that approximately 12,783 passengers per weekday and 359,717 passengers per month use this route. Route 42 provides service to the Golden Glades Park & Ride, Opa-Locka City Hall, Opa-Locka Tri-Rail Station, City of Hialeah, Amtrak Passenger Terminal, Tri-Rail Metrorail Station, Miami International Airport, Coral Gables, Douglas Road Metrorail Station, and the Coconut Grove Metrorail Station. The route operates seven days a week with headways maintained at 30 minutes for all operating periods. Ridership data indicates that approximately 955 passengers per weekday and 26,177 passengers per month use this route. Route 48 offers service to the Santa Clara Metrorail Station, Jackson Memorial Hospital (via NW 10 Avenue), Somerville Residences, Downtown Bus Terminal, Brickell Avenue Business District, Mercy Hospital, Douglas Road Metrorail Station, Coconut Grove, Coral Gables, University Metrorail Station, and the South Miami Metrorail Station. Headways are maintained at 60 minutes during the week with no weekend service. Ridership data indicates that approximately 412 passengers per weekday and 8,659 passengers per month use this route. Route 54 provides service to the Barbara Goleman High School (selected trips), City of Hialeah, Westland Mall, Okeechobee Metrorail Station, Hialeah Metrorail Station, Department of Children and Families, and the Brownsville Metrorail Station. The route is in operation seven days a week. Headways are maintained at 30 minutes during the AM and off-peak periods with 20 minutes during PM peak periods and 60 minutes in the weekday evening. Saturday and Sunday headways are at 30 minutes with 60 minutes during the late evening. Ridership data indicates that approximately 3,212 passengers per weekday and 78,538 passengers per month use this route. Route 62 provides service between the Dr. Martin Luther King Jr. Metrorail Station and the Omni Metro Mover Bus Terminal. Headways are maintained at 10 minutes during the peak hours, 15 minutes during the off-peak hours and 30 minutes during late-night hours. Weekend headways are 20 minutes. Ridership 44
TRANSPORTATION ELEMENT
 TRANSPORTATION ELEMENT DATA INVENTORY AND ANALYSIS PURPOSE A local government which has all or part of its jurisdiction included within the urban area of a Metropolitan Planning Organization (MPO) pursuant
Jess Linn Principal Planner, Development Services Division Miami-Dade Regulatory and Economic Resources
 Eric Silva, AICP Assistant Director, Development Services Division Miami-Dade Regulatory and Economic Resources Albert Hernandez, P.E. Deputy Director, Planning and Engineering Miami-Dade Transit Jess
TRANSPORTATION SERVICE STANDARDS ELEMENT GOALS, OBJECTIVES & POLICIES
 TRANSPORTATION SERVICE STANDARDS ELEMENT GOALS, OBJECTIVES & POLICIES Background One of the most critical public services provided by a community is the community s transportation system. An effective
Goals & Objectives. Chapter 9. Transportation
 Goals & Objectives Chapter 9 Transportation Transportation MISSION STATEMENT: TO PROVIDE A TRANSPORTATION NETWORK CAPABLE OF MOVING PEOPLE AND GOODS EFFICIENTLY AND SAFELY. T he transportation system
Downtown Tampa Transportation Vision
 Downtown Tampa Transportation Vision Executive Summary August 1, 2006 Hillsborough County Metropolitan Planning Organization County Center, 18 th Floor Tampa, Florida 33602 813-272-5940 www.hillsboroughmpo.org
Executive Summary. Literature/Community Review. Traffic Flows and Projections. Final Report Truck Route System for Miami-Dade County CORRADINO
 Executive Summary The Miami-Dade County Metropolitan Planning Organization (MPO) has prepared a Truck Route System Plan for Miami-Dade County. The MPO and its consultants have worked closely with the MPO
RETAIL PROPERTY FOR SALE 10905 Biscayne Boulevard, Miami, FL 33161
 PRIME DEVELOPMENT 10905 Biscayne Bloulevard, OPPORTUNITY 33161 RETAIL PROPERTY FOR SALE 10905 Biscayne Boulevard, 33161 80,000 Traffic Count LOCATION Excellent property to develop a drive-thru restaurant
CAPACITY AND LEVEL-OF-SERVICE CONCEPTS
 CHAPTER 2 CAPACITY AND LEVEL-OF-SERVICE CONCEPTS CONTENTS I. INTRODUCTION...2-1 II. CAPACITY...2-2 III. DEMAND...2-2 IV. QUALITY AND LEVELS OF SERVICE...2-2 Service Flow Rates...2-3 Performance Measures...2-3
A Guide for the Creation and Evaluation of Transportation Concurrency Exception Areas: Case Studies of Florida Communities
 A Guide for the Creation and Evaluation of Transportation Concurrency Exception Areas: Case Studies of Florida Communities June 2007 State of Florida Department of Community Affairs 2555 Shumard Oak Boulevard
University of South Florida Area Multimodal Transportation District
 University of South Florida Area Multimodal Transportation District Study Area Evaluation & Transportation Needs Prepared for Hillsborough County By Jacobs Engineering Group May 25, 2010 EXECUTIVE SUMMARY...
Improving Access in Florida International University Biscayne Bay Campus Executive Summary
 EXECUTIVE SUMMARY Improving Access in Florida International University Biscayne Bay Campus Executive Summary Prepared for: Miami-Dade County Metropolitan Planning Organization (Miami-Dade MPO) Prepared
AIR QUALITY TECHNICAL MEMORANDUM
 AIR QUALITY TECHNICAL MEMORANDUM AIR QUALITY TECHNICAL MEMORANDUM GOLDEN GLADES INTERCHANGE PD&E STUDY Miami-Dade County, Florida Financial Management Number: 428358-1-22-01 Efficient Transportation Decision
Examples of Transportation Plan Goals, Objectives and Performance Measures
 Examples of Transportation Plan Goals, Objectives and Performance Measures The next step in the Long Range Transportation Plan (LRTP) process is to develop goals, objectives, and performance measures.
TIGER VI Project Planning Grant Application Beach Corridor Project Development Study
 Project Planning Grant Application Beach Corridor Project Development Study PROJECT LOCATION City of Miami City of Miami Beach Miami-Dade County, Florida Funding Request: $1,500,000 Submitted by Miami-Dade
ORANGE COUNTY TRANSPORTATION AUTHORITY. Final Long-Range Transportation Plan - Destination 2035. Attachment A
 ORANGE COUNTY TRANSPORTATION AUTHORITY Final Long-Range Transportation Plan - Destination 2035 Attachment A DESTINATION 2035 DESTINATION 2035 EXECUTIVE SUMMARY ATTACHMENT A Moving Toward a Greener Tomorrow
TRAFFIC IMPACT ANALYSIS HANDBOOK VOLUME I METHODOLOGIES & REQUIREMENTS
 TRAFFIC IMPACT ANALYSIS HANDBOOK VOLUME I METHODOLOGIES & REQUIREMENTS Downtown panoramic photo provided by 1stACT Silicon Valley (blank below this line) Volume I Methodologies and Requirements TABLE OF
Technical Memorandum PERFORMANCE MEASURES. Prepared by:
 Technical Memorandum PERFORMANCE MEASURES Prepared by: March 2014 TABLE OF CONTENTS Executive Summary... 1 1. Introduction... 2 1.1 Performance Measures and the Public Sector... 2 1.2 National Focus: MAP
Addendum to the Arterial Transitway Corridors Study
 January 2013 1 Addendum to the Arterial Transitway Corridors Study The Arterial Transitway Corridors Study (ATCS) evaluated and prioritized arterial bus rapid transit (BRT) improvements to nine corridors
Multi Modal Roadway Transportation Impact Fees and Asset Value
 January 2010 SB 360 Article Series: Factors to be Considered in Transitioning from a Road Impact Fee to a Mobility Fee Contributing Authors: Steven A. Tindale, P.E., AICP Robert P. Wallace, P.E., AICP
Strategic Regional Transit Plan
 Strategic Regional Transit Plan December 2008 Chapter 6: Run Time nalysis (Chapter 6 originally prepared October 2007) RUN TIME NLYSIS TLE OF CONTENTS 1.0 INTRODUCTION... 1 2.0 SCREEN TWO LTERNTIVES...
Partnering for 21 st Century Prosperity
 Partnering for 21 st Century Prosperity UniversityCity, A Catalytic Local Project of Regional Significance FLORIDA INTERNATIONAL UNIVERSITY F L O R I D A I N T E R N A T I O N A L U N I V E R S I T Y F
2013 QUALITY/ LEVEL OF SERVICE HANDBOOK
 2013 QUALITY/ LEVEL OF SERVICE HANDBOOK STATE OF FLORIDA DEPARTMENT OF TRANSPORTATION 2013 TABLE OF CONTENTS 1 Executive Summary... 1 2 Q/LOS Handbook Purpose and Scope... 3 2.1. Levels of Analysis...4
Questions and Answers about the Orange Bus/Rail Investment Plan
 Why are transit improvements needed? Questions and Answers about the Orange Bus/Rail Investment Plan The Triangle Region is now home to 1.5 million people. The U.S. Census and the 2035 Joint Long Range
Appendix J Santa Monica Travel Demand Forecasting Model Trip Generation Rates
 Appendix J Santa Monica Travel Demand Forecasting Model Trip Generation Rates SANTA MONICA TRAVEL DEMAND FORECASTING MODEL TRIP GENERATION RATES SUBMITTED BY: 201 Santa Monica Blvd., Suite 500 Santa Monica,
9988 REDWOOD AVENUE PROJECT TRAFFIC IMPACT ANALYSIS. April 24, 2015
 9988 REDWOOD AVENUE PROJECT TRAFFIC IMPACT ANALYSIS April 24, 2015 Kunzman Associates, Inc. 9988 REDWOOD AVENUE PROJECT TRAFFIC IMPACT ANALYSIS April 24, 2015 Prepared by: Bryan Crawford Carl Ballard,
Transportation Policy and Design Strategies. Freight Intensive. Level of Freight Presence
 Appendix G Transportation Policy and Design Strategies CONTEXT SENSITIVE SOLUTIONS To address the need to describe freight systems which account for the population distress which may result, an analysis
Transit Development Plan
 September 2013 FY 2014 TO FY 2023 Transit Development Plan ANNUAL administrative Update Miami-Dade Transit TRANSIT DEVELOPMENT PLAN ANNUAL UPDATE September 2013 TDP Annual Update Table of Contents Table
RESOLUTION NO. WHEREAS, the 2016-2017 City Budget Forecast estimates that housing
 RESOLUTION NO. WHEREAS, the 2016-2017 City Budget Forecast estimates that housing (21.6 percent) and transportation (14.9 percent) are the two largest expense categories for the typical Austin family;
Lincoln Downtown Master Plan Update
 Lincoln Downtown Master Plan Update Table of Contents Executive Summary........................................... 1 Complete Streets Framework.................................... 3 Promenade Creating
Overview of the Travel Demand Forecasting Methodology
 Overview of the Travel Demand Forecasting Methodology Prepared by the Central Transportation Planning Staff (CTPS) Authors: Scott A. Peterson, Manager Ian Harrington, Chief Planner March 29, 2008 1 OVERVIEW
Infrastructure and Growth Leadership Advisory Group Ideas and Approaches Survey
 Infrastructure and Growth Leadership Advisory Group Ideas and Approaches Survey In its second meeting, the Infrastructure and Growth Leadership Advisory Group expanded and refined the list of approaches/ideas
TRAFFIC IMPACT ANALYSIS (TIA)
") GUIDELINES FOR TRAFFIC IMPACT ANALYSIS (TIA) FOR REZONING APPLICATIONS AND OTHER DEVELOPMENT APPROVALS REQUIRING TRANSPORTATION IMPACT ANALYSIS IN SUMTER COUNTY, FLORIDA July 17, 2007 PURPOSE AND APPLICABILITY
GUIDELINES FOR TRAFFIC IMPACT ANALYSIS (TIA) FOR REZONING APPLICATIONS AND OTHER DEVELOPMENT APPROVALS REQUIRING TRANSPORTATION IMPACT ANALYSIS IN SUMTER COUNTY, FLORIDA July 17, 2007 PURPOSE AND APPLICABILITY
City of Rockville Regional Development Impacts: Transportation Capacity Analysis. June, 2013
 City of Rockville Regional Development Impacts: Transportation Capacity Analysis June, 2013 Purpose and Need Response to Council and Public Evaluate use of more advanced traffic analysis methodology and
 Walkable Communities Florida Department of Transportation State Safety Office Pedestrian and Bicycle Program April 1995 www.dot.state.fl.us/safety Twelve Steps for an Effective Program Page 1 Twelve Steps
Chapter 9: Transportation
 Chapter 9: Transportation What is this chapter about? The goals and policies in this chapter convey the City s intent to: Create a coordinated, efficient, and more affordable multimodal transportation
2009-3. The Preservation of Local Truck Routes: A Primary Connection between Commerce and the Regional Freight Network
 2009-3 The Preservation of Local Truck Routes: A Primary Connection between Commerce and the Regional Freight Network July 2009 This Goods Movement Challenges and Opportunities Report was prepared jointly
TRANSPORTATION IMPACT ANALYSIS (TIA) Guidelines
 Guidelines") TRANSPORTATION IMPACT ANALYSIS (TIA) Guidelines Methodology For Development Applications Requiring a TIA in Volusia County, Florida TIA Guidelines As adopted on November 24, 2009 (The Volusia Transportation
TRANSPORTATION IMPACT ANALYSIS (TIA) Guidelines Methodology For Development Applications Requiring a TIA in Volusia County, Florida TIA Guidelines As adopted on November 24, 2009 (The Volusia Transportation
Needs Analysis. Long Beach Bicycle Master Plan. Bicycle Commuter Needs. LONG BEACH BICYCLE MASTER PLAN Needs Analysis
 Long Beach Bicycle Master Plan Needs Analysis The purpose of reviewing the needs of commuter and recreational bicyclists is twofold: (1) it is instrumental when planning a system which must serve both
Traffic Information in NYC
 Traffic Information in NYC What We Know, What We Need to Know Prepared for Transportation Alternatives January 23, 2007 Schaller Consulting 94 Windsor Place, Brooklyn, NY (718) 768-3487 schaller@schallerconsult.com
INDOT 2000-2025 Long Range Plan
 Chapter 9 INDOT 2000-2025 Long Range Plan Highway Needs Analysis Overview The statewide transportation planning process provides for the identification of highway needs through a comprehensive process
Two of a Kind: Miami s Metrorail & Metromover
 Two of a Kind: Miami s Metrorail & Metromover By Gena Holle Miami Metrorail trains pass along its elevated structure which passes through the west side of downtown. A 2005 Miami Herald article quoted a
Miami-Dade Transit Service Standards
 Miami-Dade Transit Service Standards Presentation to RTC November 10, 2005 Roosevelt Bradley 1 MDT Service Standards Primer Background Standards: Old & New Best Practices: Comparison Denver RTD ChicagoCTA
CHAPTER 4 EXISTING TRANSPORTATION MANAGEMENT
 CHAPTER 4 EXISTING TRANSPORTATION MANAGEMENT TRANSPORTATION MANAGEMENT SYSTEMS Prior to 1991, the Missouri Department of Transportation (MoDOT) had begun development of several independent management systems.
Anchorage Travel Model Calibration and Validation
 Final Draft Anchorage Travel Model Calibration and Validation Prepared for Anchorage Metropolitan Transportation Solutions (AMATS) February 2005 301 West Northern Lights Boulevard Suite 601 Anchorage,
Where Do We Want to Go? How Can We Get There?
 Where Do We Want to Go? How Can We Get There? The BRTB has adopted nine goals, with supporting strategies, performance measures, and performance targets. Together, these goals, strategies, measures, and
FTP/SIS/FMTP Regional Workshop - Miami
 FTP/SIS/FMTP Regional Workshop - Miami September 24, 2015 FDOT District 6 Auditorium 1000 N.W. 111 Avenue Miami, Florida 33172 Meeting Highlights Welcome and Introductions Gus Pego, FDOT District 6 Secretary,
Introduction to Station Area Planning The Charlotte Story
 Introduction to Station Area Planning The Charlotte Story Boston 2009 Steve Hamwey - Sasaki Associates, Inc. Troy Russ - Glatting Jackson, Inc. October 31 st, 2009 Station Area Planning October 15th History
Pompano Education Corridor Transit Study - Existing Conditions Technical Memorandum #1. Figure 59 Total Number of Employees (2040)
") The total number of projected employees within Broward County in 2040 is 917,206. A total of 49,943 new employees are estimated within Broward County between 2010 and 2040, which represents a 5.7 percent
The total number of projected employees within Broward County in 2040 is 917,206. A total of 49,943 new employees are estimated within Broward County between 2010 and 2040, which represents a 5.7 percent
for the National Capital Transportation Element
 for the National Capital Transportation Element N A T I O N A L C A P I T A L P L A N N I N G C O M M I S S I O N for the National Capital for the National Capital 77 Federal Elements Transportation contents
Transportation Impact Analysis and Mitigation Plan Procedures Manual
 Transportation Impact Analysis and Mitigation Plan Procedures Manual February 2011 Table of Contents 1 Overview 1 2 Applicability of Traffic Impact Analysis and Mitigation Requirements 2 21 General Applicability:2
Submitted by: June, 2013. Excellence Delivered As Promised
 TECHNICAL REPORT Tolled Managed Highways with Rapid/ Enhanced Bus Routes and Study General Planning Consultant (GPC) Services Work Order # GPC IV-26 Submitted by: June, 2013 Excellence Delivered As Promised
This section summarizes the relevant transportation policies, laws, and regulations that apply to the proposed project.
 6. Transportation 6.1 OVERVIEW This chapter describes the existing transportation conditions in the Southwest Fresno Specific Plan Area. This includes the existing roadway, transit, bicycle, and pedestrian
EPA Technical Assistance for Sustainable Communities Building Blocks
 EPA Technical Assistance for Sustainable Communities Technical Assistance Tool: Complete Streets Deerfield Beach, Florida February 16, 2012 To: CC: Amanda Martinez, City of Deerfield Beach Roger Millar,
TERMINAL 91 TRAFFIC MONITORING STUDY
 REVISED DRAFT TERMINAL 9 TRAFFIC MONITORING STUDY Prepared for: Port of Seattle Prepared by: 6544 NE 6st Street, Seattle, WA 985 ph: (26) 523-3939 fx: (26) 523-4949 NOVEMBER 22, 2 TABLE OF CONTENTS. INTRODUCTION...
Mayors Welcome Strong Surrey Votes Yes Coalition Support. Yes Vote Would Vastly Improve Transit and Transportation in Fast Growing City
 Mayors Welcome Strong Surrey Votes Yes Coalition Support Yes Vote Would Vastly Improve Transit and Transportation in Fast Growing City February 11, 2015 Vancouver, BC The Mayors Council on Regional Transportation
Stone Way N Rechannelization: Before and After Study. N 34th Street to N 50th Street
 City of Seattle Department of Transportation Stone Way N Rechannelization: Before and After Study N 34th Street to N 50th Street May, 2010 INTRODUCTION Population density in Seattle is increasing within
Mercer County Multi-Modal Transportation Plan Year 2025 Travel Demand Model
 Mercer County Multi-Modal Transportation Plan Year 2025 Travel Demand Model Prepared For West Virginia Department of Transportation Transportation Planning Division Building 5, Room 824 1900 Kanawha Blvd.
Proposed Service Design Guidelines
 Proposed Service Design Guidelines July 2015 I. Introduction During Phase II of the Reimagining CityBus project, feedback from public outreach and data analysis conducted during Phase I of the project
Nearly 38,000 vehicles cross the Shinnecock Canal on Sunrise Highway (NYS Route 27) daily, during peak summer months.
 daily, during peak summer months.") 2. Traffic Characteristics Traffic volumes have increased in concert with population growth in the Towns of Southampton and East Hampton. The New York State Department of Transportation (NYSDOT) maintains
2. Traffic Characteristics Traffic volumes have increased in concert with population growth in the Towns of Southampton and East Hampton. The New York State Department of Transportation (NYSDOT) maintains
12MAP-21, a funding and authorization bill to govern U.S. federal surface MONITORING IMPLEMENTATION AND PERFORMANCE
 MONITORING IMPLEMENTATION AND PERFORMANCE 12MAP-21, a funding and authorization bill to govern U.S. federal surface transportation spending, creates a data-driven, performance-based multimodal program
Guidelines for the Preparation of Transportation Impact Studies 8 th Revision
 Guidelines for the Preparation of Transportation Impact Studies 8 th Revision Halifax Regional Municipality Traffic and Right of Way Transportation and Public Works P.O. Box 1749 Halifax, Nova Scotia B3J
Mount Royal College Transit Service Plan
 Mount Royal College Transit Service Plan Background In 2007 November response to Council Report C2007-78 West LRT Alignment, Budget and Project Delivery, Council directed the Administration to report back
Mid-Coast Corridor Transit Project San Diego, California New Starts Engineering (Rating Assigned November 2015)
") Mid-Coast Corridor Transit Project San Diego, California New Starts Engineering (Rating Assigned November 2015) Summary Description Proposed Project: Light Rail Transit 10.9 Miles, 9 Stations Total Capital
Mid-Coast Corridor Transit Project San Diego, California New Starts Engineering (Rating Assigned November 2015) Summary Description Proposed Project: Light Rail Transit 10.9 Miles, 9 Stations Total Capital
Mid-Coast Corridor Transit Project San Diego, California New Starts Project Development (Rating Assigned November 2014)
") Mid-Coast Corridor Transit Project San Diego, California New Starts Project Development (Rating Assigned November 2014) Summary Description Proposed Project: Light Rail Transit 10.9 Miles, 9 Stations Total
Mid-Coast Corridor Transit Project San Diego, California New Starts Project Development (Rating Assigned November 2014) Summary Description Proposed Project: Light Rail Transit 10.9 Miles, 9 Stations Total
A Presentation by the Project Managers: Rick Canizales Prince William County. Jana Lynott, AICP Northern Virginia Transportation Commission
 A Presentation by the Project Managers: Rick Canizales Prince William County & Jana Lynott, AICP Northern Virginia Transportation Commission for the: Public Open House and Hearing December 6, 2005 George
Near Westside Neighborhood and University Avenue Corridor Transportation Study. Public Workshop #2. September 12 and 23, 2013
 Near Westside Neighborhood and University Avenue Corridor Transportation Study Public Workshop #2 September 12 and 23, 2013 Presentation Outline: Brief Review of Study Scope, Background, and Current Conditions
Light Rail Transit in Phoenix
 4. Presentation and Discussion: Phoenix Light Rail Implementation Wulf Grote Planning and Development Director, Phoenix Valley Metro Light Rail Transit in Phoenix Broadway Citizen s Task Force February
Alternatives to the Circ Project Prioritization Methodology Prepared for Circ Task Force July 28, 2011
 Alternatives to the Circ Project Prioritization Methodology Prepared for Circ Task Force July 28, 2011 CCRPC staff has developed a draft methodology described below and detailed in the attached pages for
Transit Service Assessment
 Technical Memorandum #1 Transit Service Assessment June 213 Table of Contents 1. Existing Service Summary... 1 1.1 Service Overview... 1 1.2 Service Characteristics... 1 2. Ridership and Productivity...
Comprehensive Plan Policies that support Infill and Mixed Use
 Comprehensive Plan Policies that support Infill and Mixed Use Introduction A comprehensive plan provides a broad vision for the future growth of a community. It is often formulated using community visioning
Financial Plan Status Report
 Financial Plan Status Report Broward MPO Board March 13, 2014 Financial Sub-Committee Membership SFRTA (lead agency) Broward MPO FDOT Miami-Dade MPO Palm Beach MPO South Florida Regional Planning Council
Memo. Date: January 18, 2013. StarTran Advisory Board. From: Brian Praeuner. Review of Peer Transit Systems
 Memo Date: January 18, 2013 To: StarTran Advisory Board From: Brian Praeuner Re: Review of Peer Transit Systems This memo is in response to the StarTran Advisory Board s request for additional information
ROUTE OVERVIEW. Comprehensive Route Evaluation ROUTE 3 WARWICK AVE
 Comprehensive Route Evaluation ROUTE 3 WARWICK AVE ROUTE OVERVIEW Route 3 operates between Warwick and downtown Providence, primarily via Warwick Avenue. Other principal arterials include Oakland Beach
U.S. Department of Homeland Security Nebraska Avenue Complex Master Plan DRAFT ENVIRONMENTAL IMPACT STATEMENT APPENDIX C
 U.S. Department of Homeland Security Nebraska Avenue Complex Master Plan DRAFT ENVIRONMENTAL IMPACT STATEMENT APPENDIX C January 14, 2011 This page intentionally left blank Transportation Management Plan
Context Sensitive Design for Urban Transportation in West Philadelphia
 Context Sensitive Design for Urban Transportation in West Philadelphia Transportation Research Board 85 th Annual Meeting 24 January 2006 Jeffrey M. Casello University of Waterloo Robert Wright City of
Los Angeles Metro Rapid
 Los Angeles Metro Rapid Why BRT In Los Angeles Public dissatisfied with slow bus service Average bus speeds had declined by 10% since late- 1980s LADOT found that 50% of the time a bus is in service it
Transportation Impact Assessment Guidelines
 Transportation Impact Assessment Guidelines Preface The following TIA Guidelines have been developed jointly by the City s Planning and Growth Management and Public Works and Services departments in an
Transportation Alternatives
 1 Transportation Alternatives Transportation alternatives involve a variety of components: Location Alternatives - when and where service is provided - general location as well as level of service on the
2011 Certification Report. Miami Urbanized Area. Palm Beach, Broward, and Miami- Dade Metropolitan Planning Organizations.
 2011 Certification Report Miami Urbanized Area Palm Beach, Broward, and Miami- Dade Metropolitan Planning Organizations Prepared by: Federal Highway Administration Florida Division Federal Transit Administration
30 Years of Smart Growth
 30 Years of Smart Growth Arlington County s Experience with Transit Oriented Development in the Rosslyn-Ballston Metro Corridor A Presentation by the Arlington County Department of Community Planning,
CITY OF ROANOKE AND TOWN OF VINTON, VIRGINIA. RSTP Funds Joint Application FOR
 CITY OF ROANOKE AND TOWN OF VINTON, VIRGINIA RSTP Funds Joint Application FOR Tinker Creek Pedestrian Bridge: Tinker Creek and Glade Creek Greenways Connection Date: September 15, 2014 RSTP Project Profile
SAN DIEGO - A BICYCLE FRIENDLY CITY
 SAN DIEGO - A BICYCLE FRIENDLY CITY MANY OPPORTUNITIES FOR IMPROVEMENT SUMMARY The designated bicycle paths and lanes in the City of San Diego (City) are often substandard because of their location and
SUMMARY OF GROWTH & DEVELOPMENT TRENDS For THE CENTRAL AREA OF CHICAGO. The Parking Industry Labor Management Committee (PILMC)
") SUMMARY OF GROWTH & DEVELOPMENT TRENDS For THE CENTRAL AREA OF CHICAGO Prepared for The Parking Industry Labor Management Committee (PILMC) August 7, 2003 Prepared by Metro Transportation Group, Inc. 70
SUMMARY OF GROWTH & DEVELOPMENT TRENDS For THE CENTRAL AREA OF CHICAGO Prepared for The Parking Industry Labor Management Committee (PILMC) August 7, 2003 Prepared by Metro Transportation Group, Inc. 70
MEMORANDUM. Robert Nichols, Acting Corridor Design Manager Northgate Link Extension
 MEMORANDUM DATE: September 23, 2014 TO: Robert Nichols, Acting Corridor Design Manager Northgate Link Extension FROM: SUBJECT: COPIES: Katherine Casseday, PE, PTOE, Casseday Consulting Tony Lo, PE, Parsons
SCHOOL OF ARCHITECTURE & COMMUNITY DESIGN COLLEGE OF THE ARTS UNIVERSITY OF SOUTH FLORIDA
 SCHOOL OF ARCHITECTURE & COMMUNITY DESIGN COLLEGE OF THE ARTS UNIVERSITY OF SOUTH FLORIDA PROJECT OVERVIEW OVERVIEW The FCCD+R, in coordination with the FDOT District 7, are to facilitate numerous meetings
T a b l e. of Contents. Introduction. Task 1: Data Collection. Transportation Master Plan. Page i INTRODUCTION... 1 INTRODUCTION...
 Introduction Transportation Master Plan T a b l e of Contents INTRODUCTION... 1 Task 1: Data Collection INTRODUCTION... 5 ROADWAY SYSTEMS... 7 EXISTING REGIONAL FACILITIES... 7 FUNCTIONAL CLASSIFICATION...
APPENDIX E TASK 5 TECHNICAL MEMORANDUM: TRAVEL DEMAND FORECASTING PROCESS
 APPENDIX E TASK 5 TECHNICAL MEMORANDUM: TRAVEL DEMAND FORECASTING PROCESS INTRODUCTION The purpose of this Technical Memorandum is to describe the methodologies and assumptions used in estimating travel
A Bicycle Accident Study Using GIS Mapping and Analysis
 A Bicycle Accident Study Using GIS Mapping and Analysis Petra Staats, Graduate Assistant, Transportation Policy Institute, Rutgers University, New Brunswick, NJ, USA pstaats@eden.rutgers.edu Summary Surveys
Citizen s Version 20-THIRTEEN
 20-THIRTEEN TRANSPORTATION IMPROVEMENT PROGRAM FISCAL YEARS 2012/2013 to 2016/2017 Citizen s Version METROPOLITAN PLANNING ORGANIZATION FOR THE MIAMI URBANIZED AREA April, 2012 This document was prepared
APPLICATION LAFAYETTE METROPOLITAN PLANNING ORGANIZATION (MPO) SURFACE TRANSPORTATION PROGRAM (STP) FUNDS TRANSPORTATION IMPROVEMENT PROGRAM (TIP)
 SURFACE TRANSPORTATION PROGRAM (STP) FUNDS TRANSPORTATION IMPROVEMENT PROGRAM (TIP)") APPLICATION LAFAYETTE METROPOLITAN PLANNING ORGANIZATION (MPO) SURFACE TRANSPORTATION PROGRAM (STP) FUNDS TRANSPORTATION IMPROVEMENT PROGRAM (TIP) To be considered for STP funding, a proposed project must
APPLICATION LAFAYETTE METROPOLITAN PLANNING ORGANIZATION (MPO) SURFACE TRANSPORTATION PROGRAM (STP) FUNDS TRANSPORTATION IMPROVEMENT PROGRAM (TIP) To be considered for STP funding, a proposed project must
7.0 Transportation Management
 7.0 Transportation Management I. Introduction The Kansas City region has invested considerable effort and resources in the design and implementation of its regional multimodal transportation system. As
Section 6 Traffic Analysis
 Section 6 Traffic Analysis Traffic Operations of the Preferred Network Alternative After the Preferred Network was identified and confirmed by local policy makers and area residents, detailed traffic analysis
Florida Avenue Multimodal Transportation Study. June 19, 2013
 Florida Avenue Multimodal Transportation Study June 19, 2013 Today s Agenda Team & project introduction Project Timeline What you said Tools we use Mapped data and what clues it can provide Highlights
STOP CONSOLIDATION TRANSIT STRATEGIES
 TRANSIT STRATEGIES STOP CONSOLIDATION Transit stops are the places where people access transit service, and greatly impact many elements of passengers transit experiences. They are typically thought of
Ne w J e r s e y Tr a f f i c Co n g e s t i o n :
 Ne w J e r s e y Tr a f f i c Co n g e s t i o n : A Growing Crisis January 2008 Cover photo : Route 3, Passaic County introduction A rising tide of traffic congestion threatens to increase roadway gridlock,
Proposed Program of High Capacity Transit Improvements City of Atlanta DRAFT
 I 20 West Heavy Rail Northside Drive Bus Rapid Contingent Multi Jurisdicitional Projects Atlanta Light Rail Clifton Light Rail * I 20 East Bus Rapid * Atlanta BeltLine Central Loop Irwin AUC Line Downtown
14-97. 14-97.002 Definitions. For the purposes of this rule chapter the following definitions shall apply unless the context clearly shows otherwise:
 14-97 14-97.001 Purpose. This rule chapter sets forth an access control classification system and access management standards to implement the State Highway System Access Management Act of 1988. The implementation
Orange County Transportation Impact Fee Update FINAL REPORT
 Transportation Impact Fee Update FINAL REPORT Prepared for: Transportation Planning Department 4200 S. John Young Parkway, Second Floor Orlando, FL 32839 ph (407) 836-8070 September 5, 2012 (amended November
Chapter 5. Transportation. Decatur County Comprehensive Plan. Introduction. Goals and Objectives. Goal. Objectives. Goal.
 Chapter 5 Transportation Chapter 5: Transportation Introduction The transportation system forms the backbone of a community. I-74 connects Decatur County with the large metropolitan areas of Cincinnati
FLC 4th Annual Summer Research Symposium: Planes, Trains, Ports & Highways What Keeps Florida Moving?
 FLC 4th Annual Summer Research Symposium: Planes, Trains, Ports & Highways What Keeps Florida Moving? Jose Gonzalez SVP - Florida East Coast Industries Wednesday, August 12, 2015 1 Florida East Coast Industries