Monitoring Tomcat with JMX
|
|
|
- Andrea Watkins
- 8 years ago
- Views:
Transcription
1 Monitoring Tomcat with JMX
2 Christopher Schultz Chief Technology Offcer Total Child Health, Inc. * Slides available on the Linux Foundation / ApacheCon2014 web site and at NA 2014/Tomcat Monitoring/

3 Java Management Extensions Protocol and API for managing and monitoring Access data via JMX Mbeans Read and write bean attributes Invoke operations Receive notifications JVM exposes certain status Tomcat exposes certain status

4 Monitoring JVM Heap status Total, free, used memory Garbage collection GC pause times

5 Monitoring Tomcat Status of connector Status of request-processor thread pool Status of data sources Request performance

6 JMX Tools jconsole (JDK) VisualVM (JDK, app bundle) Most profilers (e.g. YourKit, etc.) Custom tools using javax.management AP
 Custom tools using javax.")
7 Monitoring JVM: Heap
8 Monitoring Tomcat Status of data sources Status of requestprocessor thread pool Request performance Session information

9 Monitoring Tomcat Status of data sources Status of requestprocessor thread pool Request performance Session information

10 Monitoring Tomcat: Requests

11 Monitoring Tomcat: Requests
12 Monitoring Tomcat: Requests
13 Monitoring Tomcat Status of data sources Status of requestprocessor thread pool Request performance Session information

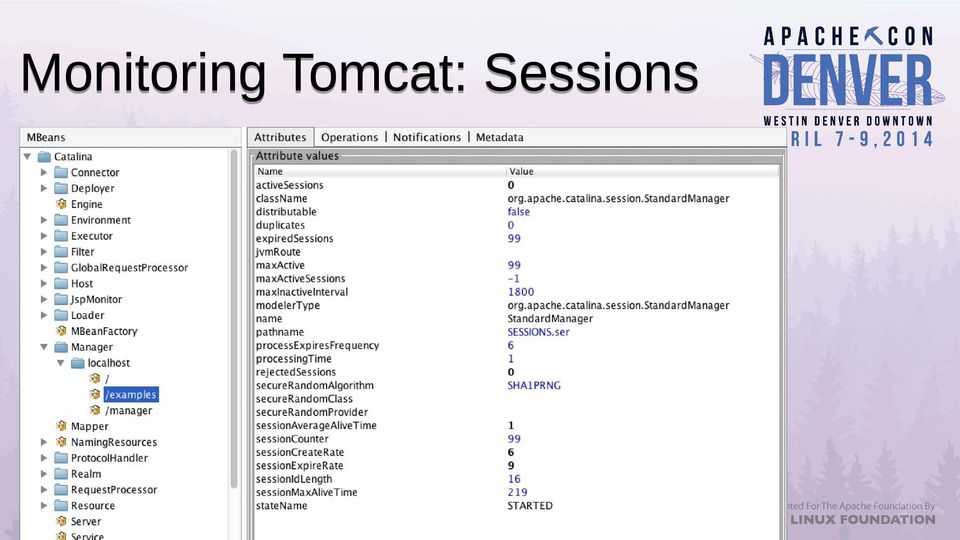
14 Monitoring Tomcat: Sessions
15 Monitoring Tomcat Status of data sources Status of requestprocessor thread pool Request performance Session information

16 Monitoring Tomcat: DataSources

17 Monitoring Tomcat Status of data sources Status of requestprocessor thread pool Request performance Session information

18 Monitoring Tomcat: Threads

19 Monitoring Tomcat: Threads

20 Monitoring Tomcat: Threads

21 Monitoring Tomcat: Threads
22 Monitoring Your Application Monitor Application Processes Performance Metrics On-the-fly re-configuration
23 Monitoring Your Application Write an MBean Create an Interface: FooMBean Create an Implementation: Foo Create an XML MBean descriptor Deploy package to Tomcat Publish the MBean to the MBean server Query / invoke as necessary * Example code will be available at NA 2014/Tomcat Monitoring/
24 Example MBean Servlet Filter that captures total request processing time Timestamp prior to request Timestamp after request Add the delta to a JMX-accessible counter: RequestStats
25 RequestStats MBean Write an MBean public interface RequestStatsMBean { public long getprocessingtime(); public long getrequestcount(); public void resetcounters(); } public class RequestStats implements RequestStatsMBean { [...] public void updatestats(long timestamp, ServletRequest request, long elapsed) { _totalelapsedtime.addandget(elapsed); _requestcount.incrementandget(); } public long getprocessingtime(){ return _totalelapsedtime.get(); } public long getrequestcount() { return _requestcount.get(); } public void resetcounters() { _totalelapsedtime.set(0l); _requestcount.set(0l); } }
26 RequestStats MBean Write an MBean descriptor <mbeans-descriptors> <operation <mbean name="requeststats"...> name="resetcounters" <operation name="getprocessingtime" description="resets all description="gets the total number of counters." milliseconds spent processing requests." impact="action" impact="info" returntype="void" /> returntype="long" /> </mbean> <operation name="getrequestcount" description="gets the total number </mbeans-descriptors> of requests processed." impact="info" returntype="long" />
27 RequestStats MBean Create JAR Java interface Java implementation mbeans-descriptors.xml Put JAR into CATALINA_BASE/lib
28 RequestStats MBean Write the Filter public void init(filterconfig config) { MBeanServer server = getserver(); server.registermbean(_stats, new ObjectName("Example:RequestStats=RequestStats,name=" + filtername;)); } public void dofilter(...) { timestamp = elapsed = System.currentTimeMillis(); chain.dofilter(request, response); elapsed = System.currentTimeMillis() - elapsed; _stats.updatestats(timestamp, request, elapsed); }
29 RequestStats MBean Map the Filter <filter> <filter-name>servlet-request-stats</filter-name> <filter-class>filters.requeststatsfilter</filter-class> <init-param> <param-name>name</param-name> <param-value>servlets</param-value> </init-param> </filter> <filter-mapping> <filter-name>servlet-request-stats</filter-name> <url-pattern>/servlets/*</url-pattern> </filter-mapping> <filter><filter-name>jsp-request-stats</filter-name><filterclass>filters.requeststatsfilter</filter-class><init-param><param-name>name</paramname><param-value>jsps</param-value></init-param></filter> <filter-mapping><filter-name>jsp-request-stats</filter-name><url-pattern>/jsp/*</urlpattern></filter-mapping>
30 RequestStats MBean
31 RequestStats MBean
32 Automated Monitoring Remote Access Large Scale Constant
33 Automated Monitoring Remote Access Large Scale Constant Need more tools!
34 Automated Monitoring Nagios Simple Flexible Well-deployed No-cost community version available
35 Automated Monitoring
36 Nagios Monitoring Plug-in architecture (i.e. arbitrary scripts) Freely-available JMX plug-in: check_jmx $./check_jmx -U service:jmx:rmi:///jndi/rmi://localhost:1100/jmxrmi\ -O java.lang:type=memory -A NonHeapMemoryUsage -K used\ -w c JMX WARNING NonHeapMemoryUsage.used=
37 Nagios Monitoring Problems with check_jmx Complex configuration for remote JMX JVM launch for every check Course-grained authentication options
38 Nagios Monitoring Alternative Option: Tomcat's JMXProxyServlet JMX data available via HTTP Can use Tomcat's authentication tools $./check_jmxproxy -U ' get=java.lang:type=memory&att=heapmemoryusage&key=used' \ -w c JMX CRITICAL: OK - Attribute get 'java.lang:type=memory' HeapMemoryUsage - key 'used' = * check_jmxproxy can be found at
39 Nagios Monitoring
40 JMX Command-line Tricks Show all logged-in usernames for sessionid in `wget -O - ' invoke=catalina:type=manager,context=/myapp,host=localhost&op=listsessioni ds' \ sed -e "s/ /\n/g" grep '^[0-9A-Za-z]\+\(\..*\)\?$' ;\ do wget -O " invoke=catalina:type=manager,context=/myapp,host=localhost&op=getsessionat tribute&ps=$sessionid,user" ; done 2>/dev/null \ grep User
41 Tracking Values Over Time Some metrics are best observed as deltas Session count Request error count Requires that you have a history of data Requires that you consult the history of that data check_jmxproxy provides such capabilities
42 Tracking Values Over Time $./check_jmxproxy -U ' get=java.lang:type=memory&att=heapmemoryusage&key=used' -w c write number.out --compare number.out JMX OK: OK - Attribute get 'java.lang:type=memory' - HeapMemoryUsage - key 'used' = , delta=[...] $./check_jmxproxy -U ' get=java.lang:type=memory&att=heapmemoryusage&key=used' -w c write number.out --compare number.out JMX OK: OK - Attribute get 'java.lang:type=memory' - HeapMemoryUsage - key 'used' = , delta= $./check_jmxproxy -U ' get=java.lang:type=memory&att=heapmemoryusage&key=used' -w c write number.out --compare number.out JMX OK: OK - Attribute get 'java.lang:type=memory' - HeapMemoryUsage - key 'used' = , delta=
43 Tracking Values Over Time Session count Tomcat actually provides this already via Manager's sessioncreaterate attribute Request errors $./check_jmxproxy -U ' get=catalina:type=requestprocessor,worker="http-nio ",name=httprequest1&att=errorcount' -w 1 -c 10 --write errors.txt --compare errors.txt JMX OK: OK - Attribute get 'Catalina:type=RequestProcessor,worker="http-nio ",name=HttpRequest1' - errorcount = 0, delta=0
44 Detecting OutOfMemory Many sources of OOME Heap exhaustion PermGen exhaustion Hit thread limit Hit file descriptor limit
45 Detecting OutOfMemory Two types of heap OOME One thread generates lots of local references All threads collaborate to generate globallyreachable objects (e.g. session data) Former is recoverable, latter is not You want to be notified in any case
46 Memory Pool Thresholds
47 Memory Pool Thresholds
48 Memory Pool Thresholds
49 Memory Pool Thresholds
50 Memory Pool Thresholds Choice of how to detect exceededthreshold conditions Polling using check_jmxproxy Register a notification listener from Java Have that listener take some action
51 Detect OutOfMemory Monitoring Memory Thresholds Set threshold on startup Register a notification listener (callback) Watch exceeded count (poll) Report to monitoring software (Nagios) Repeat for each memory pool you want to watch Hope the JVM does not fail during notification This is getting ridiculous
52 Detecting OutOfMemory JVM has an easier way Use -XX:OnOutOfMemoryError to run a command onfirst OOME detected by the JVM Need a command to notify Nagios
53 Notify Nagios on OOME Script that wraps curl $ curl -si \ --data-urlencode 'cmd_typ=30' \ --data-urlencode 'cmd_mod=2' \ --data-urlencode "host=myhost" \ --data-urlencode "service=jvm:heap:oome" \ --data-urlencode "plugin_state=2" \ --data-urlencode "plugin_output=oome CRITICAL" \ ' Script can be found at
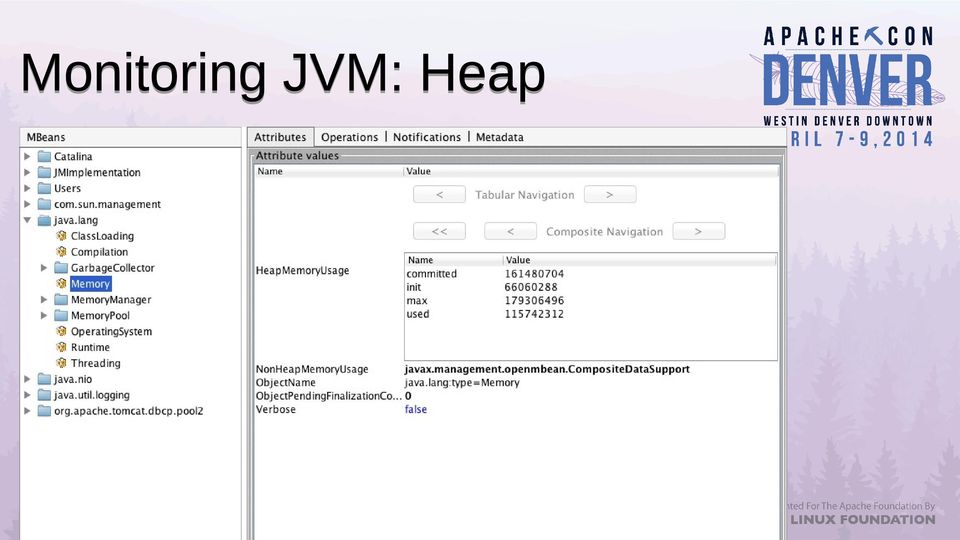
54 Monitoring Tomcat with JMX JMX Provides Monitoring and Management of JVMs Tomcat exposes a great amount of information via JMX Applications can expose anything to JMX via MBeans JRE ships with tools for light JMX interaction Practical use of JMX requires some additional tools
55 Resources Presentation Slides NA 2014/Tomcat Monitoring/ Nagios passive-check script check_jmxproxy Special thanks to Christopher Blunck (MBeans info)
56 Monitoring Tomcat with JMX
57 Christopher Schultz Chief Technology Offcer Total Child Health, Inc. * Slides available on the Linux Foundation / ApacheCon2014 web site and at NA 2014/Tomcat Monitoring/ I'm essentially a DevOps CTO, and everything I'm presenting today has been something I've had to do in my own work in that regard. My own monitoring work is very much a work in progress. This is an introduction to monitoring Tomcat and even JVM processes in general. Nothing I'm going to present is particularly earth-shattering or difficult to understand. And that's good news! There is really no need to consider why monitoring is necessary, so let's just jump right in.
58 Java Management Extensions Protocol and API for managing and monitoring Access data via JMX Mbeans Read and write bean attributes Invoke operations Receive notifications JVM exposes certain status Tomcat exposes certain status Manage and monitor JVM processes. Everything is MBeans Read/write attributes Invoke operations Receive notifications Both the JVM and Tomcat expose these types of things via JMX.
59 Monitoring JVM Heap Total, status free, used memory Garbage collection GC pause times The JVM exposes a lot about its internal state. Here are some of the more interesting items.
60 Monitoring Tomcat Status Status of of connector request-processor thread pool Status of data sources Request performance Tomcat has a great deal of information available as well. Here's a sample of what's there.
61 JMX Tools jconsole (JDK) VisualVM (JDK, app bundle) Most profilers (e.g. YourKit, etc.) Custom tools using javax.management API While JMX is an API + protocol, you don't need to know or understand either of them to benefit: tools already exist. You can always write your own if you need something special.
62 Monitoring JVM: Heap An example of the JVM's exposure of the Java heap's usage: initial and maximum values are available as well as the currently-used measurement. Notice the NonHeapMemoryUsage attribute which has not yet been expanded as the HeapMemoryUsage attribute has. Both of these attribute values are represented by objects that contain multiple name-value pairs. The object that stores these pairs also indicates the data type of each value and can include descriptive information for a client as well.
63 Monitoring Tomcat Status of data sources Status of requestprocessor thread pool Request performance Session information Image: sceenshot from VisualVM of Tomcat's MBean tree. Tomcat provides a wealth of information about its internal state. Much of this information is merely configuration values that are read on startup and do not change over time. There is, however, a great deal of real-time data available about the servlet container and its various components. I'll dive into these practical examples to demonstrate the rich data that is available. I'm going to cover these out-of-order with respect to the top-to-bottom order shown above in order to ease-into some of the concepts.
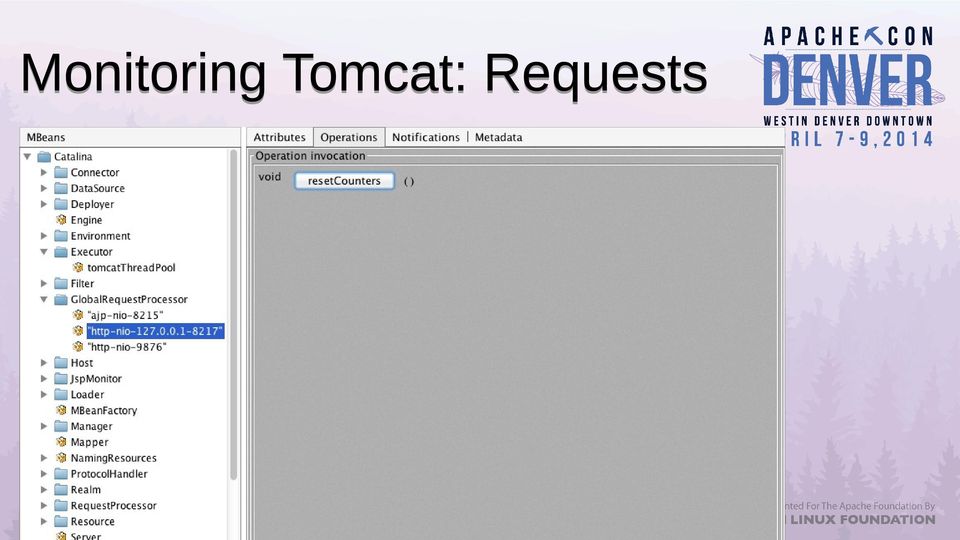
64 Monitoring Tomcat Status of data sources Status of requestprocessor thread pool Request performance Session information Tomcat tracks the performance of requests (in aggregate) for each connector separately. A GlobalRequestProcessor exists for each connector where you can obtain information about the performance of the requests handled by that particular connector.
65 Monitoring Tomcat: Requests Here is a view of one of Tomcat's GlobalRequestProcessors. I happen to have 3 connectors configured, and you can tell them apart by their names which also indicate a lot about them: protocol, interface address, and port number will uniquely identify any connector's GlobalRequestProcessor. These GlobalRequestProcessors keep track of metrics about requests such as the number of requests, the cumulative processing time of those requests, and the overall volume of data processed.
66 Monitoring Tomcat: Requests Any MBean can support operations that can be called via the JMX APIs. The GlobalRequestProcessor beans have a single operation: resetcounters. This operation as you might guess resets all the collected metrics for the GlobalRequestProcessor to zero.
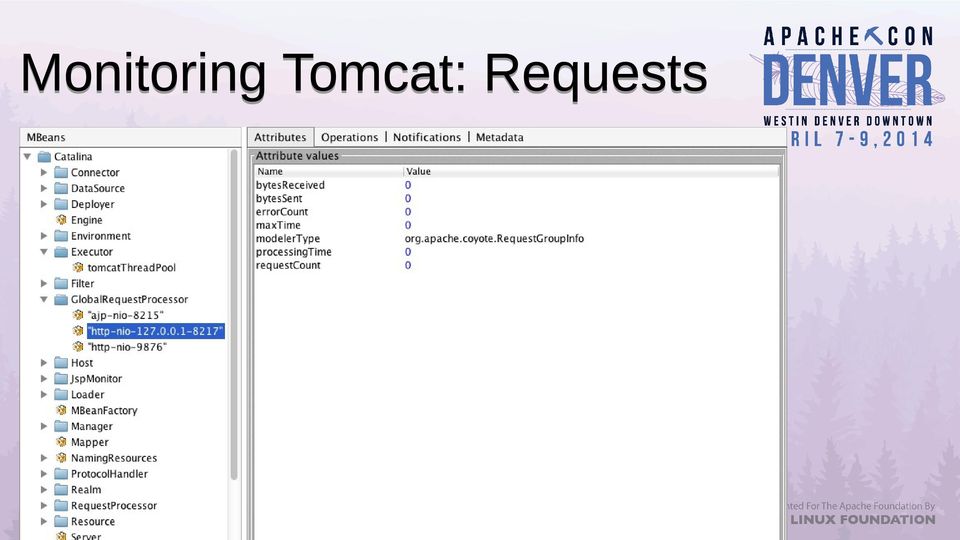
67 Monitoring Tomcat: Requests All values zeroed-out! Resetting these counters can be useful if you want to monitor performance data over time and want to periodically reset the state of the connector's metrics.
68 Monitoring Tomcat Status of data sources Status of requestprocessor thread pool Request performance Session information Sessions are another thing you might want to keep track of: too many sessions can bog-down a server and cause performance problems. The real problem is storing lots of data in the session, or course, but the number of sessions can be an important data point in your server monitoring strategy.
69 Monitoring Tomcat: Sessions Most useful attributes shown here: activesessions, maxactive, and expiredsessions. One attribute that is not shown is the sessioncreationrate, which gives you an idea of how fast sessions are being created. Tomcat actually exposes every session in the container via MBean operations. You can fetch a list of all session ids, fetch attribute values from a particular session, and even expire sessions directly.
70 Monitoring Tomcat Status of data sources Status of requestprocessor thread pool Request performance Session information A great number of web applications use a relational database via JDBC. Those DataSources configured via Tomcat (and not directly in the application, such as those configured by Spring, Hibernate, etc.) are available for inspection. Tomcat's DataSources have a connection pool with minimum and maximum sizes (numbers of connections), and a maxidle setting which allows the pool to grow and shrink depending upon the demand.
71 Monitoring Tomcat: DataSources Specifically, you might want to take a look at the numactive and numidle attributes: you can see if your JDBC connection pool is meeting the demand of your users. Note that I have maxactive=1 since this is a test system.
72 Monitoring Tomcat Status of data sources Status of requestprocessor thread pool Request performance Session information Each of Tomcat's connectors has a thread pool that is used to actually process the requests: once a request arrives, it is dispatched to a thread in the pool. Thread pools in Tomcat are called Executors and may be shared between connectors, which is why they are treated separately from the Connectors themselves. Executors are like the JDBC connection-pools from the previous example: they have minimum and maximum sizes, as well as an idle target to help match resources to user demand.
73 Monitoring Tomcat: Threads You can find out the number of currently-active requests (activecount), the total number of requests processed (by the executor, which may not be the same as the number processed by any given connector), etc.
74 Monitoring Tomcat: Threads Here, I've fired-up a little JMeter script to put some load on the server. You can see that there are 6 active threads and the pool size has jumped from 4 threads to 21, indicating that I've put quite a load on the pool relatively speaking. The completedtaskcount is gong-up dramatically. (I suspect the reason I don't have 21 threads busy-or more right now is because my laptop only has 8 logical cores, so really only 8 threads can be active at once that means both JMeter and Tomcat. The requests are also processed so quickly that it's hard to catch a large number of threads actually active.)
75 Monitoring Tomcat: Threads After a bit more load, I've been able to capture the activecount getting a bit higher.
76 Monitoring Tomcat: Threads Don't want to track the values yourself over time? No problem: just double-click on any numeric value and VisualVM will graph it for you over time.
77 Monitoring Your Application Monitor Application Processes Performance Metrics On-the-fly re-configuration So, the JVM and Tomcat expose information about themselves. That's great for monitoring the state of the JVM and the servlet container, but what about your own application's health? You have caches, other data stores, complex objects, and a little bit of everything going on inside your own application. How can we peek under those covers?
78 Monitoring Your Application Write an MBean Create an Interface: FooMBean Create an Implementation: Foo Create an XML MBean descriptor Deploy package to Tomcat Publish the MBean to the MBean server Query / invoke as necessary * Example code will be available at NA 2014/Tomcat Monitoring/ A great way to do this is to write your own MBean. Then you can use all the tools described in this presentation to track arbitrary details about your application. Remember that you can also invoke operations on MBeans, so you can even change the state and take whatever actions you feel are worthwhile from a JMX client. It's easy to write your own MBean: just follow the steps above. I'll show a simple example in the next few slides.
79 Example MBean Servlet Filter that captures total request processing time Timestamp prior to request Timestamp after request Add the delta to a JMX-accessible counter: RequestStats Tomcat also provides request-processing metrics on a per-servlet basis. Want to know how the JSP servlet is performing? No problem: Tomcat already tracks that information for you. The problem is that it's not very fine-grained: you get metrics from the simplest index.jsp mixed-in with your PerformLongTransactionAndProducePDF.jsp numbers. That's not particularly convenient. So, I'm going to write a Filter that captures this kind of data and makes it available via JMX. You can have multiple instances of the Filter mapped to different URL patterns, and you'll get a separate set of metrics for each of them.
80 RequestStats MBean Write an MBean public interface RequestStatsMBean { public long getprocessingtime(); public long getrequestcount(); public void resetcounters(); } public class RequestStats implements RequestStatsMBean { [...] public void updatestats(long timestamp, ServletRequest request, long elapsed) { public long getprocessingtime(){ return _totalelapsedtime.get(); } public long getrequestcount() { return _requestcount.get(); } public void resetcounters() { _totalelapsedtime.set(0l); _requestcount.set(0l); } } _totalelapsedtime.addandget(elapsed); _requestcount.incrementandget(); } For Tomcat's MBean server implementation, you have to write an interface as well as a concrete class. No surprises in the code, here. Note that I'm using AtomicLong objects (declarations not shown for brevity) because they are being used in a multi-threaded context and need to remain threadsafe.
81 RequestStats MBean Write an MBean descriptor <mbeans-descriptors> <operation <mbean name="requeststats"...> name="resetcounters" <operation name="getprocessingtime" description="resets all description="gets the total number of counters." milliseconds spent processing requests." impact="action" impact="info" returntype="void" /> returntype="long" /> </mbean> <operation name="getrequestcount" </mbeans-descriptors> description="gets the total number of requests processed." impact="info" returntype="long" /> Tomcat's documentation states that you must create an mbeans-descriptors.xml file and place it in the same package as your MBean interface, but I have found that it is not actually a requirement. But, it's a good idea to write the descriptor because it documents what your attributes mean and what your and operations do. JMX clients can read this information and present it to the user. Documentation is always nice. (I was unable to get Tomcat to read my mbeansdescriptors.xml file for some reason. Early-on in my work, I recall it working, but it stopped working at some point and I wasn't able to discover the cause.)
82 RequestStats MBean Create JAR Java interface Java implementation mbeans-descriptors.xml Put JAR into CATALINA_BASE/lib Package-up the MBean and put it into Tomcat's lib directory. Note that the bean must be placed-into the container's lib directory and not with your web application, otherwise you risk a pinned-classloader memory leak during redeployment. I believe Tomcat requires that your MBean be in the lib/ directory anyway, do you may not actually have a choice.
83 RequestStats MBean Write the Filter public void init(filterconfig config) { MBeanServer server = getserver(); server.registermbean(_stats, new ObjectName("Example:RequestStats=RequestStats,name=" + filtername;)); } public void dofilter(...) { timestamp = elapsed = System.currentTimeMillis(); chain.dofilter(request, response); elapsed = System.currentTimeMillis() - elapsed; _stats.updatestats(timestamp, request, elapsed); } Now, we need to write the Filter that will actually capture the data and publish the MBean to the server. The init method here registers the Mbean (_stats), and the dofilter method just times requests as they pass-through, then updates the stats on the bean.
84 RequestStats MBean Map the Filter <filter> <filter-name>servlet-request-stats</filter-name> <filter-class>filters.requeststatsfilter</filter-class> <init-param> <param-name>name</param-name> <param-value>servlets</param-value> </init-param> </filter> <filter-mapping> <filter-name>servlet-request-stats</filter-name> <url-pattern>/servlets/*</url-pattern> </filter-mapping> <filter><filter-name>jsp-request-stats</filter-name><filterclass>filters.requeststatsfilter</filter-class><init-param><param-name>name</paramname><param-value>jsps</param-value></init-param></filter> <filter-mapping><filter-name>jsp-request-stats</filter-name><url-pattern>/jsp/*</urlpattern></filter-mapping> Let's map two instances of the Filter to two different URL patterns to see what things look like.
85 RequestStats MBean Check it: JSPs and servlets have separate stats. I've put a bit of JMeter load on the server to get some numbers.
86 RequestStats MBean We can also reset counters, just like with the built-in Tomcat MBeans.
87 Automated Monitoring Remote Access Large Scale Constant All the examples thus far have used VisualVM which is a GUI interface. While that's fun for inspecting a single server and maybe doing some scouting for interesting data available, it's not going to work in the real world of production monitoring.
88 Automated Monitoring Remote Access Large Scale Constant Need more tools!
89 Automated Monitoring Nagios Simple Flexible Well-deployed No-cost community version available Let's use Nagios: a widely-deployed monitoring system.
90 Automated Monitoring The ASF uses Nagios and Tomcat exposes data via JMX. Let's see how we can marry the two.
91 Nagios Monitoring Plug-in architecture (i.e. arbitrary scripts) Freely-available JMX plug-in: check_jmx $./check_jmx -U service:jmx:rmi:///jndi/rmi://localhost:1100/jmxrmi\ -O java.lang:type=memory -A NonHeapMemoryUsage -K used\ -w c JMX WARNING NonHeapMemoryUsage.used= Nagios supports plug-ins and there's one for fetching data via JMX: check_jmx: if you know the object's name, you can get data from the command-line.
92 Nagios Monitoring Problems with check_jmx Complex configuration for remote JMX JVM launch for every check Course-grained authentication options There are some caveats with check_jmx. Think about how many values you might want to monitor: spinning-up 14 JVMs every minute might just be considered a waste of system resources.
93 Nagios Monitoring Alternative Option: Tomcat's JMXProxyServlet JMX data available via HTTP Can use Tomcat's authentication tools $./check_jmxproxy -U ' get=java.lang:type=memory&att=heapmemoryusage&key=used' \ -w c JMX CRITICAL: OK - Attribute get 'java.lang:type=memory' HeapMemoryUsage - key 'used' = * check_jmxproxy can be found at Tomcat has JMXProxyServlet. check_jmxproxy is a little Perl script I wrote to fetch data from JMXProxyServlet and provide Nagiosfriendly output. Same basic features of check_jmx except that Java and the JMX protocol aren't actually used: we use Tomcat's HTTP-tp-JMX proxy instead.
94 Nagios Monitoring Here's a glance at some values sampled in a production setting. We'll talk about the OOME one later.
95 JMX Command-line Tricks Show all logged-in usernames for sessionid in `wget -O - ' invoke=catalina:type=manager,context=/myapp,host=localhost&op=listsessioni ds' \ sed -e "s/ /\n/g" grep '^[0-9A-Za-z]\+\(\..*\)\?$' ;\ do wget -O " invoke=catalina:type=manager,context=/myapp,host=localhost&op=getsessionat tribute&ps=$sessionid,user" ; done 2>/dev/null \ grep User We store a user bean in our sessions, and so we can use some command-line tricks mixed with data from check_jmxproxy to list all the currently logged-in users. We can use similar tricks to expire all sessions that don't represent a logged-in user.
96 Tracking Values Over Time Some metrics are best observed as deltas Session count Request error count Requires that you have a history of data Requires that you consult the history of that data check_jmxproxy provides such capabilities What about data whose rate-of-change is more important than its current value? check_jmxproxy can store the previous value retrieved and then compare during the next invocation.
97 Tracking Values Over Time $./check_jmxproxy -U ' get=java.lang:type=memory&att=heapmemoryusage&key=used' -w c write number.out --compare number.out JMX OK: OK - Attribute get 'java.lang:type=memory' - HeapMemoryUsage - key 'used' = , delta=[...] $./check_jmxproxy -U ' get=java.lang:type=memory&att=heapmemoryusage&key=used' -w c write number.out --compare number.out JMX OK: OK - Attribute get 'java.lang:type=memory' - HeapMemoryUsage - key 'used' = , delta= $./check_jmxproxy -U ' get=java.lang:type=memory&att=heapmemoryusage&key=used' -w c write number.out --compare number.out JMX OK: OK - Attribute get 'java.lang:type=memory' - HeapMemoryUsage - key 'used' = , delta= Let's watch heap memory usage over a few invocations.
98 Tracking Values Over Time Session count Tomcat actually provides this already via Manager's sessioncreaterate attribute Request errors $./check_jmxproxy -U ' get=catalina:type=requestprocessor,worker="http-nio ",name=httprequest1&att=errorcount' -w 1 -c 10 --write errors.txt --compare errors.txt JMX OK: OK - Attribute get 'Catalina:type=RequestProcessor,worker="http-nio ",name=HttpRequest1' - errorcount = 0, delta=0 There are lots of data whose rates of change are more important than their current values. Session count and error count are among them.
99 Detecting OutOfMemory Many sources of OOME Heap exhaustion PermGen exhaustion Hit thread limit Hit file descriptor limit Let's talk about OutOfMemoryErrors. Of all monitoring questions I've heard about Java web applications, this one is always the first: how can I get notified about an OOME?
100 Detecting OutOfMemory Two types of heap OOME One thread generates lots of local references All threads collaborate to generate globallyreachable objects (e.g. session data) Former is recoverable, latter is not You want to be notified in any case Let's focus on heap OOME for a moment.
101 Memory Pool Thresholds Each memory pool in the JVM has an MBean to represent it. Here's the PermGen memory pool. You can see the current usage and there are a number of threshold values that you can set. Whenever the memory usage exceeds the threshold value, the JVM increments the UsageThresholdCount value and also publishes a notification to all interested listeners.
102 Memory Pool Thresholds Here's the Old (tenured) Generation with its usage expanded so you can see the individual values. I've also set a threshold of roughly 115 MiB, which I know is too low of a threshold: we'll exceed this before the GC kicks-in. Let's re-run my JMeter load test from earlier just to chew-through some heap memory and see if we can break the threshold.
Moving beyond hardware
 Moving beyond hardware These slides represent the work and opinions of the author and do not constitute official positions of any organization sponsoring the author s work This material has not been peer
TDA - Thread Dump Analyzer
 TDA - Thread Dump Analyzer TDA - Thread Dump Analyzer Published September, 2008 Copyright 2006-2008 Ingo Rockel Table of Contents 1.... 1 1.1. Request Thread Dumps... 2 1.2. Thread
Monitoring Apache Tomcat and the Apache Web Server. Rainer Jung
 Monitoring Apache Tomcat and the Apache Web Server Rainer Jung 2013 kippdata informationstechnologie GmbH 1 Monitoring Apache Tomcat and Web Server Rainer Jung ApacheCon NA 2013 Agenda Motivation Java
Intro to Load-Balancing Tomcat with httpd and mod_jk
 Intro to Load-Balancing Tomcat with httpd and mod_jk Christopher Schultz Chief Technology Officer Total Child Health, Inc. * Slides available on the Linux Foundation / ApacheCon2015 web site and at http://people.apache.org/~schultz/apachecon
Tomcat 5 New Features
 Tomcat 5 New Features ApacheCon US 2003 Session MO10 11/17/2003 16:00-17:00 Craig R. McClanahan Senior Staff Engineer Sun Microsystems, Inc. Slides: http://www.apache.org/~craigmcc/ Agenda Introduction
WebSphere Server Administration Course
 WebSphere Server Administration Course Chapter 1. Java EE and WebSphere Overview Goals of Enterprise Applications What is Java? What is Java EE? The Java EE Specifications Role of Application Server What
IBM WebSphere Server Administration
 IBM WebSphere Server Administration This course teaches the administration and deployment of web applications in the IBM WebSphere Application Server. Duration 24 hours Course Objectives Upon completion
Java Monitoring. Stuff You Can Get For Free (And Stuff You Can t) Paul Jasek Sales Engineer
 Paul Jasek Sales Engineer") Java Monitoring Stuff You Can Get For Free (And Stuff You Can t) Paul Jasek Sales Engineer A Bit About Me Current: Past: Pre-Sales Engineer (1997 present) WaveMaker Wily Persistence GemStone Application
Java Monitoring Stuff You Can Get For Free (And Stuff You Can t) Paul Jasek Sales Engineer A Bit About Me Current: Past: Pre-Sales Engineer (1997 present) WaveMaker Wily Persistence GemStone Application
Deployment and Monitoring. Pascal Robert MacTI
 Deployment and Monitoring Pascal Robert MacTI Contents Deployment Standard wotaskd/javamonitor Wonder s wotaskd/javamonitor Alternatives Monitoring Nagios JMX wotaskd/javamonitor Bundled with WO, as two
Ch-03 Web Applications
 Ch-03 Web Applications 1. What is ServletContext? a. ServletContext is an interface that defines a set of methods that helps us to communicate with the servlet container. There is one context per "web
How To Improve Performance On An Asa 9.4 Web Application Server (For Advanced Users)
") Paper SAS315-2014 SAS 9.4 Web Application Performance: Monitoring, Tuning, Scaling, and Troubleshooting Rob Sioss, SAS Institute Inc., Cary, NC ABSTRACT SAS 9.4 introduces several new software products
Paper SAS315-2014 SAS 9.4 Web Application Performance: Monitoring, Tuning, Scaling, and Troubleshooting Rob Sioss, SAS Institute Inc., Cary, NC ABSTRACT SAS 9.4 introduces several new software products
WEBLOGIC ADMINISTRATION
 WEBLOGIC ADMINISTRATION Session 1: Introduction Oracle Weblogic Server Components Java SDK and Java Enterprise Edition Application Servers & Web Servers Documentation Session 2: Installation System Configuration
A Talk ForApacheCon Europe 2008
 a talk for ApacheCon Europe 2008 by Jeremy Quinn Break My Site practical stress testing and tuning photo credit: Môsieur J This is designed as a beginner s talk. I am the beginner. 1 I will present two
A technical guide for monitoring Adobe LiveCycle ES deployments
 Technical Guide A technical guide for monitoring Adobe LiveCycle ES deployments Table of contents 1 Section 1: LiveCycle ES system monitoring 4 Section 2: Internal LiveCycle ES monitoring 5 Section 3:
Performance Monitoring and Tuning. Liferay Chicago User Group (LCHIUG) James Lefeu 29AUG2013
 James Lefeu 29AUG2013") Performance Monitoring and Tuning Liferay Chicago User Group (LCHIUG) James Lefeu 29AUG2013 Outline I. Definitions II. Architecture III.Requirements and Design IV.JDK Tuning V. Liferay Tuning VI.Profiling
Performance Monitoring and Tuning Liferay Chicago User Group (LCHIUG) James Lefeu 29AUG2013 Outline I. Definitions II. Architecture III.Requirements and Design IV.JDK Tuning V. Liferay Tuning VI.Profiling
CHAPTER 1 - JAVA EE OVERVIEW FOR ADMINISTRATORS
 CHAPTER 1 - JAVA EE OVERVIEW FOR ADMINISTRATORS Java EE Components Java EE Vendor Specifications Containers Java EE Blueprint Services JDBC Data Sources Java Naming and Directory Interface Java Message
Course Description. Course Audience. Course Outline. Course Page - Page 1 of 5
 Course Page - Page 1 of 5 WebSphere Application Server 7.0 Administration on Windows BSP-1700 Length: 5 days Price: $ 2,895.00 Course Description This course teaches the basics of the administration and
WebSphere Performance Monitoring & Tuning For Webtop Version 5.3 on WebSphere 5.1.x
 Frequently Asked Questions WebSphere Performance Monitoring & Tuning For Webtop Version 5.3 on WebSphere 5.1.x FAQ Version 1.0 External FAQ1. Q. How do I monitor Webtop performance in WebSphere? 1 Enabling
Oracle WebLogic Server 11g Administration
 Oracle WebLogic Server 11g Administration This course is designed to provide instruction and hands-on practice in installing and configuring Oracle WebLogic Server 11g. These tasks include starting and
Oracle JRockit Mission Control Overview
 Oracle JRockit Mission Control Overview An Oracle White Paper June 2008 JROCKIT Oracle JRockit Mission Control Overview Oracle JRockit Mission Control Overview...3 Introduction...3 Non-intrusive profiling
Welcome to the JReport Server Monitor User's Guide
 Welcome to the JReport Server Monitor User's Guide This User's Guide describes JReport Server Monitor. JReport Server Monitor, which is a standalone webbased application used to monitor the overall performance
EVALUATION ONLY. WA2088 WebSphere Application Server 8.5 Administration on Windows. Student Labs. Web Age Solutions Inc.
 WA2088 WebSphere Application Server 8.5 Administration on Windows Student Labs Web Age Solutions Inc. Copyright 2013 Web Age Solutions Inc. 1 Table of Contents Directory Paths Used in Labs...3 Lab Notes...4
Real-world Java 4 beginners. Dima, Superfish github.com/dimafrid
 Real-world Java 4 beginners Dima, Superfish github.com/dimafrid Real world Hundreds of computations per second Each computation of sub-second latency Massive IO Lots of data In Web/Trading/Monitoring/Cellular/etc./etc.
This training is targeted at System Administrators and developers wanting to understand more about administering a WebLogic instance.
 This course teaches system/application administrators to setup, configure and manage an Oracle WebLogic Application Server, its resources and environment and the Java EE Applications running on it. This
Monitoring HP OO 10. Overview. Available Tools. HP OO Community Guides
 HP OO Community Guides Monitoring HP OO 10 This document describes the specifications of components we want to monitor, and the means to monitor them, in order to achieve effective monitoring of HP Operations
Spectrum Technology Platform. Version 9.0. Spectrum Spatial Administration Guide
 Spectrum Technology Platform Version 9.0 Spectrum Spatial Administration Guide Contents Chapter 1: Introduction...7 Welcome and Overview...8 Chapter 2: Configuring Your System...9 Changing the Default
Tool - 1: Health Center
 Tool - 1: Health Center Joseph Amrith Raj http://facebook.com/webspherelibrary 2 Tool - 1: Health Center Table of Contents WebSphere Application Server Troubleshooting... Error! Bookmark not defined. About
MagDiSoft Web Solutions Office No. 102, Bramha Majestic, NIBM Road Kondhwa, Pune -411048 Tel: 808-769-4605 / 814-921-0979 www.magdisoft.
 WebLogic Server Course Following is the list of topics that will be covered during the course: Introduction to WebLogic What is Java? What is Java EE? The Java EE Architecture Enterprise JavaBeans Application
Identifying Performance Bottleneck using JRockit. - Shivaram Thirunavukkarasu Performance Engineer Wipro Technologies
 Identifying Performance Bottleneck using JRockit - Shivaram Thirunavukkarasu Performance Engineer Wipro Technologies Table of Contents About JRockit Mission Control... 3 Five things to look for in JRMC
Troubleshooting / FAQ
 Troubleshooting / FAQ Routers / Firewalls I can't connect to my server from outside of my internal network. The server's IP is 10.0.1.23, but I can't use that IP from a friend's computer. How do I get
How To Monitor A Server With Zabbix
 & JavaEE Platform Monitoring A Good Match? Company Facts Jesta Digital is a leading global provider of next generation entertainment content and services for the digital consumer. subsidiary of Jesta Group,
Monitoring Windows Servers and Applications with GroundWork Monitor Enterprise 6.7. Product Application Guide October 8, 2012
 Monitoring Windows Servers and Applications with GroundWork Monitor Enterprise 6.7 Product Application Guide October 8, 2012 Table of Contents Introduction...3 Definitions and Abbreviations...3 GroundWork
Monitoring Java Applications
 Monitoring Java Applications eg Enterprise v6.0 Restricted Rights Legend The information contained in this document is confidential and subject to change without notice. No part of this document may be
TIBCO Spotfire Statistics Services Installation and Administration Guide
 TIBCO Spotfire Statistics Services Installation and Administration Guide Software Release 6.0 November 2013 Two-Second Advantage 2 Important Information SOME TIBCO SOFTWARE EMBEDS OR BUNDLES OTHER TIBCO
Sample copy. Introduction To WebLogic Server Property of Web 10.3 Age Solutions Inc.
 Introduction To WebLogic Server Property of Web 10.3 Age Solutions Inc. Objectives At the end of this chapter, participants should be able to: Understand basic WebLogic Server architecture Understand the
Load Testing with JMeter
 Load Testing with JMeter Presented by Matthew Stout - mat@ucsc.edu JMeter Overview Java application for load testing and measuring performance Originally for web applications but has grown to support lots
JMETER - MONITOR TEST PLAN
 http://www.tutorialspoint.com JMETER - MONITOR TEST PLAN Copyright tutorialspoint.com In this chapter, we will discuss how to create a Test Plan using JMeter to monitor webservers. The uses of monitor
TIBCO Spotfire Statistics Services Installation and Administration
 TIBCO Spotfire Statistics Services Installation and Administration Software Release 7.0 February 2015 Two-Second Advantage 2 Important Information SOME TIBCO SOFTWARE EMBEDS OR BUNDLES OTHER TIBCO SOFTWARE.
TIBCO Spotfire Statistics Services Installation and Administration. Release 5.5 May 2013
 TIBCO Spotfire Statistics Services Installation and Administration Release 5.5 May 2013 2 TOC Contents Important Information...6 Related Documentation...7 Connecting with TIBCO Resources...8 Administration
MALAYSIAN PUBLIC SECTOR OPEN SOURCE SOFTWARE (OSS) PROGRAMME. COMPARISON REPORT ON NETWORK MONITORING SYSTEMS (Nagios and Zabbix)
 PROGRAMME. COMPARISON REPORT ON NETWORK MONITORING SYSTEMS (Nagios and Zabbix)") MALAYSIAN PUBLIC SECTOR OPEN SOURCE SOFTWARE (OSS) PROGRAMME COMPARISON REPORT ON NETWORK MONITORING SYSTEMS (Nagios and Zabbix) JANUARY 2010 Phase II -Network Monitoring System- Copyright The government
MALAYSIAN PUBLIC SECTOR OPEN SOURCE SOFTWARE (OSS) PROGRAMME COMPARISON REPORT ON NETWORK MONITORING SYSTEMS (Nagios and Zabbix) JANUARY 2010 Phase II -Network Monitoring System- Copyright The government
Oracle Enterprise Manager
 Oracle Enterprise Manager System Monitoring Plug-in Installation Guide for Apache Tomcat Release 12.1.0.1.0 E28545-04 February 2014 This document provides installation instructions and configuration information
Apache Jakarta Tomcat
 Apache Jakarta Tomcat 20041058 Suh, Junho Road Map 1 Tomcat Overview What we need to make more dynamic web documents? Server that supports JSP, ASP, database etc We concentrates on Something that support
Job Reference Guide. SLAMD Distributed Load Generation Engine. Version 1.8.2
 Job Reference Guide SLAMD Distributed Load Generation Engine Version 1.8.2 June 2004 Contents 1. Introduction...3 2. The Utility Jobs...4 3. The LDAP Search Jobs...11 4. The LDAP Authentication Jobs...22
Client-Server Architecture & J2EE Platform Technologies Overview Ahmed K. Ezzat
 Client-Server Architecture & J2EE Platform Technologies Overview Ahmed K. Ezzat Page 1 of 14 Roadmap Client-Server Architecture Introduction Two-tier Architecture Three-tier Architecture The MVC Architecture
Advanced Liferay Architecture: Clustering and High Availability
 Advanced Liferay Architecture: Clustering and High Availability Revision 1.1, Oct 2010 *Note: All of the configuration examples in 3 rd -party software (i.e. Apache, Sun Java) in this document are examples
JBoss AS Administration Console User Guide. by Shelly McGowan and Ian Springer
 JBoss AS Administration Console User Guide 1 by Shelly McGowan and Ian Springer Preface... v 1. We Need Feedback!... v 1. Overview... 1 2. Accessing the Console... 3 3. User Interface Overview... 5 4.
CF8 Server Monitor Introduction Produced April 15, 2008
 CF8 Server Monitor Introduction Produced April 15, 2008 Charlie Arehart Independent Consultant charlie@carehart.org Topics Overview A walkthrough of features Overview page Request, query, environmental
A Sample OFBiz application implementing remote access via RMI and SOAP Table of contents
 A Sample OFBiz application implementing remote access via RMI and SOAP Table of contents 1 About this document... 2 2 Introduction... 2 3 Defining the data model... 2 4 Populating the database tables with
FileNet System Manager Dashboard Help
 FileNet System Manager Dashboard Help Release 3.5.0 June 2005 FileNet is a registered trademark of FileNet Corporation. All other products and brand names are trademarks or registered trademarks of their
Web Performance, Inc. Testing Services Sample Performance Analysis
 Web Performance, Inc. Testing Services Sample Performance Analysis Overview This document contains two performance analysis reports created for actual web testing clients, and are a good example of the
Oracle WebLogic Server 11g: Administration Essentials
 Oracle University Contact Us: 1.800.529.0165 Oracle WebLogic Server 11g: Administration Essentials Duration: 5 Days What you will learn This Oracle WebLogic Server 11g: Administration Essentials training
visual interface dependency or relationship model of systems workflow engine comparator function poller
 discovery dependency or relationship model of systems Metric Store visual interface workflow comparator function poller Model of system polling/threshold/state system state state state state data) state
WebLogic Server 11g Administration Handbook
 ORACLE: Oracle Press Oracle WebLogic Server 11g Administration Handbook Sam R. Alapati Mc Graw Hill New York Chicago San Francisco Lisbon London Madrid Mexico City Milan New Delhi San Juan Seoul Singapore
Operations and Monitoring with Spring
 Operations and Monitoring with Spring Eberhard Wolff Regional Director and Principal Consultant SpringSource Copyright 2009 SpringSource. Copying, publishing or distributing without express written permission
1. Spring Batch Admin User Guide
 1. Spring Batch Admin User Guide Version : 1.3.0 Authors : Dave Syer Spring Batch Admin provides a webbased user interface that features an admin console for Spring Batch applications and systems. It is
JMemoryGuard (V1.2 above) provides new function Trend Analysis. Through memory usage log, it forecasts when memory will be exhausted.
 provides new function Trend Analysis. Through memory usage log, it forecasts when memory will be exhausted.") JMemoryGuard V1.2 ThinkPower Information Corp. Contact: (Taiwan)+886-2-27942668 (Shanghai)+86-21-60299788 E-mail: service@thinkpower.com.tw Introduction JMemoryGuard provides functions to monitor the JVM
JMemoryGuard V1.2 ThinkPower Information Corp. Contact: (Taiwan)+886-2-27942668 (Shanghai)+86-21-60299788 E-mail: service@thinkpower.com.tw Introduction JMemoryGuard provides functions to monitor the JVM
THE BUSY DEVELOPER'S GUIDE TO JVM TROUBLESHOOTING
 THE BUSY DEVELOPER'S GUIDE TO JVM TROUBLESHOOTING November 5, 2010 Rohit Kelapure HTTP://WWW.LINKEDIN.COM/IN/ROHITKELAPURE HTTP://TWITTER.COM/RKELA Agenda 2 Application Server component overview Support
Monitoring applications in multitier environment. Uroš Majcen uros@quest-slo.com. A New View on Application Management. www.quest.
 A New View on Application Management www.quest.com/newview Monitoring applications in multitier environment Uroš Majcen uros@quest-slo.com 2008 Quest Software, Inc. ALL RIGHTS RESERVED. Management Challenges
Profiling and Testing with Test and Performance Tools Platform (TPTP)
") Profiling and Testing with Test and Performance Tools Platform (TPTP) 2009 IBM Corporation and Intel Corporation; made available under the EPL v1.0 March, 2009 Speakers Eugene Chan IBM Canada ewchan@ca.ibm.com
Profiling and Testing with Test and Performance Tools Platform (TPTP) 2009 IBM Corporation and Intel Corporation; made available under the EPL v1.0 March, 2009 Speakers Eugene Chan IBM Canada ewchan@ca.ibm.com
Deploying and Managing SolrCloud in the Cloud ApacheCon, April 8, 2014 Timothy Potter. Search Discover Analyze
 Deploying and Managing SolrCloud in the Cloud ApacheCon, April 8, 2014 Timothy Potter Search Discover Analyze My SolrCloud Experience Currently, working on scaling up to a 200+ node deployment at LucidWorks
About This Document 3. Integration and Automation Capabilities 4. Command-Line Interface (CLI) 8. API RPC Protocol 9.
 8. API RPC Protocol 9.") Parallels Panel Contents About This Document 3 Integration and Automation Capabilities 4 Command-Line Interface (CLI) 8 API RPC Protocol 9 Event Handlers 11 Panel Notifications 13 APS Packages 14 C H A
Parallels Panel Contents About This Document 3 Integration and Automation Capabilities 4 Command-Line Interface (CLI) 8 API RPC Protocol 9 Event Handlers 11 Panel Notifications 13 APS Packages 14 C H A
Install guide for Websphere 7.0
 DOCUMENTATION Install guide for Websphere 7.0 Jahia EE v6.6.1.0 Jahia s next-generation, open source CMS stems from a widely acknowledged vision of enterprise application convergence web, document, search,
Getting started with OWASP WebGoat 4.0 and SOAPUI.
 Getting started with OWASP WebGoat 4.0 and SOAPUI. Hacking web services, an introduction. Version 1.0 by Philippe Bogaerts Philippe.Bogaerts@radarhack.com www.radarhack.com Reviewed by Erwin Geirnaert
OSGi Service Platform in Integrated Management Environments Telefonica I+D, DIT-UPM, Telvent. copyright 2004 by OSGi Alliance All rights reserved.
 OSGi Service Platform in Integrated Management Environments Telefonica I+D, DIT-UPM, Telvent copyright 2004 by OSGi Alliance All rights reserved. Today Management Environments Network Management. Monitors
24x7 Scheduler Multi-platform Edition 5.2
 24x7 Scheduler Multi-platform Edition 5.2 Installing and Using 24x7 Web-Based Management Console with Apache Tomcat web server Copyright SoftTree Technologies, Inc. 2004-2014 All rights reserved Table
Robert Honeyman http://www.honeymanit.co.uk rob.honeyman@honeymanit.co.uk
 An Introduction to WebLogic Administration Robert Honeyman http://www.honeymanit.co.uk rob.honeyman@honeymanit.co.uk WEBLOGIC 11G : WHAT IS IT? Weblogic 10.3.3-10.3.6 = 11g Java EE 5 compliant Application
1 How to Monitor Performance
 1 How to Monitor Performance Contents 1.1. Introduction... 1 1.2. Performance - some theory... 1 1.3. Performance - basic rules... 3 1.4. Recognizing some common performance problems... 3 1.5. Monitoring,
Performance Monitoring API for Java Enterprise Applications
 Performance Monitoring API for Java Enterprise Applications Purpose Perfmon4j has been successfully deployed in hundreds of production java systems over the last 5 years. It has proven to be a highly successful
TIBCO Spotfire Statistics Services Installation and Administration Guide. Software Release 5.0 November 2012
 TIBCO Spotfire Statistics Services Installation and Administration Guide Software Release 5.0 November 2012 Important Information SOME TIBCO SOFTWARE EMBEDS OR BUNDLES OTHER TIBCO SOFTWARE. USE OF SUCH
HOL2831 - Beat the Beast: Java Performance Problem Tracking with Open Source Tools
 HOL2831 - Beat the Beast: Java Performance Problem Tracking with Open Source Tools Miroslaw Bartecki Solution architect Capgemini Poland CONTACT DETAILS: MIROSLAW.BARTECKI@CAPGEMINI.COM Table of Contents
LockoutGuard v1.2 Documentation
 LockoutGuard v1.2 Documentation (The following graphics are screen shots from Microsoft ISA Server and Threat Management Gateway which are the property of Microsoft Corp. and are included here for instructive
Implementing a Well- Performing and Reliable Portal
 Implementing a Well- Performing and Reliable Portal Adam Rybicki arybicki@unicon.net Agenda I. Introduction II. Tools Needed III. Capacity Planning IV. Load Testing V. Automatic Failover VI. Performance
JBS-102: Jboss Application Server Administration. Course Length: 4 days
 JBS-102: Jboss Application Server Administration Course Length: 4 days Course Description: Course Description: JBoss Application Server Administration focuses on installing, configuring, and tuning the
B M C S O F T W A R E, I N C. BASIC BEST PRACTICES. Ross Cochran Principal SW Consultant
 B M C S O F T W A R E, I N C. PATROL FOR WEBSPHERE APPLICATION SERVER BASIC BEST PRACTICES Ross Cochran Principal SW Consultant PAT R O L F O R W E B S P H E R E A P P L I C AT I O N S E R V E R BEST PRACTICES
Citrix EdgeSight Administrator s Guide. Citrix EdgeSight for Endpoints 5.3 Citrix EdgeSight for XenApp 5.3
 Citrix EdgeSight Administrator s Guide Citrix EdgeSight for Endpoints 5.3 Citrix EdgeSight for enapp 5.3 Copyright and Trademark Notice Use of the product documented in this guide is subject to your prior
Tomcat Tuning. Mark Thomas April 2009
 Tomcat Tuning Mark Thomas April 2009 Who am I? Apache Tomcat committer Resolved 1,500+ Tomcat bugs Apache Tomcat PMC member Member of the Apache Software Foundation Member of the ASF security committee
Java VM monitoring and the Health Center API. William Smith will.smith@uk.ibm.com
 Java VM monitoring and the Health Center API William Smith will.smith@uk.ibm.com Health Center overview What problem am I solving? What is my JVM doing? Is everything OK? Why is my application running
Web services with WebSphere Studio: Deploy and publish
 Web services with WebSphere Studio: Deploy and publish Table of Contents If you're viewing this document online, you can click any of the topics below to link directly to that section. 1. Introduction...
As you learned about in Chapter 1, WebSphere Application Server V6 supports the
 23 J2EE Packaging, Enhanced EARs, and the Application Server Toolkit As you learned about in Chapter 1, WebSphere Application Server V6 supports the full Java 2 Platform, Enterprise Edition (J2EE) 1.4
Solutions for detect, diagnose and resolve performance problems in J2EE applications
 IX Konferencja PLOUG Koœcielisko PaŸdziernik 2003 Solutions for detect, diagnose and resolve performance problems in J2EE applications Cristian Maties Quest Software Custom-developed J2EE applications
Tcat Server User s Guide. Version 6 R2 December 2009
 Tcat Server User s Guide Version 6 R2 December 2009 Confidential The ideas contained in this publication are subject to use and disclosure restrictions as set forth in the license agreement. Copyright
ELIXIR LOAD BALANCER 2
 ELIXIR LOAD BALANCER 2 Overview Elixir Load Balancer for Elixir Repertoire Server 7.2.2 or greater provides software solution for load balancing of Elixir Repertoire Servers. As a pure Java based software
Blackboard Learn TM, Release 9 Technology Architecture. John Fontaine
 Blackboard Learn TM, Release 9 Technology Architecture John Fontaine Overview Background Blackboard Learn Deployment Model and Architecture Setup and Installation Common Administrative Tasks Tuning Integrating
Performance Analysis of webmethods Integrations using Apache JMeter Information Guide for JMeter Adoption
 TORRY HARRIS BUSINESS SOLUTIONS Performance Analysis of webmethods Integrations using Apache JMeter Information Guide for JMeter Adoption Ganapathi Nanjappa 4/28/2010 2010 Torry Harris Business Solutions.
Oracle WebLogic Thread Pool Tuning
 Oracle WebLogic Thread Pool Tuning AN ACTIVE ENDPOINTS TECHNICAL NOTE 2010 Active Endpoints Inc. ActiveVOS is a trademark of Active Endpoints, Inc. All other company and product names are the property
HP OO 10.X - SiteScope Monitoring Templates
 HP OO Community Guides HP OO 10.X - SiteScope Monitoring Templates As with any application continuous automated monitoring is key. Monitoring is important in order to quickly identify potential issues,
How to Enable Remote JMX Access to Quartz Schedulers. M a y 1 2, 2 0 1 5
 How to Enable Remote JMX Access to Quartz Schedulers M a y 1 2, 2 0 1 5 Table of Contents 1. PURPOSE... 3 2. DEFINITIONS... 4 3. ENABLING REMOTE JMX ACCESS... 5 3.1 JMX/RMI... 6 3.1.1 Apache Tomcat...
New Relic & JMeter - Perfect Performance Testing
 TUTORIAL New Relic & JMeter - Perfect Performance Testing by David Sale Contents Introduction 3 Demo Application 4 Hooking Into New Relic 4 What Is JMeter? 6 Installation and Usage 6 Analysis In New Relic
STREAMEZZO RICH MEDIA SERVER
 STREAMEZZO RICH MEDIA SERVER Clustering This document is the property of Streamezzo. It cannot be distributed without the authorization of Streamezzo. Table of contents 1. INTRODUCTION... 3 1.1 Rich Media
BEAJRockit Mission Control. Using JRockit Mission Control in the Eclipse IDE
 BEAJRockit Mission Control Using JRockit Mission Control in the Eclipse IDE Mission Control 3.0.2 Document Revised: June, 2008 Contents 1. Introduction Benefits of the Integration................................................
NetBeans Profiler is an
 NetBeans Profiler Exploring the NetBeans Profiler From Installation to a Practical Profiling Example* Gregg Sporar* NetBeans Profiler is an optional feature of the NetBeans IDE. It is a powerful tool that
mod_cluster A new httpd-based load balancer Brian Stansberry JBoss, a division of Red Hat
 mod_cluster A new httpd-based load balancer Brian Stansberry JBoss, a division of Red Hat Agenda Who is Brian Stansberry? Principal Software Engineer at Red Hat Technical Lead for JBoss Application Server
Using jvmstat and visualgc to Solve Memory Management Problems
 Using jvmstat and visualgc to Solve Memory Management Problems java.sun.com/javaone/sf 1 Wally Wedel Sun Software Services Brian Doherty Sun Microsystems, Inc. Analyze JVM Machine Memory Management Problems
SAIP 2012 Performance Engineering
 SAIP 2012 Performance Engineering Author: Jens Edlef Møller (jem@cs.au.dk) Instructions for installation, setup and use of tools. Introduction For the project assignment a number of tools will be used.
Java Management Extensions (JMX) and IBM FileNet System Monitor
 and IBM FileNet System Monitor") Java Management Extensions (JMX) and IBM FileNet System Monitor Derive J2EE statistics from FileNet System Monitor alerts Level: Introductory Steven J. Bass 01.Mar.2009 Scope: Does your customer want to
Java Management Extensions (JMX) and IBM FileNet System Monitor Derive J2EE statistics from FileNet System Monitor alerts Level: Introductory Steven J. Bass 01.Mar.2009 Scope: Does your customer want to
DEPLOYMENT GUIDE Version 1.0. Deploying the BIG-IP LTM with the Nagios Open Source Network Monitoring System
 DEPLOYMENT GUIDE Version 1.0 Deploying the BIG-IP LTM with the Nagios Open Source Network Monitoring System Deploying F5 with Nagios Open Source Network Monitoring System Welcome to the F5 and Nagios deployment
Installation and configuration of Real-Time Monitoring Tool (RTMT)
") Installation and configuration of Real-Time Monitoring Tool (RTMT) How to install and upgrade RTMT, page 1 Services, servlets, and service parameters on server, page 5 Navigation of RTMT, page 6 Nonconfigurable
Installation and configuration of Real-Time Monitoring Tool (RTMT) How to install and upgrade RTMT, page 1 Services, servlets, and service parameters on server, page 5 Navigation of RTMT, page 6 Nonconfigurable
Oracle WebLogic Foundation of Oracle Fusion Middleware. Lawrence Manickam Toyork Systems Inc www.toyork.com http://ca.linkedin.
 Oracle WebLogic Foundation of Oracle Fusion Middleware Lawrence Manickam Toyork Systems Inc www.toyork.com http://ca.linkedin.com/in/lawrence143 History of WebLogic WebLogic Inc started in 1995 was a company
Using New Relic to Monitor Your Servers
 TUTORIAL Using New Relic to Monitor Your Servers by Alan Skorkin Contents Introduction 3 Why Do I Need a Service to Monitor Boxes at All? 4 It Works in Real Life 4 Installing the New Relic Server Monitoring