DAY TRADING WITH THE INSTITUTIONS by Jay Wireman
|
|
|
- Phoebe Spencer
- 10 years ago
- Views:
Transcription
1 DAY TRADING WITH THE INSTITUTIONS by Jay Wireman

2 Welcome everyone to my top day trading setups. Below you will find my powerful techniques using my proprietary symmetry software package that I have developed over the last 18 years which will help you trade the currency and futures markets with great precision. My setups were designed to buy strength and sell weakness. In other words, buy retracements in up trends and sell retracements in down trends. Using this snap back approach will allow you to position yourself with the institutions and not fade the market with the public. When the public is fading or counter trend trading a trade, we are waiting for a pullback buy or sell with the tone of my larger time frame. My setups will buy high and sell higher or they will short low and cover lower with extreme accuracy. You will know the exact entry, stop placement and how to trail your winning position on every trade setup to the exact bar. I invite you to come into my live day trade room and watch these setups live. We day trade the Euro, British Pound, Aussi and the SP500 futures in my live day trading room. Also, I have indicators and an e book setup that are stand alone outside of my live room. I'll go over both in this e book. Make sure you read my trading comments on the following charts. I marked the charts up so you can understand that these patterns happen over and over everyday. You only need to master a few of these setups to extract many ticks and pips. I have included my top setups so that you are able to read price action and know exactly what to do the minute you turn on your computer. These setups that you are about to learn work together. Once you have learned how to apply all of them, the market will become a level playing field with you and the institutions that control it. Remember, master one or two setups at first. My "Sweet Spot" trade by itself can make your entire day, week, month and year. When it does come up, its explosive. After learning my setups, it will be up to you to execute your day trading plan. My system will give you the edge to have an advantage over your opponents. Finally, you will not trade just to trade. You will be watching for defined high probability daily setups. Remember, less is more. Over trading your account will only lead to disaster. You must have a set of great reward to risk setups or you will not survive very long in this battlefield. Nothing is more important than a traders profit to loss monthly statement. Taking losses to get to that point is just a business expense. This is the key to becoming an elite trader. Keep your losers small and trading high reward to risk subsequent positions using my symmetry dots to reduce risk and increase profits. Remember, read the marked up charts. I have condensed 5 books into one

3 e book for you. You will start to see these patterns repeat over and over with live screen time on a daily basis. If you do decide that my live day trading room is not for you, then I have put together a package of my symmetry indicators and e book setup as a stand alone day trading package for any market. These indicators work for both Tradestation and Ninja trader. Visit for more information. Let's get started. The following setups will be reviewed in detail in this e book minute tone with 1 minute entry using my 40% and 60% bar count setup. This setup allows you to buy strength in up trends and sell weakness in down trends. 2. "Sweet Spot" Trade. This is my favorite setup. With the bar count or my triangle squeeze indicator coming up right at or near my daily and weekly institutional numbers minute bar count setup with 1 minute entry. This setup requires the 5 minute bar count to qualify using my 40%-60% rules. 1 minute chart will be used for entry. 4. Knowing when a market is about to trend change and how to trade it. The trend is your friend unless its about to end. I show you how to know when this can happen. 5. Using my proprietary leading triangle squeeze indicator for explosive vertical moves in all markets. You can use this with my symmetry indicators as a stand alone system. These are two leading indicators for Tradestation and Ninja platforms or view in my live day trading room. Confluence with my bar counts or institutional numbers in my live room add confluence to the setup. 6. My e book trade that works on all markets. This is a setup that I use with major news events minutes after the release. A powerful setup when major monthly news reports are released. The reward to risk on these trades can be as high as 10-1 or even higher depending on the news. Non-farm payrolls, unemployment, consumer price index, producer price index, gross domestic product and federal reserve

4 news are just a few of the monthly releases. You can print your free red briefcase impact news reports every Sunday night for the entire week at This will allow you to focus during a specific news event. These trades can be very rewarding once you understand my methodology. I give free weekly workshops to all e book buyers to discuss entry, stops and exits. My symmetry indicators work great to scale using this technique. If day trading the SP500 or the Russell 2000 then trade red impact news events against the USD. This setup works on news on any market. Crude Oil reports every week at 10:30est. works great with this setup. Also, you will know the exact zone to buy or sell with or without news starting at 8:30 est. everyday. I prefer news due to the huge reward to risk. 7. I show all SP500 futures traders how my members in my live day trading room take advantage of my support/resistance levels. I give you two sets of numbers. One set for the overnight session and another set of numbers at the New York open. You will use my numbers monthly, weekly and daily numbers to trade confluence levels. I have additional support/resistance levels on the charts. These are the core setups in my trading room. The e book trade setup rules are not to be discussed in my live room. Just general talk because everyone that owns the e book must sign a disclosure. All other techniques are used in my live room. Let's get started. You will log into two different omnovia rooms. 1. The COUNTDOWN room will show the Euro, British Pound, Aussi and the S&P500 futures. All the currency markets are based off the current contract of the CME. If you trade the forex, then trade the Eur/Usd or Gbp/Usd and Aussi against the U.S. dollar. They will call the exact lows and highs as the CME markets. You can log into the countdown room several times to view each market on your different monitors depending which markets that you trade. Jerel will help you do this if you are having a problem. All the currency markets will have a 5 minute chart for tone and a 1 minute chart to execute trades. SP500 futures traders can view my confluence levels for setups. The S&P500 futures will have two charts to view confluence. One chart will run 23 out of 24 hours and the other chart will be used at the opening of the New York opening bell. Both will be 5 minute charts. 2. The RETRACEMENTS room will have my Papa charts. This is the room that I speak in everyday from

5 9-11am est. and is used for my members to chat. All trials must log into this room and have speakers on at 9am sharp on Tuesday. Also, the retracement room is used to place my monthly, weekly and daily support/resistance numbers under the annoucement tab and the daily numbers are updated every evening between 6-7 pm est. These are very important levels to look for daily or weekly confluence at the same levels and to be aware where my "Sweet Spot" setup will occur. No chatting will be allowed in the countdown room. These two rooms are all you are going to need watch for my live setups.i keep these rooms running 23 out of 24 hours a day. Trades will not be called out to "Buy Now" or "Sell Now". I teach you how to enter, stop and trail all my setups. Since this room runs 23 hours a day, you must learn these setups. The setups that I'm about to teach you repeat themselves over and over. I teach you how to do that. I have done all the hard work for you. I know what works and what does not work. This puts you in control of your financial future as a day trader. Its up to you to execute the trades according to your day trading plan using my setups to give you the edge to trade with the institutions. (1) 5 minute tone with 1 minute 40%-60% bar count entry Prices must be above/below both the white and magenta ma s on the 5 min. chart. The wider the spread between the ma s and the angle of the ma s show the strength of the trend. You want a degree angle with prices above or below both ma s which indicates great 1 minute bar count setups. If both ma s are flat or sideways and close together then you are in a choppy non trending market and 40%-60% trades should be avoided. Also, if prices on the 5 minute chart are in between both ma s it will indicate a possible pause in the market and possible trend change. I will go over the trend change rule later. 5 minute tone up=the white ma is crossed above the magenta ma. Prices are above both ma s. The angle of the ma s will show the strength of the tone. The wider the spread between the two ma s and the angle increase the strength of the move. 5 minute tone down=the white ma is crossed below the magenta ma. Prices are below both ma s. Tone or bias has now been established with the 5 minute chart. Only take 1 minute 40%-60% bar counts with the tone. Remember, the spread between the ma's and the angle of the ma's show the strength of the push. Also, if the market has a nice spread between the ma's and a nice angle, look at prices. If prices are away from the white ma, the market is in a hard move up or down.

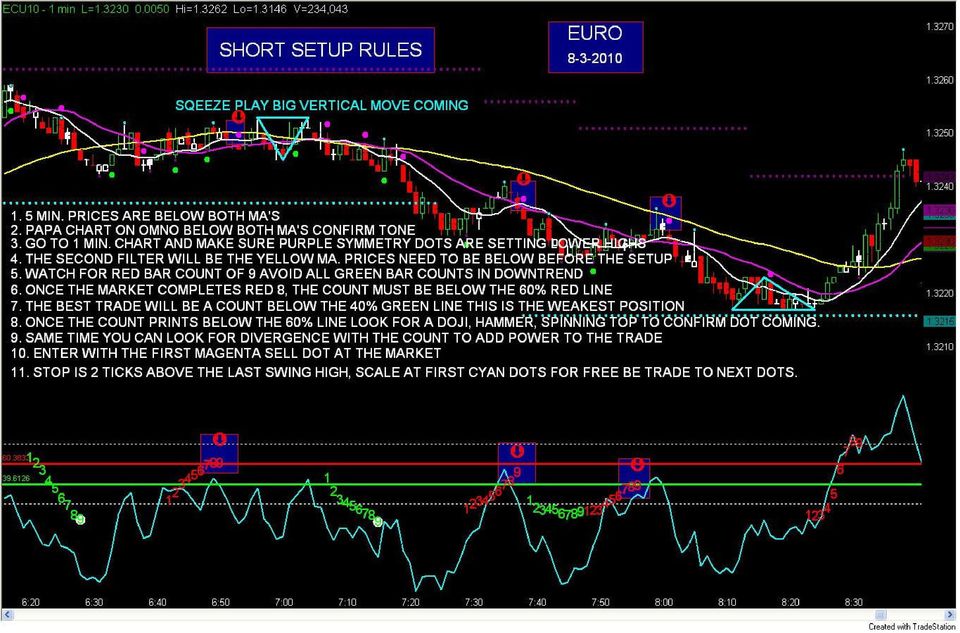
6 SHORTS ***Tone of the 5 minute chart must be down*** Go to your 1 minute chart and go through the following check list in this order. 1. The purple symmetry dots must be setting lower highs 2. Prices must be below the yellow ma. I look at the other two ma s to see how wide the spread is from the yellow ma before the retracement to show the strength. The wider the spread from the yellow ma before the bar count retracement will indicate a stronger setup. In other words, you want the yellow ma to be angled down with a wide spread between it and the other two ma s before the bar count retracement. 3. Watch for red number count setups only. The green bar counts do not mean anything in a downtrend. White bar count setups will be discussed soon. You will watch for the red bar counts to count to 8 or 9 and they must print at least below the red solid horizontal 60% line in order to be a sell setup. The best setup for a short will be a 8 or 9 print below the green 40% line. This shows major weakness in the market. 4. Once the 7 red number count has printed you must look up at prices and watch for a doji, hammer or spinning top to indicate a possible turning point on the retracement and to get ready for a magenta sell dot to enter. The 8 or 9 red bar count print MUST be touching or below the 60% line before the magenta sell dot and the 8 or 9 bar MUST be the swing high or low before the dot. 5. Once the bar the 8 or 9 bar prints and prices are at the swing high or low, enter with the first magenta sell dot. 6. After entry, place hard stop 2 ticks above the recent swing high. 7. Your first target will be the cyan symmetry dots below prices. Take off half your position here or scale. Place the rest of your contracts break even and go for the next symmetry dots or next institutional number depending on 5 minute tone strength. LONGS ***Tone of 5 minute chart must be up*** Go to your 1 minute chart. 1. Cyan symmetry dots must be setting higher lows on the 1 minute 2. Prices must be above the yellow ma. Look at the spread of the ma's before the retracement. 3. Watch for green bar counts only. Red bar counts do not count. White counts will be discussed soon.

7 4. On the 7 count watch for prices to form a doji, hammer or spinning top. 5. The green bar count must print at least an 8 or 9 above 40%. Any print below 40% before the green buy dot will cancel the trade. Also, the 8 or 9 must be the swing low before the green dot. 6. Once the print qualifies, enter with the first green buy dot. 7. Place hard stop 2 ticks below the recent swing low, typically only a few bars before the green dot. 8. Target will be the purple symmetry dots. Scale contracts at this level. You now have a free trade to the next symmetry dots or institutional level. Key Points: ***Sometimes the counter trend retracement will be strong or weak and you will see white bar counts that pop up over the red or green 9 bar counts when the 9 prints. If this happens, do not enter with the magenta or green dot. You must wait until the 8 or 9 price bar swing low or high is closed below or above by a whole candle above/below the 8 or 9 bar wicks to pull you in*** ***You will notice a cyan line going through my bar counts. This will be used as a divergence indicator with tone. Anytime you get an 8 or 9 bar count with the 5 minute tone and the cyan single bar over the counts is showing divergence, makes the trade extremely powerful. Remember, divergence with the bar count and in the direction of the 5 minute tone. Do not count trend trade divergence against the tone. You can start looking for divergence at the 7 bar count. Divergence with tone trades happen all day long. I want my symmetry dots to line up with 5 minute ma tone to execute without a bar count. Remember, once your get screen time with my system, you will notice several trades with divergence with tone. For example, if i break below one of my weekly or daily numbers and retest that number, I will look for divergence. If I have divergence with the 5 minute tone and my symmetry dots are in my direction and I have great spread on with my 1 minute ma's then I'll wait for the retest and wait for a whole candle close below the doji, spinning top or hammer on the retest. This works well on my monthly as well*** ***An 8 or 9 red bar count must print at or below the 60% red line for shorts. If the 8 or 9 prints below the 40% green line it will indicate major weakness in the market and a great short setup. Below 40% is the best trade of the two shorts. Opposite for buys. The 8 or 9 green number count must print above/touch the 40%

8 green line before the green dot. The market will show major strength if the 8 or 9 green count prints above the 60% red line. This will indicate a hard vertical move coming. Remember, the bar counts are measuring the overall strength or weakness of the market you are trading. If it is a shallow retracement then you will get a green 8/9 buy above 60% or red 8/9 sell below 40%. This means the major players are ready to move the market hard and fast*** ***Remember, the best time to trade is from 2am-11am est. You can break it down into the best time slots that fit your lifestyle. The majority of traders trade either the 2am-5am or the 8-11am setups. My setups still work 23 out of 24 hours a day, I prefer to trade them with volume. Also, the best trend trades will happen when prices are above or below both ma s on the Papa chart with the 5 min. The wider the spread of the papa ma s, means a hard push is coming***

9 The Papa Chart tells me what market is in a hard up trend or down trend. You will see three different different currency markets in the retracement room. Left to right in the room will be the Euro, British Pound and the Aussi. 5 minute tone is enough to give me my overall tone, however, the Papa charts allow me to measure the intra day strength off of a much larger time frame. Just a quick glance and you will know in seconds what markets are trending and what markets are choppy. The first clue is to look at the angle of the magenta ma. If it is flat or horizontal then expect a tight trading range or choppy market. If the

10 magenta ma is at a nice degree angle then expect the market to be trending. Also, prices that are above/below both ma's with spread indicate a market that will not have much support/resistance and major moves are coming. The wider the spread between the ma's the stronger the move. Once you get inside of one of the ma's, the market tends to slow into a trading range again or possible trend change. I go over this trader later. Watch your 5 minute chart for the same price action. Very simple, more spread equals more bread. The more distance that you get away from the white ma and being above/below both the stronger move that you will have. Once again, use the Papa chart as confirmation of big moves. Also, I put my number one institutional daily number on the Papa chart every night as a solid yellow line. This area is great for a "Sweet Spot" trade. Above this the market tends to rally. Below this the market tends have a short bias. Let's look at the 5 minute tone with my 1 minute entry. Remember, spread is key.

11
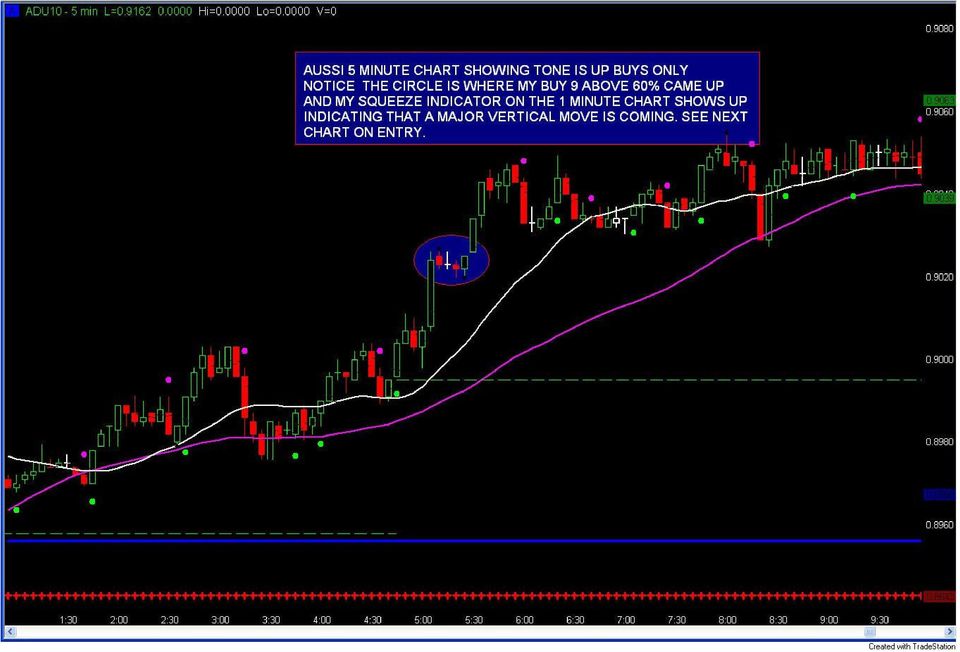
12 Take note of the spread on the 5 minute chart. Notice the white ma is moving away from the magenta. This is a clue that the market is in a hard trend up. Also, prices were above both ma's on the 5 minute chart indicating strength. Only take green 9 or white 13 buys on the 1 minute chart that qualify above 40%. Do not take any red bar counts. Never go against the 5 minute tone. Prices were clearly above both ma's with good spread and separation from the white ma. Notice how my triangle called the pause in the market for

13 the big vertical push. I'll show you my entry technique with my triangle squeeze play later. This happens a lot when the 5 minute ma spread or Papa spread gets wide. Remember, a 8/9 green buy above 60% is the stronger position. Just as the red 8/9 red count below 40% is the weakest position. All buy counts must be at least above 40% and all sell counts must at least print below 60% before the magenta sell dot or green buy dot. If the swing high or swing low is broken after the count before the dot in the opposite direction of your trade then no trade will be taken. In other words, the 8 or 9 count must call the swing high or low before the dot. This method works great because you will always be buying strength and selling weakness on retracements or snapbacks. Read the rules on the following chart. This is the exact process that I go through everyday when looking for short trades based on my 5 minute tone with my 1 minute 9 red bar count. Opposite for buys.

14
15 Two back to back green buy 8/9's above 60%. Notice the spread on your 1 minute moving averages.

16 The chart above is very very important. My top "Sweet Spot" trade will look just like this. Once a daily or weekly number has been broken or tested the area becomes active for a powerful move. The first qualified 8/9 bar count or triangle in the direction of the break or test can become very explosive. I'll go over this setup in

17 detail later. This was a buy 9 above 60%. Major strength. Notice my cyan symmetry dots are setting a higher low and the spread on my ma's indicating major strength. Just wait for the green bar count retracement to qualify above at least 40% then enter with green momentum dot. Place your stops 2 ticks below the recent swing low and exit your first position at the purple symmetry dots. Trail your winning position.

18 First a buy 9 above 40% then a buy 9 above 60%. Notice the spread between the two smaller ma's and the yellow ma on the buy retracement.

19 This is another very important note. This was a sell 9 below 40% and it just broke my blue institutional number. Remember, I told you that my most important number is my blue daily number to look for a "Sweet Spot" trade! What really stands out here is that when the market retraced with a red sell 9, it has major sell divergence. This is key. I have seen hundreds of these setups like this. Divergence with Tone. Tone meaning the direction of the 5 minute chart and divergence in that

20 direction off the 1 minute symmetry dots and ma's. 9 out of 10 novice traders lose because they fade or counter trend trade. Notice the symmetry of the market. My cyan dots were setting higher lows all morning. Only take buys! You can see using my symmetry dots and my yellow moving average spread are two really great filters before the bar count. These two filters allow you anticipate a powerful move after a retracement.. Also, it prevents you from counter trend trading. My symmetry dots and triangle alone are very powerful when

21 used together on any market. The symmetry dots are used for higher lows and lower highs to show us our bias. They are also used to scale for our free trade on the subsequent position. This is great money management to reduce risk early in the trade. I call this my free trade. Notice how the purple dots are used to scale the position. Once scaled you have zero risk in the trade. This is the only way to trade any market. Doing this on a consistent basis will always put you in a position to trail a large winner.
22 This chart speaks volumes for my symmetry indicator. Higher lows all the way up. Notice my green bar count 60% buys and my two triangle squeeze play that called the major move up. I'll go in detail on the triangle squeeze soon.
23 The Euro breaks above my most important blue number for a nice "Sweet Spot" 9 buy above 60%. The key is to look how the purple symmetry dots get you out for a free trade so you can take a risk free trade to the next symmetry dots.
24 9 red sell below 60% "Sweet Spot" trade. Look how symmetry set lower highs all the way down. Cyan dots are now used for scaling when shorting.
25 Three back to back green 9 buys above 40%. Notice the second 9 buy. Divergence with tone. Divergence using the 1 minute chart with 5 minute tone is very very powerful.
26 Divergence with symmetry dot tone. Purple symmetry dots setting lower highs. Shorts only!
27 6 back to back red count 40-60% shorts. Remember, never take green bar counts in down trends. Notice the Divergence with tone at 7:15. My triangle squeeze indicator comes up with Divergence with tone. That is confluence. This setup happens all the time.
28 Notice my stop placement on the two red 9 sells. 2 ticks above the recent swing high. Target on shorts will be my leading cyan symmetry dots to scale.
29 Notice how the bar count and the triangle squeeze works together. Confluence!!!!!
30 (1)"Sweet Spot" trade started it. (2) 9 red bar count below 40% (3) Divergence with tone and bar count below 40%
31 This chart just proves to you after a 180 tick drop that the institutions were not done selling yet. Short low and buy lower. Buy high and sell higher. This is how they will continue to out smart the public.
32 Read this chart. No subjectivity just execution of a defined trading plan. Same setups over and over every single week. If the setup qualifies then take the trade. If the setup does not qualify then do not take the trade. Keep it simple. Let the market come to you. Stop trading just to trade. What for the setup.
33 Two key points on this one. Symmetry dots setting lower highs and look at the 1 minute spread before the retracement. Spread=Bread.
34 Divergence with tone. 9 green buy count above 60%. Look at the ma spread.
35 4 shots taking the Euro long. Remember, no red bar counts in up trends. Only green bar counts and white 9 or 13's above at least 40%. Remember, when dealing with white numbers over top the green or red bar counts or by themselves, just wait for a whole candle stick body close in the direction of the trade. Do not use the momentum dots with white numbers. Stop will be the same. White numbers just mean that the retracement is stronger than expected and you must qualify the trade by letting a whole candle close above or below the 8 or 9 count. The green and red number counts just use the momentum dots.
36 Notice when the white 13 comes up. Prices closed above the bar high at the 13 count above 40%.
37
38 Notice how important the symmetry dots are on both charts. I sell the symmetry dots, news indicator, 830am est. e book trade, and my triangle squeeze indicator for Tradestation and Ninja. They work all all markets. Below is the forex Eur/Usd with my symmetry dots. Once you know the symmetry of the market and when the vertical moves are ready to happen, the market becomes a level playing field with you and the institutions. Counter trend traders and scalpers tend to be the novice traders that do not survive very long. They symmetry dots solve this problem. They not only provide you with the direction or bias, they give you the scale out for your free trades. This allows you to not turn a winning position into a losing one. Once you scale out, a risk free trade is on the books. The triangles allow you to watch for
39 the vertical move and enter with very low risk. (2) SWEET SPOT TRADE This is by far my favorite setup. At 6pm est., I calculate 3 different support/resistance levels. These daily
40 levels are placed under the announcement tab and show up on the 5 min. and 1 min. charts automatically as blue, green and red plus signs(+++++). Weekly numbers will show up as blue, green and red dots( ) and the monthly numbers as a solid blue, green and red line( ). The Sweet Spot setup happens when one of these institutional levels are broken and a red or green bar count pulls you in the trade in the direction of the break. The number count must be green for buys above 40% for breakouts and red number counts below 60% for breakdowns. Remember, the white counts have a special bar pull in. You will look for this setup right after the break or retest of an institutional number. This setup will move the markets with little risk and huge moves due to the institutional break and the number count showing strength or weakness to pull you in. Day trading just this setup can make your entire week, month and year as a day trader. Triangle squeeze plays that come up on these levels are also very important trading setups.
41
42
43 REMEMBER, I give 3 daily numbers out and 3 weekly. Once these numbers are broken or tested look for the "Sweet Spot" trade. Bar count and triangle plays.
44 Notice how I had confluence with all my indicators.
45 Once my daily or weekly numbers are broken or tested, I look for my bar count to pull me in.
46
47
48
49 Notice the break of the apex of the triangle was the support for the 9 buy above 60%. (3)5 MINUTE BAR COUNT WITH 1 MINUTE ENTRY You must use the same 40%-60% rules as the 1 minute only this time you will wait for the 5 minute chart to show a 8 and 9 bar count. For shorts, you will want the 8 and 9 bar count below 60% on the 5 min. chart. For longs, you will want the 8 or 9 above the 40% line on the 5 min. chart. Also, all bar counts on the 5
50 minute chart must be in direction of the 5 minute tone and must qualify as a 40%-60% trade. Shorts-Let the 5 min. chart print the 8 below 60% and look at the 8 price bar low. Once you find that price bar low of the 8 count, place that number on your blank 1 minute chart. A whole candle close below that level on the 1 minute chart will be your entry. Your stop will be 2 ticks above the swing high. If the close of the 8 price bar is not closed below, you can wait until the 9 count price bar closes and look at the low of that 5 minute bar. Place that on your 1 minute chart. A close below this on the 1 minute will now be your entry. No trade will be taken if after the 8 or 9 bar does not pull you in. This trade produces some really big moves because you are waiting on a 8 or 9 bar retracement on a 5 minute chart. Remember, if looking for shorts. Prices must be below both ma s on the 5 minute chart so when the bar count retracement happens you are trading with the tone. Opposite for buys.
51 To execute this setup, you must let the 5 minute chart print an 8/9 bar with the same 40-60% rules as the 1 minute. Once the 5 minute has printed, you can enter off of the 1 minute. See chart below. Compare the 5 minute chart with the 1 minute below. The 5 minute sets it up and the 1 minute is used for entry.
52
53
54
55
56
57
58 (4)TREND CHANGE TRADE This happens when prices have been above or below both ma s on the 5 minute chart for hours upon hours and after a tick plus move in one direction. If the spread is wide between the white ma and magenta ma after many hours, a whole candle close below the white ma for the first time will indicate a possible
59 trend change. Once the candle closes a whole body close below the white ma, watch your 1 minute chart for a 40%-60% buy or sell to pull you in on the trend change. For example, if the Euro has moved 100 ticks straight up and above both ma s, once you get a whole candle close below the white ma on the 5 min. chart, watch the 1 minute chart for a red 9 bar count sell below 60% to pull yourself in. Great reward to risk on this trade. These moves can be very fast and very profitable. Remember, only after big moves with spread.
60 (5)TRIANGLE TRADES(BIG VERTICAL MOVE COMING) When you see a triangle pop up and its over top of one of my institutional numbers, then look for a huge vertical move. My triangles were designed to give you heads up on a big vertical move. They are great with or without the bar count and can be used as a stand alone indicator with my symmetry dots. You have two ways to trade the triangle. First, you want the triangle to have a small spread between the apex and the base. The smaller distance the more powerful the squeeze. Once the triangle pops up, you want to see what the 5 minute tone is doing. If the 5 min tone is hard up, you will look for a pull back to the bottom of the triangle and take the first green dot, stop will be whole candle close above/below the base or apex. The second way would be to wait for a close above the base or apex in the direction of the 5 minute tone and place your stop with a close below the base or apex breakout bar. You can always use the opposite side of the triangle as a stop to make it simple. Also, the triangle will call tops and bottoms when it comes up when the 5 minute chart is stalling with a pair of doji s, pair of spinning tops or a pair of hammers. In other words, if you see that the 5 minute is stalling with one of my candle formations into resistance or support and a triangle comes up, its a major possible top or bottom.
61
62
63
64
65
66
67
68
69
70 (6)E BOOK SETUP This is a real special setup that I ve been using since Everyday at 830am est., I have a special zone to buy/sell any futures, forex or commodities market off of a blank chart. Typically, within the first 20 minutes of trading, I will know within a few ticks to be a buyer or seller in a small zone on any market. You will never find a trade setup with news events like this setup. Nothing beats this reward to risk minutes after a news event is posted. This setup lets you know minutes after a news event is released to capture ticks moves with less than 10 tick stops in the currency markets and a hard 6 tick stop on the S&P500 market. My symmetry dots really help to get you out of the first contracts to have a free trade for the big move. Remember, this works on non news and major news days. This can be used on any trading platform and off of a blank chart. Please visit to view my videos and my indicator packages for Ninja and Trade station. Also, I offer a free weekly workshop for e Book buyers to review setups in all markets.
71 Minutes after the fed news, my e book buyers knew the exact level to the tick to look for my setup. These trades can be very explosive with very little risk. Notice how my symmetry dots can be used to scale out after entering the trade. This gives you a free trade with a possible 100 tick move.
72 Notice how my zone calls the low of the British pound at 840 est. Most novice traders will not trade news because they are afraid of the big moves and the risk associated with them. The proper risk creates major opportunity for those of us that know these buy and sell levels on a monthly basis. These trades alone with major monthly news is a great addition to my live day trading room. This works on news and non news days. I prefer news due to the high reward to risk.
73 Only a few minutes after the fed news and my e book nails the Euro low.
74 Notice how the USD news nails the SP500 low. E book buyers look for a specific trade setup minutes after the news. Even on non news days, this setup will remain valid.
75
76 Weekly Crude oil and Natural Gas reports work great with this setup.
77 Even the Dow futures work with the setup.
78 Once again, you not only know the buy setup, you know where to exit with my symmetry dots.
79
80
81 (7)SP500 TRADERS =DAILY SUPPORT/RESISTANCE...=WEEKLY SUPPORT/RESISTANCE =DASHED LINES EQUAL INTRA DAY SUPPORT/RESISTANCE
82 The SP500 futures are very simple. You will look for confluence at my daily, weekly and intra day support/resistance levels. Just like the currency markets. My blue daily number is the most important number. Above=bullish and below the blue number=bearish. You will use the SP500 levels as levels to trade off of with confluence. I give you overnight support/resistance and add additional
83 support/resistance at the opening bell. These two levels of support will give you the levels to look for confluence. A typical trade setup would be a break and retest of these numbers to go short or long. If a break happens, I like the market to get away from the number around 3-4 points then retest. At the retest, I will look for a doji, hammer or spinning top for confirmation of a turn. You can wait for a close below that candle stick or short or buy on the retest of confluence with a 1.5 hard stop. Major support/resistance will occur when the daily and weekly are on top of each other.
84
85
86
87
88
89 I hope you enjoyed my setups and I look forward to seeing you in the room. Please visit or for additional information on my stand alone indicators for Tradestation and Ninja trader. We do offer a 3 day free trial to our live day trading room. Sign up and I'll see you in the room. You can contact me directly at [email protected] or jerel at [email protected] Thanks again and many ticks and pips to you. Jay Wireman
90
91 BUY VIEWING MY E-BOOK YOU AGREE THAT YOU WILL NOT DISCLOSE ANY OF THESE SETTINGS OR TRADE SETUPS OR ANY OTHER CONFIDENTIAL INFORMATION. THIS E-BOOK IS FOR EDUCATIONAL PURPOSES ONLY AND ONCE BOUGHT NO REFUNDS WILL BE ISSUED. NO REPRESENTATION IS BEING MADE THAT ANY ACCOUNT WILL ACHIEVE PROFITS OR LOSSESS SIMILAR TO THOSE CHARTS SHOWN. THERE IS A RISK OF LOSS IN FUTURES TRADING. IT IS UP TO YOU TO USE THE KNOWLDEGE AND CONSULT A LICENSED PROFESSIONAL ABOUT YOUR INDIVIDUAL TRADING. THE PAST PERFORMANCE OF ANY TRADING SYSTEM OR METHODOLOGY IS NOT NECESSARILY INDICATIVE OF FUTURE RESULTS. U.S. GOVERNMENT REQUIRED DISCLAIMER--COMMODITY FUTURES TRADING COMMISSION. FUTURES AND OPTIONS TRADING HAS LARGE POTENTIAL REWARDS, BUT ALSO LARGE POTENTIAL RISK. YOU MUST BE AWARE OF THE RISKS AND BE WILLING TO ACCEPT THEM IN ORDER TO INVEST IN THE FUTURES AND OPTIONS MARKETS. DON'T TRADE WITH MONEY YOU CAN'T AFFORD TO LOSE. THIS E-BOOK IS NEITHER A SOLICITATION OR AN OFFER TO BUY/SELL FUTURES OR OPTIONS. NO REPRESENTATION IS BEING MADE THAT ANY ACCOUNT WILL OR LIKELYY TO ACHEIVE PROFITS OR LOSSESS SIMILAR TO THOSE DISCUSSED IN THIS E-BOOK OR LIVE TRADING ROOM. DAY TRADING IS NOT SUITABLE FOR EVERYONE. YOU TRADE AT YOUR OWN RISK. DAY TRADING INVOLVES CONSIDERABLE RISK AND COULD RESULT IN SIGNIFICANT LOSSES. IT IS EXPECTED THAT USERS OF THE LIVE INFORMATION CONTAINED WITH MY TRADING STRATEGY USE THEIR OWN DUE DILIGENCE WHEN IT COMES TO MAKING TRADING DECISIONS. ********ALL INFORMATION PROVIDED HERE IS FOR INFORMATIONAL AND EDUCATIONAL PURPOSES ONLY**************
92
DAY TRADING WITH THE INSTITUTIONS by Jay Wireman
 DAY TRADING WITH THE INSTITUTIONS by Jay Wireman Welcome everyone to my top day trading setups. Below you will find my powerful techniques using my proprietary symmetry software package that I have developed
THE MOST POWERFUL DAY TRADING SETUP PERIOD!
 THE MOST POWERFUL DAY TRADING SETUP PERIOD! In this pdf I will show you how I combine my institutional numbers with my 40-60 number count 9 and 13 setups. Below you will find my concrete rules on when
Hello Traders! Before I get started let me just say that trading without a good methodology is like jumping out of an airplane without a parachute,
 Hello Traders! Before I get started let me just say that trading without a good methodology is like jumping out of an airplane without a parachute, possible, but not very smart. The reality is that the
TOMORROW'S TRADING TECHNOLOGY. 100% automated Fibonacci support and resistance levels that you can count on every single trading day in an instant.
 TOMORROW'S TRADING TECHNOLOGY 100% automated Fibonacci support and resistance levels that you can count on every single trading day in an instant. ProTrader Table of Contents 1. Areas A. Fibonacci Confluence
Forex Trading Strategies: One way to trade the Non Farm Payroll report.
 Forex Trading Strategies: One way to trade the Non Farm Payroll report. June 3 2011 1 Upshot Trade Signals disclaimer The information provided in this report is for educational purposes only. It is not
Free Scalping Indicator
 Free Scalping Indicator Risk and Liability: The author and the publisher of the information contained herein are not responsible for any actions that you undertake, including but not limited to, implementing
D.O.T.S. Guppy Trading Method
 D.O.T.S. Guppy Trading Method Dean Malone /dots Disclaimer Unique experiences and past performances do not guarantee future results. Trading in the off-exchange Foreign Exchange market (Forex) is very
Stock Breakout Profits Strategy
 Stock Breakout Profits Strategy Introduction Welcome and thank you for downloading the Stock Breakout Profits system. The Stock Breakout Profits is a complete trading strategy for trading not only the
My Techniques for making $150 a Day Trading Forex *Note for my more Advanced Strategies check out my site: Click Here
 My Techniques for making $150 a Day Trading Forex *Note for my more Advanced Strategies check out my site: Click Here The Strategy We will be looking at 2 different ways to day trade the Forex Markets.
10 PIPS SYSTEM THE 3 RD CANDLE Distributed Exclusively by Tinypipfx.com
 10 PIPS SYSTEM THE 3 RD CANDLE Distributed Exclusively by Tinypipfx.com Before you start trading the 3 rd candle system, I want you to think in term of someone who has never trade forex before. This strategy
Intra-Day Trading Techniques
 Pristine.com Presents Intra-Day Trading Techniques With Greg Capra Co-Founder of Pristine.com, and Co-Author of the best selling book, Tools and Tactics for the Master Day Trader Copyright 2001, Pristine
100 pips daily scalper
 100 pips daily scalper User s manual August 2011 www.100pipsdailyscalper.com DISCLAIMER Please be aware of the loss, risk, personal or otherwise consequences of the use and application of this book s content.
The Magic Momentum Method of Trading the Forex Market
 The Magic Momentum Method of Trading the Forex Market WELCOME! Welcome to one of the easiest methods of trading the Forex market which you can use to trade most currencies, most time frames and which can
Day Trade System EZ Trade FOREX
 Day Trade System The EZ Trade FOREX Day Trading System is mainly used with four different currency pairs; the EUR/USD, USD/CHF, GBP/USD and AUD/USD, but some trades are also taken on the USD/JPY. It uses
Reading Gaps in Charts to Find Good Trades
 Reading Gaps in Charts to Find Good Trades One of the most rewarding and challenging things I have done in my 40-year trading career is teach elementary school students the basics of technical analysis
I Day. article. In. you but. I just. Entry. Trend. I risk. 2.5% per. equity. a "runner" trading
 Emini Day Trading How I Day Trade for a Living I wish I had a simple answer for you but I don't. Trading is hard, very hard probably the hardest thing you' 'll ever try to do in your life and that's why
THE TRADE-OR-FADE METHOD:
 THE TRADE-OR-FADE METHOD: How to Trade Short-Term Using the Technical Analysis Spreadsheets and the Intra-day Support & Resistance by Scott Hoffman 1.800.800.3840 The Trade or Fade Advisory The Trade or
Chapter 1 Introduction Disclaimer: Forex Involves risk. So if you lose money you can't blame us we told you trading involves risk.
 By Casey Stubbs -Winners Edge Trading.com Table of Contents Chapter 1. Introduction Chapter 2.. Trading Plan Chapter 3.. Money Management Chapter 4. Moving Average Strategy Chapter 5. Stochastic Strategy
TRADING GAPS TAIL STRATEGY SPECIAL REPORT #37
 TRADING GAPS TAIL STRATEGY SPECIAL REPORT #37 Welcome to Market Geeks special report. Today I m going to teach you a little bit about gaps, how to identify different gaps and most importantly how to put
CHART TRADING GUIDE 1
 CHART TRADING GUIDE 1 How to understand chart trading This guide is designed to teach you the basics of chart trading- the chart patterns that are covered in this booklet can be used for short and medium
The Blade Forex Strategies
 The Blade Forex Strategies The Blade Forex Strategies and every word, sentence, and paragraph contained within are copyrighted under he UK Copyright Service and protected under UK and international law.
Trading The Euro: Box It, Squeeze It, Love It, Leave It
 Trading The Euro: Box It, Squeeze It, Love It, Leave It by: John Carter Think inside the box when trading currency pairs, and identify boxes on currency charts to create better trading setups. [Editor
THIS IS THE TRADING METHOD FOR THE STEALTH FOREX TRADING SYSTEM V10
 THIS IS THE TRADING METHOD FOR THE STEALTH FOREX TRADING SYSTEM V10 YOU SHOULD HAVE ALREADY READ AND APPLIED THE INFORMATION IN THE SET-UP DOCUMENT. IF YOU HAVE NOT ALREADY DONE SO - PLEASE COMPLETE SET
SECRETS OF FOREX SCALPING: Cheat Sheets
 SECRETS OF FOREX SCALPING: Cheat Sheets Reviewed and recommended by Rita Lasker & Green Forex Group Disclaimer Please be aware of the loss, risk, personal or otherwise consequences of the use and application
The 2e trading system is designed to take a huge bite out of a trending market on the four hour charts.
 2e Trading System The 2e trading system is designed to take a huge bite out of a trending market on the four hour charts. The basic theory behind the system is that a trending market will often pause,
So, if you are going to scalp the Forex market, you need to be very strategic with your or you will get eaten for breakfast
 IMPORTANT: This is an added bonus for being our client. If you need more trading strategies that included: Beginners-Intermediate Trading Strategies Intermediate-Advance Trading Strategies Elliott Wave
Ideas for improving your trading in 2010. Trader_Dante
 Ideas for improving your trading in 2010 Trader_Dante Copyright Trader_Dante 2010 Page 1 of 18 Disclaimer All reasonable steps and due diligence have been taking in preparing this document. However, it
NEXGEN DEMO TRADING & EDUCATIONAL PLAN SIMPLIFIED
 NEXGEN DEMO TRADING & EDUCATIONAL PLAN SIMPLIFIED Please watch the intro Video so you understand Nexgen's expectations for your demo time and what you should expect from us during your demo. CLICK TO WATCH
Day Trade Warrior. Business Plan Trading as a Business
 Day Trade Warrior Business Plan Trading as a Business I want to be a Professional Day Trader What do I need to do? Just like any other profession, if you are serious, you have to evaluate whether or not
Master Candle E-book
 Master Candle E-book Copyright 2009 www.forexbunker.com Page 1 ALL RIGHTS RESERVED. No part of this publication may be reproduced, stored in a retrieval system, or transmitted in any form or by any means,
The 15 50 Trading System
 Main Premise: This is considered to be one of the most straight forward systems for a live trading style for day- and/or intraday trading. The 50 SMA is one of the most commonly used moving average numbers
FREE SCALPING INDICATOR
 FREE SCALPING INDICATOR User s Manual DISCLAIMER Please be aware of the loss, risk, personal or otherwise consequences of the use and application of this book s content. The author and the publisher are
Advanced Trading Systems Collection FOREX TREND BREAK OUT SYSTEM
 FOREX TREND BREAK OUT SYSTEM 1 If you are a part time trader, this is one system that is for you. Imagine being able to take 20 minutes each day to trade. A little time at night to plan your trades and
Copyright 2010 by Kelvin Lee
 All rights reserved. No part of this publication may be reproduced, stored in a retrieval system, or transmitted, in any form or by any means, electronic, mechanical, photocopying, recording or otherwise,
Entering Late In Trends
 Highlights from Videos 40A & 40B of the Brooks Trading Course Entering Late In Trends BrooksTradingCourse.com Al Brooks Tuesday 3 rd November, 2015 BrooksTradingCourse.com BrooksPriceAction.com Main Points
Trading with the High Performance Intraday Analysis Indicator Suite
 Trading with the High Performance Intraday Analysis Indicator Suite PowerZone Trading indicators can provide detailed information about the conditions of the intraday market that may be used to spot unique
How to see the market context using CCI Written by Buzz
 How to see the market context using CCI Written by Buzz Towards the end of September 2003, I decided to stop trading the S&P e-mini for a while and focus on the Russell 2000 e-mini. The swings seemed to
Nexgen Software Services
 Nexgen Software Services Trading Guide June 2016 2016 Nexgen Software Services Inc. Please read and understand the following disclaimers before proceeding: Futures, FX and SECURITIES and or options trading
Forex Success Formula Presents Forex Success Mini Forex Success Formula Presents Forex Success Mini
 Forex Success Formula Presents Forex Success Mini - 1 www.forexsuccessformula.com/forextradingblog Risk Disclosure Statement The contents of this e-book are for informational purposes only. No Part of
Chapter 3.4. Forex Options
 Chapter 3.4 Forex Options 0 Contents FOREX OPTIONS Forex options are the next frontier in forex trading. Forex options give you just what their name suggests: options in your forex trading. If you have
CONTROLLING. Your TRADES, MONEY& EMOTIONS. By Chris Vermeulen
 CONTROLLING Your TRADES, MONEY& EMOTIONS By Chris Vermeulen INTRODUCTION In this condensed guide I have put together some key points which I think should be read a few times in order for these critical
CURRENCY TRADING Using Swing Breakouts in Forex Trading
 CURRENCY TRADING Using Swing Breakouts in Forex Trading 28 MAY 2009 Doug Schaff discusses the use of intermediate swing highs and swing lows to develop a shortterm approach to trading the currency markets.
SUPER TREND PROFIT. (Trend Indicator with alert popup and email alert) DISCLAIMER
 DISCLAIMER") SUPER TREND PROFIT (Trend Indicator with alert popup and email alert) DISCLAIMER Please be aware of the loss, risk, personal or otherwise consequences of the use and application of this book s content.
SUPER TREND PROFIT (Trend Indicator with alert popup and email alert) DISCLAIMER Please be aware of the loss, risk, personal or otherwise consequences of the use and application of this book s content.
This tutorial was originally titled "Secrets to Successful Short-Term Trading" and was recorded at the Online Trading Expo
 This tutorial was originally titled "Secrets to Successful Short-Term Trading" and was recorded at the Online Trading Expo Day Trading Wizard Using High Probability Support and Resistance Levels with Tony
Welcome to the Forex-e-Learn PDF Course
 Welcome to the Forex-e-Learn PDF Course Contents: Page 1: Contents Page 2: Price ars Page 3: The Daily Chart Page 4: The Daily Chart (Support and Resistance) Page 5: The Daily Chart (Support and Resistance
Commitment of Traders How to Follow the Professionals
 Commitment of Traders How to Follow the Professionals It's not the Holy Grail but the Commitment of Traders report gives an insight into valuations and what levels the Professionals consider over-bought
Michael J. Huddleston
 Michael J. Huddleston Government Required Risk Disclaimer and Disclosure Statement CFTC RULE 4.41 - HYPOTHETICAL OR SIMULATED PERFORMANCE RESULTS HAVE CERTAIN LIMITATIONS. UNLIKE AN ACTUAL PERFORMANCE
Binary Options Trading Strategy. Professional Binary Trading Manual Strategy
 Binary Options Trading Strategy Professional Binary Trading Manual Strategy U.S. Government Required Disclaimer - Commodity Futures Trading Commission Futures and Options trading has large potential rewards,
Trading. focus. Helping you achieve your trading goals. Trading Tips
 TEHNICAL ANALYSIS... 2 Fall 2014 What Chart?... 3 Paper Trading... 4 Trading H E L P I N G F O R E X T R A D E R S A C H I E V E T H E I R G O A L S focus We exist to provide the finest charting system
Trading the Non Farm Payroll Report Like a Savage Pip Fiend
 Trading the Non Farm Payroll Report Like a Savage Pip Fiend Rob Booker with tons of help from Jacob Fedje Copyright 2006 Rob Booker. All rights reserved. No part of this publication may be sold, distributed
Conservative Day Trading Strategy for Forex
 Conservative Day Trading Strategy for Forex By Markus Heitkoetter Please note: THE RISK OF LOSS IN TRADING COMMODITIES CAN BE SUBSTANTIAL. YOU SHOULD THEREFORE CAREFULLY CONSIDER WHETHER SUCH TRADING IS
Session #3 Finding Relative Strength/Weakness
 Session #3 Finding Relative Strength/Weakness Legal Disclosure Trading Currencies may involve high risk and, potentially, the loss of any funds invested. Investment information provided may not be appropriate
Chapter 2.3. Technical Analysis: Technical Indicators
 Chapter 2.3 Technical Analysis: Technical Indicators 0 TECHNICAL ANALYSIS: TECHNICAL INDICATORS Charts always have a story to tell. However, from time to time those charts may be speaking a language you
Trade Forex with Support and Resistance Strategies. By Walter Peters, Phd. BestMetatraderBroker.com
 Trade Forex with Support and Resistance Strategies By Walter Peters, Phd. BestMetatraderBroker.com 1 Important Risk Disclaimer ALL INFORMATION CONTAINED IN THIS COURSE IS FOR EDUCATIONAL PURPOSES ONLY
D.O.T.S. Guppy Trading Method
 D.O.T.S. Guppy Trading Method Dean Malone /dots 1 Disclaimer Unique experiences and past performances do not guarantee future results. Trading in the off-exchange Foreign Exchange market (Forex) is very
www.forexrobottrader.com
 The Steinitz Fractal Breakout Indicator (SFBI) was developed by Don Steinitz through rigorous research since 2003. Its unique properties make it far more advanced than any other indicator available on
Advanced Trading Systems Collection MACD DIVERGENCE TRADING SYSTEM
 MACD DIVERGENCE TRADING SYSTEM 1 This system will cover the MACD divergence. With this trading system you can trade any currency pair (I suggest EUR/USD and GBD/USD when you start), and you will always
How To Time Forex Trades Perfectly:
 How To Time Forex Trades Perfectly: Increase Your Win Ratio & Profit Consistently CONTENTS Why You Should Be Listening To Me? 2 Billionaire Hedge Fund Manager s Greatest Secret Revealed 3 Individual Currency
How To Make 1000 Pips Per Month And Keep It
 How To Make 1000 Pips Per Month And Keep It disclaimer The information provided in this report is for educational purposes only. It is not a recommendation to buy or sell nor should it be considered investment
Intra-Day Trading Techniques. Pristine.com Presents. Greg Capra. book, Tools and Tactics for the Master Day Trader
 Pristine.com Presents Intra-Day Trading Techniques With Greg Capra Co-Founder of Pristine.com, and Co-Author of the best selling book, Tools and Tactics for the Master Day Trader Copyright 2001, Pristine
Methods to Trade Forex Successfully for Quick Profits
 Methods to Trade Forex Successfully for Quick Profits This article is devoted to the techniques that are used to trade Forex on an intraday basis for quick profits. The aim is to make the trading a successful
Tips for Traders 7/21/2008 How To Avoid Getting Washed and Rinsed in the Markets
 Tips for Traders 7/21/2008 How To Avoid Getting Washed and Rinsed in the Markets I have the honor and pleasure of mentoring a number of very talented traders-some who are full-time professional traders
Daytrading Cup Breakouts
 A Strategic Approach Daytrading Cup Breakouts inga poslitur Here s how you can daytrade momentum trades. ntering and exiting intraday trades using E precision technical trading signals has been popular
Subscriber s Guide The DT Daily Forex Report How To Access The Reports DT Just-In-Time Service For The Intermediate and Long Term Position
 Subscriber s Guide The DT Daily Forex Report The DT Daily Forex Report is for swing and short term traders who look for positions that typically last at least a few days and day traders who key off the
Gap Trading The Forex
 Gap Trading The Forex How To Profit from a Forgotten Trading Strategy that is Right 89.1% of the Time Special Report By Jason Fielder, Founder - ForexImpact.com Page 1 ALL CONTENT OF THIS REPORT IS COPYRIGHT
INSTANT BUY SELL SIGNAL
 INSTANT BUY SELL SIGNAL www.instantbuysellsignal.com Dec 2010 DISCLAIMER Please be aware of the loss, risk, personal or otherwise consequences of the use and application of this book s content. The author
FOREX FOR BEGINNERS. www.mundomarkets.com
 FOREX FOR BEGINNERS CONTENT 01. 02. 03. 04. What is forex market and how it works? Forex market (page 2) Liquidity providers (page 3) Why acquiring knowledge is important in the forex market? Experience
Forex Volatility Patterns
 Spotting Early Breakouts Forex Volatility Patterns BRUCE WALDMAN Want to catch 40 to 00 pips in each trade? Here s how you can find those entry and exit signals to make your forex trading a success. C
New York Traders Expo 2012
 New York Traders Expo 2012 with JAMES CHEN, CTA, CMT Director of Technical Research and Education All rights reserved, FXDD Inc. 2010 Today s Topic: High Probability Strategies for Trading Forex www.fxdd.com
MAGIC BREAKOUT Forex Trading Strategy
 Tim Trush & Julie Lavrin Introducing MAGIC BREAKOUT Forex Trading Strategy Your guide to financial freedom. Tim Trush, Julie Lavrin, T&J Profit Club, 2007 2015, All rights reserved www.magicbreakout.com
TRADING SECRET NO. 3 How to combine two simple tools to capture big trending moves, especially in currencies
 TRADING SECRET NO. 3 How to combine two simple tools to capture big trending moves, especially in currencies 25 Currencies have a reputation for being markets that trend well. And, every business day over
RSI PRO Forex Trading System
 RSI PRO Forex Trading System Trading Examples Vol. 1 Paul Dean 2010 [Type text] Page 1 WWW. Y O U L E A R N F O R E X. C O M RSI PRO FOREX TRADING SYSTEM Trading Examples The purpose this book is simply
Aggressive Day Trading Strategy for Forex
 Aggressive Day Trading Strategy for Forex By Markus Heitkoetter Please note: THE RISK OF LOSS IN TRADING COMMODITIES CAN BE SUBSTANTIAL. YOU SHOULD THEREFORE CAREFULLY CONSIDER WHETHER SUCH TRADING IS
Trading the Daniel Code Numbers
 Trading the Daniel Code Numbers INTRODUCTION... 2 ABOUT THE DC NUMBERS... 2 BEFORE YOU START... 2 GETTING STARTED... 2 Set-Up Bars... 3 DC Number Sequences... 4 Reversal Signals... 4 DC TRADING METHODOLOGY...
The Ultimate Fibonacci Guide By Fawad Razaqzada, technical analyst at FOREX.com
 The Ultimate Fibonacci Guide By Fawad Razaqzada, technical analyst at FOREX.com Who is Fibonacci? Leonardo Bonacci also known as Leonardo Fibonacci was an Italian mathematician in the 12 th century. He
How To Trade The Emni And Oil And Light Sweet Crude Oil
 Day Trading the Emini S&P 500 (ES) and Light Sweet Crude Oil (CL) Live Trade Room with Carlos Diaz Disclaimer: The information in this guide is provided for your entertainment only. We cannot and do not
BROKER SERVICES AND PLATFORM
 BROKER SERVICES AND PLATFORM A broker is an individual who executes buy and sell orders and get commission in the form of SPREAD (I will talk about SPREAD in the subsequent lessons). You trade through
How to Find Your Fortune in the Forex Markets by Tom Willmott
 How to Find Your Fortune in the Forex Markets by Tom Willmott DISCLAIMER WARNING: Any and all trades discussed during this webinar are FOR EDUCATIONAL PURPOSES ONLY. Stock, option, futures, and Forex trading
HOW I TRIPLED MY ACCOUNT IN 4 MONTHS WITH FXJAKE.COM
 HOW I TRIPLED MY ACCOUNT IN 4 MONTHS WITH FXJAKE.COM By Nicola McLaughlin IMPORTANT While we make every effort to ensure that we accurately represent all the products and services reviewed on this website
OFFSET TRADING 2006 By Dana Martin / Sterling Blackstone, Inc.
 OFFSET TRADING 2006 By Dana Martin / Sterling Blackstone, Inc. Offset Trading is a proven method of capturing the maximum amount of Pips from an economic announcement. This is the act of placing a buy
Technical Analysis Fibonacci Levels
 Technical Analysis Fibonacci Levels Retracements A retracement is a pullback within the context of a trend. Dip After a rise from 0 to 1, short term market participants start to take profit. This drives
Trading with the Intraday Multi-View Indicator Suite
 Trading with the Intraday Multi-View Indicator Suite PowerZone Trading, LLC indicators can provide detailed information about the conditions of the intraday market that may be used to spot unique trading
Guidelines to use with Fibonacciqueen trade setups!!!
 Guidelines to use with Fibonacciqueen trade setups!!! Updated January 2014 As far as the price analysis that I run every day in the markets, there are three different types of Fibonacci price relationships
5 Tricks of Trend Trading
 5 Tricks of Trend Trading Copyright 2006 Rob Booker. All rights reserved. No part of this publication may be sold or changed without the author s consent. Page 1 of 8 Guiding Principles of this ebook 1.
BULLS ON WALL ST. 60 DAY TRADING BOOTCAMP
 BULLS ON WALL ST. 60 DAY TRADING BOOTCAMP Lead Instructor Kunal Desai Assistant Instructors Maribeth Willoughby Dr. Andrew Menaker Course Description This 60 day course teaches a setup based system to
SYNERGY Trading Method. CompassFX, 2009 www.compassfx.com Rev. 81009
 SYNERGY Trading Method SYNERGY Method INSTALLATION Basic Synergy is designed to automatically download onto the C: drive of your computer. If your local drive is not the C: drive, please send an email
Chapter 2.4. Multiple Time Frames
 Chapter 2.4 Multiple Time Frames 0 Contents TRADING USING MULTIPLE TIME FRAMES Traders of virtually every monetary size and temperament trade the Forex market. At any given time, short-term scalpers and
A powerful dashboard utility to improve situational awareness of the markets, place precise orders, and graphically monitor trading positions.
 A powerful dashboard utility to improve situational awareness of the markets, place precise orders, and graphically monitor trading positions. Position DashBoard Powered by BAR ANALYZER Position DashBoard
The Magic Lines Trading System
 The Magic Lines Trading System A trading system that works with all instruments, indexes and currencies. This copy is with compliments from Markets Mastered. For the full range of systems visit: www.marketsmastered.com
A Powerful Day Trading Strategy For Futures And Forex Markets Markus Heitkoetter
 A Powerful Day Trading Strategy For Futures And Forex Markets Markus Heitkoetter Agenda How To Configure Your Charts The Three (3) Best Indicators The Best Timeframe A Powerful Day Trading Strategy When
Simple & Consistent Fibonacci Method Prepared by: Simone Guy. {Free learning resource: NOT FOR RESALE}
 Simple & Consistent Fibonacci Method Prepared by: Simone Guy {Free learning resource: NOT FOR RESALE} 3/13/2010 Overview This is a mechanical trading method that is based on Support and Resistance. The
Spike Trading: Spot FX Vs Futures
 You should be aware of all the risks associated with foreign exchange and futures trading. There is a substantial risk of loss in foreign exchange and futures trading. Past performance is not indicative
A Basic Guide to RBI Support and Resistance Trading
 A Basic Guide to RBI Support and Resistance Trading All material contained in this document is protected by Copyright 2008 TradeStalker.com and Mike Reed. This document should not be reproduced or distributed,
Pivot Point Trading. If you would rather work the pivot points out by yourself, the formula I use is below:
 Pivot Point Trading You are going to love this lesson. Using pivot points as a trading strategy has been around for a long time and was originally used by floor traders. This was a nice simple way for
Technical analysis. Course 11
 Course 11 Technical analysis Topic 1: Introduction to technical analysis... 3 Topic 2: Chart types... 4 Line charts... 4 Bar chart... 4 Candle stick charts... 5 Topic 3: Trend analysis... 6 Defining an
The Ten Commandments of Forex Target Trading
 The Ten Commandments of Forex Target Trading www.forextargettrading.com The 1st Commandment: Thou Shalt Always Protect Thy Capital Without capital, you have nothing with which to trade. Trading any currency,
均 衡 表 Ichimoku Kinkō Hyō
 均 衡 表 Ichimoku Kinkō Hyō Hello Forex Winners! On this book we will talk about Ichimoku Kinko Hyo indicator and will show many pictures to make it easy for you. Ichimoku Winners e-book is free on ForexWinners.Net
CHAPTER 8. REVERSAL TRADING STRATEGIES
 CHAPTER 8. REVERSAL TRADING STRATEGIES Today you will Learn Reversal trading strategies are great or mid-day and afternoon trades, especially on days when momentum is a big slower. Why Is This Important?
Strategy:10. Rob Booker s. Low risk/high return forex trading
 RISK DISCLOSURE: Rob Booker s Trading foreign exchange on margin carries a high level of risk, and may not be suitable for all investors. The high degree of leverage can work against you as well as for
SHADOWTRADERPRO FX TRADER USERS GUIDE
 SHADOWTRADERPRO FX TRADER USERS GUIDE How to get maximum value from your ShadowTraderPro FX Trader subscription. ShadowTraderPro FX Trader delivers value to its subscribers on multiple levels. The newsletter