Sunoco Logistics Partners L.P. Second Quarter 2015 Earnings Conference Call August 6, 2015
|
|
|
- Jordan Copeland
- 10 years ago
- Views:
Transcription
1 Sunoco Logistics Partners L.P. Second Quarter 2015 Earnings Conference Call August 6, 2015

2 Forward-Looking Statements You should review this slide presentation in conjunction with the second quarter 2015 earnings conference call for Sunoco Logistics Partners L.P., held on August 6, 2015 at 8:00 a.m. ET (7:00 a.m. CT). You may listen to the audio portion of the conference call on our website at or by dialing (USA toll-free) International callers should dial Please enter Conference ID Sunoco Logistics. Audio replays of the conference call will be available for two weeks after the conference call beginning approximately one hour following the completion of the call. To access the replay, dial International callers should dial During the call, those statements we make that are not historical facts are forward-looking statements. These forward-looking statements are not guarantees of future performance. Although we believe the assumptions underlying these statements are reasonable, investors are cautioned that such forward-looking statements involve risks and uncertainties that may affect our business and cause actual results to differ materially from those discussed during the conference call or in the slide presentation. Such risks and uncertainties include economic, business, competitive and/or regulatory factors affecting our business, as well as uncertainties related to the outcomes of any pending or future litigation. Sunoco Logistics Partners L.P. has included in its Annual Report on Form 10-K for the year ended December 31, 2014, and in its subsequent SEC filings, cautionary language identifying important risk factors (though not necessarily all such factors) that could cause future outcomes to differ materially from those set forth in the forward-looking statements. For more information about these risk factors, see our SEC filings, available on our website at We expressly disclaim any obligation to update or alter these forward-looking statements, whether as a result of new information, future events or otherwise. This presentation includes certain non-gaap financial measures intended to supplement, not substitute for, comparable GAAP measures. Reconciliations of non-gaap financial measures to GAAP financial measures are provided in the slides at the end of the presentation. You should consider carefully the comparable GAAP measures and the reconciliations to those measures provided in this presentation. 2

3 2Q Highlights Record quarterly performance: $326MM Adjusted EBITDA and $264MM Distributable Cash Flow Blue Bar EBITDA has increased ~ 30% year over year Results were impacted by ~ $25MM LIFO reversal from 1Q Distributions: 2Q increase: $1.68/unit to $1.75/unit (annualized) 13 th consecutive quarterly increase of 5%; 41 st consecutive increase overall 20% increase over 2Q14 distribution of $1.46/unit (annualized) Guidance ~ 5% quarter over quarter in 2015 Sunoco Logistics will have a 30% interest in the Bayou Bridge Pipeline Sunoco Logistics will be the operator of the pipeline 2015 organic capital guidance of ~ $2.5 billion June 30, 2015 Revolver Covenant Debt-to-EBITDA of 3.3x 3
 Guidance ~ 5% quarter over quarter in 2015 Sunoco Logistics will have a 30% interest in the Bayou Bridge Pipeline Sunoco Logistics will be the")
4 13 Consecutive Quarters of 5% Distribution Growth Guidance ~5% quarter over quarter increases in

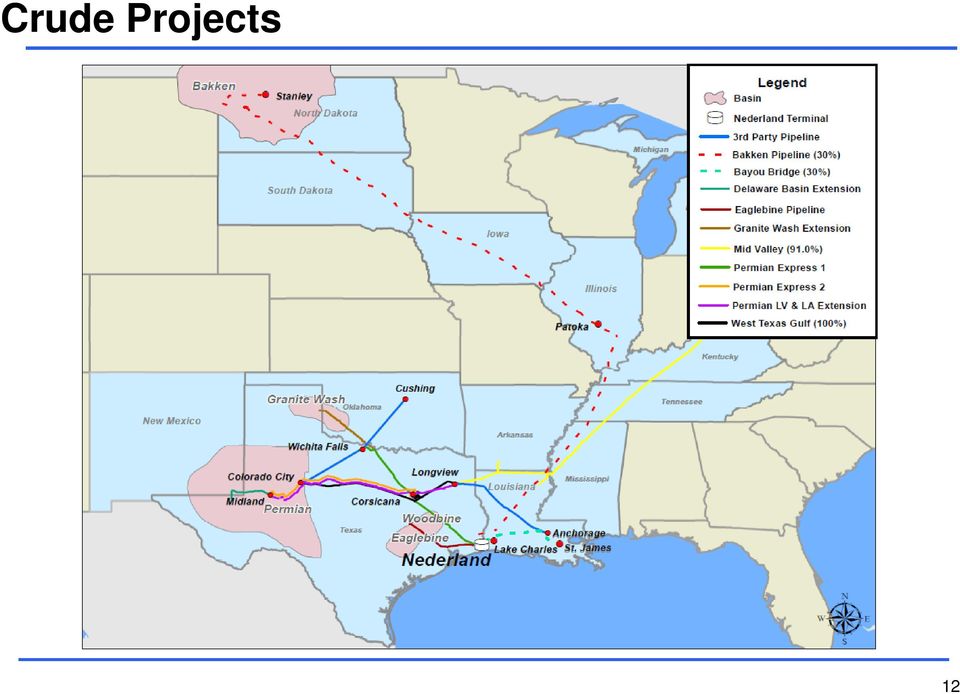
5 16 Successful Major Projects Major Organic and Joint Venture Projects: 3 West Texas Crude expansion projects (crude oil) Permian Express 1 (crude oil) Permian Express 2 (crude oil) Eaglebine Express (crude oil) Granite Wash Extension (crude oil) Permian Longview & Louisiana Extension (crude oil) Delaware Basin Extension (crude oil) Allegheny Access (refined products) Mariner West (natural gas liquids) Mariner East 1 (natural gas liquids) Mariner East 2 (natural gas liquids) Mariner South (natural gas liquids) Bakken Pipeline 30% Ownership (crude oil) Bayou Bridge Lake Charles 30% Ownership (crude oil) 5
 Mariner South (natural gas liquids) Bakken Pipeline 30% Ownership (crude oil) Bayou Bridge Lake Charles 30% Ownership")
6 Actively Developing Publically Disclosed Major Organic and Joint Venture Projects: Bayou Bridge St. James 30% Ownership (crude oil) Plan to launch open season in 3Q15 Mariner East 2 Expansion (natural gas liquids) Plan to launch open season in 3Q15 Permian Express 3 (crude oil) Propane Dehydrogenation ( PDH ) Unit (natural gas liquids) 6
 Plan to launch open season in 3Q15 Permian Express 3")
7 Organic Expansion Capital 3,000 2,500 Investment ($MM) 2,000 1,500 1, P Organic Expansion Capital 7

8 Scheduled Project Start-up 8

9 Mariner Franchise: 4 Successful Open Seasons Mariner East 1 Ethane / Propane from Houston to Marcus Hook 4Q 2014* Mariner West Ethane from Houston to Sarnia 4Q 2013 Mariner South Propane / Butane from Mont Belvieu to Nederland End of 2014 Mariner East 2 NGLs from Shales to Marcus Hook End of 2016** *Propane commenced 4Q14 with Ethane start-up expected in 4Q15 **Expected Start-up 9

10 Mariner South Natural Gas Liquids Export propane and butane from our Nederland terminal on the Gulf Coast: Joint project between SXL and Lone Star (ETP) Excellent example of synergies within Energy Transfer family Project start up end of 2014 Ramped up to full capability in 2Q15 Fee-based income Mariner South Propane / Butane from Mont Belvieu to Nederland End of

11 Mariner East 1 Natural Gas Liquids A Comprehensive Marcellus Shale Solution: Natural Gas Liquids from Houston, PA to the Marcus Hook Industrial Complex Mix of Propane & Ethane Approx. 70 MB/D capacity Propane commenced operation in 4Q14 Initial capability of 10 MB/D Ramped up to 30 MB/D in second quarter 4Q15 projected start-up for full service capability Refrigeration system comes online Addition of ethane movements Fee-based income 11

12 Crude Projects 12
13 Permian Express 2 Crude Oil Additional West TX Crude Expansion: Increase takeaway capacity out of the Permian Basin Provides access to multiple markets Commenced operation in 3Q15 Currently 200 MB/D capacity Adequately sized to be expanded by another 200 MB/D Fee-based income Permian Express 2 Permian Crude to multiple markets 3Q

14 APPENDIX
15 SXL Q Financial Highlights (amounts in millions) Three Months Ended Six Months Ended June 30, June 30, Sales and other operating revenue $ 3,202 $ 4,821 $ 5,774 $ 9,298 Cost of products sold 2,821 4,517 5,130 8,727 Operating expenses (1) Selling, general and administrative expenses (1) Depreciation and amortization expense Impairment charge and other matters (100) - (59) - Total costs and expenses 2,895 4,641 5,401 8,991 Operating Income Interest cost and debt expense, net (52) (37) (102) (63) Capitalized interest Other income Income Before Provision for Income Taxes Provision for income taxes (5) (8) (11) (13) Net Income Net income attributable to noncontrolling interests - (2) (1) (5) Net income attributable to redeemable (1) - (1) - noncontrolling interests Net Income Attributable to Sunoco Logistics Partners L.P. $ 276 $ 156 $ 312 $ 263 (1) During the fourth quarter 2014, we adjusted our presentation of certain operating expenses and selling, general and administrative expenses to conform to the presentation utilized by ETP. These changes did not impact our net income. Prior period amounts have been recast to conform to current presentation. 15
 (8) (11) (13) Net Income 277 158 314 268 Net income")
16 SXL Q Financial Highlights (amounts in millions, except per unit amounts) Three Months Ended Six Months Ended June 30, June 30, Calculation of Limited Partners' interest: Net Income attributable to Sunoco Logistics Partners L.P. $ 276 $ 156 $ 312 $ 263 Less: General Partner's interest (71) (44) (131) (82) Limited Partners' interest in net income $ 205 $ 112 $ 181 $ 181 Net Income per Limited Partner unit: Basic $ 0.83 $ 0.54 $ 0.76 $ 0.87 Diluted $ 0.83 $ 0.53 $ 0.75 $ 0.86 Weighted Average Limited Partners' units outstanding: Basic Diluted

17 SXL Q Financial Highlights (amounts in millions) Three Months Ended Six Months Ended June 30, June 30, Capital Expenditures: Expansion $ 486 $ 643 $ 909 $ 1,108 Maintenance Acquisitions Investment in joint venture interests Total $ 502 $ 736 $ 1,071 $ 1,261 17

18 SXL Q Financial Highlights (amounts in millions) June 30, December 31, Balance Sheet Data: Cash and cash equivalents $ 58 $ 101 Revolving credit facilities $ 550 $ 185 Senior Notes 3,975 3,975 Unamortized fair value adjustments (1) Unamortized bond discount (6) (6) Total debt $ 4,619 $ 4,260 Equity: Sunoco Logistics Partners L.P. Equity $ 7,592 $ 6,678 Noncontrolling interests Total Equity $ 7,627 $ 6,738 (1) Represents fair value adjustments on our senior notes resulting from the application of push-down accounting in connection with the acquisition of our general partner by Energy Transfer Partners, L.P. on October 5,

19 SXL Non-GAAP Financial Measures (amounts in millions) Three Months Ended Six Months Ended June 30, June 30, Net Income $ 277 $ 158 $ 314 $ 268 Interest expense, net Depreciation and amortization expense Provision for income taxes Non-cash compensation expense Unrealized (gains) losses on commodity risk management activities Amortization of excess investment in joint venture interests Proportionate share of unconsolidated affiliates' interest, depreciation and provision for income taxes Non-cash inventory adjustments (100) - (59) - Adjusted EBITDA (1) Interest expense, net (31) (21) (60) (37) Provision for current income taxes (2) (6) (9) (14) (16) Amortization of fair value adjustments on long-term debt (3) (4) (6) (8) Distributions versus Adjusted EBITDA of unconsolidated affiliates (8) (10) (16) (16) Maintenance capital expenditures (16) (13) (31) (31) Distributable cash flow attributable to noncontrolling interests (2) (1) (4) (2) (7) Contributions attributable to acquisition from affiliate Distributable Cash Flow (1) (2) $ 264 $ 222 $ 424 $ 379 (1) Management of the Partnership believes Adjusted EBITDA and distributable cash flow information enhances an investor's understanding of a business s ability to generate cash for payment of distributions and other purposes. Adjusted EBITDA and distributable cash flow do not represent and should not be considered alternatives to net income or cash flows from operating activities as determined under United States generally accepted accounting principles (GAAP) and may not be comparable to other similarly titled measures of other businesses. (2) During the third quarter 2014, we changed our definition of distributable cash flow to conform to the presentation utilized by Energy Transfer Partners, L.P., the controlling member of our general partner. This change did not have a material impact on our distributable cash flows. Prior period amounts have been recast to conform to current presentation. 19
 - (59) - Adjusted EBITDA (1) 326 280 547 488 Interest expense, net (31) (21) (60) (37) Provision for current income taxes (2) (6) (9) (14) (16) Amortization of fair value")
20 SXL Crude Oil Pipelines Financial Highlights (in millions) Three Months Ended Six Months Ended June 30, June 30, Sales and other operating revenue $ 135 $ 138 $ 270 $ 269 Adjusted EBITDA $ 89 $ 104 $ 184 $ 197 Operating Highlights Pipeline throughput (thousands of bpd) 2,174 2,130 2,149 2,086 Pipeline revenue per barrel (cents)
 2,174 2,130 2,149 2,086 Pipeline revenue per barrel (cents) 68.1 71.2 69.")
21 SXL Crude Oil Acquisition and Marketing Financial Highlights (in millions) Three Months Ended Six Months Ended June 30, June 30, Sales and other operating revenue $ 2,680 $ 4,432 $ 4,888 $ 8,526 Adjusted EBITDA $ 41 $ 53 $ 72 $ 65 Operating Highlights Crude oil purchases (thousands of bpd) Gross profit per barrel purchased (cents) (1) Average crude oil price (per barrel) $57.96 $ $53.29 $ (1) Represents total segment sales and other operating revenue less cost of products sold and operating expenses, divided by total crude oil purchases. 21
22 SXL Terminal Facilities Financial Highlights (in millions) Three Months Ended Six Months Ended June 30, June 30, Sales and other operating revenue $ 393 $ 283 $ 637 $ 570 Adjusted EBITDA $ 140 $ 97 $ 192 $ 183 Operating Highlights Terminal throughput (thousands of bpd): Refined products terminals Nederland terminal 1,311 1,216 1,305 1,269 Refinery terminals
23 SXL Products Pipelines Financial Highlights (in millions) Three Months Ended Six Months Ended June 30, June 30, Sales and other operating revenue $ 77 $ 40 $ 140 $ 81 Adjusted EBITDA $ 56 $ 26 $ 99 $ 43 Operating Highlights (1) (2) Pipeline throughput (thousands of bpd) Pipeline revenue per barrel (cents) (1) Excludes amounts attributable to equity interests which are not consolidated. (2) Prior period pipeline throughput volumes have been recast to exclude certain pipeline movements which result in revenues that are not material. Management believes the exclusion of such volumes provides a revenue per barrel amount that is more meaningful in analyzing the results of the Products Pipelines segment. 23
24 SXL Key Financial and Operating Statistics Financial highlights (in millions) Sales and other operating revenue Total Total 1st 2nd 3rd 4th Total 1st 2nd 3rd 4th Total 1st 2nd Total Crude Oil Pipelines $ 319 $ 398 $ 95 $ 122 $ 139 $ 139 $ 495 $ 131 $ 138 $ 144 $ 142 $ 555 $ 135 $ 135 $ 270 Crude Oil Acquisition and Marketing 10,163 12,146 3,259 4,047 4,244 3,968 15,518 4,094 4,432 4,497 3,395 16,418 2,208 2,680 4,888 Terminal Facilities , Products Pipelines Intersegment eliminations (142) (177) (55) (66) (66) (68) (255) (76) (72) (70) (69) (287) (78) (83) (161) Total sales and other operating revenue $ 10,905 $ 13,110 $ 3,512 $ 4,311 $ 4,528 $ 4,288 $ 16,639 $ 4,477 $ 4,821 $ 4,915 $ 3,875 $ 18,088 $ 2,572 $ 3,202 $ 5,774 Adjusted earnings before interest, taxes, depreciation and amortization (Adjusted EBITDA) Crude Oil Pipelines $ 207 $ 275 $ 61 $ 88 $ 98 $ 102 $ 349 $ 93 $ 104 $ 95 $ 85 $ 377 $ 95 $ 89 $ 184 Crude Oil Acquisition and Marketing Terminal Facilities Products Pipelines Total Adjusted EBITDA $ 573 $ 810 $ 236 $ 244 $ 181 $ 210 $ 871 $ 208 $ 280 $ 246 $ 237 $ 971 $ 221 $ 326 $ 547 Operating highlights Crude Oil Pipelines Pipeline throughput (thousands of barrels per day "bpd") 1,587 1,556 1,582 1,890 1,976 2,009 1,866 2,041 2,130 2,204 2,122 2,125 2,124 2,174 2,149 Pipeline revenue per barrel (cents) Crude Oil Acquisition and Marketing Crude oil purchases (thousands of bpd) Gross profit per barrel purchased (cents) (1) Average crude oil price (per barrel) $ $ $ $ $ $ $ $ $ $ $ $ $ $ $ Terminal Facilities (thousands of bpd) Refined products terminals throughput Nederland terminal throughput ,322 1,216 1,262 1,135 1,233 1,298 1,311 1,305 Refinery terminals throughput Products Pipelines (2)(3) Pipeline throughput (thousands of bpd) Pipeline revenue per barrel (cents)
25 SXL Key Financial and Operating Statistics Reconciliation of Segment Operating Income to Net Income Attributable to Sunoco Logistics Partners L.P. (in millions) Total Total 1st 2nd 3rd 4th Total 1st 2nd 3rd 4th Total 1st 2nd Total Operating income (loss): Crude Oil Pipelines $ 181 $ 231 $ 38 $ 65 $ 74 $ 80 $ 257 $ 68 $ 79 $ 68 $ 59 $ 274 $ 67 $ 61 $ 128 Crude Oil Acquisition and Marketing (1) (213) (124) (49) Terminal Facilities Products Pipelines 20 5 (4) (3) (2) (3) (12) (6) (2) Total segment operating income (loss) (112) Interest expense, net (89) (79) (19) (17) (22) (19) (77) (16) (21) (14) (16) (67) (29) (31) (60) Other income Provision for income taxes (25) (32) (6) (9) (8) (7) (30) (5) (8) (8) (4) (25) (6) (5) (11) Net income (loss) (125) Net income attributable to noncontrolling interests (9) (11) (2) (3) (3) (3) (11) (3) (2) (2) (2) (9) (1) - (1) Net income attributable to redeeemable noncontrolling interests (1) (1) Net income (loss) attributable to Partners $ 313 $ 520 $ 140 $ 143 $ 78 $ 102 $ 463 $ 107 $ 156 $ 155 $ (127) $ 291 $ 36 $ 276 $ 312 Reconciliation of Net Income to Adjusted EBITDA and Distributable Cash Flow (in millions) Net income (loss) $ 322 $ 531 $ 142 $ 146 $ 81 $ 105 $ 474 $ 110 $ 158 $ 157 $ (125) $ 300 $ 37 $ 277 $ 314 Add: Interest expense, net Add: Depreciation and amortization expense Add: Impairment charge Add: Provision for income taxes Add: Non-cash compensation expense Add: Unrealized (gains)/losses on commodity risk management activities (2) 3 (3) (1) (8) 11 (1) (1) 8 (21) (3) (17) Add: Amortization of excess joint venture investment Add: Proportionate share of unconsolidated affiliates interest, depreciation and provision for income taxes Add: Non-cash inventory adjustments (100) (59) Less: Adjustments to commodity hedges resulting from "push-down" - - accounting - (12) Less: Non-cash accrued liability adjustment (10) (10) Adjusted EBITDA Less: Interest expense, net (89) (79) (19) (17) (22) (19) (77) (16) (21) (14) (16) (67) (29) (31) (60) Less: Provision for current income taxes (4) (27) (34) (7) (4) (7) (6) (24) (7) (9) (9) (4) (29) (8) (6) (14) Less: Amortization of fair value adjustments on long-term debt - (6) (6) (6) (5) (6) (23) (4) (4) (3) (3) (14) (3) (3) (6) Less: Distributions versus Adjusted EBITDA of unconsolidated affiliates (17) (28) (3) (8) (10) (6) (27) (6) (10) (10) (9) (35) (8) (8) (16) Less: Maintenance capital expenditures (42) (50) (4) (18) (15) (16) (53) (18) (13) (16) (29) (76) (15) (16) (31) Less: Distributable cash flow attributable to noncontrolling interests (4) (10) (11) (3) (5) (5) (3) (16) (3) (4) (3) (2) (12) (1) (1) (2) Add: Acquisition costs reimbursement Distributable Cash Flow (4) $ 388 $ 602 $ 194 $ 189 $ 120 $ 157 $ 660 $ 157 $ 222 $ 194 $ 177 $ 750 $ 160 $ 264 $ 424 (1) (2) Represents total segment sales and other operating revenue minus cost of products sold and operating expenses divided by total crude purchases. Excludes amounts attributable to equity ownership interests which are not consolidated. (3) (4) Prior period pipeline throughput volumes have been recast to exclude certain pipeline movements which result in revenues that are not material. Management believes the exclusion of such volumes provides a revenue per barrel amount that is more meaningful in analyzing the results of the Products Pipelines segment. During the third quarter 2014, we changed our definition of distributable cash flow to conform to the presentation utilized by Energy Transfer Partners, L.P., the controlling member of our general partner. This change did not have a material impact on our distributable cash flows. Prior period amounts have been recast to conform to current presentation. 25
THIRD QUARTER 2015 RESULTS Earnings Conference Call - November 6, 2015
 THIRD QUARTER 2015 RESULTS Earnings Conference Call - November 6, 2015 Forward-looking Information Certain matters contained in this presentation include "forward-looking statements" within the meaning
Copano Energy Reports Fourth Quarter and Year End 2010 Results
 Copano Energy Reports Fourth Quarter and Year End 2010 Results Total Distributable Cash Flow Increases 5% Over Third Quarter HOUSTON, Feb. 24, 2011 /PRNewswire via COMTEX/ -- Copano Energy, L.L.C. (Nasdaq:
Memorial Production Partners LP Announces Second Quarter 2015 Results, Cash Distribution Update, Updated Hedges and Updated 2015 Guidance
 August 5, 2015 Memorial Production Partners LP Announces Second Quarter 2015 Results, Cash Distribution Update, Updated Hedges and Updated 2015 Guidance HOUSTON, Aug. 5, 2015 (GLOBE NEWSWIRE) -- Memorial
Second Quarter 2015 Earnings Presentation
 Second Quarter 2015 Earnings Presentation July 30, 2015 Forward Looking Statement This presentation includes forward-looking statements, which are statements that frequently use words such as "anticipate,"
Supplemental Q1 2014 Earnings Results
 Supplemental Q1 2014 Earnings Results First Quarter 2014 Highlights 2 Adjusted EBITDA (a non-gaap financial measure defined below) increased 24% to $89.9 million in the first three months of 2014 from
GGP REPORTS FULL YEAR 2015 RESULTS AND DECLARES FIRST QUARTER DIVIDEND
 GGP REPORTS FULL YEAR 2015 RESULTS AND DECLARES FIRST QUARTER DIVIDEND Chicago, Illinois, February 1, 2016 - General Growth Properties, Inc. (the Company or GGP ) (NYSE: GGP) today reported results for
Spectra Energy Reports Second Quarter 2008 Results, Net Income Up 51 Percent from Prior Year
 Media: Analysts: Molly Boyd (713) 627-5923 (713) 627-4747 (24-hour media line) John Arensdorf (713) 627-4600 Date: August 6, 2008 Spectra Energy Reports Second Quarter 2008 Results, Net Income Up 51 Percent
Spectra Energy Reports First Quarter 2009 Results
 Media: Analysts: Wendy Olson (713) 627-4072 (713) 627-4747 (24-hour media line) John Arensdorf (713) 627-4600 Date: May 5, 2009 Spectra Energy Reports First Quarter 2009 Results Reported net income (controlling
EQT REPORTS FIRST QUARTER 2015 EARNINGS Significant volume growth continues
 EQT REPORTS FIRST QUARTER 2015 EARNINGS Significant volume growth continues PITTSBURGH, PA (April 23, 2015) -- EQT Corporation (NYSE: EQT) today announced first quarter 2015 net income attributable to
Tower International Reports Solid Third Quarter And Raises Full Year Outlook
 FOR IMMEDIATE RELEASE Tower International Reports Solid Third Quarter And Raises Full Year Outlook LIVONIA, Mich., November 3, 2011 Tower International, Inc. [NYSE: TOWR], a leading integrated global manufacturer
(713) 627-5353 (713) 627-4747 (24-hour media line) (713) 627-4600. Date: May 3, 2013
 627-5353 (713) 627-4747 (24-hour media line) (713) 627-4600. Date: May 3, 2013") Media: Analysts: Caitlin Currie (713) 627-5353 (713) 627-4747 (24-hour media line) John Arensdorf (713) 627-4600 Date: May 3, 2013 Spectra Energy Reports First Quarter 2013 Results Reported net income
Media: Analysts: Caitlin Currie (713) 627-5353 (713) 627-4747 (24-hour media line) John Arensdorf (713) 627-4600 Date: May 3, 2013 Spectra Energy Reports First Quarter 2013 Results Reported net income
GeoResources, Inc. Reports First Quarter Financial and Operational Results
 GeoResources, Inc. Reports First Quarter Financial and Operational Results Reports First Quarter Adjusted Net Income of $11.5 Million or $0.44 Per Share and Adjusted EBITDAX of $30.4 Million Houston, Texas,
PARSLEY ENERGY ANNOUNCES SECOND QUARTER 2015 FINANCIAL AND OPERATING RESULTS Raises Production Guidance
 NEWS RELEASE PARSLEY ENERGY ANNOUNCES SECOND QUARTER 2015 FINANCIAL AND OPERATING RESULTS Raises Production Guidance AUSTIN, Texas, August 11, 2015 Parsley Energy, Inc. (NYSE: PE) ( Parsley, Parsley Energy,
Rex Energy Reports Second Quarter 2014 Operational and Financial Results
 Rex Energy Reports Second Quarter 2014 Operational and Financial Results Record quarterly production of 128.8 MMcfe/d, represents a 50% year-over-year increase Average daily production from oil and NGLs
Tower International Posts Third Quarter 2010 Adjusted EBITDA of $39.1 million
 For Immediate Release Derek Fiebig Director, Investor & External Relations (248) 675-6457 [email protected] Tower International Posts Third Quarter 2010 of $39.1 million LIVONIA, Mich.,
Westmoreland Reports First Quarter 2016 Results and Affirms Full-year Guidance
 News Release Westmoreland Reports First Quarter 2016 Results and Affirms Full-year Guidance Englewood, CO May 10, 2016 - Westmoreland Coal Company (NasdaqGM:WLB) today reported financial results for the
Spectra Energy Reports Fourth Quarter and Year-End 2007 Results
 Media: Molly Boyd (713) 627-5923 (713) 627-4747 (24-hour media line) Analysts: John Arensdorf (713) 627-4600 Date: February 6, 2008 Spectra Energy Reports Fourth Quarter and Year-End 2007 Results Fourth
N E W S R E L E A S E
 N E W S R E L E A S E FOR IMMEDIATE RELEASE Contact: Steven E. Nielsen, President and CEO H. Andrew DeFerrari, Senior Vice President and CFO (561) 627-7171 DYCOM INDUSTRIES, INC. ANNOUNCES FISCAL 2016
Spectra Energy Reports Second Quarter 2014 Results Quarter in Line with Company Plans; On Track to Exceed Full-Year EBITDA Targets
 Date: August 6, 2014 Spectra Energy Reports Second Quarter 2014 Results Quarter in Line with Company Plans; On Track to Exceed Full-Year EBITDA Targets 12 percent increase in distributable cash flow quarter-over-quarter
Performance Food Group Company Reports First-Quarter Fiscal 2016 Earnings
 NEWS RELEASE For Immediate Release November 4, 2015 Investors: Michael D. Neese VP, Investor Relations (804) 287-8126 [email protected] Media: Joe Vagi Manager, Corporate Communications (804) 484-7737
Spectra Energy Reports Fourth Quarter and Year-End 2011 Results
 Media: Analysts: Wendy Olson (713) 627-4072 (713) 627-4747 (24-hour media line) John Arensdorf (713) 627-4600 Date: February 2, 2012 Spectra Energy Reports Fourth Quarter and Year-End 2011 Results Company
LIVE NATION ENTERTAINMENT REPORTS SECOND QUARTER 2010 FINANCIAL RESULTS
 FOR IMMEDIATE RELEASE DRAFT (change letterhead to lne) FOR IMMEDIATE RELEASE LIVE NATION ENTERTAINMENT REPORTS SECOND QUARTER 2010 FINANCIAL RESULTS - Results for the second quarter of 2010 in line with
CONE Midstream Partners LP. 1Q 2016 Earnings May 5, 2016
 CONE Midstream Partners LP 1Q 2016 Earnings May 5, 2016 Disclaimer Forward Looking Statements This presentation contains forward-looking statements within the meaning of the federal securities laws. Statements
VIVINT SOLAR ANNOUNCES FIRST QUARTER 2015 FINANCIAL RESULTS
 VIVINT SOLAR ANNOUNCES FIRST QUARTER 2015 FINANCIAL RESULTS Megawatts Installed Increased 131% Year-over-Year Retained Value Increased 138% Year-over-Year Revenue Increased 172% Year-over-Year LEHI, Utah,
Third Quarter 2015 Financial Highlights:
 DISCOVERY COMMUNICATIONS REPORTS THIRD QUARTER 2015 RESULTS, INCREASES BUYBACK AUTHORIZATION BY $2 BILLION AND ANNOUNCES RESUMPTION OF SHARE REPURCHASES BEGINNING IN FOURTH QUARTER 2015 Third Quarter 2015
Delphi Reports Third Quarter 2015 Financial Results
 Delphi Reports Third Quarter 2015 Financial Results GILLINGHAM, England - Delphi Automotive PLC (NYSE: DLPH), a leading global vehicle components manufacturer, today reported third quarter 2015 U.S. GAAP
Spectra Energy Reports First Quarter 2012 Results
 Media: Analysts: Wendy Olson (713) 627-4072 (713) 627-4747 (24-hour media line) John Arensdorf (713) 627-4600 Date: May 4, 2012 Spectra Energy Reports First Quarter 2012 Results Reported net income from
NEXSTAR BROADCASTING THIRD QUARTER NET REVENUE INCREASES 21.1% TO RECORD $73.1 MILLION
 NEWS ANNOUNCEMENT FOR IMMEDIATE RELEASE NEXSTAR BROADCASTING THIRD QUARTER NET REVENUE INCREASES 21.1% TO RECORD $73.1 MILLION - Third Quarter Operating Income Rises to $12.9 Million; BCF Increases 54.5%;
Second Quarter 2015 Earnings Conference Call
 Second Quarter 2015 Earnings Conference Call NYSE: CVA JULY 22, 2015 Cautionary Statements All information included in this earnings presentation is based on continuing operations, unless otherwise noted.
RANGE REPORTS 2015 EARNINGS, ANNOUNCES 2016 CAPITAL PLANS
 RANGE REPORTS 2015 EARNINGS, ANNOUNCES 2016 CAPITAL PLANS FORT WORTH, TEXAS, FEBRUARY 25, 2016 RANGE RESOURCES CORPORATION (NYSE: RRC) today announced its 2015 financial results. Highlights Fourth quarter
First Quarter 2014 Earnings Conference Call and Webcast. May 1, 2014
 First 2014 Earnings Conference Call and Webcast May 1, 2014 1 MPLX Forward Looking Statements This presentation contains forward-looking statements within the meaning of the federal securities laws. These
Contact Christopher Mecray D +1 215 255 7970 [email protected]
 Axalta Coating Systems 2001 Market Street Suite 3600 Philadelphia, PA 19103 USA Contact Christopher Mecray D +1 215 255 7970 [email protected] For Immediate Release Axalta Releases Second
EDWARDS LIFESCIENCES REPORTS STRONG FIRST QUARTER RESULTS DRIVEN BY SALES GROWTH OF 18.8 PERCENT
 Edwards Lifesciences Corporation One Edwards Way Irvine, CA USA 92614 Phone: 949.250.2500 Fax: 949.250.2525 www.edwards.com FOR IMMEDIATE RELEASE Media Contact: Amanda C. Fowler, 949-250-5070 Investor
APX GROUP HOLDINGS, INC. REPORTS FIRST QUARTER 2015 RESULTS
 APX GROUP HOLDINGS, INC. REPORTS FIRST QUARTER 2015 RESULTS First Quarter 2015 Financial and Portfolio Highlights APX Group Reports Total Revenue of $149.9 Million, up 14.9% Year over Year Adjusted EBITDA
Waste Management Announces Second Quarter Earnings
 FOR IMMEDIATE RELEASE Waste Management Announces Second Quarter Earnings Collection and Disposal Income from Operations Grows 3.4% HOUSTON July 26, 2012 Waste Management, Inc. (NYSE: WM) today announced
LIVE NATION REPORTS STRONG THIRD QUARTER 2009 RESULTS
 FOR IMMEDIATE RELEASE LIVE NATION REPORTS STRONG THIRD QUARTER 2009 RESULTS - Revenue growth of 14% to $1.8 billion driven by a 12% increase in attendance - - Income from continuing operations before taxes
IFMI REPORTS SECOND QUARTER 2015 FINANCIAL RESULTS
 IFMI REPORTS SECOND QUARTER 2015 FINANCIAL RESULTS Second Quarter Adjusted Operating Income of $1.0 Million or $0.05 per Diluted Share Board Declares Dividend of $0.02 per Share Philadelphia and New York,
Fortinet Reports Strong Third Quarter 2015 Financial Results. Record billings growth of 41% year over year
 Press Release Investor Contact: Media Contact: Michelle Spolver Sandra Wheatley Fortinet, Inc. Fortinet, Inc. 408-486-7837 408-391-9408 [email protected] [email protected] Fortinet Reports Strong
EPSILON REPORTS THIRD QUARTER 2015 RESULTS
 News Release EPSILON REPORTS THIRD QUARTER 2015 RESULTS Houston, Texas October 28, 2015 Epsilon Energy Ltd. ( Epsilon or the Company ) (TSX:EPS) today reported third quarter 2015 financial and operating
Contact Chris Grandis FINAL Media Relations Director Moved on Business Wire Corporate February 8, 2012 703.641.2316 cgrandis@csc.
 Contact Chris Grandis FINAL Media Relations Director Moved on Business Wire Corporate February 8, 2012 703.641.2316 [email protected] Bryan Brady Vice President, Investor Relations Corporate 703.641.3000
Select Medical Holdings Corporation Announces Results for Second Quarter Ended June 30, 2015
 R E L E A S E FOR IMMEDIATE RELEASE 4714 Gettysburg Road Mechanicsburg, PA 17055 Select Medical Holdings Corporation Announces Results for Second Quarter Ended June 30, 2015 NYSE Symbol: SEM MECHANICSBURG,
EQUITY OFFICE ANNOUNCES FIRST QUARTER 2004 RESULTS
 Two North Riverside Plaza, Suite 2100 Chicago, Illinois 60606 phone 312.466.3300 fax 312.454.0332 www.equityoffice.com Equity Office (Investors/Analysts): Diane Morefield 312.466.3286 Equity Office (Media):
4 th Quarter 2010 Earnings Supplemental Information. March 31, 2010
 4 th Quarter 2010 Earnings Supplemental Information March 31, 2010 Safe Harbor Statement Investors are urged to review Rite Aid s SEC filings. Statements, estimates, targets, projections and other information
TransUnion Reports Third Quarter 2014 Results
 TransUnion Reports Third Quarter 2014 Results Revenue of $338 million, an increase of 13 percent on a GAAP basis (14 percent on a constant currency basis) compared with the third quarter of 2013 Adjusted
Thomas A. Bessant, Jr. (817) 335-1100
 335-1100") Additional Information: Thomas A. Bessant, Jr. (817) 335-1100 For Immediate Release ********************************************************************************** CASH AMERICA FIRST QUARTER NET INCOME
Additional Information: Thomas A. Bessant, Jr. (817) 335-1100 For Immediate Release ********************************************************************************** CASH AMERICA FIRST QUARTER NET INCOME
NATIONSTAR REPORTS FIRST QUARTER 2014 FINANCIAL RESULTS & STRATEGIC ACQUISITION
 Contact: Marshall Murphy (469) 549-3005 FOR IMMEDIATE RELEASE NATIONSTAR REPORTS FIRST QUARTER 2014 FINANCIAL RESULTS & STRATEGIC ACQUISITION GAAP EPS of $0.27 Pro forma EPS of $0.53, including impact
FIRST QUARTER CONFERENCE CALL MAY 4, 2010
 FIRST QUARTER CONFERENCE CALL MAY 4, 2010 1 Cautionary Statement CAUTIONARY NOTE REGARDING FORWARD-LOOKING STATEMENTS: This presentation contains or incorporates by reference forwardlooking statements
Thomas A. Bessant, Jr. (817) 335-1100
 335-1100") Additional Information: Thomas A. Bessant, Jr. (817) 335-1100 For Immediate Release ********************************************************************************** CASH AMERICA FIRST QUARTER NET INCOME
Additional Information: Thomas A. Bessant, Jr. (817) 335-1100 For Immediate Release ********************************************************************************** CASH AMERICA FIRST QUARTER NET INCOME
SWIFT ENERGY ANNOUNCES FIRST QUARTER 2015 RESULTS
 17001 NORTHCHASE DR., SUITE 100, HOUSTON, TEXAS 77060 SWIFT ENERGY COMPANY COMPANY CONTACT: Doug Atkinson Manager Investor Relations (281) 874-2700, (800) 777-2412 FOR IMMEDIATE RELEASE SWIFT ENERGY ANNOUNCES
GENERAL GROWTH PROPERTIES REPORTS THIRD QUARTER RESULTS Mall NOI Increases 4.0%
 GENERAL GROWTH PROPERTIES REPORTS THIRD QUARTER RESULTS Mall NOI Increases 4.0% Chicago, Illinois, October 31, 2012 General Growth Properties, Inc. (the Company ) (NYSE: GGP) today reported results for
Prologis Announces Fourth Quarter and Full Year 2013 Earnings Results
 January 30, 2014 Prologis Announces Fourth Quarter and Full Year 2013 Earnings Results - Leased record 43.7 million square feet in Q4 and 152 million square feet in 2013 - - Occupancy increased to 95.1
LIVE NATION ENTERTAINMENT REPORTS FIRST QUARTER 2011 FINANCIAL RESULTS
 ` FOR IMMEDIATE RELEASE LIVE NATION ENTERTAINMENT REPORTS FIRST QUARTER 2011 FINANCIAL RESULTS LOS ANGELES May 5, 2011 Live Nation Entertainment (NYSE: LYV) released financial results for the three months
FLY LEASING REPORTS SECOND QUARTER 2010 FINANCIAL RESULTS AND REPURCHASE OF 1.4 MILLION SHARES
 FLY LEASING REPORTS SECOND QUARTER FINANCIAL RESULTS AND REPURCHASE OF 1.4 MILLION SHARES Dublin, Ireland, August 4, FLY Leasing Limited (NYSE: FLY) ( FLY ), a global lessor of modern, fuel-efficient commercial
Spectra Energy Reports Second Quarter 2007 Results
 Media: Molly Boyd (713) 627-5923 (713) 627-4747 (24-hour media line) Analysts: John Arensdorf (713) 627-4600 Date: August 6, 2007 Spectra Energy Reports Second Quarter 2007 Results Second quarter reported
Contact: Marcel Goldstein CSC PRESS RELEASE Corporate Public Relations August 6, 2013 CSC 703-641-3271 [email protected]
 Contact: Marcel Goldstein CSC PRESS RELEASE Corporate Public Relations August 6, 2013 CSC 703-641-3271 [email protected] Steve Virostek Investor Relations CSC 703-641-3000 [email protected] CSC
Spectra Energy Reports Third Quarter 2007 Results
 Media: Molly Boyd (713) 627-5923 (713) 627-4747 (24-hour media line) Analysts: John Arensdorf (713) 627-4600 Date: November 6, 2007 Spectra Energy Reports Third Quarter 2007 Results Third quarter ongoing
USA Truck Announces Record Fourth-Quarter 2014 EPS of $0.40
 USA Truck Announces Record Fourth-Quarter 2014 EPS of $0.40 Base revenue up 10.7% over 4Q13 to $125.8 million Operating income of $8.6 million compared to 4Q13 operating loss of $4.7 million Adjusted EBITDA
Veritiv Corporation 2Q14 Financial Results. August 13, 2014
 Veritiv Corporation 2Q14 Financial Results August 13, 2014 Safe Harbor Provision Certain statements contained in this presentation regarding Veritiv Corporation s (the Company ) future operating results,
NEWS RELEASE MFLEX ANNOUNCES THIRD QUARTER 2015 FINANCIAL RESULTS
 NEWS RELEASE Contact: Stacy Feit Investor Relations Tel: 213-486-6549 Email: [email protected] MFLEX ANNOUNCES THIRD QUARTER 2015 FINANCIAL RESULTS Fifth consecutive quarter of strong profitability
China Cord Blood Corporation Reports Financial Results for the Fourth Quarter and Full Year Fiscal 2010
 China Cord Blood Corporation Reports Financial Results for the Fourth Quarter and Full Year Fiscal 2010 Annual Revenue up 34.4% to RMB 261.5 Million Fiscal 2010 New Subscribers grew 30.5% Conference Call
Oceaneering Reports First Quarter 2016 Results
 PRESS RELEASE Oceaneering Reports First Quarter 2016 Results April 25, 2016 Houston, Texas Oceaneering International, Inc. ( Oceaneering or the Company ) (NYSE:OII) today reported net income of $25.1 million,
Contacts: Investor Relations Evan Black & Kristina Carbonneau 800.493.8219 [email protected]
 Contacts: Investor Relations Evan Black & Kristina Carbonneau 800.493.8219 [email protected] Media Relations Laurie Kight 214.801.6455 [email protected] Santander
Syncordia Technologies and Healthcare Solutions, Corp. Reports Second Quarter Fiscal 2016 Results
 Syncordia Technologies and Healthcare Solutions, Corp. Reports Second Quarter Fiscal 2016 Results - Sequential growth of Revenue and Adjusted EBITDA of 15% and 10%, respectively Toronto, Ontario. November
NXP Semiconductors Reports Third Quarter 2015 Results
 Q3 Revenue $1,522 million GAAP Gross margin 48.6% GAAP Operating margin 24.6% GAAP Diluted earnings per share $1.49 Non-GAAP Gross margin 49.1% Non-GAAP Operating margin 29.5% Non-GAAP Diluted earnings
Enbridge Income Fund Holdings Inc. Reports Strong First Quarter Results; Declares Monthly Dividend
 NEWS RELEASE Enbridge Income Fund Holdings Inc. Reports Strong First Quarter Results; Declares Monthly Dividend HIGHLIGHTS (all financial figures are unaudited and in Canadian dollars unless otherwise
Energy Future Holdings Reports First Quarter 2013 Results
 News Release FOR IMMEDIATE RELEASE Energy Future Holdings Reports First Quarter 2013 DALLAS May 2, 2013 Energy Future Holdings Corp. (EFH) today reported consolidated financial results for the first quarter
WESTERN DIGITAL CORPORATION CONDENSED CONSOLIDATED BALANCE SHEETS. (in millions; unaudited) ASSETS
 ASSETS") CONDENSED CONSOLIDATED BALANCE SHEETS (in millions; unaudited) ASSETS Apr. 1, July 3, 2016 2015 Current assets: Cash and cash equivalents $ 5,887 $ 5,024 Short-term investments 146 262 Accounts receivable,
CONDENSED CONSOLIDATED BALANCE SHEETS (in millions; unaudited) ASSETS Apr. 1, July 3, 2016 2015 Current assets: Cash and cash equivalents $ 5,887 $ 5,024 Short-term investments 146 262 Accounts receivable,
James L. Dunn, Jr. Senior Vice President and Chief Financial Officer (602) 952-1200
 952-1200") Contact: James M. Powers, Jr. President and Chief Executive Officer (602) 952-1200 James L. Dunn, Jr. Senior Vice President and Chief Financial Officer (602) 952-1200 ilinc COMMUNICATIONS ANNOUNCES FISCAL
Contact: James M. Powers, Jr. President and Chief Executive Officer (602) 952-1200 James L. Dunn, Jr. Senior Vice President and Chief Financial Officer (602) 952-1200 ilinc COMMUNICATIONS ANNOUNCES FISCAL
LIVE NATION ENTERTAINMENT REPORTS THIRD QUARTER AND NINE MONTHS 2014 FINANCIAL RESULTS
 LIVE NATION ENTERTAINMENT REPORTS THIRD QUARTER AND NINE MONTHS 2014 FINANCIAL RESULTS Highlights (year over year): Revenue for the Third Quarter Up 11% Adjusted Operating Income for the Third Quarter
JGWPT Holdings Inc. Reports Third Quarter Financial Results
 JGWPT Holdings Inc. Reports Third Quarter Financial Results 12.20.13 RADNOR, Pa.--(BUSINESS WIRE)-- JGWPT Holdings Inc. ( JGWPT or the Company ) (NYSE:JGW), a leading purchaser of structured settlement
APX GROUP HOLDINGS, INC. REPORTS FIRST QUARTER 2014 FINANCIAL RESULTS
 APX GROUP HOLDINGS, INC. REPORTS FIRST QUARTER 2014 FINANCIAL RESULTS 1st Quarter Financial Highlights Total revenues of $130.2 million for the first quarter 2014, an increase of 21.8%, compared to $106.9
Verifone Reports Results for the Second Quarter of Fiscal 2016
 Verifone Reports Results for the Second Quarter of Fiscal 2016 SAN JOSE, Calif. (BUSINESS WIRE) Verifone (NYSE: PAY), a world leader in payments and commerce solutions, today announced financial results
ANADARKO ANNOUNCES FIRST-QUARTER 2015 RESULTS
 1 NEWS ANADARKO ANNOUNCES FIRST-QUARTER 2015 RESULTS Increases Midpoint of Full-Year Sales-Volume Guidance by 5 Million BOE HOUSTON, May 4, 2015 (NYSE: APC) today announced its financial and operating
SUNOCO LOGISTICS PARTNERS L.P.
 (Mark One) UNITED STATES SECURITIES AND EXCHANGE COMMISSION WASHINGTON, D.C. 20549 FORM 10-K OR ANNUAL REPORT PURSUANT TO SECTION 13 OR 15(d) OF THE SECURITIES EXCHANGE ACT OF 1934 For the fiscal year
CUMULUS MEDIA INC. Cumulus Reports Operating Results for Third Quarter 2015
 CUMULUS MEDIA INC. Cumulus Reports Operating Results for Third Quarter 2015 ATLANTA, GA November 5, 2015: Cumulus Media Inc. (NASDAQ: CMLS) (the Company, we, us, or our ) today announced operating results
American Electric Technologies Inc
 SECURITIES & EXCHANGE COMMISSION EDGAR FILING American Electric Technologies Inc Form: 8-K Date Filed: 2015-11-16 Corporate Issuer CIK: 1043186 Copyright 2015, Issuer Direct Corporation. All Right Reserved.
Consolidated Income Statements SAP-Group 3rd quarter
 SAP Reports 17% Growth in Software Revenues for the Third Quarter 2006 Page 1 SAPGroup 3rd quarter Software revenue 691 590 17% Maintenance revenue 884 802 10% Product revenue 1,575 1,392 13% Consulting
LIVE NATION ENTERTAINMENT REPORTS FOURTH QUARTER AND FULL YEAR 2014 RESULTS
 LIVE NATION ENTERTAINMENT REPORTS FOURTH QUARTER AND FULL YEAR 2014 RESULTS Full Year 2014 - Record Year Record Setting Ticketmaster GTV of $23 Billion TM+ GTV Over $1 Billion Since Launch Over 1 Billion
DENBURY REPORTS 2014 FOURTH QUARTER AND ANNUAL RESULTS AND YEAR-END 2014 PROVED RESERVES
 News DENBURY REPORTS 2014 FOURTH QUARTER AND ANNUAL RESULTS AND YEAR-END 2014 PROVED RESERVES PLANO, TX February 19, 2015 Denbury Resources Inc. (NYSE: DNR) ("Denbury" or the "Company") today announced
How To Profit From A Strong Dollar
 For Immediate Release MERCER INTERNATIONAL INC. REPORTS STRONG 2015 THIRD QUARTER RESULTS ANNOUNCES QUARTERLY CASH DIVIDEND OF $0.115 NEW YORK, NY, October 29, 2015 - Mercer International Inc. (Nasdaq:
Spectra Energy Reports Fourth Quarter and Year-End 2015 Results
 Date: February 3, 2016 Spectra Energy Reports Fourth Quarter and Year-End 2015 Results Year-End Highlights: 2015 distributable cash flow of $1.3 billion, with dividend coverage ratio of 1.3x, exceeding
COTT ANNOUNCES FIRST QUARTER 2012 RESULTS AND SHARE REPURCHASE PROGRAM FOR UP TO $35 MILLION IN COMMON SHARES
 CONTACT: Michael C. Massi Investor Relations Tel: (813) 313-1786 [email protected] COTT ANNOUNCES FIRST QUARTER 2012 RESULTS AND SHARE REPURCHASE PROGRAM FOR UP TO $35 MILLION IN COMMON SHARES
LIVE NATION ENTERTAINMENT REPORTS FOURTH QUARTER AND STRONG FULL YEAR 2009 FINANCIAL RESULTS
 LIVE NATION ENTERTAINMENT REPORTS FOURTH QUARTER AND STRONG FULL YEAR 2009 FINANCIAL RESULTS - Live Nation and Ticketmaster complete Merger in January 2010 - - Live Nation grows adjusted operating income
HubSpot's Momentum Accelerates in Q4 2014 with 53% Revenue Growth and 35% Customer Growth
 HubSpot's Momentum Accelerates in Q4 2014 with 53% Revenue Growth and 35% Customer Growth CAMBRIDGE, MA (February 11, 2015) HubSpot, Inc. (NYSE: HUBS), a leading inbound marketing and sales software company,
THIRD QUARTER. Interim Report to Shareholders For the nine months ending September 30, 2012. Stability. matters
 THIRD QUARTER Interim Report to Shareholders For the nine months ending 2012 Stability matters ENBRIDGE INCOME FUND HOLDINGS INC. (ENF) NEWS RELEASE Enbridge Income Fund Holdings Inc. Announces Third
FOR IMMEDIATE RELEASE
 FOR IMMEDIATE RELEASE O-I REPORTS FULL YEAR AND FOURTH QUARTER 2014 RESULTS O-I generates second highest free cash flow in the Company s history PERRYSBURG, Ohio (February 2, 2015) Owens-Illinois, Inc.
Capmark Financial Group Inc. Announces Stand Alone Third Quarter 2014 Earnings Results for its Wholly Owned Subsidiary, Bluestem Brands, Inc.
 Capmark Financial Group Inc. Announces Stand Alone Third Quarter 2014 Earnings Results for its Wholly Owned Subsidiary, Bluestem Brands, Inc. Horsham, PA December 23, 2014 Capmark Financial Group Inc.
Paylocity Announces Second Quarter Fiscal Year 2016 Financial Results
 Paylocity Announces Second Quarter Fiscal Year 2016 Financial Results Q2 2016 Total Revenue of $55.2 million, up 61% year-over-year Q2 2016 Recurring Revenue of $52.3 million, up 61% year-over-year ARLINGTON
Weyerhaeuser Company Exhibit 99.2 Q1.2015 Analyst Package Preliminary results, subject to audit Consolidated Statement of Operations
 Exhibit 99.2 Q1. Analyst Package Consolidated Statement of Operations Page 1 of 8 Net Sales $ 1,788 $ 1,721 $ 1,736 Cost of products sold 1,399 1,385 1,361 Gross margin 389 336 375 Selling expenses 29
JOHN WILEY & SONS, INC. UNAUDITED SUMMARY OF OPERATIONS FOR THE FIRST QUARTER ENDED JULY 31, 2011 AND 2010 (in thousands, except per share amounts)
") UNAUDITED SUMMARY OF OPERATIONS FOR THE FIRST QUARTER ENDED JULY 31, 2011 AND 2010 (in thousands, except per share amounts) US GAAP First Quarter Ended Revenue $ 430,069 407,938 5% Costs and Expenses Cost
UNAUDITED SUMMARY OF OPERATIONS FOR THE FIRST QUARTER ENDED JULY 31, 2011 AND 2010 (in thousands, except per share amounts) US GAAP First Quarter Ended Revenue $ 430,069 407,938 5% Costs and Expenses Cost
CORRAL PETROLEUM HOLDINGS AB (publ)
") CORRAL PETROLEUM HOLDINGS AB (publ) REPORT FOR THE FOURTH QUARTER AND YEAR ENDED DECEMBER 31, 2011 FOR IMMEDIATE RELEASE Date: March 30, 2012 London Nr. of pages 14 This report includes unaudited consolidated
CORRAL PETROLEUM HOLDINGS AB (publ) REPORT FOR THE FOURTH QUARTER AND YEAR ENDED DECEMBER 31, 2011 FOR IMMEDIATE RELEASE Date: March 30, 2012 London Nr. of pages 14 This report includes unaudited consolidated
Höegh LNG Partners LP. Höegh LNG Partners LP Fourth Quarter Financial Results February 26, 2015
 Höegh LNG Partners LP Höegh LNG Partners LP Fourth Quarter Financial Results February 26, 2015 Forward-Looking Statements This presentation contains certain forward-looking statements concerning future
Great Basin Reports 2015 Second Quarter Results and Business Update
 Great Basin Reports 2015 Second Quarter Results and Business Update Company Reports 122 Revenue-Generating Customers, Reaffirms Guidance of 170-180 Customers by Year End SALT LAKE CITY, August 12, 2015