Major Causes of Injury Death
|
|
|
- Pamela Kennedy
- 8 years ago
- Views:
Transcription
1 1 of 9 Unintentional injuries and violence are the leading causes of death, hospitalization, and disability for children ages This fact sheet provides a state snapshot of data on the injury-related Maternal and Child Health Block Grant National Performance Measures and Health Status Indicators, with a special focus on disparities based on race, gender, and rural/urban residence. The fact sheet is intended to be a helpful and easy-to-use tool for needs assessments, planning, program development, and presentations. The Children s Safety Network (CSN) National Injury and Violence Prevention Resource Center, funded by the Maternal and Child Health (MCH) Bureau, works with states to utilize a science-based, public health approach for injury and violence prevention (IVP). CSN is available to provide information and technical assistance on injury surveillance and data; needs assessments; best practices; and the design, implementation, and evaluation of programs to prevent child and adolescent injuries. Major Causes of Injury Death
 National Injury and Violence Prevention Resource Center, funded by the Maternal and Child Health (MCH) Bureau, works with states to utilize a science-based, public")
2 Major Causes of Hospital-Admitted Injuries 2 of 9

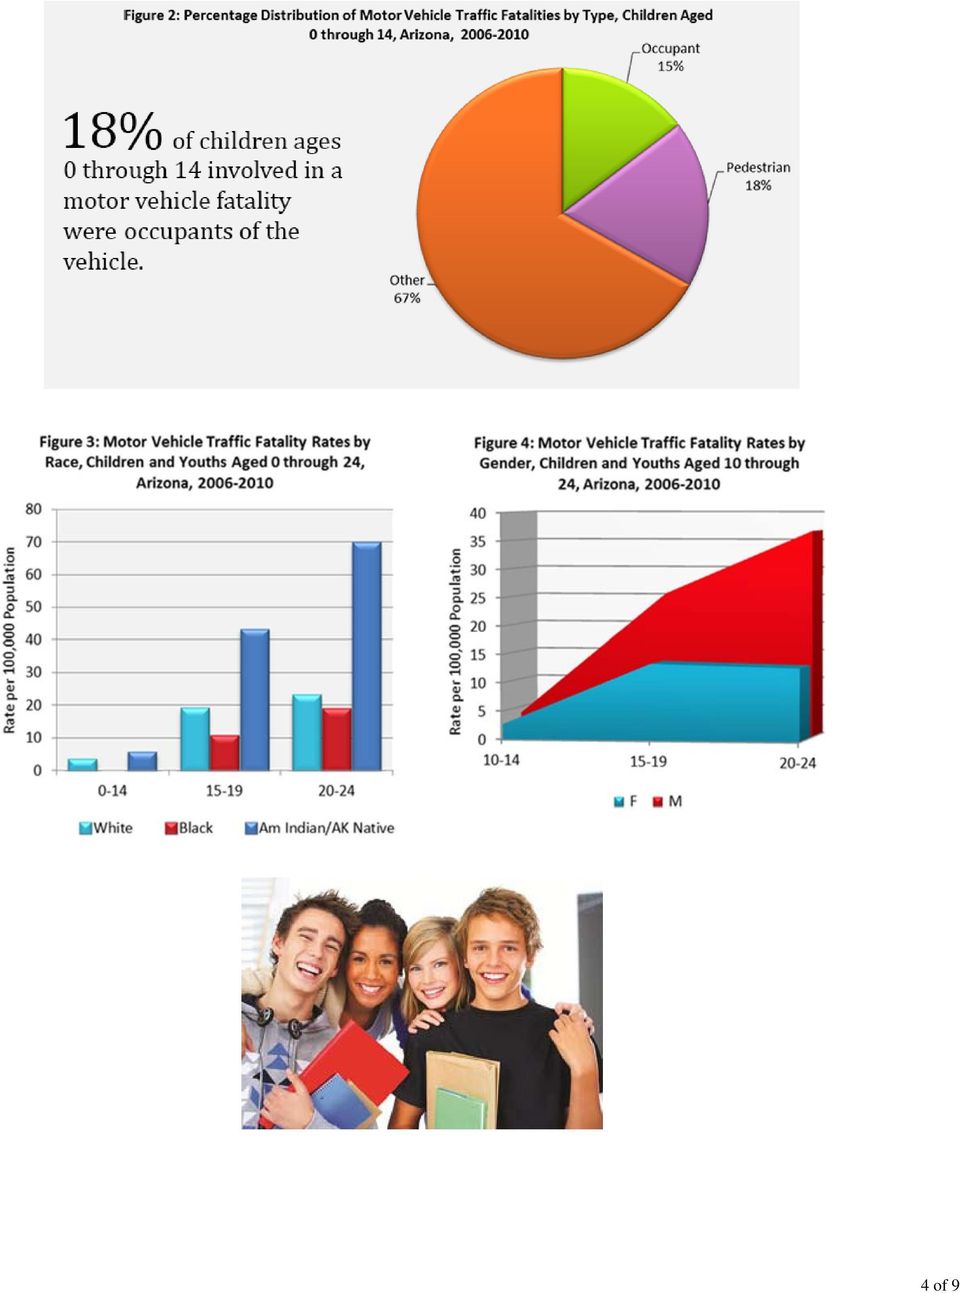
3 3 of 9 National Performance Measures The Federal Maternal and Child Health Bureau Block Grant program requires State MCH programs to report on 18 National Performance Measures (NPM), two of which directly address injuries. NPM #10 addresses the rate of deaths to children aged 14 years and younger caused by motor vehicle crashes per 100,000 children. NPM #16 addresses the rate (per 100,000) of suicide deaths among youths aged 15 through 19. The following figures provide information related to NPMs #10 and #16. NPM 10: Reducing Unintentional Motor Vehicle Deaths to Children Ages 0-14 Motor vehicle-related deaths remain a major cause of death for children 14 and under. Figure 1 shows the change in the rate of state motor vehicle-related deaths compared to the US rate from Overall, the rate of death per 100,000 population declined steadily across the US during this period. Figure 2 provides a breakout of the fatalities by type distinguishing motor vehicle occupant deaths (of any vehicle type) from pedestrian and pedal cyclist fatalities. This information allows states to understand which types are responsible for most of the fatalities. Figure 3 breaks out the fatalities by race and age group. There are considerable differences between races suggesting variations in social norms, safety practices, and the presence of risk factors, including child restraint system (CRS) or safety belt usage, alcohol involved crashes, and the use of helmets. Many factors may affect this variation. Figure 4 provides a breakdown of fatalities by gender and, although there is little variability between males and females for the age group, there is an increasing difference in the age group. Figure 4 suggests that the female rate decreased for year olds compared with the year olds while male fatalities increased for year olds.

4 4 of 9
5 5 of 9 One way of understanding disparities is to look at the rate of injuries by place of occurrence. To show this, CSN has provided the rates for the 0 14, and age groups using the urban-rural classification system developed by the National Center for Health Statistics (NCHS). To show how injury rates vary by level of urbanization, a table based on the classification system can be found here and defines six levels of urbanization: large central metro, large fringe metro, medium metro, small metro, micropolitan, and noncore. Figure 5 shows how the rate varies by age group by place of occurrence/urban-rural setting. This information allows the state to better understand any disparity that may occur between the different settings. Data are provided only for those areas in which 20 or more deaths occurred. Many of these motor vehicle related deaths can be prevented through the implementation of a broad range of evidence-informed interventions and programs. These data are intended to provide a broad overview of the magnitude of the problem and to highlight possible disparities which may exist by race, gender, and urbanicity. NPM 16: Reducing Suicide Deaths Among Teens Ages Suicide is the 4th leading cause of death and the 3rd leading cause of injury-related death among US youth years of age. According to the 2011 Youth Risk Behavior Surveillance Survey (YRBSS), 15.8% of students seriously considered attempting suicide and 7.8% of students attempted suicide one or more times in the 12 months prior to the survey. Although progress has been made over the past decade in reducing the rate of completed suicides nationally, this reduction has leveled off in the last few years. The following figures provide statespecific data related to suicide. Figure 6 shows the state rate from for year olds in comparison to the US rate for the same age group and time period. Figure 7 provides information on the means used by the year olds for completed suicides. It is important to note that the actual number of suicides is often quite small thus resulting in considerable variation when looking at year to year rates.

6 6 of 9
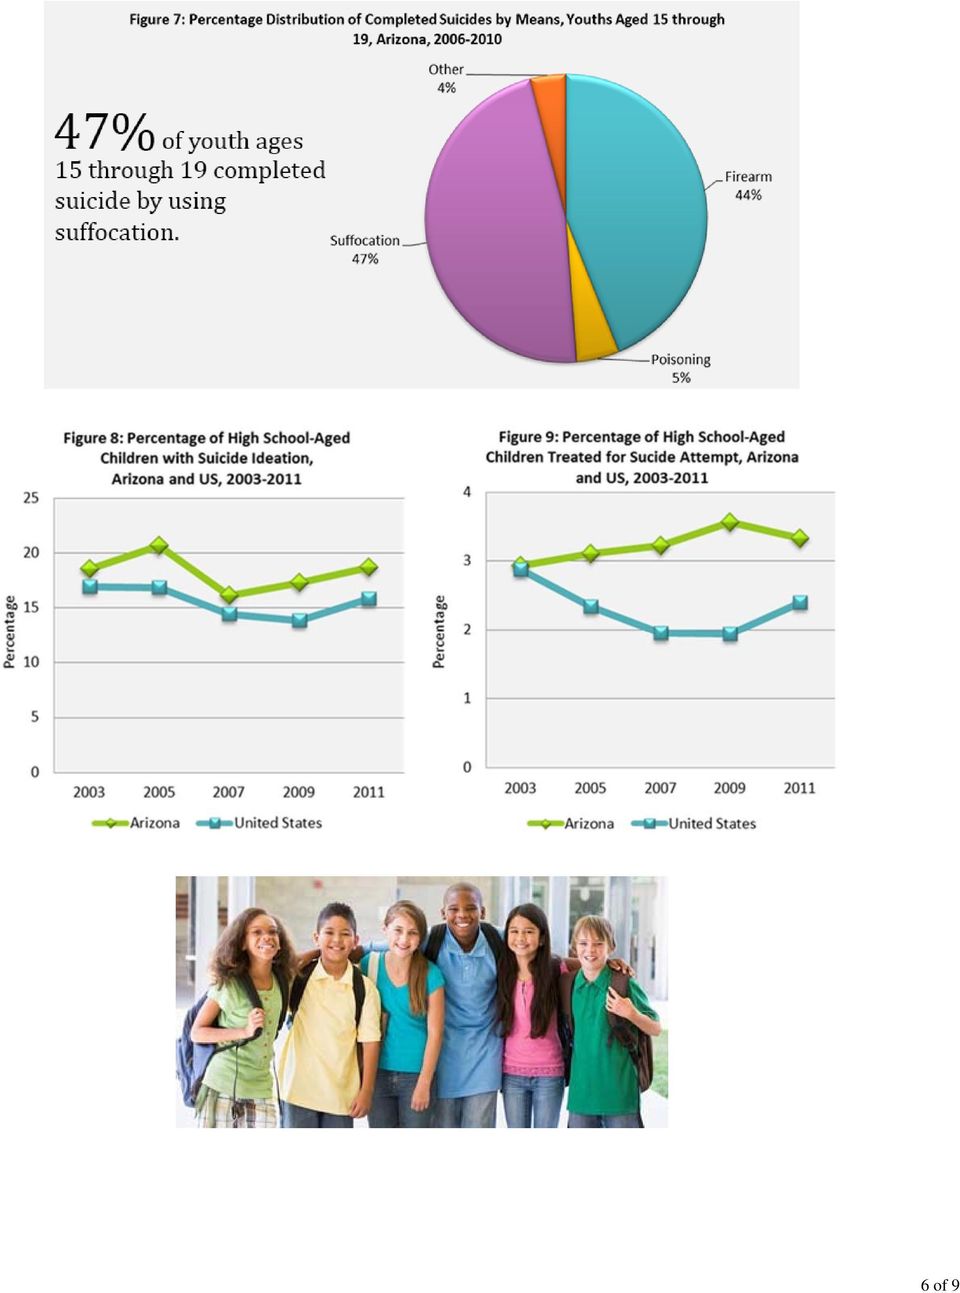
7 7 of 9 The YRBSS provides information about behaviors that contribute to unintentional and intentional violence among youth. Figures 8 and 9 provide information on the percentage of high school students with suicide ideation and the percentage who reported being medically treated for a suicide attempt from , respectively. This information and other information available in the YRBSS can help states understand how behaviors are changing within this age group. Figure 10 shows how the rate differs by race for and year olds from Figure 11 shows the difference by gender for the same age group and time period with the male rate for both age groups exceeding the female rate. Figure 12 looks at the variation in rate by urbanicity for year olds with the rate increasing as rurality increases (see definition of urbanicity in Motor Vehicle section). This information provides a better understanding of the magnitude of the problem in different parts of the state, helping the state to identify environmental risk factors and facilitate decision making on where to target its suicide prevention efforts.

8 8 of 9 IVP Health Status Indicators The Maternal and Child Health Bureau requires every state to report on 12 Health Status Indicators. Six of the indicators are related to IVP. The two figures below reflect the data reported for the IVP Health Status Indicators by the state in their Maternal and Child Health Block Grant Application Form 17, State Specific Performance Measures and Priority Needs Each state develops up to 7 10 State Performance Measures and priority needs. The following provides information about the states selected 2013 injury-related performance measures and priority needs. Arizona has the following injury-related State Performance Measures: Reduce the percent of high school students who report having experienced physical violence by a dating partner during the past 12 months. Reduce the percent of preventable fetal and infant deaths out of all fetal and infant deaths. Reduce emergency department visits for unintentional injuries per 100,000 children age Arizona has the following injury-related Priority Need: Reduce the rate of injuries, both intentional and unintentional, among Arizonans. State Contact Information MCH Director: Mary Ellen Cunningham, mary.ellen.cunningham@azdhs.gov IVP Director/EMSC Contact: Tomi St. Mars, stmarst@azdhs.gov CDR Coordinator: Marla Herrick, marla.herrick@azdhs.gov Adolescent Health Coordinator: Toni Means, toni.means@azdhs.gov State Fact Sheets Figure & Table Source Data Table 1 Source: WISQARS Leading Causes of Death Reports, Table 2 Source: National Center for Health Statistics, Multiple Cause of Death Data, Table 3 Source: Children's Safety Network Economics and Data Analysis Resource Center (CSN EDARC), at Pacific Institute for Research and Evaluation (PIRE), Calverton, MD, January Table 4 Source: Children's Safety Network Economics and Data Analysis Resource Center (CSN EDARC), at Pacific Institute for Research and Evaluation (PIRE), Calverton, MD, January 2013.

9 9 of 9 Figure 1 Source: WISQARS Fatal Injury Reports, and WISQARS Injury Mortality Reports, Figure 2 Source: WISQARS Fatal Injury Reports, and WISQARS Injury Mortality Reports, Figure 3 Source: WISQARS Injury Mortality Reports, Figure 4 Source: WISQARS Fatal Injury Reports, and WISQARS Injury Mortality Reports, Figure 5 Source: CDC WONDER Multiple Cause of Death data, and Urban-Rural Definition Classification System The classification scheme can be found at: NCHS Urban-Rural Classification Scheme for Counties, by Deborah D. Ingram and Sheila Franco. Figure 6 Source: WISQARS Fatal Injury Reports, and WISQARS Injury Mortality Reports, Figure 7 Source: WISQARS Fatal Injury Reports, and WISQARS Injury Mortality Reports, Figures 8 & 9 Source: Youth Online: High School Youth Risk Behavior Survey (YRBS), Figure 10 Source: WISQARS Injury Mortality Reports, and WISQARS Injury Mortality Reports, Figure 11 Source: WISQARS Fatal Injury Reports, and WISQARS Injury Mortality Reports, Figure 12 Source: CDC WONDER Multiple Cause of Death data, and Urban-Rural Definition Classification System Figures 13 & 14 Source: HRSA, Title V Information System Multi-Year Report. Some states may have changed their method of calculation. About Children s Safety Network The Children s Safety Network (CSN) National Injury and Violence Prevention Resource Center, funded by the Maternal and Child Health (MCH) Bureau, works with states to utilize a science-based, public health approach for injury and violence prevention (IVP). CSN is available to provide information and technical assistance on injury surveillance and data; needs assessments; best practices; and the design, implementation, and evaluation of programs to prevent child and adolescent injuries. In this fact sheet CSN provides a cursory review of the injury morbidity and mortality data available for the state. The figures and tables in this fact sheet can help you understand the state s progress in addressing motor vehicle traffic injuries and suicide. To target and address these and other injury issues, it is critical to understand this data. CSN can assist you in conducting detailed data analyses, utilizing surveillance systems, and undertaking needs assessments. For assistance, contact the Children's Safety Network at csninfo@edc.org. Connect with the Children s Safety Network 43 Foundry Avenue Waltham, MA CSN s website: CSN on Facebook: CSN on Twitter: Register for the CSN newsletter: Need TA? Have Questions? csninfo@edc.org CSN is funded by the Health Resources and Services Administration s Maternal and Child Health Bureau (U.S. Department of Health and Human Services). A project of the Education Development Center, Inc. January 2013

Injuries and Violence
 Injuries and Violence Introduction Injuries, both intentional and unintentional, are a significant health problem in children. Intentional or violent injuries refer to injuries that are self-inflicted,
Transportation Related Injury Data on the Web: What s Out There and How to Use It
 Transportation Related Injury Data on the Web: What s Out There and How to Use It Cindy Mervis ~ Maine Transportation Safety Coalition Meeting ~ Sept 11, 2014 OUTLINE Online data resources General population
SECTION 3.2: MOTOR VEHICLE TRAFFIC CRASHES
 SECTION 3.2: MOTOR VEHICLE TRAFFIC CRASHES 1,155 Deaths* 4,755 Hospitalizations 103,860 ED Visits *SOURCE: OHIO DEPARTMENT OF HEALTH, VITAL STATISTICS SOURCE: OHIO HOSPITAL ASSOCIATION CHAPTER HIGHLIGHTS:
BICYCLE-RELATED INJURIES
 BICYCLE-RELATED INJURIES Injury Prevention Plan of Alabama 3 BICYCLE-RELATED INJURIES THE PROBLEM: An estimated 140,000 children are treated each year in emergency departments for head injuries sustained
Figure 3.1 Rate of fatal work-related injuries per 100,000 workers, Colorado and the United States, 2001-2008
 Indicator : Fatal Work-Related Injuries Indicator : Fatal-Work Related Injuries Significance Fatal work-related injuries are defined as injuries that occur at work and result in death. Unintentional injuries
Adolescent Mortality. Alaska s adolescent mortality rate is 29% higher than the national rate and almost 1.6 times the Healthy People 2010 target.
 Alaska Maternal and Child Health Data Book 23 15 Adolescent Mortality Nationally, unintentional injury, assault and suicide account for 51% of deaths among adolescents ages 1-14 years in 2. Over the last
Unintentional Injury. Key Findings:
 Unintentional Injury Publicly funded services to address Unintentional Injury in the MCH population are described in CHILD Profile. In addition the DOH Injury and Violence Prevention Program addresses
Motor Vehicle Deaths Updated: August 2014
 Motor Vehicle Deaths Updated: Motor vehicle death rates rise rapidly during the teen years and remain very high into early adulthood. The rate for teens, however, has followed a downward trend for most
Morbidity and Mortality among Adolescents and Young Adults in the United States
 Morbidity and Mortality among Adolescents and Young Adults in the United States AstraZeneca Fact Sheet 2011 Authors Robert Wm. Blum MD, MPH, PhD William H. Gates, Sr. Professor and Chair Farah Qureshi,
INJURIES IN YOUNG PEOPLE
 INJURIES IN YOUNG PEOPLE Introduction Injury is the leading cause of mortality among young people aged 15-24 years, with the rate at which these events occur being far higher than for other age groups
Performance Measurement Framework and Performance Measures for the Revision of the Title V Block Grant
 Performance Measurement Framework and Performance Measures for the Revision of the Title V Block Grant Title V Performance Measures and Evaluation Since the 1998, States have reported annually on both
Youth in Washington State - Health & Medical Student Statistics For 2008
 DOH 910-907 Injury and Violence Washington State Department of Health Adolescent Needs Assessment January 2010 1 Washington Adolescents Injury and Violence Injuries are often called "accidents," suggesting
Working with Rural Teens:
 Working with Rural Teens: Adolescent Reproductive Health in Rural America Cara Finley Research & Evaluation Manager Alison Stewart Research Coordinator Third Annual Teen Pregnancy Prevention Grantee Conference
Injuries are a Major Public Health Problem in Massachusetts
 Injury Surveillance Program, Massachusetts Department of Public Health January 2015 Injuries are a Major Public Health Problem in Massachusetts Injuries are the third leading cause of death among Massachusetts
The Importance of Understanding External Cause of Injury Codes
 The Importance of Understanding External Cause of Injury Codes This presentation is designed to: Define external cause of injury codes Inform and Educate health care providers, policymakers, and the public
DOT HS 812 018 April 2014
 TRAFFIC SAFETY FACTS 2012 Data DOT HS 812 018 April 2014 Bicyclists and Other Cyclists In 2012, 726 pedalcyclists were killed and an additional 49,000 were injured in motor vehicle traffic crashes. Pedalcyclist
Infant mortality and injury-related deaths in Dallas County A five year review. September 20, 2013
 Infant mortality and injury-related deaths in Dallas County A five year review September 20, 2013 Dallas County Child Death Review Team A mechanism to describe the causes and circumstances of death among
How To Be Safe
 TRAFFIC SAFETY FACTS 2011 Data DOT HS 811 743 April 2013 Bicyclists and Other Cyclists In 2011, 677 pedalcyclists were killed and an additional 48,000 were injured in motor vehicle traffic crashes. Pedalcyclist
Traffic Safety Facts Research Note
 1 Traffic Safety Facts Research Note DOT HS 811 218 November 2009 Fatal Crashes Involving Summary Fatalities from crashes involving young drivers have accounted for just under one-fifth of all fatalities
 June 2006 Dear Traffic Safety Partners: The Wisconsin Department of Transportation, Bureau of Transportation Safety is pleased to provide you with a copy of the 2003 Wisconsin Alcohol Traffic Facts book.
International Collaborative Effort on Injury Statistics
 ICE International Collaborative Effort on Injury Statistics This lecture will overview a current and broad-based project in injury research; the ICE Injury Statistics Project. This effort, as you will
E Erie County Injury Statistics
 Serious Injury Deaths and Hospitalizations, 2007 Erie County, PA, and U.S. In Erie County, unintentional injury was the fifth leading cause of death for the three year period 2004 through 2006 (Table 1),
Traffic Safety Facts. Children. 2003 Data. Motor vehicle crashes are the leading cause of death for children from 2 to 14 years old.
 Traffic Safety Facts 2003 Data DOT HS 809 762 Children Motor vehicle crashes are the leading cause of death for children from 2 to 14 years old. In 2003, there were more than 60 million children under
PROMOTING BICYCLE SAFETY FOR CHILDREN: Strategies and Tools for Community Programs
 PROMOTING BICYCLE SAFETY FOR CHILDREN: Strategies and Tools for Community Programs This issue brief provides strategies and resources for community organizations to use in developing and implementing bike
Macomb County Office of Substance Abuse MCOSA. Executive Summary
 Macomb County Office of Substance Abuse MCOSA Executive Summary This report marks the second data profile of alcohol and illicit drugs burden in Macomb County. The first report produced in 2007 detailed
TRAFFIC SAFETY FACTS. Bicyclists and Other Cyclists. 2009 Data
 TRAFFIC SAFETY FACTS 2009 Data Bicyclists and Other Cyclists For the purpose of this Traffic Safety Fact Sheet, bicyclists and other cyclists include riders of two-wheel nonmotorized vehicles, tricycles,
Indicator 3: Fatal Work-Related Injuries
 Indicator 3: Fatal Work-Related Injuries Significance i Fatal work-related injuries are defined as injuries that occur at work and result in death. Each year, over 4,600 cases of work-related fatalities
Motorcycle Related Crash Victims (What the Statistics Say) Mehdi Nassirpour Illinois Department of Transportation Division of Transportation Safety
 Mehdi Nassirpour Illinois Department of Transportation Division of Transportation Safety") Motorcycle Related Crash Victims (What the Statistics Say) Mehdi Nassirpour Illinois Department of Transportation Division of Transportation Safety Illinois Highway Safety Program Areas Occupant Protection
Motorcycle Related Crash Victims (What the Statistics Say) Mehdi Nassirpour Illinois Department of Transportation Division of Transportation Safety Illinois Highway Safety Program Areas Occupant Protection
The Injury Alberta Report, 2011
 The Injury Alberta Report, 2011 By 2015 480 Lives Saved 30% Fewer Injury Hospital Admissions $700 Million in Healthcare Costs Saved Injury Alberta is an initiative led by graduate students with the School
Focus on Bicycle Safety: Resource Guide 2012
 Focus on Bicycle Safety: Resource Guide 2012 With the start of summer, CSN is providing this special issue of our newsletter on bicycle safety, a topic which is also linked to initatives to promote healthy
Alcohol. HP 2010 Objectives:
 Alcohol Alcohol is one of the most commonly used substances during adolescence. Though underage drinking is against the law, alcohol may be easily accessible to many teens. Binge drinking (defined by the
Healthy People 2020: Who s Leading the Leading Health Indicators?
 Healthy People 2020: Who s Leading the Leading Health Indicators? Don Wright, MD, MPH Deputy Assistant Secretary for Health Promotion and Disease Prevention Who s Leading the Leading Health Indicators?
ECU, Center for Health Services Research and Development, 2001. Unintentional Injury
 Unintentional Injury Map 10.1 Progress Towards Unintentional Injury Mortality Objective Northampton Gates Currituck Camden Pasquotank Halifax Hertford Perquimans Nash Bertie Chowan Edgecombe Martin Washington
The History of Injury Control and the Epidemiology of Child and Adolescent Injuries. Abstract
 23 The History of Injury Control and the Epidemiology of Child and Adolescent Injuries David C. Grossman Abstract Unintentional injuries claim the lives of more children each year than any other cause
Data Report. Created: 9.20.11. 2010 North Carolina Fatalities of 15-17 year-olds in Motor Vehicle Crashes
 Data Report Created: 9.20.11 1 2010 North Carolina of 15-17 year-olds in Motor Please note: This information is specific to the request of the Executive Director of the Child Fatality Task Force. Data
INJURIES AND DEATHS ACCIDENTS OF ARIZONA RESIDENTS IN MOTOR VEHICLE
 INJURIES AND DEATHS OF ARIZONA RESIDENTS IN MOTOR VEHICLE ACCIDENTS Public Health Services Bureau of Public Health Statistics Health Status and Vital Statistics Section ~ Leadership for a Healthy Arizona
DOT HS 811 767 May 2013
 TRAFFIC SAFETY FACTS 2011 Data DOT HS 811 767 May 2013 Children In 2011, there were 61 million children age 14 and younger in the United States, 20 percent of the total U.S. resident population in 2011.
9. Substance Abuse. pg 166-169: Self-reported alcohol consumption. pg 170-171: Childhood experience of living with someone who used drugs
 9. pg 166-169: Self-reported alcohol consumption pg 170-171: Childhood experience of living with someone who used drugs pg 172-173: Hospitalizations related to alcohol and substance abuse pg 174-179: Accidental
Traffic Safety Facts 2008 Data
 Traffic Safety Facts 2008 Data Children DOT HS 811 157 In 2008, there were nearly 61 million children age 14 and younger in the United States. This age group made up 20 percent of the total U.S. resident
New York Study of Booster Seat Effects on Injury Reduction Compared to Safety Belts in Children Aged 4-8 in Motor Vehicle Crashes
 New York Study of Booster Seat Effects on Injury Reduction Compared to Safety Belts in Children Aged 4-8 in Motor Vehicle Crashes Kainan Sun, Ph.D., Michael Bauer, M.S. Sarah M. Sperry, M.S., Susan Hardman
DOT HS 812 011 April 2014
 TRAFFIC SAFETY FACTS 2012 Data DOT HS 812 011 April 2014 Children During 2012, there were a total of 33,561 traffic fatalities in the United States. Children 14 and younger accounted for 1,168 (3%) of
Traffic Safety Facts 2008 Data
 Traffic Safety Facts 2008 Data Bicyclists and Other Cyclists DOT HS 811 156 Bicyclists and other cyclists include riders of two-wheel nonmotorized vehicles, tricycles, and unicycles powered solely by pedals.
The Role of Health Plans
 Preventing Adolescent Injury: The Role of Health Plans Adolescent Injury: In the United States, unintentional injuries are the leading cause of death among adolescents and a leading cause of medical spending
NATIONAL ACTION PLAN for CHILD INJURY PREVENTION
 NATIONAL ACTION PLAN for CHILD INJURY PREVENTION An Agenda to Prevent Injuries and Promote the Safety of Children and Adolescents in the United States The National Action Plan for Child Injury Prevention
SPORTS/RECREATION-RELATED TRAUMATIC BRAIN INJURIES AMONG OHIO S 18 AND YOUNGER POPULATION
 SPORTS/RECREATION-RELATED TRAUMATIC BRAIN INJURIES AMONG OHIO S 18 AND YOUNGER POPULATION VIOLENCE AND INJURY PREVENTION PROGRAM OHIO DEPARTMENT OF HEALTH MAY 2011 DATA PROVIDED BY THE OHIO HOSPITAL ASSOCIATION
Youth and Road Crashes Magnitude, Characteristics and Trends
 Youth and Road Crashes Magnitude, Characteristics and Trends The The mission of the (TIRF) is to reduce traffic related deaths and injuries TIRF is a national, independent, charitable road safety institute.
Selected Findings from the Indicators of School Crime and Safety: 2014
 Selected Findings from the Indicators of School Crime and Safety: 2014 CEBCP Symposium, August 17, 2015 Simone A. Robers Associate Director, Education Institute for Public Research, CNA Today! Importance
There were 160 hospitalisations of Aboriginal and Torres Strait Islander children for
 Australia s children 2002 There were 216 hospitalisations of Aboriginal and Torres Strait Islander children for burns and scalds. Indigenous children had a hospitalisation rate for injuries from burns
TRAUMATIC BRAIN INJURY (TBI)
") TRAUMATIC BRAIN INJURY (TBI) A husband and wife, in their late forties, attend a support meeting of professionals in the TBI field. He is a survivor of a traumatic brain injury. The man rides in a special
TRAUMATIC BRAIN INJURY (TBI) A husband and wife, in their late forties, attend a support meeting of professionals in the TBI field. He is a survivor of a traumatic brain injury. The man rides in a special
In this session, we ll address the issue Once you have data, what do you do with it? Session will include discussion & a data analysis exercise
 Introduce self. Link this talk to the two previous data talks We ve discussed the importance of data to an IP Program We ve identified sources of community-based injury data and We ve discussed planning
Miles to go: F ocusing on Risks for Teen Driver Crashes
 A 2 0 1 3 N a t i o n a l T e e n D r i v e r S a f e t y R e p o r t T h i r d i n a S e r i e s Miles to go F o c u s i n g o n R i s k s f o r T e e n D r i v e r C r a s h e s Motor vehicle crashes
The 2014 Update of the Rural-Urban Chartbook
 The 2014 Update of the Rural-Urban Chartbook October 2014 Authors Michael Meit, MA, MPH Alana Knudson, PhD Tess Gilbert, MPH Amanda Tzy-Chyi Yu, MHA, PhD Erin Tanenbaum, MA Elizabeth Ormson, MS Shannon
Colorado Core Violence and Injury Prevention Program Motor Vehicle Policy Action Plan Year Three Tasks 5-Year Period: August 1, 2012- July 31, 2016
 Context Colorado Core Violence and Injury Prevention Program Motor Vehicle Policy Action Plan Year Three Tasks 5-Year Period: August 1, 2012- July 31, 2016 Between 2004 and 2011, Colorado experienced over
Overview of Injury in Texas and the Role of the EMS/Trauma Registry November, 2004
 Overview of Injury in Texas and the Role of the EMS/Trauma Registry November, 2004 Report Prepared by: Linda Jones, MSPH, Kelly Johnson, BS, John Hellsten, PhD, Blaise Mathabela, MS Texas Department of
DOT HS 811 700 December 2012
 TRAFFIC SAFETY FACTS 2011 Data DOT HS 811 700 December 2012 Alcohol-Impaired Driving Drivers are considered to be alcohol-impaired when their blood alcohol concentration (BAC) is.08 grams per deciliter
DOT HS 811 625 August 2012
 TRAFFIC SAFETY FACTS 2010 Data DOT HS 811 625 August 2012 Pedestrians In 2010, 4,280 pedestrians were killed and an estimated 70,000 were injured in traffic crashes in the United States. On average, a
DOT HS 811 870 December 2013
 TRAFFIC SAFETY FACTS 2012 Data DOT HS 811 870 December 2013 Alcohol-Impaired Driving Drivers are considered to be alcohol-impaired when their blood alcohol concentration (BAC) is.08 grams per deciliter
Series 2, Number 166 April 2014. 2013 NCHS Urban Rural Classification Scheme for Counties
 Series 2, Number 166 April 2014 2013 NCHS Urban Rural Classification Scheme for Counties Copyright information All material appearing in this report is in the public domain and may be reproduced or copied
Traffic Safety Facts 2008 Data
 Traffic Safety Facts 2008 Data Alcohol-Impaired Driving DOT HS 811 155 In 2008, there were 11,773 fatalities in crashes involving a driver with a BAC of.08 or higher 32 percent of total traffic fatalities
TRAFFIC SAFETY FACTS. Alcohol-Impaired Driving. 2009 Data
 TRAFFIC SAFETY FACTS 2009 Data Alcohol-Impaired Driving DOT HS 811 385 In 2009, there were 10,839 fatalities in crashes involving a driver with a BAC of.08 or higher 32 percent of total traffic fatalities
The Massachusetts Standard Certificate of Death: Data and Public Health Uses
 The Massachusetts Standard Certificate of Death: Data and Public Health Uses Jane Purtill, M.S. Director, Statistics Unit Registry of Vital Records and Statistics Bureau for Health Information, Statistics,
Motor Vehicle Crashes
 Motor Vehicle Crashes Definition: All unintentional motor vehicle-related deaths and hospitalizations on and off public roads, including those involving drivers, passengers, pedestrians, motorcyclists,
Traffic Safety Facts Research Note
 Traffic Safety Facts Research Note DOT HS 810 853 July 2008 Comparison of Crash Fatalities by Sex and Dow Chang Summary The purpose of this research note is to explore the ratio and distribution pattern
TABLE OF CONTENTS AUTHORSHIP. Introduction & Overview. Types of Injury: Motor Vehicle. Recreational. Home. Occupational.
 TABLE OF CONTENTS Introduction & Overview 3 Types of Injury: AUTHORSHIP Made possible by a grant from the Centers for Disease Control to the Arkansas Department of Health, Injury Prevention Program. Injury
Iowa CODES Fact Sheet 1. Traumatic Brain Injuries Caused by Motor Vehicle Crash (MVC) - 2007-2009
 - 2007-2009") Iowa CODES Fact Sheet 1 Traumatic Brain Injuries Caused by Motor Vehicle Crash (MVC) - 2007-2009 Of all types of injury, traumatic brain injuries () are among the most likely to cause death or permanent
Iowa CODES Fact Sheet 1 Traumatic Brain Injuries Caused by Motor Vehicle Crash (MVC) - 2007-2009 Of all types of injury, traumatic brain injuries () are among the most likely to cause death or permanent
AMERICAN COLLEGE OF SURGEONS Committee on Trauma. Injury Prevention. Presented by the Subcommittee on Injury Prevention and Control
 AMERICAN COLLEGE OF SURGEONS Committee on Trauma Injury Prevention Presented by the Subcommittee on Injury Prevention and Control AMERICAN COLLEGE OF SURGEONS Committee on Trauma Injury Prevention Presented
Traffic Safety Facts. Alcohol-Impaired Driving. 2013 Data. Overview. Key Findings
 Traffic Safety Facts 2013 Data December 2014 DOT HS 812 102 Alcohol-Impaired Driving Key Findings There were 10,076 fatalities in 2013 in crashes involving a driver with a BAC of.08 or higher; this was
Early Childhood Indicators Report
 2015 Early Childhood Indicators Report Carol Prentice, Prentice Consulting, 2012 Updated by Alaska Department of Health & Social Services, September 2013 Updated by Prentice Consulting, July 2015 Early
Motor Vehicle Safety Winnable Battle Summary of Key Publications
 Motor Vehicle Safety Winnable Battle Summary of Key Publications Seat Belts & Child Passenger Safety Adult seat belt use: does the presence of children in the household make a difference? This article
June 25, 2004 Meeting Assignment
 Appendix A.1 June 25, 2004 Meeting Assignment Please review the attached indicator worksheet and fill in what you believe to be the five most important and five least important indicators. As you are determining
2012 Passenger Vehicle PollNutrition and Fatalities in Texas
 TRAFFIC SAFETY FACTS 2012 Data DOT HS 812 070 September 2014 Passenger A passenger vehicle is a motor vehicle weighing less than 10,000 pounds; the category includes passenger cars and light trucks (pickup
New Zealand all-age mandatory bicycle helmet law
 New Zealand all-age mandatory bicycle helmet law A public health and safety disaster New Zealand is one of only three countries in the world with national all-age mandatory bicycle helmet laws, the others
Pedal Cycle Injuries to Children Aged 0-17 Years Miami-Dade County 2008-2012
 Pedal Cycle Injuries to Children Aged 0-17 Years Miami-Dade County 2008-2012 Injuries from riding pedal cycles were the eighth leading cause of medically-treated injury to Miami-Dade County children aged
All this information's are from Road Traffic Injury Prevention Training Manual made by World Health Organization
 RISK FACTORS FOR ROAD TRAFFIC INJURIES All this information's are from Road Traffic Injury Prevention Training Manual made by World Health Organization Keywords: crash, identify and analyze risk factors,
Year Fatalities Injuries
 MOTORCYCLES, 2013 MAY 2014 ISSUE 14-C02 HIGHLIGHTS In 2013, the 113 Indiana fatal collisions involving motorcycles resulted in 118 fatalities. The 118 fatalities involved 81 motorcycle operators, 23 moped
An Assessment of the Injury Prevention Program at the Montana Department of Public Health and Human Services
 An Assessment of the Injury Prevention Program at the Montana Department of Public Health and Human Services Assessment conducted July 28-31, 2008 by the State and Territorial Injury Prevention Directors
MISSOURI TRAFFIC SAFETY COMPENDIUM
 2010 MISSOURI TRAFFIC SAFETY COMPENDIUM MISSOURI STATE HIGHWAY PATROL STATISTICAL ANALYSIS CENTER 1510 East Elm Jefferson City, Missouri 65101 (573) 751-9000 CONTENTS PAGE EXECUTIVE SUMMARY INTRODUCTION...1
Monthly Bulletin of Preliminary Traffic Crash Data September 2015
 Monthly Bulletin of Preliminary Traffic Crash Data September Fatality rates for -month period ending September Number of fatalities Rate per, population¹ Rate per, vehicles² Rate per million vehicle kilometres
Motor Vehicle Injuries
 Motor Vehicle Injuries Prenatal Counseling about Seat Belt Use during Pregnancy and Injuries from Car Crashes during Pregnancy Background The CDC has identified prevention of motor vehicle injuries as
SMOKING TOBACCO: SMOKING
 TOBACCO: SMOKING One in 4 adults in Guam is a smoker. Among youth, 1 in 5 smokes. Guam s smoking rate is higher than most US States and Territories; this has remained unchanged since 2001. T O B A C C
The Economic Impact of Motor Vehicle Crashes Involving Pedestrians and Bicyclists
 The Economic Impact of Motor Vehicle Crashes Involving Pedestrians and Bicyclists Florida Department of Health Health Information and Policy Analysis Program Release Date: September 9, 2015 Date Range:
Program Descriptions:
 Program Descriptions: Alcohol Education Alcohol education programs include underage drinking prevention and diverse community outreach. Underage drinking is America s number one youth drug problem, killing
N O R T H C A R O L I N A
 N O R T H C A R O L I N A THE BURDEN OF Motor Vehicle Traffic-Related Injuries North Carolina, 2012 NORTH CAROLINA DIVISION OF PUBLIC HEALTH INJURY AND VIOLENCE PREVENTION BRANCH North Carolina Department
State of Alaska Epidemiologic Profile on Substance Use, Abuse and Dependency
 State of Alaska Epidemiologic Profile on Substance Use, Abuse and Dependency 1 2013 Update State of Alaska Epidemiologic Profile on Substance Use, Abuse and Dependency In Support of the Alaska Strategic
Section C: Examples of Interventions in the Developing World. Adnan Hyder, MD, PhD
 This work is licensed under a Creative Commons Attribution-NonCommercial-ShareAlike License. Your use of this material constitutes acceptance of that license and the conditions of use of materials on this
New Mexico Traffic Crash Annual Report 2011
 New Mexico Traffic Crash Annual Report 2011 New Mexico Department of Transportation Planning and Traffic Safety Division New Mexico Department of Transportation Planning and Traffic Safety Division P.O.
Bicycle Crash Data 2012
 Bicycle Crash Data 2012 Local Law 13 of 2011 requires the NYC Department of Transportation (NYCDOT) to report on the total number of bicycle crashes, injuries, and fatalities that are reported to city
2007 to 2011. Motor Vehicle Fatalities in British Columbia: Statistics
 Motor Vehicle Fatalities in British Columbia: Statistics 27 to 211 October 212 RAD 212-16 Web www.pssg.gov.bc.ca/osmv/ Twitter http://twitter.com/roadsafetybc You Tube www.youtube.com/roadsafetybcgov Contents
Injuries. Manitoba. A 10-Year Review. January 2004
 Injuries in Manitoba A 1-Year Review January 24 Executive Summary From 1992 to 21, 5,72 Manitobans died as a result of injuries. As well, there were 12,611 hospitalizations for injuries in the province.
CDC Childhood Injury Report:
 CDC Childhood Injury Report: Patterns of Unintentional Injuries among 019 Year Olds in the United States, 20002006 US DEPARTMENT OF HEALTH AND HUMAN SERVICES CENTERS FOR DISEASE CONTROL AND PREVENTION
Community Motor Vehicle Collision Priority Setting Toolkit Part One
 Community Motor Vehicle Collision Priority Setting Toolkit Part One Table of Contents Introduction! 3 How to use this resource! 3 The Issue of Injury! 4 General information! 4 Motor Vehicle Collisions!
State Health Assessment Health Priority Status Report Update. June 29, 2015 Presented by UIC SPH and IDPH
 State Health Assessment Health Priority Status Report Update June 29, 2015 Presented by UIC SPH and IDPH 1 Health Priority Presentation Objectives 1. Explain context of how this discussion fits into our
Maternal and Child Health Indicators: Three State Profile
 Indicators: Three State Profile Elizabeth Oftedahl MPH Symposium Pyle Center, August 11, 2006 Preceptor: Kristin Hill, MSHA Mentor: Alexandra Adams, MD, PhD Great Lakes Inter-Tribal Council / Great Lakes
Road Safety Authority Provisional Review of Road Crashes 2013
 A review of 2013 fatal collision statistics December 31 st 2013 The following report summarises the main trends that have emerged in 2013. This has been prepared by the Road Safety Authority following
Child Cycling Injury Prevention
 Child Cycling Injury Prevention Simone Randle Injury Prevention Advisor SimoneR@adhb.govt.nz Cycling fatalities, 2003-07 All child cyclist deaths: 12 deaths: 11 boys, 1 girl 7 deaths amongst boys 10-14
Montana Traffic Safety Problem Identification FFY 2011
 Montana Traffic Safety Problem Identification FFY 2011 2009 Data State Highway Traffic Safety Office Montana Department of Transportation 2701 Prospect Avenue Helena, Montana 59620-1001 http://www.mdt.mt.gov/safety/safetyprg.shtml
CREATING CONDITIONS IN ARKANSAS WHERE INJURY IS LESS LIKELY TO HAPPEN.
 CREATING CONDITIONS IN ARKANSAS WHERE INJURY IS LESS LIKELY TO HAPPEN. First Edition: September, 2012 Current Edition: June, 2014 Arkansas Department of Health Injury and Violence Prevention Five Year
NORTH EAST Regional Road Safety Resource
 NORTH EAST Regional Road Safety Resource Project Report: 1. Regional Overview of Pedal Cycle Accidents 2005 2007. Produced May 2008. Natalie Goodman Project is supported by the Department of Transport.
TEENAGE PREGNANCY. Arizona,2000-2010. Public Health Services Bureau of Public Health Statistics Health Status and Vital Statistics Section
 TEENAGE PREGNANCY Arizona,2000-2010 Public Health Services Bureau of Public Health Statistics Health Status and Vital Statistics Section ~ Leadership for a Healthy Arizona ~ Janice K. Brewer, Governor