A Study on Performance Monitoring Counters in x86-architecture
|
|
|
- Jonah Price
- 10 years ago
- Views:
Transcription
1 A Study on Performance Monitoring Counters in x86-architecture Shibdas Bandyopadhyay Roll No. MTC0414 M.Tech CS 1 st Year Indian Statistical Institute 1

2 Table of Contents 1. Introduction Hardware Set-up for Performance monitoring PerfEvtSel0 and PerfEvtSel1 MSRs PerfCtr0 and PerfCtr1 MSRs Starting and Stopping the Performance-Monitoring Counters Monitoring Counter Overflow P6 Family Processor Performance-Monitoring Events Overview of an existing implementation for accessing performance monitoring counters Linux Kernel Patch Global-mode PMC Driver A proof-of-concept implementation PMC Driver User Space Program Some Useful Performance Metrics Conclusion References

3 1. Introduction Performance Monitoring counters is a valuable tool for measuring performance of a program which can be analyzed to identify the bottlenecks in the program. These counters are present in the most modern processors including Intel Pentium, Pentium Pro, P6, Pentium 4, AMD, Cyrix etc. These counters are hardware registers attached with the processor which measures various programmable events occurring in the processor. They do not require any additional overhead and supports a wide range of events. This document describes these counters for x86 systems, specifically for Intel Pentium Processor as they are most widely used in current personal computers. The whole document is divided into four sections:- 1. First Sections describes various hardware components associated with the performance counters in Pentium processors and the events that they can measure. 2. Second Section describes an existing implementation which provides an API for accessing various performance counters present in x86-architecture. 3. Third Section describes a proof-of-concept implementation which measure various performance counters when a particular process is run. 4. Fourth Section provides how we can derive some useful performance metrics from the data we get by measuring various events. 3

4 2. Hardware Set-up for Performance monitoring We will describe the performance counters and related hardware components present in the Pentium Architecture. In particular, performance monitoring in P6 family of the processors (including Pentium, Pentium Pro, and Pentium II & III) will be described. Pentium 4 and Xeon family of processors employs more advanced technique for measuring events although the basic methodology is the same. The P6 family processors provide two 40-bit performance counters, allowing two types of events to be monitored simultaneously. These counters can either count events or measure duration. When counting events, a counter is incremented each time a specified event takes place or a specified number of events take place. When measuring duration, a counter counts the number of processor clocks that occur while a specified condition is true. The counters can count events or measure durations that occur at any privilege level. The performance-monitoring counters are supported by four MSRs( Model Specific Registers, These registers are specific to a particular Model of the processor and they are not guaranteed to present in the future processors, e.g. registers described here are not present in Pentium 4 / Xeon Processors) : the performance event select MSRs (PerfEvtSel0 and PerfEvtSel1) and the performance counter MSRs (PerfCtr0 and PerfCtr1). These registers can be read from and written to using the RDMSR and WRMSR instructions, respectively. They can be accessed using these instructions only when operating at privilege level 0. The PerfCtr0 and PerfCtr1 MSRs can be read from any privilege level using the RDPMC (read performance-monitoring counters) instruction. 2.1 PerfEvtSel0 and PerfEvtSel1 MSRs The PerfEvtSel0 and PerfEvtSel1 MSRs control the operation of the performancemonitoring counters, with one register used to set up each counter. They specify the events to be counted, how they should be counted, and the privilege levels at which counting should take place. Following figure shows the flags and fields in these MSRs. Event select field (bits 0 through 7) Selects the event to be monitored Unit mask (UMASK) field (bits 8 through 15) Further qualifies the event selected in the event select field. For example, for some cache events, the mask is used as a MESI-protocol qualifier of cache states. 4

5 USR (user mode) flag (bit 16) Specifies that events are counted only when the processor is operating at privilege levels 1, 2 or 3. This flag can be used in conjunction with the OS flag. OS (operating system mode) flag (bit 17) Specifies that events are counted only when the processor is operating at privilege level 0. This flag can be used in conjunction with the USR flag. E (edge detect) flag (bit 18) Enables (when set) edge detection of events. The processor counts the number of deserted to asserted transitions of any condition that can be expressed by the other fields. The mechanism is limited in that it does not permit back-to-back assertions to be distinguished. This mechanism allows software to measure not only the fraction of time spent in a particular state, but also the average length of time spent in such a state (for example, the time spent waiting for an interrupt to be serviced). PC (pin control) flag (bit 19) When set, the processor toggles the PMi pins and increments the counter when performance-monitoring events occur; when clear, the processor toggles the PMi pins when the counter overflows. The toggling of a pin is defined as assertion of the pin for a single bus clock followed by deassertion. INT (APIC interrupt enable) flag (bit 20) When set, the processor generates an exception through its local APIC on counter overflow. 5

6 EN (Enable Counters) Flag (bit 22) This flag is only present in the PerfEvtSel0 MSR. When set, performance counting is enabled in both performance-monitoring counters; when clear, both counters are disabled. INV (invert) flag (bit 23) Inverts the result of the counter-mask comparison when set, so that both greater than and less than comparisons can be made. Counter mask (CMASK) field (bits 24 through 31) When nonzero, the processor compares this mask to the number of events counted during a single cycle. If the event count is greater than or equal to this mask, the counter is incremented by one. Otherwise the counter is not incremented. This mask can be used to count events only if multiple occurrences happen per clock (for example, two or more instructions retired per clock). If the counter-mask field is 0, then the counter is incremented each cycle by the number of events that occurred that cycle. 2.2 PerfCtr0 and PerfCtr1 MSRs The performance-counter MSRs (PerfCtr0 and PerfCtr1) contain the event or duration counts for the selected events being counted. The RDPMC instruction can be used by programs or procedures running at any privilege level and in virtual-8086 mode to read these counters. The PCE flag in control register CR4 (bit 8) allows the use of this instruction to be restricted to only programs and procedures running at privilege level 0. The RDPMC instruction is not serializing or ordered with other instructions. Thus, it does not necessarily wait until all previous instructions have been executed before reading the counter. Similarly, subsequent instructions may begin execution before the RDPMC instruction operation is performed. Only the operating system, executing at privilege level 0, can directly manipulate the performance counters, using the RDMSR and WRMSR instructions. A secure operating system would clear the PCE flag during system initialization to disable direct user access to the performance-monitoring counters, but provide a user-accessible programming interface that emulates the RDPMC instruction. The WRMSR instruction cannot arbitrarily write to the performance-monitoring counter MSRs (PerfCtr0 and PerfCtr1). Instead, the lower-order 32 bits of each MSR may be written with any value and the high-order 8 bits are sign-extended according to the value of bit 31. This operation allows writing both positive and negative values to the performance counters. 6
 field (bits 24 through 31) When nonzero, the processor compares this mask to the number of events counted during a single cycle.")
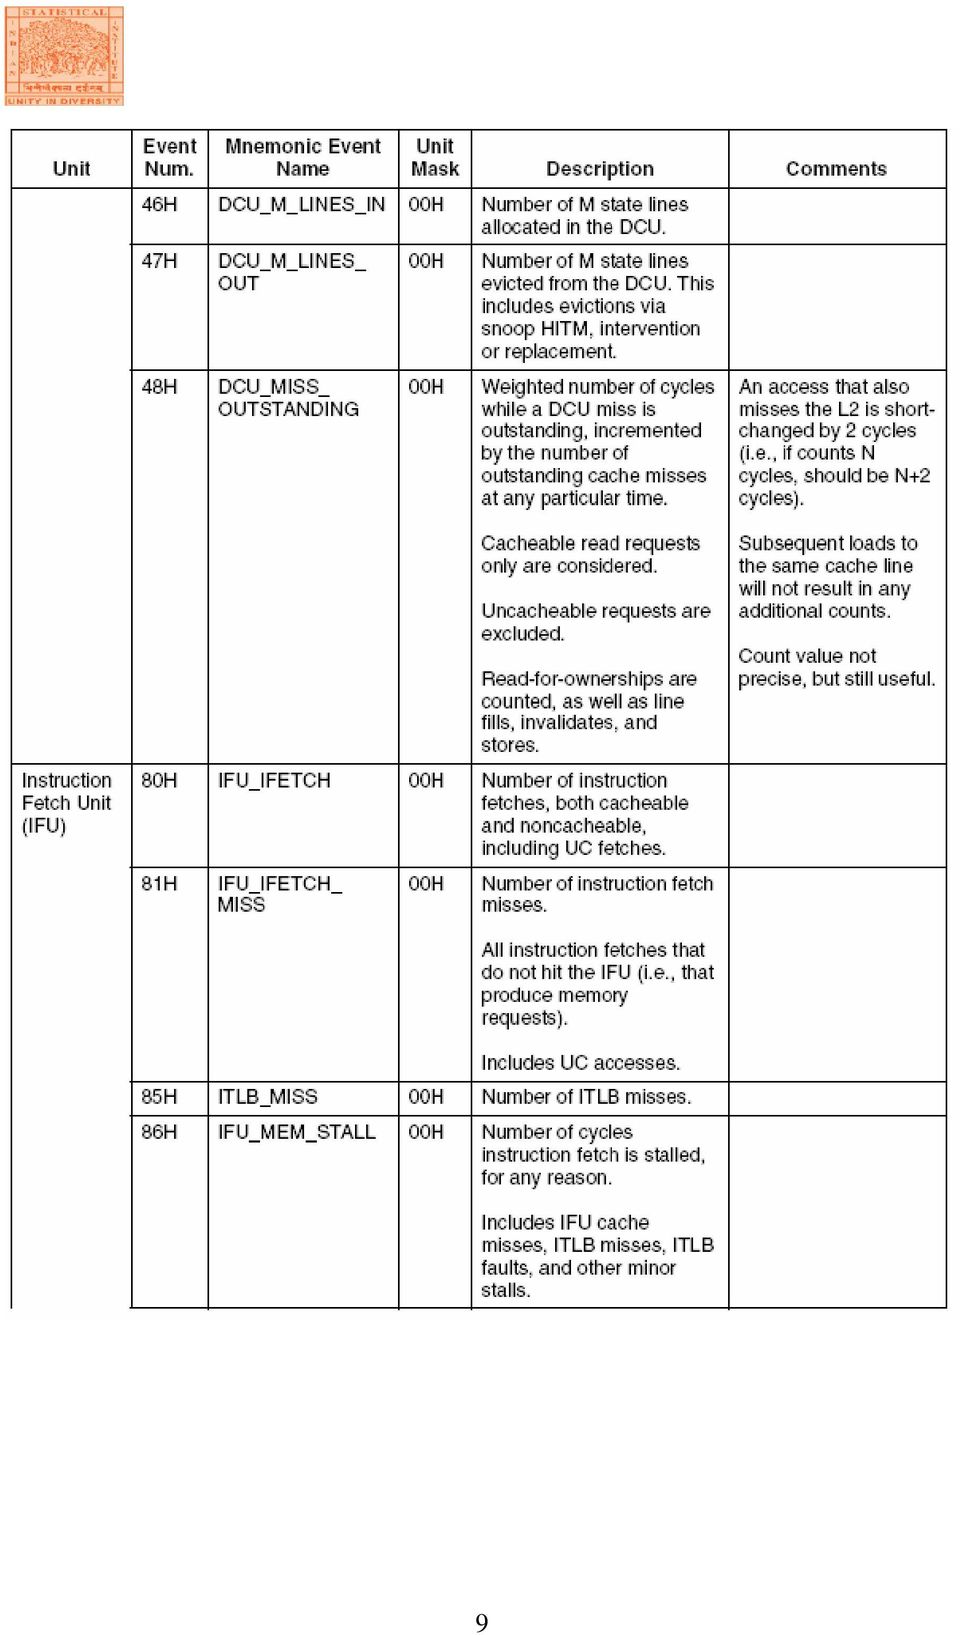
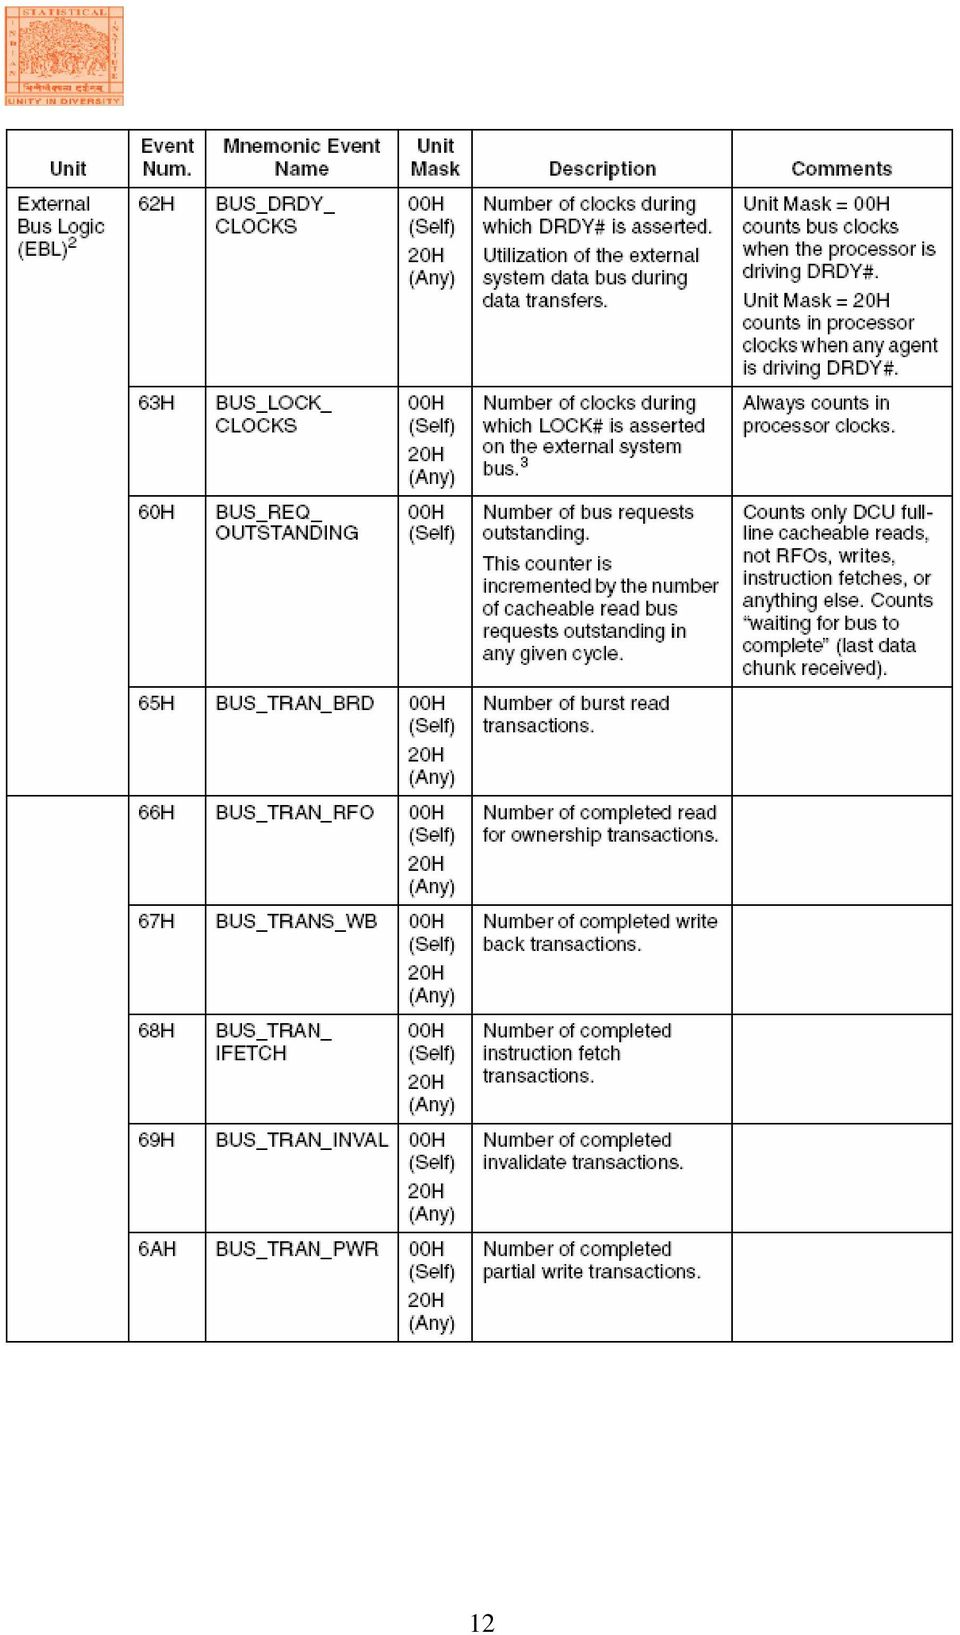
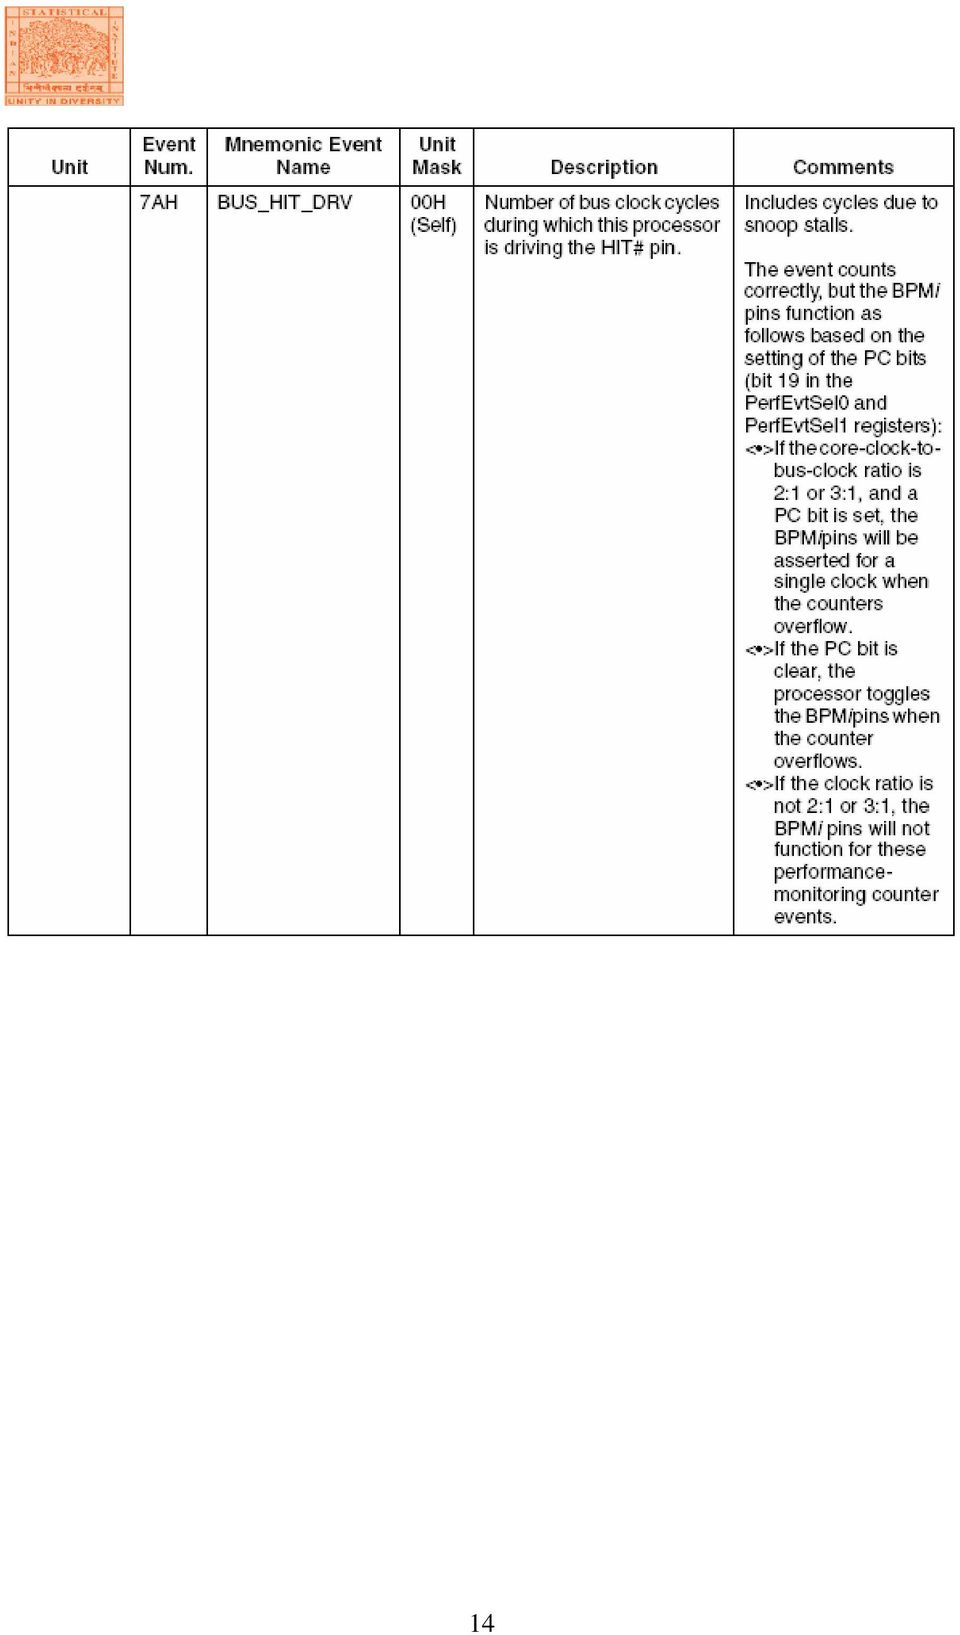
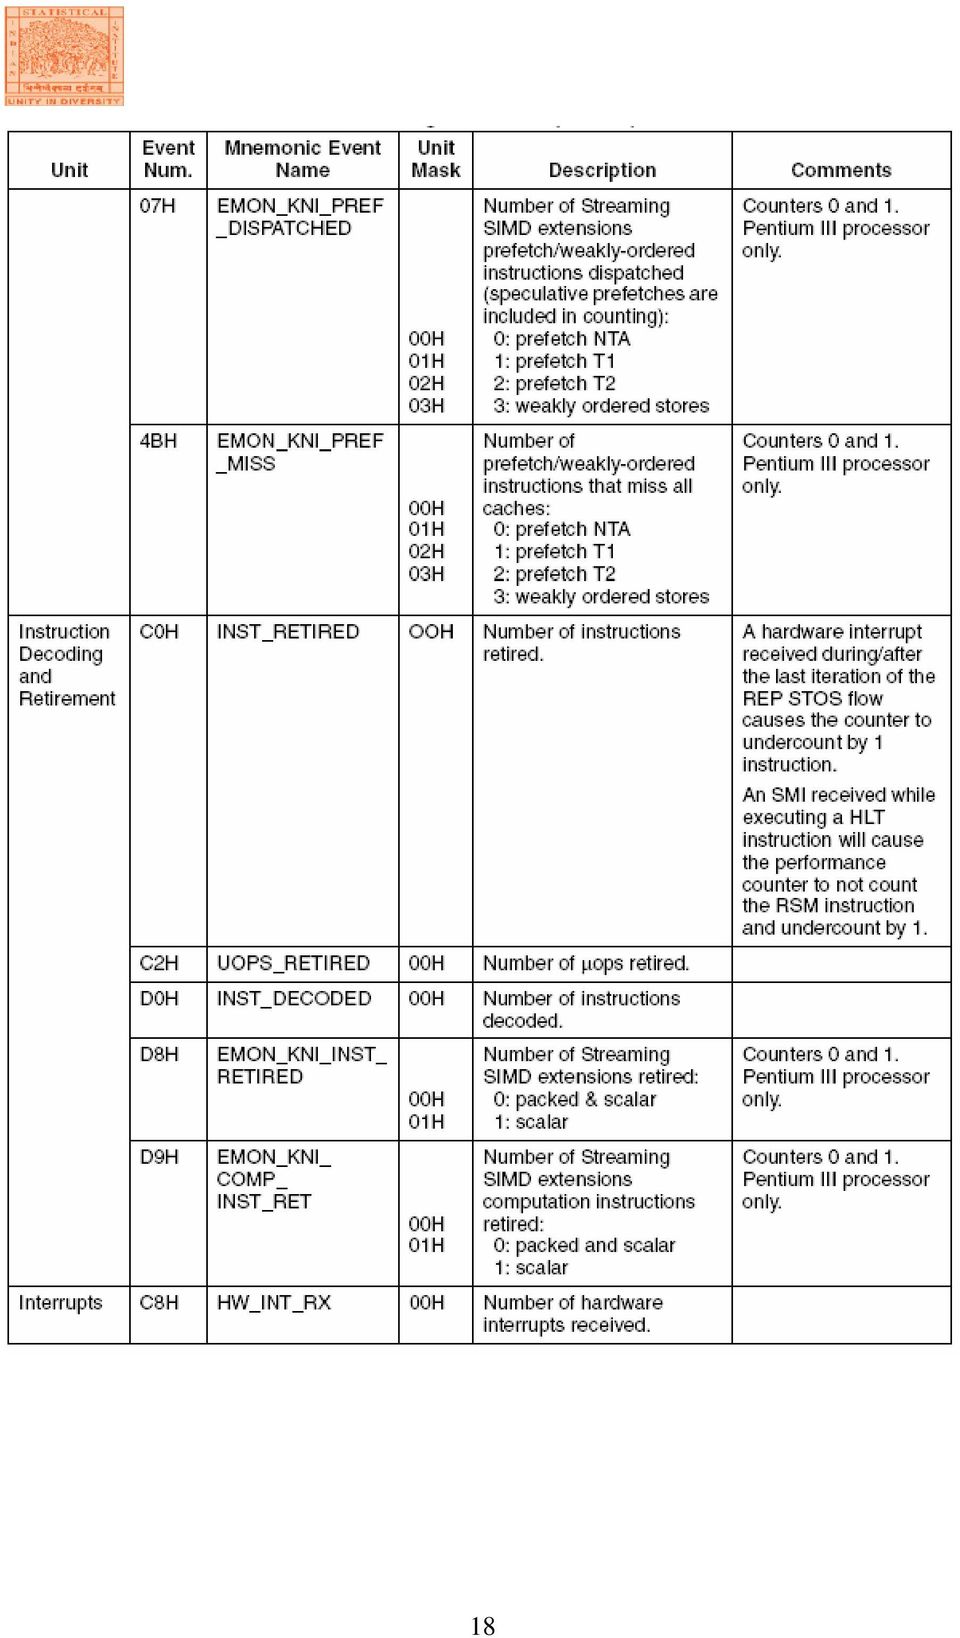
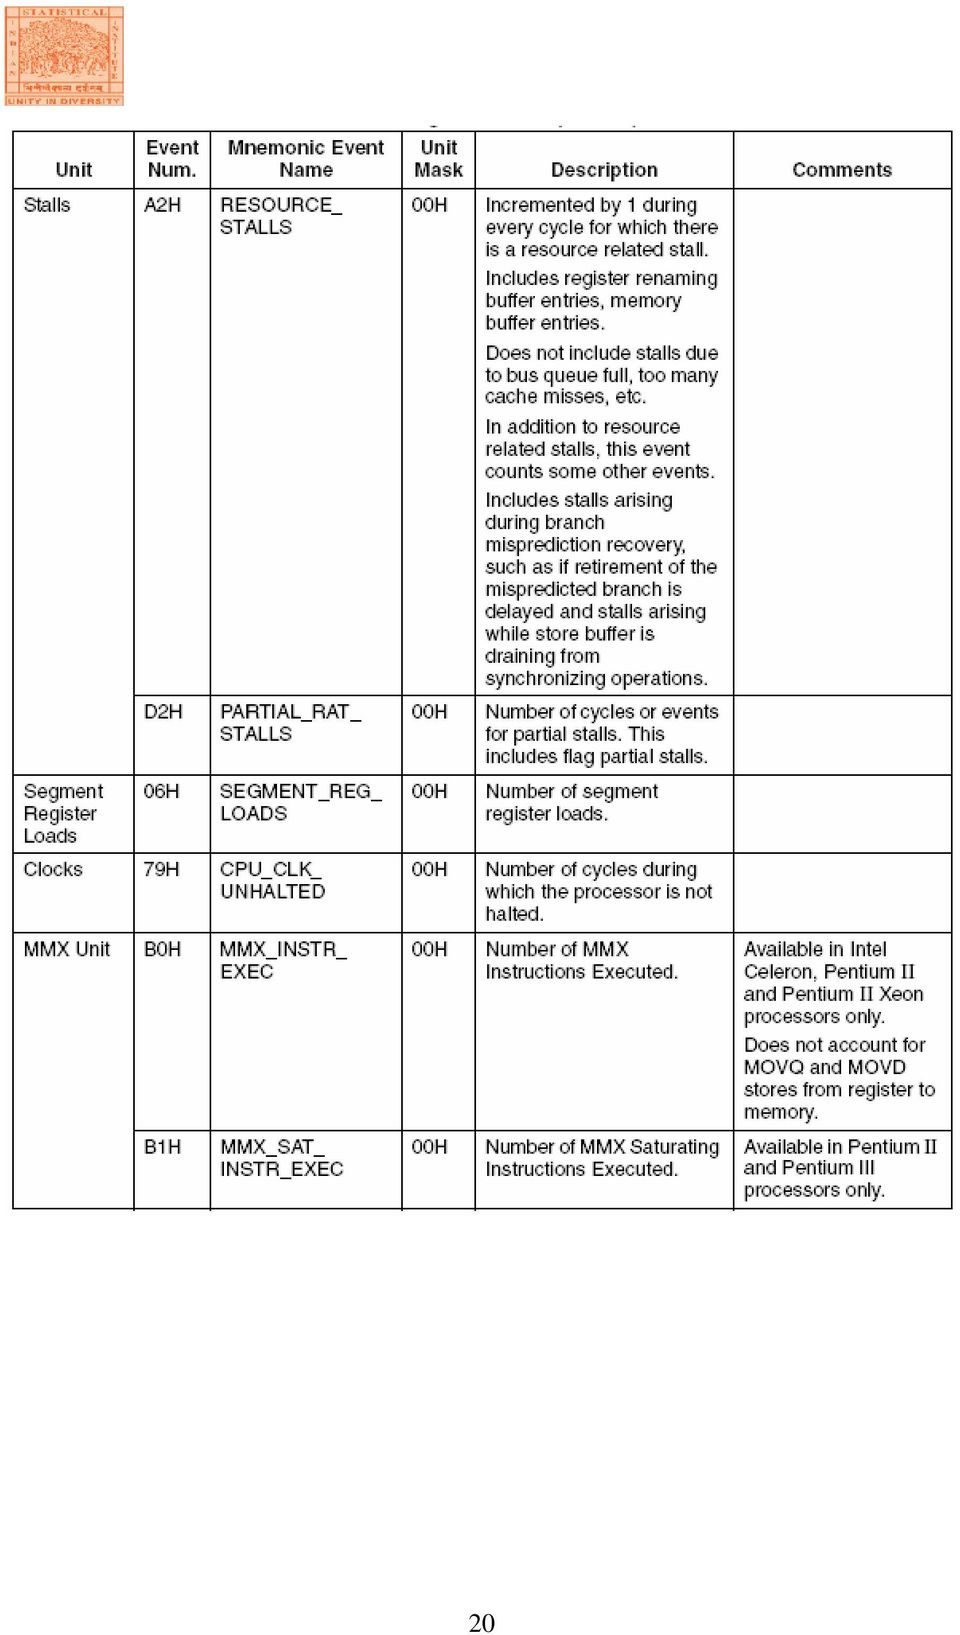
7 2.3 Starting and Stopping the Performance-Monitoring Counters The performance-monitoring counters are started by writing valid setup information in the PerfEvtSel0 and/or PerfEvtSel1 MSRs and setting the enable counters flag in the PerfEvtSel0 MSR. If the setup is valid, the counters begin counting following the execution of a WRMSR instruction that sets the enable counter flag. The counters can be stopped by clearing the enable counters flag or by clearing all the bits in the PerfEvtSel0 and PerfEvtSel1 MSRs. Counter 1 alone can be stopped by clearing the PerfEvtSel1 MSR. 2.4 Monitoring Counter Overflow The P6 family processors provide the option of generating a local APIC interrupt when a performance-monitoring counter overflows. This mechanism is enabled by setting the interrupt enable flag in either the PerfEvtSel0 or the PerfEvtSel1 MSR. The primary use of this option is for statistical performance sampling. To use this option, the operating system should do the following things on the processor for which performance events are required to be monitored: Provide an interrupt vector for handling the counter-overflow interrupt. Initialize the APIC PERF local vector entry to enable handling of performancemonitor counter overflow events. Provide an entry in the IDT that point to a stub exception handler that returns without executing any instructions. Provide an event monitor driver that provides the actual interrupt handler and modifies the reserved IDT entry to point to its interrupt routine. When interrupted by a counter overflow, the interrupt handler needs to perform the following actions: Save the instruction pointer (EIP register), code-segment selector, TSS segment selector, counter values and other relevant information at the time of the interrupt. Reset the counter to its initial setting and return from the interrupt. An event monitor application utility or another application program can read the information collected for analysis of the performance of the profiled application. 2.5 P6 Family Processor Performance-Monitoring Events The following table lists the events that can be counted with the performance-monitoring counters and read with the RDPMC instruction for the P6 family processors. The unit 7

8 column gives the micro architecture or bus unit that produces the event; the event number column gives the hexadecimal number identifying the event; the mnemonic event name column gives the name of the event; the unit mask column gives the unit mask required (if any); the description column describes the event; and the comments column gives additional information about the event. All of these performance events are model specific for the P6 family processors and are not available in this form in the Pentium 4 processors or the Pentium processors. Some events (such as those added in later generations of the P6 family processors) are only available in specific processors in the P6 family. All performance event encodings not listed in table are reserved and their use will result in undefined counter results. 8
 are only available in specific processors in the P6 family.")
9 9
10 10

11 11

12 12
13 13

14 14
15 15

16 16

17 17

18 18
19 19

20 20
21 21
22 3. Overview of an existing implementation for accessing performance monitoring counters There are many high level GUI tools as well as low level API s for accessing performance counters in Intel IA-32 architecture. Intel s Vtune is a GUI tool which performs various analyses on the data collected from performance counters. lperfex is a command line tool for Linux which provides counter values when a particular program runs. PAPI is a set of API s for accessing performance counters from applications. We are going to analyze the Linux x86 Performance-Monitoring Counters Driver and Kernel patch developed by Mikael Petterson. Most of the tools on Linux depend on this driver and as it is open-source software, it made us possible to view how the things are done. This package is named perfctr (we will refer to this name afterwards) and its purpose, as described in the readme file of this package:- This package adds support to the Linux kernel for using the Performance-Monitoring Counters (PMCs) found in many modern x86-class processors. Supported processors are: - All Intel Pentium processors, i.e. Pentium, Pentium MMX, Pentium Pro, Pentium II, Pentium III, and Pentium 4, including Celeron and Xeon versions. - The AMD K7 and K8 processor families. - Cyrix 6x86MX, MII, and III. - VIA C3 (Cyrix III). - Centaur WinChip C6/2/3. Limited support is available for generic x86 processors with a Time-Stamp Counter but no PMCs, such as the AMD K6 family. For these processors, only TSC (Time Stamp Counter)-based cycle-count measurements are possible. However, all high-level facilities implemented by the driver are still available. Various features of this package as described in the readme file: Each Linux process has its own set of "virtual" PMCs. That is, to a process the PMCs appear to be private and unrelated to the activities of other processes in the system. The virtual PMCs have 64-bit precision, even though current processors only implement 40 or 48-bit PMCs. Each process also has a virtual Time-Stamp Counter (TSC). On most machines, the virtual PMCs can be sampled entirely in user-space without incurring the overhead of a system call. A process accesses its virtual PMCs by opening /proc/self/perfctr and issuing system calls on the resulting file descriptor. A user-space library is included which provides a more high-level interface. The driver also supports global-mode or system-wide PMCs. In this mode, each PMC on each processor can be controlled and read. The PMCs and TSC on active processors are sampled periodically and the accumulated sums have 64-bit precision. Global-mode 22
23 PMCs are accessed via the /dev/perfctr device file; the user-space library provides a more high-level interface. Support for performance-counter overflow interrupts is provided for Intel P4 and P6, and AMD K7 and K8 processors. The perfctr package consists of two parts:- A Patch to the Linux Kernel A driver for providing access to PMC s. Let us analyze two parts in details:- 3.1 Linux Kernel Patch We consider the patch to Linux Kernel Version Modifications in the kernel code are required to support per-process PMC. PMC s are general purpose registers in the processor and are not associated with the code currently executed by the processor. Modifications are needed in the data structures & context switching routines of the processes to hold per-process values of these counters. The various modifications and their cause are explained:- Changes are made to the credits file for including the details of this patch. CONFIG_PERFCTR option is added to the Kernel Configuration file to provide an option for including the support of PMC s in the kernel. There are various sub-options under this option:- a) CONFIG_PERFCTR_DEBUG:- This option enables additional internal consistency checking in the perfctr driver. The scope of these checks is unspecified and may vary between different versions of the driver. b) CONFIG_PERFCTR_INIT_TESTS:- This option makes the driver run additional hardware tests during initialisation. This is not necessary for normal operation, but it can be useful during driver development. c) CONFIG_PERFCTR_VIRTUAL:- The processor's performancemonitoring counters are special-purpose global registers. This option adds support for virtual per-process performance-monitoring counters which only run when the process to which they belong is executing. This improves the accuracy of performance measurements by reducing "noise" from other processes. d) CONFIG_PERFCTR_GLOBAL:- This option adds driver support for global-mode (system-wide) performance-monitoring counters. In this mode, the driver allows each performance-monitoring counter on each 23
24 processor to be controlled and read. The driver provides a sampling timer to maintain 64-bit accumulated event counts. Changes are made to the ioctl-numbers.txt file to include the ioctl number associated with this driver. Changes the made to the Makefile and Config files of the kernel to add commands for compiling the driver. Now we will discuss the changes made to the actual kernel source files. Here linux perfctr refers to the top level directory containing the kernel source. As we know that APIC (Advanced Programmable Interrupt Controller) generates an interrupt when a counter overflow occurs. Intel provides three types of interrupt descriptors: Task, Interrupt, and Trap Gate Descriptors. Task Gate Descriptors are irrelevant to Linux, but its Interrupt Descriptor Table contains several Interrupt and Trap Gate Descriptors. Linux classifies them as follows, using a slightly different breakdown and terminology from Intel: Interrupt gate An Intel interrupt gate that cannot be accessed by a User Mode process (the gate's DPL field is equal to 0). All Linux interrupt handlers are activated by means of interrupt gates, and all are restricted to Kernel Mode. System gate An Intel trap gate that can be accessed by a User Mode process (the gate's DPL field is equal to 3). The four Linux exception handlers associated with the vectors 3, 4, 5, and 128 are activated by means of system gates, so the four assembly language instructions int3, into, bound, and int $0x80 can be issued in User Mode. Trap gate An Intel trap gate that cannot be accessed by a User Mode process (the gate's DPL field is equal to 0). Most Linux exception handlers are activated by means of trap gates. The following architecture-dependent functions are used to insert gates in the IDT (Interrupt Descriptor Table): set_intr_gate (n, addr) Inserts an interrupt gate in the n th IDT entry. The Segment Selector inside the gate is set to the kernel code's Segment Selector. The Offset field is set to addr, which is the address of the interrupt handler. The DPL (Descriptor Privilege Level) field is set to 0. 24
25 set_system_gate(n,addr) Inserts a trap gate in the n th IDT entry. The Segment Selector inside the gate is set to the kernel code's Segment Selector. The Offset field is set to addr, which is the address of the exception handler. The DPL field is set to 3. set_trap_gate(n,addr) Similar to the previous function, except the DPL field is set to 0. As an interrupt gate for the Local APIC has to be set, set_intr_gate function is used. The modification is done in linux perfctr/arch/i386/kernel/i8259.c #include <asm/perfctr.h> #if defined(config_x86_local_apic) && defined(config_kperfctr) set_intr_gate(local_perfctr_vector, perfctr_interrupt); #endif This patch includes two header files in include/linux and include/asm-i386 both are named perfctr.h which contains various data structure and assembly instructions needed for the perfctr driver. The function perfctr_interrupt is implemented in include/asm-i386/perfctr.h which does the necessary acknowledgement job and runs an interrupt handler. Changes are made to the IRQ(Interrupt Requests) handling functions in linux perfctr/arch/i386/kernel/irq.c to describe irqs associated with PMC s as follows:- #if defined(config_x86_local_apic) && defined(config_kperfctr) p += sprintf(p, "PMC: "); for (j = 0; j < smp_num_cpus; j++) p += sprintf(p, "%10u ", apic_lvtpc_irqs[cpu_logical_map(j)]); p += sprintf(p, "\n"); #endif LOCAL_PERFCTR_VECTOR and non-maskable interrupts are defined in kernel header files linux perfctr/include/asm-i386/hw_irq.h and linux perfctr/include/asm-i386/apic.h as:- /* In unpatched Linux kernel FIRST APIC VECTOR which is available to the drivers starts from 0xed which is now occupied by LOCAL PERFCTR VECTOR and so it is modified to start from 0xee. */ #define LOCAL_PERFCTR_VECTOR #define FIRST_SYSTEM_VECTOR 0xee 0xee 25
26 extern struct pm_dev *nmi_pmdev; extern unsigned int nmi_perfctr_msr; Changes the made to the process specific files to provide support for per-process PMC s. Let us look at how the process descriptor is stored by the Linux Kernel. It will make us understand how the changes help to implement this feature. To manage processes, the kernel must have a clear picture of what each process is doing. It must know, for instance, the process's priority, whether it is running on a CPU or blocked on an event, what address space has been assigned to it, which files it is allowed to address, and so on. This is the role of the process descriptor a task_struct type structure whose fields contain all the information related to a single process. As the repository of so much information, the process descriptor is rather complex. In addition to a large number of fields containing process attributes, the process descriptor contains several pointers to other data structures that, in turn, contain pointers to other structures. Figure describes the Linux process schematically. 26
27 At every process switch, the hardware context of the process being replaced must be saved somewhere. Thus, each process descriptor includes a field called thread of type thread_struct, in which the kernel saves the hardware context whenever the process is being switched out. PMC s values are stored in the thread_struct structure which is defined in linux perfctr/include/asm-i386/processor.h as follows:- struct vperfctr; /* opaque; no need to depend on <linux/perfctr.h> */ struct thread_struct { unsigned long esp0; unsigned long eip; unsigned long esp; unsigned long fs; unsigned long gs; /* Hardware debugging registers */ unsigned long debugreg[8]; /* %%db0-7 debug registers */ /* fault info */ unsigned long cr2, trap_no, error_code; /* floating point info */ union i387_union i387; /* virtual 86 mode info */ struct vm86_struct * vm86_info; unsigned long screen_bitmap; unsigned long v86flags, v86mask, saved_esp0; /* IO permissions */ int ioperm; unsigned long io_bitmap[io_bitmap_size+1]; /* performance counters */ struct vperfctr *perfctr; ; /* Also for initializing this structure values are filled with zeroes */ #define INIT_THREAD { \ 0, \ 0, 0, 0, 0, \ { [0... 7] = 0, /* debugging registers */ \ 0, 0, 0, \ { { 0,,, /* 387 state */ \ 0,0,0,0,0, \ 0,{~0, /* io permissions */ \ NULL, /* performance counters */ \ 27
28 The patch modifies the process handling routines to include calls to the virtual per-process counter driver routines which do the job of saving and restoring various counter values. This patch adds the following calls to the kernel process handling routines in linux perfctr/arch/i386/kernel/process.c. void exit_thread(void) { perfctr_exit_thread(¤t->thread); /* This the higher level context switching function here we store the various PMC counts of the current process and also resume with the next process */ void switch_to(struct task_struct *prev_p, struct task_struct *next_p) { perfctr_suspend_thread(prev); perfctr_resume_thread(next); void copy_segments(struct task_struct *p, struct mm_struct *new_mm) { perfctr_copy_thread(&p->thread); These pertctr function calls are defined in include/linux/perfctr.h which calls the corresponding vperfctr functions defined in driver/virtual.c. From driver/virtual.c the calls go to x86.c where these are defined as follows:- (These basically stores/restores the counter values to/from the perfctr data structures) void perfctr_cpu_suspend(struct perfctr_cpu_state *state) { unsigned int i, cstatus, nractrs; struct perfctr_low_ctrs now; #if PERFCTR_INTERRUPT_SUPPORT if( perfctr_cstatus_has_ictrs(state->cstatus) ) perfctr_cpu_isuspend(state); #endif perfctr_cpu_read_counters(state, &now); cstatus = state->cstatus; 28
29 if( perfctr_cstatus_has_tsc(cstatus) ) state->sum.tsc += now.tsc - state->start.tsc; nractrs = perfctr_cstatus_nractrs(cstatus); for(i = 0; i < nractrs; ++i) state->sum.pmc[i] += now.pmc[i] - state->start.pmc[i]; /* perfctr_cpu_disable_rdpmc(); */ /* not for x86 */ void perfctr_cpu_resume(struct perfctr_cpu_state *state) { #if PERFCTR_INTERRUPT_SUPPORT if( perfctr_cstatus_has_ictrs(state->cstatus) ) perfctr_cpu_iresume(state); #endif /* perfctr_cpu_enable_rdpmc(); */ /* not for x86 or global-mode */ perfctr_cpu_write_control(state); perfctr_cpu_read_counters(state, &state->start); void perfctr_cpu_sample(struct perfctr_cpu_state *state) { unsigned int i, cstatus, nractrs; struct perfctr_low_ctrs now; perfctr_cpu_read_counters(state, &now); cstatus = state->cstatus; if( perfctr_cstatus_has_tsc(cstatus) ) { state->sum.tsc += now.tsc - state->start.tsc; state->start.tsc = now.tsc; nractrs = perfctr_cstatus_nractrs(cstatus); for(i = 0; i < nractrs; ++i) { state->sum.pmc[i] += now.pmc[i] - state->start.pmc[i]; state->start.pmc[i] = now.pmc[i]; By this way, perfctr driver maintains a virtual count for all the processes running in the system. At any point of time from state->sum.pmc[i], we get the accumulated values for every process. Last thing that the patch does is to provide an interface to the /proc file system so that a process might use /proc/self/perfctr to read the values of various performance counters. Changes are made to linux perfctr/fs/proc/base.c to reflect these things. As the PMC values are associated with the process we insert 29
30 this into the directory of the process in the /proc file systems by modifying the following enumerations:- #include <linux/perfctr.h> ; enum pid_directory_inos { PROC_PID_INO = 2, PROC_PID_STATUS, PROC_PID_MEM, PROC_PID_CWD, PROC_PID_ROOT, PROC_PID_EXE, PROC_PID_FD, PROC_PID_ENVIRON, PROC_PID_CMDLINE, PROC_PID_STAT, PROC_PID_STATM, PROC_PID_MAPS, PROC_PID_CPU, PROC_PID_PERFCTR, /* for PMC */ PROC_PID_MOUNTS, PROC_PID_FD_DIR = 0x8000, /* 0x8000-0xffff */ /* and in their entries in inodes */ #define E(type,name,mode) {(type),sizeof(name)-1,(name),(mode) static struct pid_entry base_stuff[] = { E(PROC_PID_FD, "fd", S_IFDIR S_IRUSR S_IXUSR), E(PROC_PID_ENVIRON, "environ", S_IFREG S_IRUSR), E(PROC_PID_STATUS, "status", S_IFREG S_IRUGO), E(PROC_PID_CMDLINE, "cmdline", S_IFREG S_IRUGO), E(PROC_PID_STAT, "stat", S_IFREG S_IRUGO), E(PROC_PID_STATM, "statm", S_IFREG S_IRUGO), #ifdef CONFIG_SMP E(PROC_PID_CPU, "cpu", S_IFREG S_IRUGO), #endif E(PROC_PID_MAPS, "maps", S_IFREG S_IRUGO), E(PROC_PID_MEM, "mem", S_IFREG S_IRUSR S_IWUSR), E(PROC_PID_CWD, "cwd", S_IFLNK S_IRWXUGO), E(PROC_PID_ROOT, "root", S_IFLNK S_IRWXUGO), E(PROC_PID_EXE, "exe", S_IFLNK S_IRWXUGO), #ifdef CONFIG_PERFCTR_VIRTUAL E(PROC_PID_PERFCTR, "perfctr", PERFCTR_PROC_PID_MODE), #endif E(PROC_PID_MOUNTS, "mounts", S_IFREG S_IRUGO), 30
31 {0,0,NULL,0 ; /* Modifies the proc_base_lookup to include the reference to the various file operations */ static struct dentry *proc_base_lookup(struct inode *dir, struct dentry *dentry) { #ifdef CONFIG_PERFCTR_VIRTUAL case PROC_PID_PERFCTR: perfctr_set_proc_pid_ops(inode); break; #endif These file operations are mapped into functions in driver/perfctr/virtual.c as follows:- static struct file_operations vperfctr_file_ops = {.owner = THIS_MODULE,.mmap = vperfctr_mmap,.release = vperfctr_release,.ioctl = vperfctr_ioctl,.open = vperfctr_open, ; In vperfctr_open function puts the perfctr structure in the user supplied file structure so that it can access the counters from there. There is some checking whether the process itself is calling the function or its child is calling and allocation of structure is done depending on its creation. static int vperfctr_open(struct inode *inode, struct file *filp) { struct task_struct *tsk; struct vperfctr *perfctr; int err; /* The link from /proc/<pid>/perfctr exists even if the hardware detection failed. Disallow open in this case. */ if(!vperfctr_init_done ) return -ENODEV; /* * Allocating a new vperfctr object for the O_CREAT case is * done before the self-or-remote-control check. 31
32 * This is because get_empty_vperfctr() may sleep, and in the * remote control case, the child may have been killed while we * slept. Instead of dealing with the ugly revalidation issues, * we allocate ahead of time, and remember to deallocate in case of errors. * If we only supported 2.4+ kernels, this would be much less of * an issue, since the task pointer itself remains valid across a sleep thanks to * get_task_struct(). perfctr = NULL; if( filp->f_flags & O_CREAT ) { perfctr = get_empty_vperfctr(); /* may sleep */ if( IS_ERR(perfctr) ) return PTR_ERR(perfctr); tsk = current; if(!proc_pid_inode_denotes_task(inode, tsk) ) { /* remote? */ tsk = get_task_by_proc_pid_inode(inode); err = -ESRCH; if(!tsk ) goto err_perfctr; err = ptrace_check_attach(tsk, 0); if( err < 0 ) goto err_tsk; if( filp->f_flags & O_CREAT ) { err = -EEXIST; if( task_thread(tsk)->perfctr ) goto err_tsk; perfctr->owner = tsk; task_thread(tsk)->perfctr = perfctr; else { perfctr = task_thread(tsk)->perfctr; /* In the /proc/pid/perfctr API, there is one user, viz. ioctl PERFCTR_INFO, for which it's ok for perfctr to be NULL. Hence no non-null check here. */ filp->private_data = perfctr; /* put all data to the user */ if( perfctr ) atomic_inc(&perfctr->count); if( tsk!= current ) put_task_struct(tsk); return 0; err_tsk: if( tsk!= current ) put_task_struct(tsk); 32
33 err_perfctr: if( perfctr ) /* can only occur if filp->f_flags & O_CREAT */ put_vperfctr(perfctr); return err; vperfctr_mmap() and vperfctr_release() do their corresponding my mapping the first page of the memory to the user and releasing the perfctr structure respectively. The virtual also supports ioctls VPERFCTR_STOP, VPERFCTR_UNLINK, VPERFCTR_SAMPLE, VPERFCTR_IRESUME and they get mapped to the corresponding vperfctr_exit(), vperfctr_sample() functions which are described previously. By providing a /proc interface virtual PMC driver ensures that processes can get the perfctr structure containing PMC values by opening the file /proc/self/perfctr. 3.2 Global-mode PMC Driver Global-mode PMC driver emulates a device /dev/perfctr to which users can issue ioctls to obtain values of various PMC s. It defines only a function mapping to ioctl in its file operations structure as follows:- static struct file_operations dev_perfctr_file_ops = {.owner = THIS_MODULE,.ioctl = dev_perfctr_ioctl, ; List of ioctls that can be sent to this device and their corresponding functions are given by the following function static int dev_perfctr_ioctl(struct inode *inode, struct file *filp, unsigned int cmd, unsigned long arg) { switch( cmd ) { case PERFCTR_INFO: return sys_perfctr_info((struct perfctr_info*)arg); case GPERFCTR_CONTROL: return gperfctr_control((struct gperfctr_control*)arg); case GPERFCTR_READ: return gperfctr_read((struct gperfctr_state*)arg); case GPERFCTR_STOP: return gperfctr_stop(); return -EINVAL; 33
34 PERFCTR_INFO ioctl returns a structure filled with the information on various counters to the user using copy_to_user function. GPERFCTR_CONTROL ioctl makes the driver to allocate various perfctr structures and start a timer which will be used to sample the values at periodic intervals. GPERFCTR_READ ioctl returns a perfctr structure updated with the values of the PMC s. static int gperfctr_read(struct gperfctr_state *arg) { unsigned nrcpus, i; struct gperfctr *perfctr; struct gperfctr_cpu_state state; if( get_user(nrcpus, &arg->nrcpus) ) return -EFAULT; if( nrcpus > smp_num_cpus ) nrcpus = smp_num_cpus; if( sampling_timer.data == 0 ) /* no timer; sample now */ sample_all_cpus(); for(i = 0; i < nrcpus; ++i) { perfctr = &per_cpu_gperfctr[cpu_logical_map(i)]; spin_lock(&perfctr->lock); state.cpu_control = perfctr->cpu_state.control; state.sum = perfctr->cpu_state.sum; spin_unlock(&perfctr->lock); if( copy_to_user(&arg->cpu_state[i], &state, sizeof state) ) return -EFAULT; return nr_active_cpus; GPERFCTR_STOP ioctls releases the timer and resets various PMC s to their previous values. 34
35 4. A proof-of-concept implementation The implementation is done in Red Hat Linux 8.0, Kernel running on a Pentium III 653 MHz. processor. This implementation consists of two parts: - A Driver enabling PMC access from User-Mode A user Level Program which can measure them. 4.1 PMC Driver This driver is provides a character device with ioctls for user programs to communicate with it. It defines the open, close and ioclt operations of the device. First in init_module it registers the device under the name pmc. int init_module(void) { int a; if ((pmc_major = register_chrdev(0, "pmc", &pmc_fops)) == -EBUSY) { printk("unable to get major for pmc device\n"); return -EIO; Then it sets the PCE(Performance Counter Enable) bit of the cr4 register to enable RDPMC work in any privilege level. Although it is not a good design, it enables user programs to directly access the performance counters. /* In order to use the rdpmc instruction in user mode, we need to set the PCE bit of CR4. PCE is 8th bit of cr4, and 256 is 2 << 8 */ printk("<4> Setting the PCE bit \n"); asm ("movl %%cr4, %0\n\t" /* move CR4 into a */ "orl $256, %0\n\t" /* turn on PCE bit in a */ "movl %0, %%cr4\n" /* copy a back into CR4 */ : "=r" (a) /* writes to registerized a */ : /* no inputs */); There are two utility functions pmc_clear() and setcounter which are implemented as follows:- 35
36 /* pmc_clear clears the PMC specified by counter * counter = 0 => perfctr0 * counter = 1 => perfctr1 * it uses WRMSR to write the values in the counters */ static void pmc_clear(int counter) { int counterregister = PERFCTR0 + counter; /* clear the old register */ asm ("mov %0, %%ecx\n\t" "xor %%edx, %%edx\n\t" "xor %%eax, %%eax\n\t" "wrmsr\n\t" : /* no outputs */ : "m" (counterregister) : "eax", "ecx", "edx" /* all clobbered */); /* This function writes the value specified by the arg to the counter * indicated by counter */ static void setcounter(int counter, unsigned long arg) { if ((counter < 0) (counter > 1)) { printk("pmc:setcounter illegal value for counter\n"); else { int selectionregister = PERFEVENTSEL0 + counter; int counterregister = PERFCTR0 + counter; pmc_clear(counter); /* set the value */ asm ("mov %0, %%ecx\n\t" /* ecx contains the number of the MSR to set */ "xor %%edx, %%edx\n\t"/* edx contains the high bits to set the MSR to */ "mov %1, %%eax\n\t" /* eax contains the log bits to set the MSR to */ "wrmsr\n\t" : /* no outputs */ : "m" (selectionregister), "m" (arg) : "eax", "ecx", "edx" /* clobbered */); As WRMSR instruction and accessing cr4 register can only be done in privilege level 0, they are implemented in the driver portion. 36
37 Various ioctl calls are performed as given by the following function:- static int ioctl_pmc(struct inode *inode, struct file *f, unsigned int cmd, unsigned long arg) { int a; switch (cmd) { case 0: /* disable counter */ setcounter(0, 0); pmc_clear(0); /* set counter 0 */ setcounter(0, arg); break; case 1: /* disable counter */ setcounter(1, 0); pmc_clear(1); /* set counter 1 */ setcounter(1, arg); break; default: printk("ioctl_pmc: illegal cmd: %d\n", cmd); break; return 0; We are now able to access PMC s using RDPMC instruction once we load the driver in the kernel. 4.2 User Space Program This program acts like the perfex / lperfex program found in SGI IRIX / Linux systems although it does some basic counting of events. 37
38 This program is called pmccount and it can be used in two ways( As Pentium III has only two counters, we can measure at most two events simultaneously):- pmccount event1 event2 program args pmccount SUM program args In the first case, it will run the program with args and at end will give the number of times event1 and event2 has occurred. Each event is associated with a code e.g. DATA_MEM_REFS means the event of accessing memory. In the second case, after running program with args a few numbers of times it will measure various events and produce a summary with various performance metrics. This program at first clears various counters by opening /dev/pmc and issuing ioctls. Then it creates (forks) a child process and runs the program specified by the user. When the process terminates it measures the values of counters using RDPMC instruction and passes to the higher level routine to analyze it. The count function which does the main job is defined as below:- int count(int eventid1, int eventid2, char **args, long long *res1, long long *res2) { int fd; int result; fd = open("/dev/pmc", O_RDONLY); if (fd < 0) { perror("can't open /dev/pmc - is pmc driver installed?"); return -1; result = ioctl(fd, 0, eventid1 PMC_USER_MASK PMC_OS_MASK PMC_ENABLE_MASK); result = ioctl(fd, 1, eventid2 PMC_USER_MASK PMC_OS_MASK PMC_ENABLE_MASK); close(fd); /* fork a child process, run the program given by the user, make parent wait for its termination */ 38
39 switch(fork()) { case -1: perror("can't fork:"); exit(-1); case 0: /* in the child */ execvp(args[0], args); perror("can't exec"); return -1; /* NOTREACHED */ break; default: /* in the parent */ { int status; wait(&status); if(status == -1) return -1; break; /* isssue rdpmc instruction to read the counters, write the values to * the arguments passed to the function */ *res1 = rdpmc(0); *res2 = rdpmc(1); return 0; Two utility function rdpmc and rdpmc32 pulls out values from the counters. The function rdpmc returns a 64 bit long long value while rdpmc32 returns a 32 bit integer value. These functions uses the RDPMC instruction to get the values. long long rdpmc(int counter) { unsigned eax; unsigned edx; unsigned long long r; asm volatile ("mov %2, %%ecx\n\t" "rdpmc\n\t" "mov %%eax, %0\n\t" "and $255, %%edx\n\t" "mov %%edx, %1\n\t" 39
40 : "=m" (eax), "=m" (edx), "=m" (counter) : /* no inputs */ : "eax", "ecx", "edx"); /* eax, ecx, edx clobbered */ r = ((unsigned long long) edx << 32) eax; return r; int rdpmc32(int counter) { unsigned eax; asm volatile ("mov %1, %%ecx\n\t" "rdpmc\n\t" "mov %%eax, %0\n\t" : "=m" (eax), "=m" (counter) : /* no inputs */ : "eax", "ecx", "edx"); /* eax, ecx, edx clobbered */ return eax; For summary operations we measure the following events (Next describes how these events help us to produce some useful performance metrics):- Events Event Codes (Pentium III) Cycles --- CPU_CLK_UNHALTED Instructions --- INST_RETIRED Loads & Stores -- DATA_MEM_REFS L1 Misses -- DCU_LINES_IN L2 Misses -- L2_LINES_IN Fl. pt. Inst. --- FLOPS Branches -- BR_INST_DECODED Branch Misses -- BR_MISS_PRED_RETIRED TLB Misses --- ITLB_MISS Icache Misses -- IFU_IFETCH_MISS 5. Some Useful Performance Metrics We can derive some useful performance metrics from the events counted by Performance monitoring counters. Formulas for various performance metrics which can be derived from the events listed above are as follows:- IPC (Instruction Per Cycle) or CPI = Total Instruction Executed / Total Cycles. 40
41 MFLOPS (Millions of Floating Point Operations per second) = (Total Floating Point Instruction) * CPU Clock (MHz) / Cycles. L1 Cache Hit Rate = 1 (L1 Cache Misses) / (Load + Stores) L2 Cache Hit Rate = 1 (L2 Cache Misses) / (L1 Cache Misses) Memory / Flops Ratio = (Loads + Stores) / (Floating Point Instructions Executed) Branch Rate = (Total Decoded Branch Instruction) / (Total Instruction Executed) Branch Miss Prediction Rate = (Miss Predicted Braches) / (Total Instruction Executed) TLB (Translation Look-Aside Buffer) Miss Rate = (TLB Misses) / (Loads + Stores) L1-TO-L2 Bandwidth used (MB/s) = (L1_Misses * L1 Line size * CPU Clock) / Cycles L2-TO-Memmory Bandwidth used (MB/s) = (L2 Misses * L2 Linesize * CPU Clock) / Cycles As there are about 90 odd events that can be measured with the performance monitoring counters many other performance metrics can be derived from observing these counters. Our sample implementation provides a summary option (as mentioned earlier) which outputs some of these performance metrics. Here is an output from the pmccount program which monitors the counters while running ls command on current directory. Command : pmccount SUM ls Output: -- These are ls outputs --- install Makefile pmc1.c pmc.c pmc.html pmctime pmctime.c~ pmctime.o rdpmc.c rdpmc.o testasm.c it output_pmc pmc1.o pmc.h pmc.o pmctime.c pmctime.html pmctime.s rdpmc.h test test.c install Makefile pmc1.c pmc.c pmc.html pmctime pmctime.c~ pmctime.o rdpmc.c rdpmc.o testasm.c it output_pmc pmc1.o pmc.h pmc.o pmctime.c pmctime.html pmctime.s rdpmc.h test test.c install Makefile pmc1.c pmc.c pmc.html pmctime pmctime.c~ pmctime.o rdpmc.c rdpmc.o testasm.c it output_pmc pmc1.o pmc.h pmc.o pmctime.c pmctime.html pmctime.s rdpmc.h test test.c install Makefile pmc1.c pmc.c pmc.html pmctime pmctime.c~ pmctime.o rdpmc.c rdpmc.o testasm.c 41
42 it output_pmc pmc1.o pmc.h pmc.o pmctime.c pmctime.html pmctime.s rdpmc.h test test.c install Makefile pmc1.c pmc.c pmc.html pmctime pmctime.c~ pmctime.o rdpmc.c rdpmc.o testasm.c it output_pmc pmc1.o pmc.h pmc.o pmctime.c pmctime.html pmctime.s rdpmc.h test test.c -- These are values of various performance metrics described above -- Various Performance Metrics ==================================== FLOPS: 14 Instrunctions Per Cycle: MFLOPS: x CPU Speed(MHz) L1 Cache Hit Rate: L2 Cacle Hit Rate: Memory/ Flops Ratio: Branch Rate: Branch miss rate: TLB Miss Rate Conclusion This study shows that various useful performance metrics can be derived from the performance monitoring counters present in most modern processor. It has also discussed an existing implementation as well as a proof-of-concept implementation to access the various counters under Linux Operating System and how performance metrics are calculated from the event counts obtained. The proof-of-concept implementation provided is very limited and so it can be extended in many ways including:- 1. Inclusion of a routine to determine the current CPU speed, so that it can be used along with the other event counts to give some precise performance metrics. ( It involves reading /proc/cpuinfo and then parse the result to obtain CPU clock speed). 2. Porting it to the Solaris environment ( As Solaris 10 will be open-sourced [ according to sun] we look forward to make changes to the Solaris Kernel to implement per-process counters if possible). 3. Average of the values obtained by running the same program several times will give more accurate results. 4. Running various portions of the program separately and measuring their performance will lead to identify the bottlenecks. 42
43 These performance metrics helps us to identity the portion of the codes that are consuming more times and running more inefficiently than other part. This will help us to modify the codes in such a way to improve the performance. 7. References 1. Intel IA-32 Architecture Manuals, 2. Source Code of Perfctr patch by Mikael Pattersson 3. Understanding the Linux Kernel, 2 nd Edition, Daniel P. Bovet, Marco Cesati, O Reilly. 43
Performance monitoring with Intel Architecture
 Performance monitoring with Intel Architecture CSCE 351: Operating System Kernels Lecture 5.2 Why performance monitoring? Fine-tune software Book-keeping Locating bottlenecks Explore potential problems
A Study of Performance Monitoring Unit, perf and perf_events subsystem
 A Study of Performance Monitoring Unit, perf and perf_events subsystem Team Aman Singh Anup Buchke Mentor Dr. Yann-Hang Lee Summary Performance Monitoring Unit, or the PMU, is found in all high end processors
STUDY OF PERFORMANCE COUNTERS AND PROFILING TOOLS TO MONITOR PERFORMANCE OF APPLICATION
 STUDY OF PERFORMANCE COUNTERS AND PROFILING TOOLS TO MONITOR PERFORMANCE OF APPLICATION 1 DIPAK PATIL, 2 PRASHANT KHARAT, 3 ANIL KUMAR GUPTA 1,2 Depatment of Information Technology, Walchand College of
Introduction. What is an Operating System?
 Introduction What is an Operating System? 1 What is an Operating System? 2 Why is an Operating System Needed? 3 How Did They Develop? Historical Approach Affect of Architecture 4 Efficient Utilization
Using PAPI for hardware performance monitoring on Linux systems
 Using PAPI for hardware performance monitoring on Linux systems Jack Dongarra, Kevin London, Shirley Moore, Phil Mucci, and Dan Terpstra Innovative Computing Laboratory, University of Tennessee, Knoxville,
CSC 2405: Computer Systems II
 CSC 2405: Computer Systems II Spring 2013 (TR 8:30-9:45 in G86) Mirela Damian http://www.csc.villanova.edu/~mdamian/csc2405/ Introductions Mirela Damian Room 167A in the Mendel Science Building [email protected]
Jorix kernel: real-time scheduling
 Jorix kernel: real-time scheduling Joris Huizer Kwie Min Wong May 16, 2007 1 Introduction As a specialized part of the kernel, we implemented two real-time scheduling algorithms: RM (rate monotonic) and
W4118 Operating Systems. Junfeng Yang
 W4118 Operating Systems Junfeng Yang Outline Linux overview Interrupt in Linux System call in Linux What is Linux A modern, open-source OS, based on UNIX standards 1991, 0.1 MLOC, single developer Linus
Intel Xeon Phi Coprocessor (codename: Knights Corner) Performance Monitoring Units
 Performance Monitoring Units") Intel Xeon Phi Coprocessor (codename: Knights Corner) Performance Monitoring Units Revision: 1.01 Last Modified: July 10, 2012 Document Number: 327357-001 Page 1 INFORMATION IN THIS DOCUMENT IS PROVIDED
Intel Xeon Phi Coprocessor (codename: Knights Corner) Performance Monitoring Units Revision: 1.01 Last Modified: July 10, 2012 Document Number: 327357-001 Page 1 INFORMATION IN THIS DOCUMENT IS PROVIDED
CPU performance monitoring using the Time-Stamp Counter register
 CPU performance monitoring using the Time-Stamp Counter register This laboratory work introduces basic information on the Time-Stamp Counter CPU register, which is used for performance monitoring. The
An Implementation Of Multiprocessor Linux
 An Implementation Of Multiprocessor Linux This document describes the implementation of a simple SMP Linux kernel extension and how to use this to develop SMP Linux kernels for architectures other than
Using the RDTSC Instruction for Performance Monitoring
 Using the Instruction for Performance Monitoring http://developer.intel.com/drg/pentiumii/appnotes/pm1.htm Using the Instruction for Performance Monitoring Information in this document is provided in connection
CHAPTER 6 TASK MANAGEMENT
 CHAPTER 6 TASK MANAGEMENT This chapter describes the IA-32 architecture s task management facilities. These facilities are only available when the processor is running in protected mode. 6.1. TASK MANAGEMENT
Exceptions in MIPS. know the exception mechanism in MIPS be able to write a simple exception handler for a MIPS machine
 7 Objectives After completing this lab you will: know the exception mechanism in MIPS be able to write a simple exception handler for a MIPS machine Introduction Branches and jumps provide ways to change
Performance Counter. Non-Uniform Memory Access Seminar Karsten Tausche 2014-12-10
 Performance Counter Non-Uniform Memory Access Seminar Karsten Tausche 2014-12-10 Performance Counter Hardware Unit for event measurements Performance Monitoring Unit (PMU) Originally for CPU-Debugging
Hardware performance monitoring. Zoltán Majó
 Hardware performance monitoring Zoltán Majó 1 Question Did you take any of these lectures: Computer Architecture and System Programming How to Write Fast Numerical Code Design of Parallel and High Performance
Transparent ROP Detection using CPU Performance Counters. 他 山 之 石, 可 以 攻 玉 Stones from other hills may serve to polish jade
 Transparent ROP Detection using CPU Performance Counters 他 山 之 石, 可 以 攻 玉 Stones from other hills may serve to polish jade Xiaoning Li Michael Crouse Intel Labs Harvard University THREADS Conference 2014
COS 318: Operating Systems
 COS 318: Operating Systems OS Structures and System Calls Andy Bavier Computer Science Department Princeton University http://www.cs.princeton.edu/courses/archive/fall10/cos318/ Outline Protection mechanisms
CS5460: Operating Systems. Lecture: Virtualization 2. Anton Burtsev March, 2013
 CS5460: Operating Systems Lecture: Virtualization 2 Anton Burtsev March, 2013 Paravirtualization: Xen Full virtualization Complete illusion of physical hardware Trap _all_ sensitive instructions Virtualized
Programming Guide. Intel Microarchitecture Codename Nehalem Performance Monitoring Unit Programming Guide (Nehalem Core PMU)
") Programming Guide Intel Microarchitecture Codename Nehalem Performance Monitoring Unit Programming Guide (Nehalem Core PMU) Table of Contents 1. About this document... 8 2. Nehalem-based PMU Architecture...
Programming Guide Intel Microarchitecture Codename Nehalem Performance Monitoring Unit Programming Guide (Nehalem Core PMU) Table of Contents 1. About this document... 8 2. Nehalem-based PMU Architecture...
Lecture 7: Machine-Level Programming I: Basics Mohamed Zahran (aka Z) [email protected] http://www.mzahran.com
 mzahran@cs.nyu.edu http://www.mzahran.com") CSCI-UA.0201-003 Computer Systems Organization Lecture 7: Machine-Level Programming I: Basics Mohamed Zahran (aka Z) [email protected] http://www.mzahran.com Some slides adapted (and slightly modified)
CSCI-UA.0201-003 Computer Systems Organization Lecture 7: Machine-Level Programming I: Basics Mohamed Zahran (aka Z) [email protected] http://www.mzahran.com Some slides adapted (and slightly modified)
FRONT FLYLEAF PAGE. This page has been intentionally left blank
 FRONT FLYLEAF PAGE This page has been intentionally left blank Abstract The research performed under this publication will combine virtualization technology with current kernel debugging techniques to
Freescale Semiconductor, I
 nc. Application Note 6/2002 8-Bit Software Development Kit By Jiri Ryba Introduction 8-Bit SDK Overview This application note describes the features and advantages of the 8-bit SDK (software development
Operating Systems. Lecture 03. February 11, 2013
 Operating Systems Lecture 03 February 11, 2013 Goals for Today Interrupts, traps and signals Hardware Protection System Calls Interrupts, Traps, and Signals The occurrence of an event is usually signaled
VxWorks Guest OS Programmer's Guide for Hypervisor 1.1, 6.8. VxWorks GUEST OS PROGRAMMER'S GUIDE FOR HYPERVISOR 1.1 6.8
 VxWorks Guest OS Programmer's Guide for Hypervisor 1.1, 6.8 VxWorks GUEST OS PROGRAMMER'S GUIDE FOR HYPERVISOR 1.1 6.8 Copyright 2009 Wind River Systems, Inc. All rights reserved. No part of this publication
Embedded Programming in C/C++: Lesson-1: Programming Elements and Programming in C
 Embedded Programming in C/C++: Lesson-1: Programming Elements and Programming in C 1 An essential part of any embedded system design Programming 2 Programming in Assembly or HLL Processor and memory-sensitive
Virtualization Technologies
 12 January 2010 Virtualization Technologies Alex Landau ([email protected]) IBM Haifa Research Lab What is virtualization? Virtualization is way to run multiple operating systems and user applications on
Intel Virtualization Technology Specification for the IA-32 Intel Architecture
 Intel Virtualization Technology Specification for the IA-32 Intel Architecture C97063-002 April 2005 THIS DOCUMENT AND RELATED MATERIALS AND INFORMATION ARE PROVIDED AS IS WITH NO WARRANTIES, EXPRESS OR
Chapter 6, The Operating System Machine Level
 Chapter 6, The Operating System Machine Level 6.1 Virtual Memory 6.2 Virtual I/O Instructions 6.3 Virtual Instructions For Parallel Processing 6.4 Example Operating Systems 6.5 Summary Virtual Memory General
Intel Vanderpool Technology for IA-32 Processors (VT-x) Preliminary Specification
 Preliminary Specification") Intel Vanderpool Technology for IA-32 Processors (VT-x) Preliminary Specification Order Number C97063-001 January 2005 THIS DOCUMENT AND RELATED MATERIALS AND INFORMATION ARE PROVIDED "AS IS" WITH NO WARRANTIES,
Intel Vanderpool Technology for IA-32 Processors (VT-x) Preliminary Specification Order Number C97063-001 January 2005 THIS DOCUMENT AND RELATED MATERIALS AND INFORMATION ARE PROVIDED "AS IS" WITH NO WARRANTIES,
Performance Monitor on PowerQUICC II Pro Processors
 Freescale Semiconductor Application Note Document Number: AN3359 Rev. 0, 05/2007 Performance Monitor on PowerQUICC II Pro Processors by Harinder Rai Network Computing Systems Group Freescale Semiconductor,
Intel 64 and IA-32 Architectures Software Developer s Manual
 Intel 64 and IA-32 Architectures Software Developer s Manual Volume 3A: System Programming Guide, Part 1 NOTE: The Intel 64 and IA-32 Architectures Software Developer's Manual consists of five volumes:
Kernel Virtual Machine
 Kernel Virtual Machine Shashank Rachamalla Indian Institute of Technology Dept. of Computer Science November 24, 2011 Abstract KVM(Kernel-based Virtual Machine) is a full virtualization solution for x86
Processes and Non-Preemptive Scheduling. Otto J. Anshus
 Processes and Non-Preemptive Scheduling Otto J. Anshus 1 Concurrency and Process Challenge: Physical reality is Concurrent Smart to do concurrent software instead of sequential? At least we want to have
Last Class: OS and Computer Architecture. Last Class: OS and Computer Architecture
 Last Class: OS and Computer Architecture System bus Network card CPU, memory, I/O devices, network card, system bus Lecture 3, page 1 Last Class: OS and Computer Architecture OS Service Protection Interrupts
A Survey of Parallel Processing in Linux
 A Survey of Parallel Processing in Linux Kojiro Akasaka Computer Science Department San Jose State University San Jose, CA 95192 408 924 1000 [email protected] ABSTRACT Any kernel with parallel processing
Basics of VTune Performance Analyzer. Intel Software College. Objectives. VTune Performance Analyzer. Agenda
 Objectives At the completion of this module, you will be able to: Understand the intended purpose and usage models supported by the VTune Performance Analyzer. Identify hotspots by drilling down through
matasano Hardware Virtualization Rootkits Dino A. Dai Zovi
 Hardware Virtualization Rootkits Dino A. Dai Zovi Agenda Introductions Virtualization (Software and Hardware) Intel VT-x (aka Vanderpool ) VM Rootkits Implementing a VT-x based Rootkit Detecting Hardware-VM
Multi-Threading Performance on Commodity Multi-Core Processors
 Multi-Threading Performance on Commodity Multi-Core Processors Jie Chen and William Watson III Scientific Computing Group Jefferson Lab 12000 Jefferson Ave. Newport News, VA 23606 Organization Introduction
Project No. 2: Process Scheduling in Linux Submission due: April 28, 2014, 11:59pm
 Project No. 2: Process Scheduling in Linux Submission due: April 28, 2014, 11:59pm PURPOSE Getting familiar with the Linux kernel source code. Understanding process scheduling and how different parameters
Full and Para Virtualization
 Full and Para Virtualization Dr. Sanjay P. Ahuja, Ph.D. 2010-14 FIS Distinguished Professor of Computer Science School of Computing, UNF x86 Hardware Virtualization The x86 architecture offers four levels
Intel 64 Architecture x2apic Specification
 Intel 64 Architecture x2apic Specification Reference Number: 318148-004 March 2010 i INFORMATION IN THIS DOCUMENT IS PROVIDED IN CONNECTION WITH INTEL PRODUCTS. NO LICENSE, EXPRESS OR IMPLIED, BY ESTOPPEL
ELEC 377. Operating Systems. Week 1 Class 3
 Operating Systems Week 1 Class 3 Last Class! Computer System Structure, Controllers! Interrupts & Traps! I/O structure and device queues.! Storage Structure & Caching! Hardware Protection! Dual Mode Operation
6.828 Operating System Engineering: Fall 2003. Quiz II Solutions THIS IS AN OPEN BOOK, OPEN NOTES QUIZ.
 Department of Electrical Engineering and Computer Science MASSACHUSETTS INSTITUTE OF TECHNOLOGY 6.828 Operating System Engineering: Fall 2003 Quiz II Solutions All problems are open-ended questions. In
Linux Driver Devices. Why, When, Which, How?
 Bertrand Mermet Sylvain Ract Linux Driver Devices. Why, When, Which, How? Since its creation in the early 1990 s Linux has been installed on millions of computers or embedded systems. These systems may
Perfmon2: a flexible performance monitoring interface for Linux
 Perfmon2: a flexible performance monitoring interface for Linux Stéphane Eranian HP Labs [email protected] Abstract Monitoring program execution is becoming more than ever key to achieving world-class
BHyVe. BSD Hypervisor. Neel Natu Peter Grehan
 BHyVe BSD Hypervisor Neel Natu Peter Grehan 1 Introduction BHyVe stands for BSD Hypervisor Pronounced like beehive Type 2 Hypervisor (aka hosted hypervisor) FreeBSD is the Host OS Availability NetApp is
CS161: Operating Systems
 CS161: Operating Systems Matt Welsh [email protected] Lecture 2: OS Structure and System Calls February 6, 2007 1 Lecture Overview Protection Boundaries and Privilege Levels What makes the kernel different
Lecture 5. User-Mode Linux. Jeff Dike. November 7, 2012. Operating Systems Practical. OSP Lecture 5, UML 1/33
 Lecture 5 User-Mode Linux Jeff Dike Operating Systems Practical November 7, 2012 OSP Lecture 5, UML 1/33 Contents User-Mode Linux Keywords Resources Questions OSP Lecture 5, UML 2/33 Outline User-Mode
5.14. EXCEPTION AND INTERRUPT REFERENCE
 5.14. EXCEPTION AND INTERRUPT REFERENCE The following sections describe conditions which generate exceptions and interrupts. They are arranged in the order of vector numbers. The information contained
Operating System Overview. Otto J. Anshus
 Operating System Overview Otto J. Anshus A Typical Computer CPU... CPU Memory Chipset I/O bus ROM Keyboard Network A Typical Computer System CPU. CPU Memory Application(s) Operating System ROM OS Apps
Virtual Servers. Virtual machines. Virtualization. Design of IBM s VM. Virtual machine systems can give everyone the OS (and hardware) that they want.
 that they want.") Virtual machines Virtual machine systems can give everyone the OS (and hardware) that they want. IBM s VM provided an exact copy of the hardware to the user. Virtual Servers Virtual machines are very widespread.
Virtual machines Virtual machine systems can give everyone the OS (and hardware) that they want. IBM s VM provided an exact copy of the hardware to the user. Virtual Servers Virtual machines are very widespread.
How To Write A Windows Operating System (Windows) (For Linux) (Windows 2) (Programming) (Operating System) (Permanent) (Powerbook) (Unix) (Amd64) (Win2) (X
 (For Linux) (Windows 2) (Programming) (Operating System) (Permanent) (Powerbook) (Unix) (Amd64) (Win2) (X") (Advanced Topics in) Operating Systems Winter Term 2009 / 2010 Jun.-Prof. Dr.-Ing. André Brinkmann [email protected] Universität Paderborn PC 1 Overview Overview of chapter 3: Case Studies 3.1 Windows Architecture.....3
(Advanced Topics in) Operating Systems Winter Term 2009 / 2010 Jun.-Prof. Dr.-Ing. André Brinkmann [email protected] Universität Paderborn PC 1 Overview Overview of chapter 3: Case Studies 3.1 Windows Architecture.....3
White Paper. Real-time Capabilities for Linux SGI REACT Real-Time for Linux
 White Paper Real-time Capabilities for Linux SGI REACT Real-Time for Linux Abstract This white paper describes the real-time capabilities provided by SGI REACT Real-Time for Linux. software. REACT enables
Intel 64 and IA-32 Architectures Software Developer s Manual
 Intel 64 and IA-32 Architectures Software Developer s Manual Volume 3A: System Programming Guide, Part 1 NOTE: The Intel 64 and IA-32 Architectures Software Developer's Manual consists of eight volumes:
W4118 Operating Systems. Instructor: Junfeng Yang
 W4118 Operating Systems Instructor: Junfeng Yang Outline x86 segmentation and paging hardware Linux address space translation Copy-on-write Linux page replacement algorithm Linux dynamic memory allocation
System Calls and Standard I/O
 System Calls and Standard I/O Professor Jennifer Rexford http://www.cs.princeton.edu/~jrex 1 Goals of Today s Class System calls o How a user process contacts the Operating System o For advanced services
Virtuozzo Virtualization SDK
 Virtuozzo Virtualization SDK Programmer's Guide February 18, 2016 Copyright 1999-2016 Parallels IP Holdings GmbH and its affiliates. All rights reserved. Parallels IP Holdings GmbH Vordergasse 59 8200
Virtual machines and operating systems
 V i r t u a l m a c h i n e s a n d o p e r a t i n g s y s t e m s Virtual machines and operating systems Krzysztof Lichota [email protected] A g e n d a Virtual machines and operating systems interactions
150127-Microprocessor & Assembly Language
 Chapter 3 Z80 Microprocessor Architecture The Z 80 is one of the most talented 8 bit microprocessors, and many microprocessor-based systems are designed around the Z80. The Z80 microprocessor needs an
EE8205: Embedded Computer System Electrical and Computer Engineering, Ryerson University. Multitasking ARM-Applications with uvision and RTX
 EE8205: Embedded Computer System Electrical and Computer Engineering, Ryerson University Multitasking ARM-Applications with uvision and RTX 1. Objectives The purpose of this lab is to lab is to introduce
Keil C51 Cross Compiler
 Keil C51 Cross Compiler ANSI C Compiler Generates fast compact code for the 8051 and it s derivatives Advantages of C over Assembler Do not need to know the microcontroller instruction set Register allocation
Understanding a Simple Operating System
 Understanding a Simple Operating System SOS is a Simple Operating System designed for the 32- bit x86 architecture. Its purpose is to understand basic concepts of operating system design. These notes are
Overview. CISC Developments. RISC Designs. CISC Designs. VAX: Addressing Modes. Digital VAX
 Overview CISC Developments Over Twenty Years Classic CISC design: Digital VAX VAXÕs RISC successor: PRISM/Alpha IntelÕs ubiquitous 80x86 architecture Ð 8086 through the Pentium Pro (P6) RJS 2/3/97 Philosophy
Automatic Logging of Operating System Effects to Guide Application-Level Architecture Simulation
 Automatic Logging of Operating System Effects to Guide Application-Level Architecture Simulation Satish Narayanasamy, Cristiano Pereira, Harish Patil, Robert Cohn, and Brad Calder Computer Science and
Intel P6 Systemprogrammering 2007 Föreläsning 5 P6/Linux Memory System
 Intel P6 Systemprogrammering 07 Föreläsning 5 P6/Linux ory System Topics P6 address translation Linux memory management Linux page fault handling memory mapping Internal Designation for Successor to Pentium
How To Write Portable Programs In C
 Writing Portable Programs COS 217 1 Goals of Today s Class Writing portable programs in C Sources of heterogeneity Data types, evaluation order, byte order, char set, Reading period and final exam Important
Operating Systems. 05. Threads. Paul Krzyzanowski. Rutgers University. Spring 2015
 Operating Systems 05. Threads Paul Krzyzanowski Rutgers University Spring 2015 February 9, 2015 2014-2015 Paul Krzyzanowski 1 Thread of execution Single sequence of instructions Pointed to by the program
Perf Tool: Performance Analysis Tool for Linux
 / Notes on Linux perf tool Intended audience: Those who would like to learn more about Linux perf performance analysis and profiling tool. Used: CPE 631 Advanced Computer Systems and Architectures CPE
W4118: segmentation and paging. Instructor: Junfeng Yang
 W4118: segmentation and paging Instructor: Junfeng Yang Outline Memory management goals Segmentation Paging TLB 1 Uni- v.s. multi-programming Simple uniprogramming with a single segment per process Uniprogramming
Performance Application Programming Interface
 /************************************************************************************ ** Notes on Performance Application Programming Interface ** ** Intended audience: Those who would like to learn more
Machine check handling on Linux
 Machine check handling on Linux Andi Kleen SUSE Labs [email protected] Aug 2004 Abstract The number of transistors in common CPUs and memory chips is growing each year. Hardware busses are getting faster. This
Under The Hood: The System Call
 2 Under The Hood: The System Call In this note, we ll peak under the hood of one simple and neat OS called xv6 [CK+08]. The xv6 kernel is a port of an old UNIX version 6 from PDP-11 (the machine it was
Dynamic VM Monitoring using Hypervisor Probes
 Dynamic VM Monitoring using Hypervisor Probes Z. J. Estrada, C. Pham, F. Deng, L. Yan, Z. Kalbarczyk, R. K. Iyer European Dependable Computing Conference 2015-09-09 1 Dynamic VM Monitoring Goal On-demand
Intel 8086 architecture
 Intel 8086 architecture Today we ll take a look at Intel s 8086, which is one of the oldest and yet most prevalent processor architectures around. We ll make many comparisons between the MIPS and 8086
10.04.2008. Thomas Fahrig Senior Developer Hypervisor Team. Hypervisor Architecture Terminology Goals Basics Details
 Thomas Fahrig Senior Developer Hypervisor Team Hypervisor Architecture Terminology Goals Basics Details Scheduling Interval External Interrupt Handling Reserves, Weights and Caps Context Switch Waiting
Operating Systems. Privileged Instructions
 Operating Systems Operating systems manage processes and resources Processes are executing instances of programs may be the same or different programs process 1 code data process 2 code data process 3
ARM Thumb Microcontrollers. Application Note. Software ISO 7816 I/O Line Implementation. Features. Introduction
 Software ISO 7816 I/O Line Implementation Features ISO 7816-3 compliant (direct convention) Byte reception and transmission with parity check Retransmission on error detection Automatic reception at the
Mouse Drivers. Alan Cox. [email protected]
 Mouse Drivers Alan Cox [email protected] Mouse Drivers by Alan Cox Copyright 2000 by Alan Cox This documentation is free software; you can redistribute it and/or modify it under the terms of the GNU General
Virtual Private Systems for FreeBSD
 Virtual Private Systems for FreeBSD Klaus P. Ohrhallinger 06. June 2010 Abstract Virtual Private Systems for FreeBSD (VPS) is a novel virtualization implementation which is based on the operating system
CS 377: Operating Systems. Outline. A review of what you ve learned, and how it applies to a real operating system. Lecture 25 - Linux Case Study
 CS 377: Operating Systems Lecture 25 - Linux Case Study Guest Lecturer: Tim Wood Outline Linux History Design Principles System Overview Process Scheduling Memory Management File Systems A review of what
There s a kernel security researcher named Dan Rosenberg whose done a lot of linux kernel vulnerability research
 1 There s a kernel security researcher named Dan Rosenberg whose done a lot of linux kernel vulnerability research That s unavoidable, but the linux kernel developers don t do very much to make the situation
THE BASICS OF PERFORMANCE- MONITORING HARDWARE
 THE BASICS OF PERFORMANCE- MONITORING HARDWARE PERFORMANCE-MONITORING FEATURES PROVIDE DATA THAT DESCRIBE HOW AN APPLICATION AND THE OPERATING SYSTEM ARE PERFORMING ON THE PROCESSOR. THIS INFORMATION CAN
Addendum Intel Architecture Software Developer s Manual
 Addendum Intel Architecture Software Developer s Manual Volume 3: System Programming Guide Order Number: 243690-001 NOTE: The Intel Architecture Software Developer s Manual consists of the following volumes:
Sensors and the Zaurus S Hardware
 The Zaurus Software Development Guide Robert Christy August 29, 2003 Contents 1 Overview 1 2 Writing Software for the Zaurus 2 3 Using the bathw Library 3 3.1 Using the fans.............................
Hardware Assisted Virtualization Intel Virtualization Technology
 Hardware Assisted Virtualization Intel Virtualization Technology Matías Zabaljáuregui [email protected] Buenos Aires, Junio de 2008 1 Index 1 Background, motivation and introduction to Intel Virtualization
The Microsoft Windows Hypervisor High Level Architecture
 The Microsoft Windows Hypervisor High Level Architecture September 21, 2007 Abstract The Microsoft Windows hypervisor brings new virtualization capabilities to the Windows Server operating system. Its
Hardware-based performance monitoring with VTune Performance Analyzer under Linux
 Hardware-based performance monitoring with VTune Performance Analyzer under Linux Hassan Shojania [email protected] Abstract All new modern processors have hardware support for monitoring processor performance.
Operating Systems 4 th Class
 Operating Systems 4 th Class Lecture 1 Operating Systems Operating systems are essential part of any computer system. Therefore, a course in operating systems is an essential part of any computer science
CS 3530 Operating Systems. L02 OS Intro Part 1 Dr. Ken Hoganson
 CS 3530 Operating Systems L02 OS Intro Part 1 Dr. Ken Hoganson Chapter 1 Basic Concepts of Operating Systems Computer Systems A computer system consists of two basic types of components: Hardware components,
The basic CAP CPU consists of a microprogramming control unit, 4K 16-bit words of micro-control storage, and an 79
 5 The Cambridge CAP Computer 5. I Introduction In 1970, Roger Needham and Maurice Wilkes at Cambridge University began a research project to construct a capabilitybased machine. In contrast to the Chicago
High-speed image processing algorithms using MMX hardware
 High-speed image processing algorithms using MMX hardware J. W. V. Miller and J. Wood The University of Michigan-Dearborn ABSTRACT Low-cost PC-based machine vision systems have become more common due to
Process Description and Control. 2004-2008 william stallings, maurizio pizzonia - sistemi operativi
 Process Description and Control 1 Process A program in execution (running) on a computer The entity that can be assigned to and executed on a processor A unit of activity characterized by a at least one
A High Resolution Performance Monitoring Software on the Pentium
 A High Resolution Performance Monitoring Software on the Pentium Ong Cheng Soon*, Fadhli Wong Mohd Hasan Wong**, Lai Weng Kin* * Software Lab, MIMOS Berhad [email protected], [email protected] ** Dept of Electrical
Computer-System Architecture
 Chapter 2: Computer-System Structures Computer System Operation I/O Structure Storage Structure Storage Hierarchy Hardware Protection General System Architecture 2.1 Computer-System Architecture 2.2 Computer-System
Binary search tree with SIMD bandwidth optimization using SSE
 Binary search tree with SIMD bandwidth optimization using SSE Bowen Zhang, Xinwei Li 1.ABSTRACT In-memory tree structured index search is a fundamental database operation. Modern processors provide tremendous
Linux Kernel Architecture
 Linux Kernel Architecture Amir Hossein Payberah [email protected] Contents What is Kernel? Kernel Architecture Overview User Space Kernel Space Kernel Functional Overview File System Process Management
Sistemi Operativi. Lezione 25: JOS processes (ENVS) Corso: Sistemi Operativi Danilo Bruschi A.A. 2015/2016
 Corso: Sistemi Operativi Danilo Bruschi A.A. 2015/2016") Sistemi Operativi Lezione 25: JOS processes (ENVS) 1 JOS PCB (ENV) 2 env_status ENV_FREE: Indicates that the Env structure is inactive, and therefore on the env_free_list. ENV_RUNNABLE: Indicates that
Sistemi Operativi Lezione 25: JOS processes (ENVS) 1 JOS PCB (ENV) 2 env_status ENV_FREE: Indicates that the Env structure is inactive, and therefore on the env_free_list. ENV_RUNNABLE: Indicates that
An Introduction to the ARM 7 Architecture
 An Introduction to the ARM 7 Architecture Trevor Martin CEng, MIEE Technical Director This article gives an overview of the ARM 7 architecture and a description of its major features for a developer new