2015 Ticketing Software Satisfaction Survey
|
|
|
- Daisy Austin
- 10 years ago
- Views:
Transcription
1 Arts Management & Technology Laboratory 2015 Ticketing Software Satisfaction Survey Dr. Brett Ashley Crawford, Danielle Gewurz, Stewart Urist, Kristen Sorek West, Christine Sajewski June 2015 A Research Center of 1

2 TABLE OF CONTENTS Chapter 1: Executive Summary 5 Chart 1.1: Average Satisfaction Higher Among Those Using More Software Features 5 Chapter 2: Geographic Analysis 8 Chart 2.1: Usage of Membership and Donation Higher in Urban Areas 9 Chart 2.2: Higher Usage of Features Occurs Among Urban Organizations 9 Chart 2.3: Only Slight Differences Exist in Satisfaction 10 Chart 2.4: Excepting Subscriptions, Orgs Show Similar Satisfaction Levels Across Features 10 Chart 2.5: Subscriptions/Packages More Positively Viewed by Urban Orgs 11 Chart 2.6: Urban Organizations See Higher Importance for Certain Features 11 Chart 2.7: Barcoding More Important in Urban Areas 12 Chart 2.8: Importance of At-Home Printing by Urban 12 Chart 2.9: Regional Distribution of Survey Respondents 13 Chart 2.10: Across Regions, Use of Seating Features Shows Few Differences 14 Chart 2.11: Shared Service Use Varies by Region 15 Chart 2.12: Satisfaction Varies by Region 15 Chart 2.13: Satisfaction with Vendor Support Varies by Region 16 Chart 2.14: Satisfaction in Reserved Seating and Group Sales Varies by Region 16 Chart 2.15: Satisfaction of Membership and Automated Reports Varies by Region 17 Chart 2.16: Satisfaction of Features Greatly Differs by Region 18 Chart 2.17: Satisfaction with At-Home Printing by Region 18 Chart 2.18: Importance of Mail-In or Fax Purchases Varies by Region 19 Chart 2.19: Importance of Mail-In or Fax Purchases by Region 19 Chart 2.20: Organizations in Canada Report Lower Usage of Advanced Technologies 20 Chart 2.21: Organizations in Canada Report Lower Importance for Certain Features 20 Chapter 3: Artistic Discipline 20 Chart 3.1: Breakdown of Discipline Groups 22 Chart 3.2: Few Differences in Feature Usage Across Disciplines 23 Chart 3.3: Overall Satisfaction Levels by Discipline 24 Chart 3.4: High Overall Satisfaction for Seating Features Across Disciplines 24 Chart 3.5: Performing Organizations More Likely to See Groups Sales as Very Important 25 Chart 3.6: Performing Organizations More Likely to See Mail-In/Fax Purchases as Very Important 25 2

3 Chart 3.7: Music Organizations Have Highest Usage of Mail-In or Fax Purchases 26 Chart 3.8: Usage of Shared Services Varies Among Disciplines 27 Chart 3.9: Usage of Automated Sales Reports Varies Among Disciplines 27 Chart 3.10: Usage of Barcoding Varies Among Disciplines 28 Chart 3.11: Satisfaction with Features Shows Some Variance Among Disciplines 28 Chart 3.12: Satisfaction with Subscriptions/Packages Varies Among Disciplines 29 Chart 3.13: Satisfaction with Membership Features Varies Among Disciplines 29 Chart 3.14: Satisfaction with Membership Varies Among Disciplines 30 Chart 3.15: Small Differences Exist in Satisfaction with Refunds 30 Chart 3.16: Slight Differences Exist Among Importance of Features 31 Chart 3.17: Importance Ratings Vary for Mail-In/Fax and Mobile Purchases 31 Chart 3.18: Importance of Mail-in or Fax Purchases 32 Chart 3.19: Importance of Mobile Purchases 32 Chart 3.20: Importance of Features Varies by Individual Discipline 33 Chart 3.21: Comparison of Importance of Barcoding 33 Chapter 4: Budget Size 35 Chart 4.1: Volunteers Use Software at Nearly Half of Low-Budget Organizations 36 Chart 4.2: Use and Importance of Mail-in and Fax, and Mobile, Ticketing Functions. 38 Chart 4.3: Use of a Ticketing System For Development, Membership, and CRM Functions Across Budget Size 40 Chart 4.4: Combined Satisfaction and Dissatisfaction of a Ticketing System s Customized Reporting Feature 41 Chart 4.5: Use and Satisfaction of Automated Sales Reports by Organization Size 41 Chart 4.6: Organizational Satisfaction Rates of Reserved Seating Ticketing Functions 42 Chart 4.7: Somewhat and Very Important Ratings of General Admission Functionality by Size 43 Chart 4.8: Importance of Subscription/Packages by Size 44 Chart 4.9: Importance of Group Sales by Size 44 Chart 4.10: Use of Subscription/Packages and Group Sales by Size 45 Chart 4.11: Dissatisfaction With Individual Admission, Subscription/Packages, and Group Sales by Organization Size 45 Chart 4.12: Satisfaction Rates of Individual Admission Ticketing Functions by Organization Size 46 Chart 4.13: Dissatisfaction and Neutral Satisfaction Rates of Seat Mapping 47 3

4 Chart 4.14: Combined Dissatisfaction and Neutral Satisfaction Rates of Exchanges 48 Chart 4.15: Importance of Ticket Forgery Prevention Features by Size 49 Chart 4.16: Importance of Barcoding Features by Size 50 Chapter 5: Mobile Technology 50 Chart 5.1: Ticket Sales by Purchasing Method 52 Chart 5.2: Majority of Orgs Have App or Mobile Site for Purchases 53 Chart 5.3: Mobile Ticket Sales 54 Chart 5.4: How Important it is For a Ticketing System to Support Mobile Purchasing 55 Chart 5.5: Availability of Mobile Purchase Tracking Capabilities 55 Chart 5.6: Frequency of Testing the User Experience of Mobile Ticketing in Low and Low-Mid Budget Organizations 56 Chart 5.7: Frequency of Testing the User Experience of Mobile Ticketing in All Budget Categories 57 Chapter 6: The Future 59 Table 6.1: Ticketing System Features and Functions Needing the Most Alteration 59 Table 6.2: Top Feature Needs by Budget Size 61 Chapter 7: Methodology and Future Research 63 Appendix I: Ticketing System Selection Considerations 66 Appendix II: Software Systems Included in This Survey 75 Appendix III: Survey Instrument and Topline 78 4

5 CHAPTER 1 EXECUTIVE SUMMARY The 2015 Ticketing Software Survey was the 3 rd iteration in 6 years (2009, 2011 prior). In this version we expanded our questions to get a clearer sense of not only what system features are used by arts organizations, but also what levels of satisfaction and importance are attached to each feature. Over 1,000 people opened the survey with 802 qualified respondents. Overall, respondents using more software features indicated higher average levels of satisfaction with the features they used. Those who reported Chart 1.1: Average Satisfaction Higher Among Those Using More Software Features Average satisfaction levels by feature use 4.19 using different features had average satisfaction scores of 4.19 (5 being very satisfied) while for those who use 7 or 3.71 fewer features, average satisfaction scores were The average score overall was 4.01 for all respondents. Respondents who worked in an IT position reported slightly Average Groups show number of features respondent indicated they used in their software. 5 = Very Satisfied, 1= Very Dissatisfied higher average satisfaction than those who worked in marketing, box office, or finance positions. The most encouraging news for the field is that, on the whole, ticketing software systems have improved over time and the vast majority of users reported being satisfied with many features of their systems. Furthermore, 89% noted using one 5

6 system for both sales and donor management, making customer relations increasingly seamless. Still, there are notable differences in use, satisfaction and ratings of feature importance depending on an organization s operating budget and local population density. The report gathered information distinguishing 6 disciplines: theatre, dance, music, visual arts, and multi-discipline. Data revealed that the users of ticketing software across discipline identifications are more homologous than perhaps one might assume. That being said, when researchers moved through deeper analysis, a few broad discipline trends appeared. What might surprise many readers is the industry-wide low-level of mobile ticket sales. While mobile marketing may be skyrocketing, audiences are rarely clicking to buy on their mobile devices even though the majority of arts organizations have access to, or have implemented, apps or mobile-friendly web interfaces. Low mobile transactions leave the web as a primary point of sale. Phone, mail and even faxes are still significant players in the moment of transaction. The following report provides an in depth analysis from over 802 completed surveys from a variety of perspectives. Chapter 2 details geographic distribution with analysis by region as well as a comparison between urban and rural organizations. Chapter 3 dissects organizations by discipline, budget size, and mobile. Chapter 4 reveals how budgets affect usage, satisfaction and perceived importance of software features. Chapter 5 provides the reader with a thorough analysis of the importance of, if not use of, mobile transactions. Chapter 6 offers a view to the perceived needs for the systems of the future. Thoughts on the future came from the survey s open-ended questions and AMT Lab endeavors to provide context and specifics for both users and vendors contemplation. The study concludes with the survey s methodology, future research 6

7 opportunities and a guide for those considering purchasing or making a change in their ticketing system. 7

8 CHAPTER 2 GEOGRAPHIC ANALYSIS The survey results provided a broad data set from across the USA and Canada. Urban versus suburban/rural results revealed the greatest differences. Regionally, in fact, there seemed to be little difference in usage, satisfaction and importance of features within the US with a more significant difference between the US and Canada, as noted in the last half of this chapter. Comparison by Urban Area Arts organizations have different systems and strategies for serving audiences depending on whether they are located in a city or rural area. For example, according to a recent study from the National Endowment for the Arts, residents in metropolitan areas are more likely to attend arts performances and consume art by mobile technology. 1 For this research, we defined an urban area as a five mile radius around a major city in the US with a population greater than 200,000. Areas outside of this region are considered suburban or rural. 2 Findings suggest multiple significant differences in feature satisfaction and importance rankings. Development functions are particularly important to urban organizations, as evidenced by membership and donation features being used by 13 to 15 percent more organizations than in suburban/rural areas. Urban organizations also showed statistically higher rates of usage for both customized and automated sales reports. 1 National Endowment for the Arts. A Decade of Arts Engagement: Findings from the Survey of Public Participation in the Arts, Washington: January Locations are included for organizations reporting an address. This analysis excludes organizations in Canada. The sample size for the two group are as follows: Urban n=172, Suburban/Rural n=250 8

9 Chart 2.1: Usage of Membership and Donation Higher in Urban Areas % who use each feature in their ticketing system Membership Donations Customized sales reports Automated sales reports Suburban/Rural Urban Q27. There are also very significant differences in Chart 2.2: Higher Usage of Features Occurs Among Urban Organizations usage of technical features, with urban organizations using barcoding at a percentage point higher rate and at-home printing at a 21-point Ticket Barcoding Forgery Prevention Seat mapping Refunds Exhanges Ticket printing (by org.) At-home printing higher rate. Additionally Suburban/Rural Urban there is a 10-point difference in usage of Q28. ticket forgery prevention features. 9

10 Organizations in both urban and Chart 2.3: Only Slight Differences Exist in Satisfaction suburban/rural areas are equally satisfied across most ticketing software features. Urban organizations were slightly more satisfied with the level of Ease of use Vendor support System updates Level of customization Value for the price customization in their Suburban/Rural Urban systems. Q31. There is also a difference in Chart 2.4: Excepting Subscriptions, Orgs Show Similar Satisfaction Levels Across Features satisfaction with subscriptions/ packages, again with urban organizations showing a 14-point higher satisfaction rate. Reserved seating General admission Individual admissions Subscriptions/ packages Group sales Suburban/Rural Urban Q32, Q33. 10

11 Fewer suburban/rural Chart 2.5: Subscriptions/Packages More Positively Viewed by Urban Orgs respondents said they were satisfied or very satisfied with Urban Very satisfied Satisfied Both satisfied and dissatisfied Dissatisfied subscriptions / Very dissatisfied packages Suburban/Rural Don't Know compared to the Urban respondents. The Q33. difference did not result in increased dissatisfaction ratings, but rather more respondents selecting the ambivalent both satisfied and dissatisfied response. Ratings of feature importance proved to be an imperfect predictor of usage. Interestingly, there were smaller gaps in what urban and suburban/rural organizations viewed as important than what Chart 2.6: Urban Organizations See Higher Importance for Certain Features 42 % reporting each feature as very important features they actually used, suggesting as least some unified thinking in this regard. Ticket forgery Ticket Forgery Prevention Barcoding Seat mapping Refunds Exhanges Ticket printing (by org.) Suburban/Rural Urban At-home printing prevention has a small 8- percentage point Q31. 11

12 difference, compared to the 10-point difference in usage. Barcoding has a 15- percentage point difference in importance rankings and a 28 percent difference in usage. And at-home printing has an 11-percentage point difference in importance and a 21-point difference in usage. The following charts further compare these last two features. Looking at barcoding, only 1 percent of urban respondents see this as not very important, while 73 percent rate Chart 2.7: Barcoding More Important in Urban Areas Very important Urban Somewhat important Not very important Suburban/Rural Not at all important Don't Know Q33. it as very important. Many suburban/ rural organizations also rate this feature as very important, but a significantly higher number rate it as not very important or not at all important. With at home printing, there is Chart 2.8: Importance of At-Home Printing by Urban also a significant number of Urban Very important suburban/rural organizations who feel this feature is not very important Suburban/Rural Somewhat important Not very important Not at all important Don't Know or not important at all. Q33. 12

13 Conclusion There are interesting differences comparing ticketing software features between urban and suburban/rural organizations. Usage of features including barcoding, ticket forgery prevention, and at-home printing is higher among urban areas. These features also have higher ratings of very important among urban organizations, though the rating gap is narrower than the usage gap. Additionally, urban organizations have higher usage of membership and donation features. While organizations are similarly satisfied across most features, suburban/ rural organizations have lower satisfaction for subscriptions/packages and the level of customization. In the future, qualitative research into the nature of the differences in the needs between urban and suburban/rural organizations would be a promising route. Comparison by Region Our surveyed organizations were equally distributed across the United States with a smaller cohort located in Canada, as depicted in the following graphic. We have hypothesized that arts organizations may have distinct perspectives on software features and satisfaction depending on their regional location, perhaps relating to differing audience wants and needs. Chart 2.9: Regional Distribution of Survey Respondents Regional distribution shows counts, not percentages. 13

14 Survey results for organizations in the U.S. suggest some geographic differences in usage and importance of particular features; however, contrary to the hypothesis, many features were ranked equally across the county. There were multiple important and very significant differences within the satisfaction of these features depending on the region. Overall regional differences were most notable in features addressing shared services, vendor support satisfaction, membership and ticket forgery prevention. The survey also had several respondents located in Canada. There were multiple large differences in the usage of particular features between organizations in the U.S. and in Canada. However, over 60 percent of Canadian respondents use Arts Management Systems, and it is likely that these variances are more representative of the software than differences in audience preference. Across regions, feature use is very Chart 2.10: Across Regions, Use of Seating Features Shows Few Differences similar. This suggests that usage of ticketing software has become very homogenous across the county Reserved seating General admission Individual admissions Subscriptions/ packages Group sales with equal usage Northeast Midwest South West of various features. Q19, Q20. 14

15 However, in usage of shared services, regional differences emerge. Compared to other areas of the country, organizations located in the West have a significantly lower usage Chart 2.11: Shared Service Use Varies by Region Shared website Group call center Shared box office Northeast Midwest South West Q26. of shared websites, group call centers, and shared box offices. There are several notable differences in satisfaction across regions. Chart 2.12 shows much higher satisfaction rates among organizations in the Midwest for both vendor support and value. Chart 2.12: Satisfaction Varies by Region Ease of use Vendor support System updates Level of customization Value for the price Northeast Midwest South West Q31. Percent saying they are satisfied or very satisfied with each. Chart 2.13 looks more closely at vendor support. The strongest difference between the regions occurs in the satisfied and dissatisfied categories, with Midwestern organizations having significantly higher overall satisfaction rates. 15

16 Chart 2.13: Satisfaction with Vendor Support Varies by Region West South Midwest Northeast Very satisfied Both satisfied and dissatisfied Very dissatisfied Satisfied Dissatisfied Don't Know Q31. Based on those who use each feature. There are also significant Chart 2.14: Satisfaction in Reserved Seating and Group Sales Varies by Region differences in satisfaction with reserved seating and group sales. Organizations in the Midwest show higher satisfaction with reserved Reserved seating General admission Individual admissions Subscriptions/ packages Group sales seating, but lower Northeast Midwest South West satisfaction with group sales. Q32, Q33. Based on those who use each feature. Figures combine those saying they are satisfied or very satisfied. Organizations in the West report significantly higher satisfaction with group sales systems compared to other regions. 16

17 Chart 2.15 shows the significant Chart 2.15: Satisfaction of Membership and Automated Reports Varies by Region difference in satisfaction with membership and donation features Organizations in the Midwest have significantly lower Membership Donations Customized sales reports Automated sales reports satisfaction in both of these areas, especially Northeast Midwest South West Q35. Based on those who use each feature. Figures combine those saying they are satisfied or very satisfied. compared to organizations in the neighboring West. There are very significant differences in satisfaction with ticket forgery prevention, seat mapping, and at-home printing, with different regions being more strongly satisfied with each feature. Organizations in the Midwest are significantly more satisfied with ticket forgery prevention at 83 percent satisfied or very satisfied. Organizations in the West are more satisfied with at-home printing with a nearly 15-percentage point difference from the other regions. While organizations report the same usage of these features, the differences in satisfaction suggest variances in expectations of the quality associated with these features. These differences may also indicate that organizations in these regions use these features more frequently. 17

18 Chart 2.16: Satisfaction of Features Greatly Differs by Region Ticket Forgery Prevention Barcoding Seat mapping Refunds Exhanges Ticket printing (by org.) At-home printing Northeast Midwest South West Q35. Based on those who use each feature. Chart 2.17 compares at- Chart 2.17: Satisfaction with At-Home Printing by Region home printing. West Organizations South in the west have a nearly Midwest Northeast Very satisfied Satisfied percentage Both satisfied and dissatisfied Dissatisfied point Very dissatisfied Don't Know difference in Q35. Based on those who use each feature. satisfaction compared to the other regions. Satisfaction rates in the South are similar to the Midwest and Northeast, but they have a much higher dissatisfaction rate. As there are no reported differences in usage, this may indicate which regions have higher expectations for this feature. 18

19 As seen with usage of Chart 2.18: Importance of Mail-In or Fax Purchases Varies by Region features, organizations across the different regions share equal perspectives on which On-site purchases Mail-in or fax puchases Phone purchases Website purchases Mobile purchases features are Northeast Midwest South West very Q42. important. There is a notable difference in mail-in or fax purchases with more organizations in the West and South viewing these features as very important. Mobile purchases were perceived as significantly less important in the Midwest than other regions. While more organizations in the Chart 2.19: Importance of Mail-In or Fax Purchases by Region west and South consider mail-or fax West purchase features very South important, 31 percent Midwest of organizations in the Northeast Midwest and 37 percent of Very important Not very important Somewhat important Not at all important organizations in the Don t Know Northeast consider these somewhat Q42. important. Very few organizations in any of the regions feel this is not at all important. 19

20
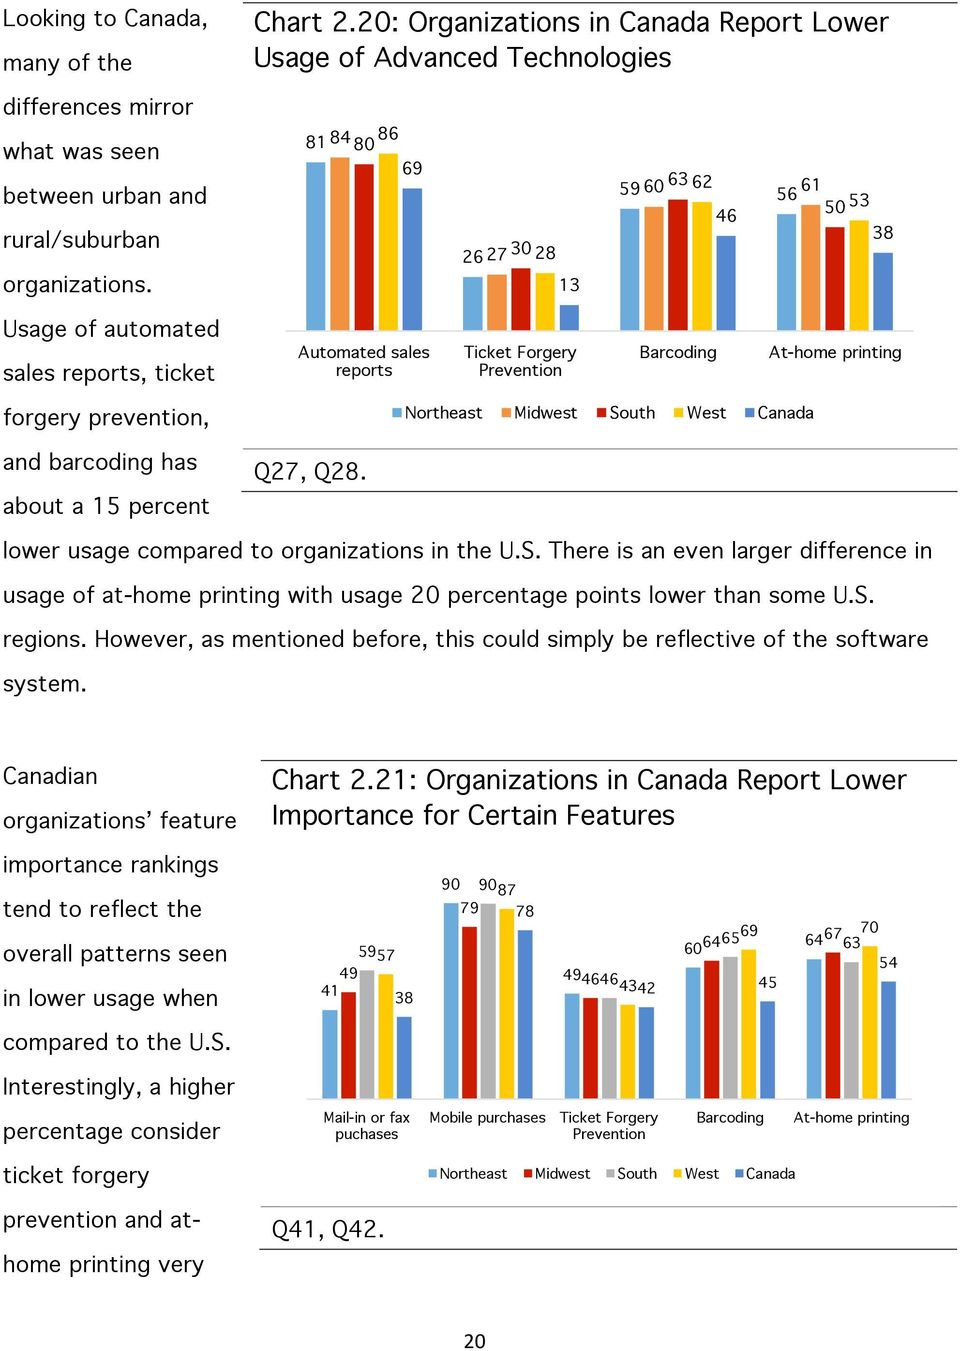
21 important than those who currently use these features. Organizations in Canada have lower importance ratings for mobile purchases and mail-in or fax purchases than organizations in most U.S. regions. Conclusion It is important for software providers to understand that opinions and satisfaction may differ depending on where the organization is located in the US. While use of certain features and perspectives on what is important may be similar, expectations about the quality clearly differ. The largest differences in usage occur in shared services which are generally lower in the West and higher in the Midwest. Organizations in the South and West rate mail-in or fax purchases as more important, while organizations in the Northeast, South, and West have higher rates considering mobile purchases as very important. The most significant differences in satisfaction often occurred in the Midwest, which had higher satisfaction for vendor support, reserved seating, automated sales reports, and ticket forgery prevention. Organizations in the West had higher satisfaction with group sales and at-home printing features. Organizations in South and Northeast had lower satisfaction with the value for the price, and organizations in the Midwest had lower satisfaction with membership. Future research might attempt to understand these satisfaction differences, perhaps by comparing which ticketing service providers serve certain regions and if this has an influence. Looking towards Canada, there are significant differences in the usage of features and which features are considered very important. However, due to the somewhat homogenous sample of survey respondents, this is likely reflective of the ticketing software that over 60% used. 21
22 CHAPTER 3 ARTISTIC DISCIPLINE Arts organizations are uniquely defined by their discipline, particularly when comparing performing arts focused organizations to visual arts or multi-disciplinary organizations. Since there are expected audience and service differences across disciplines, we grouped organizations into the following two segments: 1. Those focused on the performing arts including dance, music, theatre, opera, and multi-performing companies, and 2. Those incorporating aspects outside of or in addition to performing arts including multi-disciplinary, visual arts, and other companies such as museums. 3 Chart 3.1: Breakdown of Discipline Groups Performing Arts Focused Not Performing Focused Dance Music Multi- Performing Opera Theatre Multi- Visual Arts Disciplinary Other Q49. Comparison by Discipline Group Results of the research suggest that on a broad perspective, organizations of all disciplines are using the same features and are equally satisfied with their ticketing software systems, though some unique differences exist in what features different disciplines deem important. Furthermore, comparing specific disciplines suggests 3 Sample sizes for the two groups are as follows: Performing Focused n=420 and Multi- Discipline/Visual/Other n=197 22
23 additional differences in what features are used and what are considered important, with music often presenting as a discipline with different needs and values. Chart 3.2 displays a comparison in the usage rates Chart 3.2: Few Differences in Feature Usage Across Disciplines between these two groups. There are no significant differences in usage between the two groups for nearly all of the features included in the survey. Reserved seating General admission Individual admissions Subscriptions/ packages Group sales There is a slight difference in usage of mail-in or fax 97 Performing Focused Multi-Discipline/ Visual/ Other purchases, such that performing arts focused groups report usage nine percentage points higher than the second group. On-site purchases Mail-in or fax puchases Performing Focused Phone purchases Website purchases Multi-Discipline/ Visual/ Other There are no significant Q19, Q20. Percent who reported using each feature. differences in satisfaction between the two discipline groups. Any slight differences that occur are generally fluctuation between the satisfied and very satisfied categories, with net satisfaction, displayed in the charts 3.3 and 3.4, showing little variation across these discipline groups. 23
24 Chart 3.3: Overall Satisfaction Levels by Discipline Ease of use Vendor support System updates Level of Value for the customization price Performing Focused Multi-Discipline/ Visual/ Other Q31. Percent satisfied or very satisfied with each aspect of their software. Chart 3.4: High Overall Satisfaction for Seating Features Across Disciplines Reserved seating General admission Individual admissions Subscriptions/ packages Group sales Performing Focused Multi-Discipline/ Visual/ Other Q32, Q33. Percent satisfied or very satisfied with each aspect of their software. 24
25 When asked to identify features that are important Chart 3.5: Performing Organizations More Likely to See Groups Sales as Very Important in a ticketing system, members of all disciplines generally agreed. There is a small difference of nine percentage points in group sales with performing arts focused organizations seeing this factor as more important. Usage rates did not differ among Reserved seating General admission Performing Focused Q39, Q40. Percent reporting each feature as very important. disciplines, and both groups rank this feature very highly. Individual admissions Subscriptions/ packages Multi-Discipline/ Visual/ Other Group sales As discussed earlier, there is a small difference Chart 3.6: Performing Organizations More Likely to See Mail-In/Fax Purchases as Very Important between the two groups with regard to use of mail in or fax purchases. This trend was repeated with performing focused organizations seeing these features as more important compared to other On-site purchases Mail-in or fax puchases Performing Focused Phone purchases Website purchases Mobile purchases Multi-Discipline/ Visual/ Other organizations. Again, there is a nine-percentage point difference. Q41. Percent reporting each feature as very important. 25
26 Comparison by Discipline There are sufficient respondents in three disciplines, music, theatre, and multidisciplinary, to investigate them individually. In doing so, there are several more notable differences between these individual categories than the earlier two-way grouping. 4 As in the earlier analysis, reported use of mail-in or fax purchases features in the ticketing system differs, particularly between music and multi-disciplinary organizations. Music organizations draw an older audience on average that may be more inclined to order by mail. As reported by the NEA Survey of Public Participation in the Arts, classical music attendees skew older, with higher participation rates for those over 45 while museum or gallery attendees are more equally distributed across age groups. 5 Chart 3.7: Music Organizations Have Highest Usage of Mail-In or Fax Purchases On-site purchases Mail-in or fax puchases Phone purchases Website purchases Music Theatre Multi-Disciplinary Q21. 4 All other disciplines did not have sufficient samples sizes (n>100) to conduct more detailed analysis. 5 National Endowment for the Arts. How a Nation Engages with Art: Highlights from the 2012 Survey of Public Participation in the Arts. National Endowment for the Arts. Sept Electronic PDF. Accessed April 3,
27 To defray the costs of maintaining ticketing Chart 3.8: Usage of Shared Services Varies Among Disciplines software, arts organizations in some cities may establish shared services to jointly maintain websites, call centers, or box office staffing Q26. Shared website Group call center Shared box office Music Theatre Multi-Disciplinary used by all organizations involved. There are notable differences in usage of shared services, something not evident when comparing only two groups. Regarding shared websites, multi-disciplinary organizations have a usage rate 10 percentage points higher than music and theatre organizations. For shared box offices, theatre organizations have a 12 to 14 percentage point lower usage rate compared to music and multi-disciplinary organizations. These differences suggest important trends, needs, or environments between the practices of the different types of organizations. Use of automated sales reporting also Chart 3.9: Usage of Automated Sales Reports Varies Among Disciplines varies by discipline. Music organizations are more likely to use automated reports, with 87% saying they use this feature compared to 78% of theatre and 79% of Q27. Membership Donations Customized sales Automated sales reports reports Music Theatre Multi-Disciplinary 27
28 multi-disciplinary organizations. However, there is no difference in usage of customized reports. Chart 3.10: Usage of Barcoding Varies Among Disciplines There is also a difference in the use of barcoding when looking between the different disciplines. Music Ticket Forgery Prevention Barcoding Seat mapping Refunds Exhanges Ticket printing (by org.) At-home printing organizations are Music Theatre Multi-Disciplinary more likely to use this feature than Q28. multi-disciplinary organizations (69% vs. 59% respectively), and theatre organizations, where only 52% report using this feature. Turning to how satisfied organizations are with Chart 3.11: Satisfaction with Features Shows Some Variance Among Disciplines their system, there is variation across disciplines. However, differences in satisfaction are not linked to feature use patterns. Music organizations are more Reserved seating General admission Individual admissions Subscriptions/ packages Music Theatre Multi-Disciplinary Group sales satisfied with subscriptions and Q32, Q33. Percent saying that they are very satisfied with each feature. package features than theatre and multi-disciplinary organizations. 28
29 Chart 3.12: Satisfaction with Subscriptions/Packages Varies Among Disciplines Multi-Disciplinary Theatre Music Very satisfied Both satisfied and dissatisfied Very dissatisfied Satisfied Dissatisfied Don't Know Q32, Q33. Based on those who use each feature. Membership also shows a significant difference in satisfaction, with 14 percentage point lower rate among music organizations compared to theatre and multi-disciplinary. Chart 3.13: Satisfaction with Membership Features Varies Among Disciplines Membership Donations Customized sales reports Automated sales reports Music Theatre Multi-Disciplinary Q35. 29
30 Chart 3.14: Satisfaction with Membership Varies Among Disciplines Multi-Disciplinary Theatre Music Very satisfied Both satisfied and dissatisfied Very dissatisfied Satisfied Dissatisfied Don't Know Q35. There is also a small difference in refund satisfaction, particularly between theatre and multi-disciplinary organizations. Chart 3.15: Small Differences Exist in Satisfaction with Refunds Ticket Forgery Prevention Barcoding Seat mapping Refunds Exhanges Ticket printing (by org.) At-home printing Music Theare Multi-Disciplinary Q36. 30
31 There are also differences in what Chart 3.16: Slight Differences Exist Among Importance of Features features organizations view as very important. Group sales are less likely to be deemed very important by multi-disciplinary organizations than theatres. However, Reserved seating General admission Individual admissions Subscriptions/ packages Music Theatre Multi-Disciplinary Q39, Q40. Percent saying each is very important. Group sales the vast majority of all organizations name each of these features as very important, so differences are slight. Along with differences in usage, Chart 3.17: Importance Ratings Vary for Mail-In/Fax and Mobile Purchases there are also differences in the importance ratings for mail-in or fax purchases as a feature of a ticketing On-site purchases Mail-in or fax puchases Phone purchases Website purchases Mobile purchases system. Over half (58%) of music organizations see this Music Theatre Multi-Disciplinary Q41. Percentage saying each feature is very important. feature as very important 10 percentage points higher than theatres and 13 percentage points higher than multi-disciplinary organizations. 31
32 A significantly higher proportion of multidisciplinary and theatre organizations feel mail-in or Chart 3.18: Importance of Mail-in or Fax Purchases Multi-Disciplinary Theatre Music Very important Somewhat important Not very important Not at all important Don't Know Q fax purchase features are not very important or not at all important. This likely relates to the trend of music organizations serving generally older audiences, as discussed earlier. The second chart shows that while fewer theatre organizations view mobile purchases as very important, many still see these features as somewhat important. There is also a significant difference in views of mobile purchase features. Multidisciplinary organizations see these features as more important than both music and theatre organizations; 91% of multi-disciplinary organizations say this is very important, compared with 83% of music organizations and 80% of theatres. Chart 3.19: Importance of Mobile Purchases Very important Somewhat important Multi-Disciplinary 91 8 Theatre Music Q41. 32
33 There are also significant Chart 3.20: Importance of Features Varies by Individual Discipline differences in ticket forgery prevention, barcoding, and at-home printing. These differences in barcoding and Ticket Forgery Prevention Barcoding Seat mapping Refunds Exhanges Ticket printing (by org.) Music Theatre Multi-Disciplinary At-home printing at-home Q42. printing correspond with the differences in usage noted earlier. While the majority of Chart 3.21: Comparison of Importance of Barcoding theatre Multi-Disciplinary organizations Theatre see barcoding Music as somewhat Very important Somewhat important Not very important important, a Not at all important Don't Know significant percentage Q42 views it as not very important. This trend was also seen in the ticket forgery prevention and at-home printing. Conclusion When comparing by the broader discipline groups, there are few significant differences in usage, satisfaction, or importance. This suggests that organizations are becoming more standardized in their usage of ticketing software features despite differences in the demographics of the audiences served. 33
34 When comparing by individual disciplines, differences do exist, with these differences seeming to align with the average age of the discipline s audience. Mail-in or fax purchase features had higher usage rates and were considered more important among music organizations. Music organizations also had higher usage of automatic sales reports and barcoding. Barcoding features had higher ratings of very important among music organizations, but music, theatre, and multi-disciplinary organizations had equal views of the importance of automatic sales reports. The importance of at-home printing and ticket forgery prevention were considered very important among a higher number of music and multi-disciplinary organizations. Other notable differences in views of importance among features are higher ratings of group sales among theatres and higher ratings of mobile purchases among multi-disciplinary organizations. Overall, usage of shared services are generally low. However, usage of shared websites is higher among multi-disciplinary organizations and shared box office rates are higher among music and multi-disciplinary organizations. It will be important for both organizations and ticketing software vendors to understand these usage trends as they relate to what features are considered important. This may suggest future needs or changes in usage, especially looking toward automatic sales reports or at-home printing. Future research could provide a deeper analysis within other specific disciplines as this seems to be where the greater differences lie. 34
35 CHAPTER 4 BUDGET SIZE From staff to space, the needs and resources available to an organization often vary by budget size. Ticketing systems are no exception. When AMT Lab s 2015 Ticketing Survey results are compared by organizational size, interesting patterns in the use, satisfaction, and importance of each ticketing feature emerge. Responses were categorized into four broad budgeting categories for better comparison: those with an annual budget of <$999,999 ( low budget ), $1 million - $4,999,999 ( low-mid budget ), $5 million - $9,999,999 ( mid-high budget ), and >$10 million ( high budget ). In a notable change from our 2011 and 2009 surveys, website transactions outranked in-person and phone call transactions as the most used and valued method of ticketing. Mobile ticketing, while highly valued, received limited use. Low budget organizations (those that earn <$999,999 annually) use less and derive less satisfaction from group sales, subscriptions and packages compared to those earning more. Barcoding and ticket forgery remain among the least frequently used and valued features since the National Ticketing Survey began in 2009, especially in low budget organizations. Unfortunately, because of limited responses the survey results provided few insights on the use, satisfaction, and importance of any CRM integration by a ticketing system. With 89% of users noting use of their ticketing system for donor-related activities, a unification of operations seems to becoming an industry standard, with few organizations requiring integration features. 35
36 The use of donation and membership features often increased with budget size. Yet the largest organizations (mid-high and high budget organizations) were the least satisfied but the most very satisfied with these two features. Further inquiry into how donor-related transaction features address the needs of organizations in an environment of decreasing subscriptions offers an excellent area for further research. When analyzing how respondents use and value each feature it was important to consider what ticketing systems they use. Tessitura remained the most common ticketing system for organizations earning more than $5 million. For those earning less, Arts Management Systems and Center Stage Software were the most common systems reported. A full list of reported systems is available in the topline in Appendix III. The smallest budget organizations face an additional Chart 4.1: Volunteers Use Software at Nearly Half of Low-Budget Organizations challenge: volunteer staff frequently uses their ticketing systems. Over four-in-ten (44%) organizations with budgets under $1 million report that volunteers use their ticketing system; among all other budget size groups, no more than a quarter say this. There is, however, no Q16 Use ticketing system Do not use ticketing system Don't know Total >$10 million $5 million - $9,999,999 $1 million- $4,999,999 < $999,999 26% 24% 23% 20% 44% 67% 67% 71% 75% 54% 6% 8% 7% 5% 2% difference among any budget groups on full or part time employees, indicating that the smallest organizations likely face a unique challenge in training unpaid staff on system features. 36
37 Transaction Types From box office sales to online purchasing, organizations have the power to process tickets in a manner that best suits their needs and the needs of their audiences. AMT Lab s 2015 Ticketing Survey revealed that onsite, phone, and website purchase methods are by far the most popular. Over 96% reported using their ticketing systems for each onsite, phone, and website purchases and over 95% of respondents referred to the ability to process each of these types of transactions as critically important. By far, website transactions ranked highest in importance. Overall, 99% of all respondents responded in this matter, including 100% of respondents from mid-high budget organizations. Mail-in and fax transactions were used least frequently. Overall, 88% of respondents reported using their ticketing systems to process mail-in and fax purchases. When examined by budget size, there is a notable shift in mail-in and fax transaction use between organizations earning less than $1 million annually and organizations earning more. Only 78% of respondents from low budget organizations said they use this feature, compared to 91% or more of respondents from organizations earning >$1 million. Not only do lower budget organizations use their ticket systems to process fewer mail and fax transactions, but 13% of respondents note their ticketing system does not have the capability to process these types of transactions. Even though use rates of mail-in and fax transactions increased in organizations earning more than $1 million, rates of importance increased only as respondent s annual organizational budget surpassed $10 million. Organizations earning less than $10 million annually attributed less importance to mail and fax transactions by percentage points. About 30% of low budget organizations deemed mail-in and fax transactions as not important compared to only 13% of respondents from high budget organizations. 37
38 Chart 4.2: Use and Importance of Mail-in and Fax, and Mobile, Ticketing Functions Very important Use feature 96% 91% 93% 90% 91% 87% 78% 80% 72% 65% 61% 57% 49% 49% 44% 46% Mail-in/Fax Mobile Mail-in/Fax Mobile <$999,999 $1 million - $4,999,999 $5 million - $9,999,999 >$10 million Q21, Q22. Mobile purchase processing ranks 4 th in importance overall, beating out only mail-in and fax purchasing of the five transaction types examined. Of all respondents, 86% said mobile was very important, compared to just 51% for mail-in and fax purchase capabilities. The importance of mobile purchasing varies significantly across differently sized organizations. Organizations earning >$1 million annually value this feature as very important, with mid-high budget organizations valuing this transaction type the most (96%). When budget size was <$1 million, only 72% of respondents said this feature was very important. Moreover, 22% of respondents from low budget organizations say mobile purchasing features is only somewhat important. While mobile is deemed higher in importance compared to mail-in and fax, use of mail-in and fax significantly (88%) outpaces mobile ticketing capabilities (62%). Mobile usage dramatically increases as 38
39 budget size increases, from 46% in low budget organizations to 80% in high budget organizations. The value of digital ticketing methods has outpaced traditional methods, especially for those in the performing arts. According to the 2015 Museum and the Web Conference, Museums online sales account for only 7-20% of their total ticket revenues. According to survey data, website transactions currently outrank phone and on-site purchasing methods in both use and importance. Mid-sized and large organizations predominantly use mail-in and fax features but only the largest organizations (those earning >$10 million annually) attribute significant importance to this feature. Although mobile transaction received high rates of importance, comparatively low usage rates demonstrate that organizations are still working to incorporate mobile transactions into their online presence. Development and Reporting Ticketing Features Building audiences and donors is critical for arts organizations long-term viability. Reporting on audience development and engagement informs everything from budgets to programming decisions. The availability of development-related functions, like memberships and donations, as well as reporting functions, like automated and customized reports, in a ticketing system enables arts managers to draw informed conclusions and execute data-driven actions Overall, 89% of respondents used their ticketing system s donation functions, while 74% used its membership functions. It is therefore not surprising that a mere 9% of respondents note the use of their ticketing system s CRM integration features. This indicates a significant shift to a unified approach to customer relations. Unfortunately, due to the low response for those using integration, we were unable to explore CRM usage and satisfaction further. 39
40 Generally, the use of a ticketing system for development functions is Chart 4.3: Use of a Ticketing System For Development, Membership, and CRM Functions Across Budget Size linked with organization budget size. For instance, 56% of respondents from low budget organizations 88% 84% 74% 71% 56% 100% 97% 88% 89% 75% reported using their ticketing system s membership features. This number steadily grew to 88% of respondents from high budget organizations. 10% 11% 9% 0% 0% Membership Donations CRM Integration <$999,999 $1 million - $4,999,999 $5 million - $9,999,999 >$10 million Total Q10. Based on those who used each feature. This pattern remained consistent for memberships, donations, customized reports, and automated reports. As with use, respondent satisfaction of a ticketing system s donation and membership functions often increased as budget sized increased, with mid-high budget organizations reporting the most use. It is possible that this trend is related to the ticketing systems used by organizations of various sizes. Customized and Automated Sales Reports Customized sales reporting functions were more frequently used (92% overall) compared to automated sales reporting functions (80% overall). While respondents report roughly even use of customized sales reports across budget sizes, satisfaction of this feature varies. Higher overall dissatisfaction (combined dissatisfied and very dissatisfied) and lower overall satisfaction was most commonly reported in organizations earning <$10 million. Respondents from low-mid sized organizations reported the highest combined dissatisfaction (16%) and the lowest combined satisfaction (51%). 40
41 Chart 4.4: Combined Satisfaction and Dissatisfaction of a Ticketing System s Customized Reporting Feature 15% 16% 14% 7% 63% 51% 58% 67% <$999,999 $1 m - $4,999,999 $5 m - $9,999,999 >$10 m Combined satisfaction Combined dissatisfaction Q35. Based on the satisfaction of those who used customized reports. The use of automated sales reports varies Chart 4.5: Use and Satisfaction of Automated Sales Reports by Organization Size across organization size, steadily Total 36% 80% increasing 23 percentage points, from low budget >$10 million $5 million - $9,999,999 44% 41% 91% 85% (68%) to high budget organizations (91%). Satisfaction rates of $1 million - $4,999,999 <$999,999 29% 28% 77% 68% automated reports Very satisfied Use of system add dimension to this trend: respondents Q27 and Q35. Satisfaction figures based on those who used system. from low and low-mid budget organizations report being very satisfied 12 percentage points less than mid-high and high budget organizations. 41
42 When assessing donation and reporting functions, use and satisfaction rates commonly correlated with budget size, increasing as budget increased, demonstrating the challenging constraints on organizations earning less than $5 million. Reserved Seating and General Admission Both reserved seating and general admission options ranked high in usage overall, with 96% and 94% of respondents reporting using each type of seating, respectively. However, some differences emerge when evaluating the satisfaction and importance of these ticketing options by budget. Reserved seating and general admission Chart 4.6: Organizational Satisfaction Rates of Reserved Seating Ticketing Functions functions ranked similarly in overall importance (96% and 89%, respectively). However, an inverse 44% 38% 31% 54% 28% 59% 20% 67% relationship between being satisfied and <$999,999 $1 million - $4,999,999 $5 million - $9,999,999 >$10 million very satisfied across Satisfied Very Satisfied budget size. Low budget organizations Q32. Based on those who use reserved seating. frequently report that they are satisfied more than very satisfied, while the inverse applied to high budget organizations for both reserved seating and general admission options. For instance, 38% of respondents from low budget organizations are satisfied with their reserved seating options, while 44% were very satisfied. Conversely, only 20% of respondents from high budget organizations were satisfied while 67% of them were very satisfied. 42
43 While respondents attribute critical Chart 4.7: Somewhat and Very Important Ratings of General Admission Functionality by Size importance to reserved seating Total 8% 89% overall (96%), smaller organizations >$10 million 9% 88% attribute greater $5 million - $9,999,999 11% 85% importance and less $1 million - $4,999,999 10% 89% ambivalence to their ticketing system s <$999,999 3% 93% general admission Somewhat important Very important functions. Once organizations surpass Q39 $1 million in annual budget ambivalence toward general admission ticketing capabilities increase by 7 percentage points. This likely indicates that smaller organizations use general seating, more than larger organizations. Larger organizations are more likely to have larger spaces and use reserved seating to maximize the use of those spaces. Individual Admission, Subscription/Packages, and Group Sales In attracting and cultivating different audiences, organizations must often address different engagement behaviors, like frequency of attendance and attending with guests. The 2015 Ticketing Survey asked respondents about their ticket system s ability to address individual admissions, subscription/packages, and group sales. Individual admissions ticketing capabilities ranked highest in importance and use by far. Overall, 99% of all respondents use individual admissions and 100% of respondents ranked the ability to process individual admission tickets as critically important for a ticketing system to perform. 43
44 Subscription/packages was ranked second in critical importance (91% of all respondents), and group sales in third (86%). When examined by budget size, organizations earning >$1 million more frequently rank subscriptions/packages as very important, with mid-size organizations valuing it the most. Responses for group sales follows a similar pattern, with importance steadily increasing from low budget to high budget organizations. Chart 4.8: Importance of Subscription/Packages by Size Somewhat important Very important <$999,999 $1 million - $4,999,999 $5 million - $9,999,999 >$10 million 10% 4% 3% 5% 83% 96% 94% 91% Q40 Chart 4.9: Importance of Group Sales by Size Somewhat important Very important <$999,999 $1 million - $4,999,999 $5 million - $9,999,999 >$10 million 16% 10% 11% 5% 79% 85% 87% 93% Q40 44
45 Use rates for both of these features Chart 4.10: Use of Subscription/Packages and Group Sales by Size mirror the pattern in importance rates of subscription/ packages: Subscriptions/ packages and group sales usage both increase by 14 percentage Subscriptions/Packages <$999,999 $1 million - $4,999,999 $5 million - $9,999,999 >$10 million Q20 Group Sales 79% 82% 93% 96% 97% 97% 92% 98% points each once budget size surpasses $1 million. Together with importance, this data suggests that once organizations reach a certain annual budget size, and likely a corresponding audience size, the necessity of subscriptions and packages and group sales for audience development becomes more significant. Overall, the combined satisfaction ( satisfied and very Chart 4.11: Dissatisfaction With Individual Admission, Subscription/Packages, and Group Sales by Organization Size satisfied ) of responses from each group sales (75%), subscription/ packages (67%), and individual admissions (88%) indicate >$10 million $5 million - $9,999,999 $1 million - $4,999,999 <$999,999 4% 9% 4% 8% 14% 4% 4% 9% 1% 9% 20% 6% general satisfaction with each feature. Group sales Subscription/packages Individual admission Q33. Based on those who used individual admission, subscription/packages, and group sales ticketing functions. 45
46 Across each of these ticketing features, low budget and mid-high budget organizations were the most consistently dissatisfied. Low budget organizations Chart 4.12: Satisfaction Rates of Individual Admission Ticketing Functions by Organization Size experienced the greatest general satisfaction regarding both individual admission and group sales ticketing functions but the lowest high satisfaction. Meanwhile, high Q35. 51% 53% 37% 37% <$999,999 $1 m - $4,999,999 60% 61% 26% 26% $5 m - $9,999,999 >$10 million Very Satisfied Satisfied budget organizations report being the most very satisfied. Even though this trend mimics the pattern seen in the satisfaction rates of reserved seating and general admission there is a noteworthy distinction: in both individual admission and group sales there is roughly a 10 percentage point increase in general satisfaction in lower budget organizations. For example, in chart 4.11, general satisfaction drops 11 percentage points from low-mid and mid-high budget organizations. Similarly in group sales, low budget organizations report 45% general satisfaction, a 10 percentage point increase over every other budget category. Use, value, and satisfaction of these three ticketing features, especially group sales and subscription/packages, increase as budget increase. 46
47 Seat Mapping, Ticket Exchanges and Ticket Printing Over 90% of all respondents use their ticketing system for each seat mapping, exchange, and ticket printing by the organization. The use rates remained consistently high across budget sizes for each of these features, and rates of importance largely correlated with the budget size of the organization. For instance, 84% of respondents from small organizations say ticket printing by the organization is very important and this frequency steadily increases to 94% of respondents from high budget organizations. Overall combined satisfaction for each of these features remained high: seat mapping (75%), exchanges (80%), ticketing printing by the organization (82%). For both seating mapping and exchanges, respondents from organizations earning <$10 million report slightly higher rates of combined dissatisfaction and neutrality. Chart 4.13: Dissatisfaction and Neutral Satisfaction Rates of Seat Mapping Total 2% 15% >$10 million 1% 11% $5 million - $9,999,999 7% 16% $1 million - $4,999,999 9% 19% <$999,999 9% 15% Combined dissatisfaction Both satisfied and dissatisfied Q36. Based on those who used seat mapping. 47
48 Chart 4.14: Combined Dissatisfaction and Neutral Satisfaction Rates of Exchanges Total 4% 12% >$10 million 3% 7% $5 million - $9,999,999 $1 million - $4,999,999 3% 3% 13% 16% <$999,999 7% 13% Combined dissatisfaction Both satisfied and dissatisfied Q36. Based on those who used exchanges. At-Home Printing and Refunding Overall, use of a ticketing systems at-home printing and refunding features appears to correlate with organization size. Only 80% of respondents from low budget organizations use their ticketing systems refund functions compared to 98% of midhigh budget respondents This likely indicates that either respondents either do not have the need for refunding functionality in their ticketing system or it is difficult to incorporate and use. Similarly, only 40% of respondents from low and low-mid budget organizations use at-home ticket printing compared to 71% of respondents from high budget organizations. Importance of both ticketing features to a respondent correlates with an organization s size. At-home printing saw the most neutral satisfaction overall (17%). Organizational size largely correlates with satisfaction. One exception, however, is the comparatively low responses of being very satisfied in mid-high budget organizations (23%) compared to high budget organizations (40%), representing a 16 percentage point dip. Similarly, the amount of respondents that ranked at-home printing as very important jumps 17 percentage points between mid-high and high budget organizations. Satisfaction rates 48
49 with a ticketing system s refunding feature were far more predictable across organization size, steadily increasing as budget size increased. Ticketing Forgery Prevention and Barcoding The feature with the least amount of use overall was ticket forgery prevention: only 26% of respondents reported using it. When broken out by budget size, it s plain to see that low budget organizations don t have a need for it, as only 14% of respondents say they use this feature, whereas 40% of respondents from high budget organizations use it. An even wider disparity is present when examining the use of barcoding: 32% of respondents from low budget organizations use barcoding compared to 83% of respondents from high budget organizations. Even with a higher use rate, smaller organizations either don t have an immediate need for barcoding features in a ticketing system compared to larger organizations, or are unable to afford the requisite scanners. The use rates of ticket forgery and Chart 4.15: Importance of Ticket Forgery Prevention Features by Size barcoding features mirror general Very Important Not Important views of these <$999,999 41% 18% features. Only 41% of respondents from each organization $1 million - $4,999,999 $5 million - $9,999,999 >10 million 40% 39% 61% 5% 9% 3% size earning less than $10 million Q42 annually note that ticket forgery features are very important. Meanwhile, 61% of respondents from high budget organizations said this feature is very important. In fact, 49
50 18% of respondents from smaller organizations said ticket forgery features are not at all important in a ticketing software. Similar to satisfaction rates of ticket forgery features, there is a 20 percentage point jump in satisfaction rates between organizations earning less than $5 million (56%) and more than $5 million (76%). Evaluation of ticket forgery corresponds to organization size. Just under one-fifth of respondents from small organizations (16%) categorize this feature as not very important whereas 82% of respondents from large organizations say it s very important. Satisfaction of ticket forgery features varied by budget, with mid-high budget organizations ($5 million - $9,999,999 annually) reporting the most neutral (23%) and negative (7% dissatisfied) responses. Only 30% of these respondents were satisfied, compared with 43% of respondents from high budget organizations. Interestingly, 53% of respondents from low budget organizations were also satisfied with their ticketing system s ticket forgery features, even though low-budget organizations have lower usage rates and similar levels of perceived importance. Similar to ticket forgery prevention Chart 4.16: Importance of Barcoding Features by Size features, mid-high budget Very Important Not Important organizations <$999,999 39% 16% reported limited satisfaction with barcoding: only 37% of $1 million - $4,999,999 $5 million - $9,999,999 >10 million 56% 76% 82% 6% 4% 1% respondents from this budget Q42 50
51 category were very satisfied, compared to 47% of respondents from high budget organizations. Low budget organizations report slightly lower levels of satisfaction with their barcoding features; however, given the 40 percentage point difference in use and perceived importance of barcoding features between low budget and high budget organizations, it s possible that low budget organization have access to the resources necessary to optimize the capabilities of this feature. Conclusion Larger organizations, in general, can afford enterprise systems, like Tessitura, to support greater feature requirements, such as mobile purchase support or barcoding. Larger organizations can also afford system upgrades, customizations, and technical support, thereby increasing the likelihood of satisfaction. Smaller organizations have to prioritize what technology they invest in. Generally, organizations with annual budgets below $5 million indicate lower satisfaction than organizations with a larger budget. Satisfaction in automated sales reports, ticket forgery, and group sales increases notably once budget surpasses $5 million. Despite this gap, importance rates were typically similar. More exploration is needed to understand how budget drives differential use cases for arts organizations. 51
52 CHAPTER 5 MOBILE TECHNOLOGY The rapid acceleration of smart phone ownership and use over recent years has dramatically altered consumers buying behavior. Adoption of mobile phones by adults grew a staggering 23% between 2011 and Now that 64% of all US adults own a smartphone, 7 ticketing systems, like Tessitura and Arts Management Systems, have integrated features to enable organizations to collect purchases from mobile phones, cater to mobile phone users, and capture buyer information. In our survey, 14% of organizations reported that they had a mobile-friendly website (26%), mobile app (6%), or both (32%). AMT Lab s 2015 Ticketing Survey shows variation in the use of a ticketing systems mobile phone applications, mobile-friendly websites, and mobile purchasing analytics by budget size of organizations. The surge in mobile phone adoption across the broader Chart 5.1: Ticket Sales by Purchasing Method 6.2% public does not necessarily translate into mobile ticket 15.5% 28.4% 42.7% purchases. 7.2% In fact, when asked to estimate the percentage of Web Mobile Phone In person or at box office Mail or fax Q21. Based on those who track mobile ticket sales Figures show the average percentage of sales reported from each method
53 ticket sales from a variety of sales channels, on average, organizations reported that only 7.2% of annual ticket sales are mobile sales. The larger the organization the more Chart 5.2: Majority of Orgs Have App or Mobile Site for Purchases frequently respondents reported Total 25% 6% 31% 23% 15% their system offered < $999,999 16% 7% 23% 30% 24% some kind of mobile $1 million-$4,999,999 26% 6% 24% 27% 16% functionality, namely $5 million - $9,999,999 28% 6% 32% 29% 6% a mobile-friendly >$10 million 28% 6% 46% 8% 12% website or a smart phone app. Almost 30% of respondents from low budget organizations Mobile-friendly website ONLY Smartphone app ONLY Both Neither Don't know Q22. Based on those who track mobile purchases. reported that their ticket system offered neither of these features. Surprisingly, a similar number of respondents from each category of organizations earning less than $10 million annually report similar access or lack thereof to these features. High budget organizations (earning >$10 million annually) appear to have the most amount of access to both these features. Together this demonstrates that these features are not universally available on all ticketing systems and other factors, like available resources (time, trained staff, etc.), play a critical role in utilizing mobile ticketing functions. When examined by budget size, over 80% of respondents from every budget category reported mobile ticket accounted for as little as 10% of their total sales volume. The use of mobile devices in ticketing purchases may be small compared to web and phone sales however, as one respondent put it, It would be wrong to say that mobile is the future, mobile is the NOW and if I want to throw my phone across the room when 53
54 I'm trying to walk a customer through the process, I can only imagine what a customer feels who doesn't know my venue like I do. Sale or no sale, Chart 5.3: Mobile Ticket Sales audiences are learning about, and interacting Total 88% 12% with, arts >$10 million 88% 12% organizations and their $5 million - $9,999,999 83% 17% offerings via $1 million-$4,999,999 95% 5% mobile at a tremendous < $999,999 82% 18% rate. Between 2012 and 2013, arts <=10%/ Total >10%/ Total Q29. Based on those who use mobile devices for ticket sales. organizations saw a 36 percentage point increase in the amount of web traffic to their website from a mobile device, including smartphone and tablets. In 2013, 55% of organizations saw approximately 30%-50% of their web traffic come from mobile devices, compared to 36% of organizations in Consequently, more arts organizations are implementing mobile marketing campaigns. In one year alone, the amount of art organizations offering a mobile-friendly website increased 17%, surging from 45% in 2012 to 65% in Importance Respondents from all organization sizes consistently reported the support of mobile purchases by their ticketing system as very important, however this varies somewhat depending on budget size. 54
55 Small budget organizations value Chart 5.4: How Important it is For a Ticketing System to Support Mobile Purchasing their ticketing system s mobile Total 12% 86% purchase features least, with 72% of respondents report >$10 million $5 million - $9,999,999 9% 4% 90% 96% it being very $1 million- $4,999,999 11% 87% important and 22% reporting it only as somewhat < $999,999 22% Somewhat important 72% Very important important. Q41. Based on those who use mobile devices for ticket sales. However, even though low budget organizations valued mobile ticketing support least, the majority of respondents still attributed immense importance to this feature of their ticketing system. Larger organizations attributed the highest importance, with over 90% of respondents from both the mid-high and high budget organizations reporting this feature as very important. Inability to track mobile purchases or Chart 5.5: Availability of Mobile Purchase Tracking Capabilities the lack of awareness of how to track Total 33% 35% 33% through a ticketing >$10 million 57% 20% 23% system in smaller $5 million - $9,999,999 36% 43% 20% organizations likely relates to the ticketing systems $1 million - $4,999,999 <$999,999 23% 13% 43% 37% 40% 43% used and features available at lower price points. Yes No Don't know Q23. Based on those who track purchases made on a mobile device, like a smartphone or tablet. 55
56 The User Experience Organizations that use their ticketing systems for mobile ticketing were asked about the frequency with which they test the user experience of making a purchase with a mobile device. Respondents of lowbudget organizations tested their user Chart 5.6: Frequency of Testing the User Experience of Mobile Ticketing in Low and Low-Mid Budget Organizations experiences least frequently, with 34% of respondents never testing and 21% 34% 27% 21% 15% 29% 34% testing about once a year. Interestingly, about 29% of respondents from low budget organizations also report testing more than once a Never Around once a year More frequently than once a year <$999,999 $1 million-$4,999,999 Q25. Based on those who use system for website purchases. year. This divide is worth exploring in future research to understand what resources help smaller organizations address the user experience and efficiency of an organization s technology. There is a noteworthy divide among respondents of low-mid budget and mid-high budget organizations when asked about how frequently they test their mobile ticketing user experiences. About 50% of respondents from mid-high budget organizations test user experience more than once a year yet only 34% of respondents from low-mid budget organizations tested as frequently. A similar 20 percentage point drop appears among respondents who report never testing user experiences: 27% of low-mid budget organizations never tested the user experience whereas only 7% of mid-high budget organizations never tested. 56
57 Chart 5.7: Frequency of Testing the User Experience of Mobile Ticketing in All Budget Categories Total 19% 16% 43% 22% >$10 million 5% 9% 60% 25% $5 million - $9,999,999 7% 23% 51% 19% $1 million - $4,999,999 27% 15% 34% 23% <$999,999 34% 21% 29% 17% Never Around once a year More frequently than once a year Don't know Q25. Based on those who use system for website purchases. Disparities in user testing, access to, and awareness of mobile ticketing functions between the two mid-budget organization categories echo existing reports on the unique organizational and financial struggles of mid-sized organizations. During a workshop hosted by Grantmakers in the Arts on the needs of mid-sized organizations, Ben Cameron, the Program Director for the Arts at the Doris Duke Charitable Foundation, suggested these organizations are expected to perform like the big guys but with the limited infrastructure of the little guys. 8 Further investigation comparing the resources necessary to support organizations of these two budget sizes may explain these patterns. The size of the organization appears to directly contribute to the amount of attention spent on user testing. Larger organizations report consistent frequent testing. Over 50% of respondents from both mid-high and high budget organization reported testing
58 its mobile purchasing experience more than once a year, meanwhile 34% of the smallest organizations spend no time worrying about that aspect. Conclusion While smartphone adoption is skyrocketing across the US and mobile marketing is on the upswing, mobile ticket purchases represent a surprisingly small percentage of total ticket sales (7.2%). Even so, it is clear that organizations, regardless of size, value its importance in the field. Tracking mobile purchases and use of mobile ticketing purchases by all organizations demonstrate a growing interest in a ticketing system s mobile features. Currently, the use and testing of such features, like a mobile-friendly website or mobile app, varies greatly by organization size, as does an organization s awareness of these features in a ticketing system. Further research into these trends could reveal patterns in organizational support needs as well as limitations of specific ticketing systems. 58
59 CHAPTER 6 THE FUTURE The 2015 ticketing survey asked respondents to name the one thing they would most like to change about their current ticketing system. From custom reports to data extraction to patron seating selection, hundreds of responses streamed in. In order to detect trends in respondents ticketing system needs, responses were grouped based on the ideas expressed in the responses. Frequently, respondents noted more than one item in need of attention. For instance, one Table 6.1: Ticketing System Features and Functions Needing the Most Alteration Feature or function Percent of respondents Ease of use/user friendly 10.5% Reporting 8.9% Custom reports 8.5% Software updates 7.9% Software interface (patron) 6.5% Web sales functionality 5.9% Customization capabilities 4.9% Subscription and membership capabilities 4.9% Learning/Training 4.7% Mobile 4.3% Seat map design 4.3% Technical support 4.1% Q37. Based on those who used each feature. See topline (Appendix III) for full results. Respondents were allowed to provide more than one answer. 59
60 respondent from a mid-high budget organization in the Midwest reported, It's a very powerful software program but the learning curve is long and never done. I guess that I would try to simplify the reporting system. The database is chock full of information but it can be fiendishly difficult to figure out the right questions and the correct manner to extract the information that one needs/wants. And, given the structural change that the database underwent with the last version, legacy data is sometimes a problem to locate/extract. To capture all of this valuable information responses with multiple ticketing system suggestions were categorized into multiple groups. Because of this, the total number of responses for this question rose to over 100%. Ease of Use Ease of use/user friendliness was the most frequent improvement requested of a respondent s ticketing system. Most simply responded with more user friendly, with one respondent from the Midwest asking developers to Just simplify everything. Clean looking and easy to understand. Issues relating to optimizing reporting features and training new employees were frequently tied back to confusing and needlessly complex navigation. Reporting General and customer reporting features ranked highest in top-of-mind importance for a ticketing system, immediately following ease of use. Easier building, printing, editing, saving, and creating customer-specific reports all cropped up as requested reporting improvements. As was making selected preferences stick so they don t need to be re-specified every single time from a low-mid budget organization as well as swapping out fields, pulling lists, and searching for reports. Overall, The canned reports do not always give our organization the information we need and the solution is almost always a customized report which costs a lot of money for what seems like simple data pulling noted a respondent from the southern region. 60
61 Table 6.2: Top Feature Needs by Budget Size Low budget (<$999,999) Low-mid budget ($1 million - $4,999,999) Mid-high budget ($5 million - $9,999,999) High budget (>$10 million) Software interface (patron) 15% Reporting 13% Ease of use 15% Technical support 16% Reporting 10% Ease of use 12% Custom reports 10% Custom reports 11% Custom reports 9% Custom reports 7% Web sales functionality 10% Web sales functionality 8% Ease of use 9% Patron seating selection 7% Software interface (patron) 10% Ease of use 6% Patron seating selection 9% Learning/training 7% Reporting 7% Reporting 6% Q37. Streamlined and expanded web and mobile sales functionalities were also at the top of many lists. Respondents requested improvements to everything from web and mobileresponsive interfaces, capabilities, donation integration, and affordable upgrades and technical support. Many reported patron user friendliness as critical, with one respondent from a mid-high budget organization in the western region noting patrons call us because they often can't figure out how to complete online purchases they've started. Final Ticketing System Comments For many arts goers purchasing a ticket is their first interaction with an arts organization. Before concluding the survey many respondents stressed the importance of making the patron s ticketing experience as intuitive and customer friendly as possible to set relationship building off on the right foot. One respondent from a lowmid-sized organization even went so far as to offer a personification for ticket system developers: Maud the box office manager that knew 15,000 of your 30,000 subscribers by name! 61
62 Arts managers depend on relationship building to support their organizations long-term. Whether a visitor is a first-time ticket holder or regular season subscriber many, respondents felt like their ticketing system could go a step further to help to cultivate these relationships. One respondent from a mid-high budget organization in the south wants to learn more of the ability of a ticketing software to capture one-time/firsttime visitor information in a CRM. Continuing, We need to understand who first visits the museum and then track their participation from a museum visit/special event into membership into donor. This is easier for 3-4 performance/season organizations but I need to track thousands of visitors and understand migration rates into member/donor. Another respondent from a high budget organization in the northeast seeks capabilities around tracking patron behavior (both ticket sales and donations), exporting data, and how the data is used. For instance, we have to extract our lists but the system is unable to deploy and track patron behavior because our database is so large so we have to use another deployment system and therefore, our patron behaviors are not fully tracked. This is problematic in a highly segmented marketing world. A ticketing system s ability to provide intuitive learning and use for operators, collect development-related information, and deliver a pleasant transactional experience for patrons are just a few of the criteria arts managers consider when selecting a ticketing system. Cost frequently was a barrier to upgrading features, investing in new systems, and overcoming existing technical issues. One respondent from a low-mid budget organization noted that for how difficult it was to use the system compared to how expensive it was training opportunities should come with the cost of the system. Shifts in the industry, like the advancement of technology and the slow nonprofit sector recovery from the economic recession, has thrown into focus the critical role ticketing systems play in connecting organizations to their audiences and how that work can be improved upon through feature redevelopment. 62
63 CHAPTER 7 METHODOLOGY AND FUTURE RESEARCH This survey was distributed to a wide variety of arts organizations through three main channels. First, service organizations were recruited to mail the survey to eligible organizations. Second, software vendors distributed to arts clients in the U.S. and Canada. Finally, individuals were recruited through AMTLab s website and social media channels. A total of 34 organizations volunteered to distribute the survey including 15 vendors and 19 service organizations from a variety of disciplines. The survey ran from February 1-March 9, Organizations who agreed to distribute circulated an with a description of the research goals and mission of AMTLab as well as a link to the survey. The survey introduction explained the research purpose and release plan of the survey. Those recruited through AMTLab s website or social media were sent the same directly from AMTLab. The survey was administered online, through Qualtrics. Respondents were sent reminder s twice during the field period, in the last two weeks of availability for the survey. Participation incentives were not offered, and respondents were asked if they would like a copy of the report. With over 1000 respondents starting the survey, 802 qualified arts organizations within the United States or Canada completed it. Screening questions to verify qualified respondents asked if respondents worked for an arts organization, personally used the ticketing software, and if the organization was located in the United States or Canada. Region analysis was conducted using the U.S. Census Bureau s regional division scheme. Definitions can be found at Budget and discipline categories were formed to have sufficient sample power for inferences. 63
64 There were several limitations faced in this analysis. A data error prevented the use of one battery of satisfaction questions. The main limitation of this approach is a nonrandom sample, which may not be representative of the overall arts landscape. With no solid benchmarks to compare our sample to, it is hard to assess the quality of the sample. Additionally, subgroup reporting on CRM use was not done due to the low sample size of users who reported using CRM integration or answered follow-up questions about CRM systems. Future Research AMTLab s goal in producing this survey was to produce a useful snapshot of the ticketing software field overall, while also exploring the new role that mobile purchasing plays for many arts organizations. Given the findings here, it s clear that many organizations are in fact satisfied with the basic functionality of their ticketing software, and are beginning to take advantage of mobile-friendly technologies, including responsive web sites and apps for ticket purchases. Further research would delve into additional ways in which mobile technology is impacting and mediating arts organizations interactions with their audience. Many of the features that were not standard in previous ticketing surveys have become standard among our respondents software packages, leaving open new avenues of research to explore additional demands of the ticketing software. When asked to elaborate about the features they would most like to change in their systems, many respondents discussed customization and reporting features. Understanding ways that reporting and analytics are part of the operating procedures of organizations, and what limitations they face in doing so. Additional research could look at the other software needs and practices of organizations as they relate to analytics, to understand the interactions between analytics and the arts. Moving 64
65 beyond just ticketing and understanding the data needs of arts organizations is a wideopen space for future work. When AMTLab first ran a ticketing survey in 2009, dissatisfaction levels with software were far higher than they are today. The broad levels of feature usage and satisfaction reported in the 2015 survey are a sign that as the industry has advanced, arts organizations may face entirely different technology challenges. 65
66 APPENDIX I TICKETING SYSTEM SELECTION CONSIDERATIONS Since our last survey in 2011, the market for ticketing systems has changed significantly. Although there are still a great number of solutions available, most systems will be expected to take on an increasingly broad range of data management tasks. In addition to standard tasks such as seat mapping, subscriptions, and sales reports, many systems also have significant CRM (Customer Relationship Management) functionality as well. Used correctly these systems can present a fuller picture of customer s relationships with your organization, including ticket sales, donations, and interactions with customer service. The newest systems are even beginning to look towards social media, monitoring channels for mentions of your organization by constituents with known handles. Although our data suggested general high satisfaction with ticketing systems across the board, selection can still be a daunting process. To assist, AMT Lab continues to advocate for a five-step process emphasizing first taking the time to understand organizational needs, and then specifically seeking out a vendor that matches these criteria. 1. Determine Needs Taking the time to reflect on your organization and articulate specific needs and priorities is a very important, and often overlooked step. Most modern ticketing systems have integrated CRM elements, so it is very important to include all relevant departments in the decision making process. A multi-departmental task force, including staff and board members, may be a good idea when preparing for such a major decision. Deploying a new system may mean significant changes in the everyday work flows of your staff members. While goals for an implementation will include providing a more positive experience for your patrons and more data in the hands of your staff, a poorly planned and implemented deployment can be very painful. 66
67 First, it makes sense to think of the general environment in which the system will be deployed. Below is a list of issues that you may wish to prioritize. Organizational Priorities Ease of use by your patrons & on what devices? Sufficient staff training Price for transition and annual maintenance Desired Level of customization Specific functions and features (see below) Brand recognition (this is assumed at this point) Recommendations from colleague (research into industry and local vendors?) Customer service (vendor support?) Integration or replacement of existing systems Required by a venue agreement Next, consider the specific needs you might consider in making your decision: Specific Needs Credit card processing Online sales Seat mapping/reserved ticketing General admission ticketing Subscriptions/season ticket capability Multi-user (multiple sellers can be logged in at once) At-home ticket printing for customers Security features (ticket forgery prevention) Barcodes/gate control Customer support/tech support for our staff 67
68 Subscription sales/discount packages Group sales Automated sales reports Customizable sales reports Ability to print images or logo on ticket Ability to add a suggested donation Integrates with our existing CRM / donor management system, if separate Includes a membership management module Includes a customer relationship / donor management module Mobile integration Social media integration Demand based pricing capability 2. Identify Vendors Armed with a ranked list of needs, you will have the necessary information to identify systems that maybe a good fit for your organization. A good first step would be to start with the systems commonly used by organizations within your budget category, but a full list of surveyed systems is included later in this document. Visit each system s website, speak to peers using their products to build understanding of the differences between each, compare the vendors to the checklist of needs identified in Step Contact Vendors Once you have decided on your finalists, it is time to contact the vendors directly and begin evaluating the competitiveness of their offerings and how willing they are to accommodate your specific needs. In addition to the questions below, you may consider asking about the following: Opportunities for a hands-on demonstration, allowing you to experience the system for yourself. 68
69 A list of client references matching your discipline and budget size. You can then contact these organizations about their experiences. Request a list of client s websites, allowing you to note specifically how the system is able to integrate with their platform and how it handles transactions and other function such as donations, if applicable. Sample Questions to Ask Customer/Tech Support What type of support is available? (e.g. online, phone, etc) Is there 24-hour support? If not, what options are available in the event of an after-hours emergency? What is the average response time to support requests? Is there a support fee? If so, how much does it cost, and what exactly does it cover? Data Integration Can the system handle both online and internal sales? If not, does the vendor partner with another ticketing software vendor to provide complementary services? What software does your organization currently use, and what capacity does the ticketing software have to integrate with your current software? What is the time frame for migrating data from the current system to the new system? What is the capacity to export data from the system, and in what format can it be exported? (e.g. Excel file, CSV, etc) Does this system include integrated functions (i.e. donor management, class registration, etc.) that could replace any of your current software? What fees are attached? Does this system have mobile solutions to sell tickets on all types of devices? 69
70 Will this system have the capability to integrate delivery or social media data? Can it integrate with other providers offering these services? (Mail Chimp etc.) How does the system parse subscriptions with or without reserved seating? Data Security and Storage Does the system provide PCI complaince? Is the data stored with the Vendor or on the organization s servers? Redundance? Infrastructure Is the software hosted online, or will your organization need a server to host it? If the software has cloud functionality, which features (if any) can your staff members access from their mobile devices? Is it purely cloud based or if local instances are required, what are the compatibility and system requirements Will the system require your organization to rent or purchase ticket-printing equipment? If the system uses barcodes, will your organization need to rent or purchase barcode scanners? Does the system provide at home printing? Price What is the set-up fee? Is there an annual license or maintenance fee? Are there any additional fees for your organization? (e.g. credit card processing fees, per-ticket fees, customer service etc.) What fees are charged to the customer? How much control will your organization have over setting those fees? 70
71 Reports What transactional data do you want to be able to analyze? What automated reports come with the system? Can you create custom reports on the fly? If the vendor will build custom reports for your organization, what is the customization process, cost and turnaround time? How does the system track the source of the sale? Staff Access How many user accounts are provided and at what cost? (i.e. How many people should be able to log in to the system at the same time?) How many user accounts come with the system? How do you add user accounts if your organization grows? How much do additional accounts cost? Can you customize the information or functions that individual users are able to access? What information can you draw from each user account? (e.g. daily sales activity, etc.) If the software is web-based, can the staff access it from the browsers (and browser versions) currently installed on their computers? User-Friendliness Are there hands-on demonstrations available online? Are demos available once your data is in the new system in order to train new employees? How much staff time can you expect to spend setting up events? Selling season tickets? Pulling reports? How easy is this system for online customers to navigate? 71
72 Is the web portal mobile adaptive? (Can your users easily purchase tickets on mobile devices as well as on computers?) 4. Make Your Decision After speaking with vendors and other users of your top ticketing systems, re-visit your list of priorities once more to evaluate which system best meets your needs. If you initially convened a cross-departmental team or staff and board task force to create this list of desires, this would be an appropriate phase of the selection process to re-engage these key stakeholders. A new ticketing system can provide your organization with significant benefits, but a successful roll-out depends on broad buyin. 5. Prepare for Installation Rolling out the new ticketing system is a major organizational change, so it s important to manage the process in an efficient and transparent manner. You may wish to consider the following factors: Does your chosen vendor offer any training? o If so, consider providing multiple opportunities for staff members to take advantage of these educational materials. A workshop several months before they actually can begin using the system is likely to do little except provide them with basic familiarity. Proper reference materials can be important to users before, during, and after the new system s roll out. o Think about how long it will take to train users on the new system as part of a deployment timeline. Ensuring that they have the proper time and support to adjust to their new workflow will prevent setbacks later on. How long will it take to transfer your data into the new system? o Migrating and cleaning old data can require significant time. Communicate with your chosen vendor about how much of this cleaning 72
73 and migration they are able to oversee and how much your staff will be responsible for. o Ensure that after the data has been migrated to the new system that records are intact and flagged appropriately. Especially in a modern system which is likely to have integrated CRM functionality, ensuring that accounts aren t duplicated and that all fields are populating correctly is important when trying to create a full picture of a constituent s relationship with your organization. Who will be responsible to create usernames for staff and configure their profiles? o Division of IT responsibility between the Vendor and your IT staff (or individual responsible for maintain the system) should be a point settled before a system is selected. Make sure you know who is in charge of account management, and that processes for adding and managing users are in place. o Ensuring your staff members have timely and full access to the new system will give them time to familiarize themselves at their own pace, even if the planned transition is slated to take place at some later date. How close are you to starting a new season? o Carefully consider when your system will be rolled-out. If, for example, your organization is dark during the summer then you might consider that timeframe as an ideal window. o Although data transitioning and initial system setup may certainly occur during your regular production timeframe, the disruptive and possibly chaotic transition itself is best schedules for a time of the year when it will disrupt the core of your business as little as possible. 73
74 o If at all possible, try not to have multiple systems operational at the same time for longer than is necessary. The presence of an old familiar option is likely to be attractive to staff members, and may inhibit their full adoption of the new system. 74
75 APPENDIX II SOFTWARE SYSTEMS INCLUDED IN THIS SURVEY ACME Ticket Agile Ticketing Solutions Arts Management Systems ASC Partners AudienceView AXS Digital Blackbaud Boca Systems BOM Advisors Canada Ticket Center Stage Software Chetu Choice Ticketing Systems ConfiTrack Enterprises Consolidating Printing CrowdTourch by Cvent DATA Tickets Diamond Ticketing Systems Easy-Ware Enta Ticketing Solutions Etix Fillaseat FutureTix Hold My Ticket InGate Solutions 75
76 Kount Little Buildings LoyaltyMatch Maxtrix Payment Systemss Microcorm MidwestTix National Ticket Company New Concepts Software Patron Technology Pogoseat Practical Automation Queue-it SeatAdvisor SendGrid SheerID ShoWare by VisionOne ShowClix Shubert Ticketing Spektrix Stimare Tessitura Ticket Envelope Company Ticket Philadephia Ticketfly TicketForce Ticketingbox Ticketmaster Ticketplan USA 76
77 Tickets.com TixTrack Toptix USA TRG Arts Turnstyles Ticketing UniversityTickets Vendini Venus Today Veritix Weldon, Williams & Lick Worldwide Ticketcraft Other 77
78 APPENDIX III SURVEY INSTRUMENT AND TOPLINE AMTLab 2015 Ticketing Software Survey February 1-March 9, 2015 N=952 All figures are percentages NO QUESTION 1 Q2 Are you currently employed by an arts organization (including college and university arts departments)? 93 Yes 7 No N = 952 ASK IF Q2=YES: Q3 Is the organization located in either the United States or Canada? 91 Yes, located in United States or Canada 9 No N=881 ASK IF Q3=YES: Q4 Do you, yourself, use your organization's ticketing system? 96 Yes 4 No 78
79 N=796 SKIP TO END OF SURVEY IF NO TO ANY Q2-4 IF Q4 = NO, DISPLAY: Please pass this survey along to someone in your organization who uses the ticketing system. We are eager to hear your organization's experiences. NO QUESTIONS 5-6 Q7 Does your organization use its ticketing software for customer relationship management (CRM)? A customer relationship management software is used to send s, track donors, pull communications lists, and track transaction history and communication with individuals or donors. 89 Yes 10 No 1 Don't know N=756 IF Q7=NO or DON T KNOW: Q8 Does your organization have separate software for customer relationship management (CRM)? 54 Yes 38 No 9 Don t know N = 80 Q9 Does your organization use more than one ticketing software? 79
80 7 Yes 92 No 1 Don t know N = 752 IF Q9 = YES, MORE THAN ONE: Q10 How many different ticketing software platforms does your organization use? 93 2 platforms 7 3 platforms N = 54 Q11 Please select your organization s PRIMARY ticketing software. If you do not see it, please choose other: NOTE: These figures show actual numbers responding, not percentages 36 Other 152 Arts Management Systems 13 AudienceView 3 Boca Systems 75 Center Stage Software 2 Choice Ticketing Systems 1 Diamond Ticketing Systems 1 Easy-Ware 13 New Concepts Software 3 Patron Technology 3 ShoWare by VisionOne 395 Tessitura 1 TicketForce 10 Ticketmaster 80
81 8 Tickets.com 4 Toptix USA 8 Vendini 6 Blackbaud N = 738 If Q11 = OTHER Q12 What is the name of your PRIMARY ticketing software? NOTE: These figures show actual numbers responding, not percentaes 2 Arts People 1 AudienceView 1 DataMax E Class 1 Explorer 1 Folio 1 Omniticket 1 Ovation 2 OvationTix 2 Paciolan 1 TICKETsage 2 Theater Manager 6 Theatre Manager 1 Ticket Pro 1 Ticketleap 1 Trak Pro System 2 WinTix 5 Wintix 1 Wintx 1 archtics 81
82 N = 33 N=771*0.05% - leave until later because we are not reporting it. Tessi overwhelmingly reported everything else is long tail Q13 How does your organization access its ticketing system? 71 Through software hosted on a local computer or server 27 Through a website, online or in the cloud 2 Don t know N = 719 Q14 Which departments use your organization s ticketing system? Use ticketing system Does not use Does not apply Don t know Artistic Planning Communications Development Education Exhibitions Finance Marketing Operations Production Sales Other please specify N Q16 What types of employees use your organization s ticketing system? 82
83 Use ticketing system Do not use ticketing system Don t know Full-time (paid) 98 2 * 691 Part-time (paid) Volunteer (unpaid) N Q17 How many employees (paid or volunteer), including yourself, use your organization s ticketing system? Over 20 2 Don t know N = 715 NO QUESTION 18 Q19 Which types of admission does your organization use its current ticketing system to perform? Use ticketing system Does not use system Not available Don t know Reserved seating * 700 General admission * 697 N Q20 Which types of ticket sales does your organization use its current ticketing system to perform? 83
84 Use ticketing system Does not use system Not available Don t know Individual admissions 99 * 0 * 707 Subscriptions/packages Group sales N Q21 Which types of transactions does your organization use its current ticketing system to perform? Use system Does not use system Not available Don t know On-site purchases 98 2 * Mail-in or fax purchases Phone purchases 99 * * Website purchases * 706 N IF WEBSITE PURCHASES IN Q21 = USE SYSTEM: Q22 Does your organization s ticketing software have a mobile-friendly website or a smartphone app for ticket purchases? 25 Mobile-friendly website ONLY 6 Smartphone app ONLY 31 Both *outside citations likely to be more meaningful here, mobile purchasing is increasing in trends but arts/orgs may be slow to catch up 22 Neither 16 Don t know N=663 IF WEBSITE PURCHASES IN Q21 = USE SYSTEM: 84
85 Q23 Does your organization s ticketing software track purchases made on a mobile device, like a smartphone or tablet? 31 Yes 34 No 35 Don t know N = 662 IF WEBSITE PURCHASES IN Q21 = USE SYSTEM: Q24 How often does your organization test the user experience of making a website purchase through your ticketing system? 6 Never 14 Around once a year 66 More frequently than once a year 14 Don t know N=664 IF WEBSITE PURCHASES IN Q21 = USE SYSTEM: Q25 How often does your organization test the user experience of making a purchase with a mobile device, like a smartphone or tablet, through your ticket system? 19 Never 15 Around once a year 43 More frequently than once a year 24 Don t know N=664 Q26 Does your organization use any of the following shared services? 85
86 Shared website (web sales for multiple organizations) Group call center (phone orders) Shared box office (a box office for multiple organizations) Use Do not use Don t know N Q27 Which functions does your organization use its current ticketing system to perform? Use Do not use system Not available Don t know Membership Donations Customized sales reports Automated sales reports CRM integration* N * Percentages not reported due to small sample size Q28 Which functions does your organization use its current ticketing system to perform? Use Do not use system 86 Not available Don t know Ticket forgery prevention Barcoding Seat mapping Refunds Exchanges Ticketing printing (by organization) At-home printing (by customer) More mobile support is in some ways more important N
87 Q29 Please estimate what percent of your ticket sales comes from each method exact numbers are not necessary Web 7.2 Mobile* 28,4 Phone 15.5 In person or at a box office 6.2 Mail or fax N= 153 *Mobile only available for those who reported tracking mobile purchases 41.2 Web & mobile 32.8 Phone 19.9 In person or at a box office 6.1 Mail or fax N=555 Q30 For each of the following, how frequently do you handle the function in your ticketing software? Never A little bit Sometimes Always Don t Know N Membership Donations Customized sales reports Automated sales reports CRM Integration* * Percentages not reported due to small sample size 87
88 Q31 Thinking about your organization s primary ticketing system, how satisfied are you with each of the following characteristics? Very Dissatisfied Dissatisfied Both satisfied and dissatisfied Satisfied Very Satisfied Don't Know Ease of use Vendor support System updates Level of customization Value for the price N ASK IF ORGANIZATION USES SYSTEM FOR EACH IN Q19: Q32 Thinking about your organization s primary ticketing system, how satisfied are you with its ability to handle the following types of seating? Reserved seating General admission Very Dissatisfied Dissatisfied Both satisfied and dissatisfied Satisfied Very Satisfied Don t Know N ASK IF ORGANIZATION USES SYSTEM FOR EACH IN Q20: Q33 Thinking about your organization s primary ticketing system, how satisfied are you with its ability to make the following types of sales? 88
89 Very Dissatisfied Dissatisfied Both satisfied and dissatisfied Satisfied Very Satisfied Don t Know Individual admissions Subscriptions/packages Group sales N ASK IF ORGANIZATION USES SYSTEM FOR EACH IN Q21: Q34 Thinking about your organization s primary ticketing system, how satisfied are you with its ability to make the following types of transactions? Very Dissatisfied Dissatisfied Both satisfied and dissatisfied Satisfied Very Satisfied Don t Know Mobile purchases On-site purchases (box office) Mail-in or fax purchases Phone purchases Website purchases N ASK IF ORGANIZATION USES SYSTEM FOR EACH IN Q27: Q35 Thinking about your organization s primary ticketing system, how satisfied are you with its ability to perform each of the following functions? Very Dissatisfied Dissatisfied 89 Both satisfied and dissatisfied Satisfied Very Satisfied Don t Know Membership Donations Customized sales reports Automated sales reports CRM integration* * Percentages not reported due to small sample size N
90 ASK IF ORGANIZATION USES SYSTEM FOR EACH IN Q30: Q36 Thinking about your organization s primary ticketing system, how satisfied are you with its ability to perform each of the following functions? Ticket forgery prevention Very Dissatisfied Dissatisfied Both satisfied and dissatisfied Satisfied Very Satisfied Don t Know Barcoding Seat mapping Refunds Exchanges Ticket printing (by organization) At-home printing (by customer) N Q37 If you could change one thing about your organization's ticketing system, what would it be? Verbatim N = 341 Feature Percent of Cases Ease of use/user friendly 10.5% Reporting 8.9% Custom Reports 8.5% Software Updates 7.9% Software Interface - Patron 6.5% Web Sales Functionality 5.9% Customization Capabilities 4.9% Subscription and Membership Capabilities 4.9% Learning/Training 4.7% Mobile 4.3% 90
91 Seat Map Design 4.3% Technical Support 4.1% Patron Seating Selection 3.9% No Issues 3.7% Affordability 3.4% Sales Transaction Efficiency and Features 3.2% Payment/Refund Methods 3.2% Software Interface - Organization 3.0% Web-Based Updates 3.0% Information Tracking, including CRM 2.8% Donor Information Capabilities and Reporting Pricing Capabilities, including Discount Coding 2.8% 2.8% Information Compatibility and Integration 2.6% Replace with Entirely New System 2.6% Consortias 2.2% Ticketing Functionality 2.2% Affordable Customization 1.6% Updates 1.4% Ticket Information/Design Customization 1.4% Data Extraction 1.0% Web Customization 0.8% Remote Access/Portable Systems 0.8% These next questions will ask about the features you think would be useful to your organization in a ticketing system. These questions are about ticketing systems in general, not your organization's current software. Q39 How important do you think it is for a ticketing system to be able to handle the following types of admissions? 91
92 Reserved seating General admission Not at all important Not very important Somewhat important Very important Don t know * * 628 N Q40 How important do you think it is for a ticketing system to be able to make the following types of sales? Not at all important Not very important Somewhat important Very important Don t know Individual admissions 0 0 * 100 * 628 Subscriptions/Packages * Q41 Group sales * In general, how important do you think it is for a ticketing system to be able to support the following types of transactions? N Inperson/box office purchases Mail-in or fax purchases Phone purchases Website purchases Mobile purchases Not at all important Not very important Somewhat important Very important Don t know 0 * 3 97 * * * 628 * N Q42 In general, how important do you think each of these features is in a ticketing system? 92
93 Ticket forgery prevention Not at all important Not very important Somewhat important Very important Don t know Barcoding Seat mapping Refunds * Exchanges * * 7 91 * 629 Ticket printing (by organization) At-home printing (by customer) * * N Finally, just a few questions about your organization. Q44 What is your organization's annual operating budget? If you are not sure, what was the operating budget reported on your IRS 990 form last year? 5 Under $100,000 3 $100,000-$249,999 7 $250,000-$499,999 9 $500,000-$999, $1,000,000-$4,999, $5,000,000-$9,999, $10,000,000 and above N = 572 Q45 What is the name of your organization? Again, results will be kept completely anonymous and not tied in any way to your organization. 93
94 Q46 What is your organization's mailing address? Q47 To what sector does your organization belong? 1 Commercial 7 Government 92 Non-profit N = 614 Q48 Which of these best describes your job function? 11 Primarily work in IT 1 Primarily work in programming 6 Primarily work in finance 55 Primarily work in marketing or box office 26 Other N = 616 Q49 Which artistic discipline is your organization's primary focus? 4 Dance 0 Media arts 17 Music 45 Theatre 2 Visual arts 27 Multi-discipline 3 Other 2 Opera 94
95 1 Multi-performing N = 619 Q50 Which of the following best describes your organization? 14 Arts center * Arts council 7 College/University 5 Cultural series/arts presenter 1 Festival * Gallery 2 Museum 66 Performing arts organization 5 Other N =
2013 Nonprofit Communications Trends Report
 2013 Nonprofit Communications Trends Report Get This Report and Graphics at NonprofitMarketingGuide.com/2013 npmg.us/2013 1 Highlights 2 Welcome to our third annual survey of what nonprofits predict for
Online Credit Card Report
 Measuring the digital world. TM Online Credit Card Report April 2011 FOR FURTHER INFORMATION, PLEASE CONTACT: Sarah Lenart comscore, Inc. (703) 234 8689 [email protected] Stephanie Houck comscore, Inc.
2012 Benchmark Study of Product Development and Management Practices
 2012 Benchmark Study of Product Development and Management Practices 2012 Benchmark Study of Product Development and Management Practices Contents 1. Introduction 2 2. Participant Profile 3 3. Methodology
2013 Key Survey Findings
 2013 Key Survey Findings National Multi-Site Survey of Children s Advocacy Centers The Midwest Regional Children s Advocacy Center is funded through a grant from the Department of Justice, Office of Juvenile
2011 Ticketing Software Satisfaction Survey
 2011 Ticketing Software Satisfaction Survey Ticketing Software Satisfaction Survey March 2010 Technology in the Arts www.technologyinthearts.org Technology in the Arts explores the intersection of arts
Benchmark Report. Event Marketing: Sponsored By: 2014 Demand Metric Research Corporation. All Rights Reserved.
 Benchmark Report Event Marketing: Sponsored By: 2014 Demand Metric Research Corporation. All Rights Reserved. TABLE OF CONTENTS 3 Introduction 18 Lead Volume Satisfaction 4 Executive Summary 20 Event Marketing
Individual Donors to Arts and Culture Organizations in Canada in 2007
 Individual Donors to Arts and Culture Organizations in Canada in 2007 www.hillstrategies.com [email protected] Statistical insights on the arts, Vol. 8 No. 3 Hill Strategies Research Inc., February
Content Marketing in 2014:
 Benchmark Report Content Marketing in 2014: Sponsored By: 2014 Demand Metric Research Corporation in Partnership with Ascend2. All Rights Reserved. TABLE OF CONTENTS 3 Executive Summary 10 Content Campaign
Blue Saffron Managed Services : The Customer Experience
 Blue Saffron Managed Services : The Customer Experience 1 Contents Background... 3 Section 1: SME Business and ICT Challenges... 3 Section 2: Key Drivers and Considerations for Managed Services... 5 Section
Winter 2016 Nonprofit Fundraising Study
 Winter 2016 Nonprofit Fundraising Study Covering Charitable Receipts at Nonprofit Organizations in the United States and Canada in 2015 March 2016 A Study From Acknowledgements The Nonprofit Research Collaborative
Inside Sales Trends. Research Brief. July 2014
 SalesManagement.org Research Brief Inside Sales Trends July 2014 This report summarizes findings from 66 participating business-to-business sales organizations, based on research collected in 2Q 2014.
Council of Ambulance Authorities
 Council of Ambulance Authorities Patient Satisfaction Survey 2013 Prepared for: Mojca Bizjak-Mikic Manager, Data & Research The Council of Ambulance Authorities Prepared by: Natasha Kapulski Research Associate
Mobile phone usage. Attitudes towards mobile phone functions including reception
 Attitudes towards mobile phone functions including reception Research Document Publication date: 23 January 13 Contents Section Page 1 Executive summary 1 2 About the research 3 3 Consumer experience
MEASURING SMB CUSTOMER OUTCOMES: THE DELL MANAGED SERVICES ADVANTAGE
 MEASURING SMB CUSTOMER OUTCOMES: THE DELL MANAGED SERVICES ADVANTAGE Sanjeev Aggarwal, Partner Laurie McCabe, Partner Sponsored by Dell CONTENTS Introduction...3 Section 1: SMB Business and IT Challenges...3
A Study of Career Patterns of the Presidents of Independent Colleges and Universities
 A Study of Career Patterns of the Presidents of Independent Colleges and Universities Harold V. Hartley III Eric E. Godin A Study of Career Patterns of the Presidents of Independent Colleges and Universities
The Ello social media network: Identifying the Joiners, Aspirers, and Detractors. November 2014 Insight Report using our DeepProfile capabilities
 The Ello social media network: Identifying the Joiners, Aspirers, and Detractors November 2014 Insight Report using our DeepProfile capabilities About this Insight Report Disclaimer: Ello did not participate
Contents. Overview... 3. Definition... 3. Key Findings... 4. Effectiveness of Delivery Formats... 5. Benefits of Using Digital Delivery Platforms...
 Contents Overview... 3 Definition... 3 Key Findings... 4 Effectiveness of Delivery Formats... 5 Benefits of Using Digital Delivery Platforms... 6 Use of Digital Content Delivery Platforms... 8 Use of Digital
EUROPEAN. Geographic Trend Report for GMAT Examinees
 2011 EUROPEAN Geographic Trend Report for GMAT Examinees EUROPEAN Geographic Trend Report for GMAT Examinees The European Geographic Trend Report for GMAT Examinees identifies mobility trends among GMAT
13 July 2010 QUALITY OF SERVICE GFK. GfK NOP Anders Nielsen, Priyesh Patel & Amanda Peet
 13 July 2010 GFK QUALITY OF SERVICE GfK NOP Anders Nielsen, Priyesh Patel & Amanda Peet 2 Quality of service Contents: Executive Summary Objectives & Methodology Overview of Sectors Appendix Landline Sector
Council of Ambulance Authorities
 Council of Ambulance Authorities National Patient Satisfaction Survey 2015 Prepared for: Mojca Bizjak-Mikic Manager, Data & Research The Council of Ambulance Authorities Prepared by: Dr Svetlana Bogomolova
Measuring BDC s impact on its clients
 From BDC s Economic Research and Analysis Team July 213 INCLUDED IN THIS REPORT This report is based on a Statistics Canada analysis that assessed the impact of the Business Development Bank of Canada
Segmentation: Foundation of Marketing Strategy
 Gelb Consulting Group, Inc. 1011 Highway 6 South P + 281.759.3600 Suite 120 F + 281.759.3607 Houston, Texas 77077 www.gelbconsulting.com An Endeavor Management Company Overview One purpose of marketing
Benchmark Report. Customer Marketing: Sponsored By: 2014 Demand Metric Research Corporation. All Rights Reserved.
 Benchmark Report Customer Marketing: Sponsored By: 2014 Demand Metric Research Corporation. All Rights Reserved. TABLE OF CONTENTS 3 Introduction 18 Customer Marketing Skills 5 Executive Summary 20 The
Demographic Trends Driving the Hispanic Consumer Market James W. Gillula and Tabitha Bailey*
 Demographic Trends Driving the Hispanic Consumer Market James W. Gillula and Tabitha Bailey* The rapid growth of the U.S. Hispanic population has captured the attention of most major retailers and consumer
Survey of more than 1,500 Auditors Concludes that Audit Professionals are Not Maximizing Use of Available Audit Technology
 Survey of more than 1,500 Auditors Concludes that Audit Professionals are Not Maximizing Use of Available Audit Technology Key findings from the survey include: while audit software tools have been available
Succeed in Search. The Role of Search in Business to Business Buying Decisions A Summary of Research Conducted October 27, 2004
 Succeed in Search The Role of Search in Business to Business Buying Decisions A Summary of Research Conducted October 27, 2004 Conducted with the Assistance of Conducted by Gord Hotchkiss Steve Jensen
State of Marketing Measurement Survey Report
 2014 State of Marketing Measurement Survey Report 1 Foreword Welcome to the Ifbyphone 2014 State of Marketing Measurement Survey report. Since we last published our trends on the fast-evolving marketing
Nonprofit Fundraising 2010 - Change in the Number of Companies
 The 2010 Nonprofit Fundra aising Survey Funds Raised in 20100 Compared with 2009 March 2011 The Nonprof fit Research Collaborative With special thanks to the representatives of 1,845 charitable organizations
The Patron Edge & The Patron Edge Online. for reserved seating
 The Patron Edge & The Patron Edge Online for reserved seating The Patron Edge and The Patron Edge Online Performing arts organizations, such as operas, ballets, theaters, and symphonies, depend on ticket
Profile of Rural Health Insurance Coverage
 Profile of Rural Health Insurance Coverage A Chartbook R H R C Rural Health Research & Policy Centers Funded by the Federal Office of Rural Health Policy www.ruralhealthresearch.org UNIVERSITY OF SOUTHERN
2014 Information Technology Survey Results
 2014 Information Technology Survey Results In our first annual IT Survey, we received 1,073 results and 2,162 comments. Below you will find a summary of the ratings we received. Respondents were asked
Interactive Intelligence
 Interactive Intelligence Customer Service Experience Study (Wave II) by Joe Staples Chief Marketing Officer Interactive Intelligence, Inc. and Thomas Bailey Content Editor Interactive Intelligence, Inc.
ONLINE INSIGHTS. Mobile Devices and Marketing. A Look at User Preferences and Behaviors for Advertiser Opportunities. August 2014
 A Look at User Preferences and Behaviors for Advertiser Opportunities August 2014 Copyright 2014 Burst Media LLC A Look at User Preferences and Behaviors for Advertiser Opportunities Fifty-one percent
B2B Sales Lead Generation: Integration of Web 1.0 and Web 2.0 Media. How B2B Marketers are using old and new online media to drive lead generation
 How B2B Marketers are using old and new online media to drive lead generation Executive Summary The use and integration of Web 1.0 and 2.0 media into B2B marketing plans for lead generation are well underway
What Customers Want from Wi-Fi (Brazil)
") What Customers Want from Wi-Fi (Brazil) Insights from Cisco IBSG Customer Research Cisco Internet Business Solutions Group August 2012 Internet Business Solutions Group 1 Contents Executive Summary Research
What Customers Want from Wi-Fi (Brazil) Insights from Cisco IBSG Customer Research Cisco Internet Business Solutions Group August 2012 Internet Business Solutions Group 1 Contents Executive Summary Research
Intel Teach Essentials Course Instructional Practices and Classroom Use of Technology Survey Report. September 2006. Wendy Martin, Simon Shulman
 Intel Teach Essentials Course Instructional Practices and Classroom Use of Technology Survey Report September 2006 Wendy Martin, Simon Shulman Education Development Center/Center for Children and Technology
SECOND-YEAR TEACHERS ATTITUDES TOWARD THE TEACHING PROFESSION
 NATIONAL FORUM OF TEACHER EDUCATION JOURNAL, VOLUME 14, NUMBER 3, 2004 SECOND-YEAR TEACHERS ATTITUDES TOWARD THE TEACHING PROFESSION Jack Slaybaugh Louisiana State University, Shreveport Cay Evans Louisiana
JEFFREY A. LOWE, ESQ. Global Practice Leader - Law Firm Practice Managing Partner - Washington, D.C.
 JEFFREY A. LOWE, ESQ. Global Practice Leader - Law Firm Practice Managing Partner - Washington, D.C. TABLE OF CONTENTS Background... 4 The Survey... 4 Methodology... 5 Statistical Terms Used... 6 Key Findings...
Deciding whether to move to an electronic health
 Contemplating the purchase of an EHR? Results of our informal survey may help. An EHR User-Satisfaction Survey: Advice From 408 Family Physicians Robert L. Edsall and Kenneth G. Adler, MD, MMM ROBIN JAREAUX
Relative Culture Strength
 Mike Hewitt Vice President, Global Workplace Safety Practice DuPont Safety Resources Wilmington, DE Relative Culture Strength A Key to Sustainable World-Class Safety Performance Overview In 2007, DuPont
OVERVIEW OF CURRENT SCHOOL ADMINISTRATORS
 Chapter Three OVERVIEW OF CURRENT SCHOOL ADMINISTRATORS The first step in understanding the careers of school administrators is to describe the numbers and characteristics of those currently filling these
Research Overview. Mobile Gamer Profile. Mobile Game Play Device Usage. Mobile Game Play Activity. Mobile Gaming Purchase Behavior.
 TABLE OF CONTENTS Research Overview Mobile Gamer Profile Mobile Game Play Device Usage Mobile Game Play Activity Mobile Gaming Purchase Behavior Key Takeaways PopCap Games Mobile Gaming Research - Confidential
2012 SURVEY OF LAW FIRM ECONOMICS
 2012 SURVEY OF LAW FIRM ECONOMICS Executive Summary ALM Legal Intelligence The National Law Journal In 2012, The Managing Partner Forum worked closely with ALM Legal Intelligence and The National Law Journal
SOCIETY OF ACTUARIES THE AMERICAN ACADEMY OF ACTUARIES RETIREMENT PLAN PREFERENCES SURVEY REPORT OF FINDINGS. January 2004
 SOCIETY OF ACTUARIES THE AMERICAN ACADEMY OF ACTUARIES RETIREMENT PLAN PREFERENCES SURVEY REPORT OF FINDINGS January 2004 Mathew Greenwald & Associates, Inc. TABLE OF CONTENTS INTRODUCTION... 1 SETTING
2014 Managing Partner Social Media Survey Part 2
 2014 Managing Partner Social Media Survey Part 2 Introduction In part one of the 2014 Managing Partner Social Media Survey, we collected responses from law firm managing partners regarding their attitudes
12/09/2011. Introductions and Expectations. About me. Katy Raines Building Customer Loyalty and Value. you work for. best experience as a customer
 Katy Raines Building Customer Loyalty and Value Belfast, Sept 2011 Introductions and Expectations Who you are Who you work for Your best experience as a customer What you want to get out of today About
Summary Report. Department of Innovation, Industry, Science and Research. Industry and Small Business Policy Division
 Summary Report Department of Innovation, Industry, Science and Research Industry and Small Business Policy Division Small Business Dispute Resolution June 2010 DIISR Small Business Dispute Resolution Research
Public Utilities Commission Commercial Survey
 Public Utilities Commission Commercial Survey Prepared for: Public Utilities Commission Focus Groups Surveys Public Opinion Polling, Portland, Maine 04101 Telephone: 207-772-4011 Fax: 207-772-7027 www.criticalinsights.com
Small Businesses Ride the Cloud: SMB Cloud Watch U.S. Survey Results
 Small Businesses Ride the Cloud: SMB Cloud Watch U.S. Survey Results Authors Stuart Taylor Andy Young James Macaulay February 2010 Cisco Internet Business Solutions Group (IBSG) Cisco IBSG 2010 Cisco and/or
GRADUATE SCHOOL OF LIBRARY AND INFORMATION SCIENCE INTRODUCTION TO LIBRARY AND INFORMATION STUDIES RESEARCH REPORT
 GRADUATE SCHOOL OF LIBRARY AND INFORMATION SCIENCE INTRODUCTION TO LIBRARY AND INFORMATION STUDIES RESEARCH REPORT Matthew S. Darby Charlotte Fowles Ruth Jiu Monika Szakasits Sarah Ziebell Mann Group LIS
Transportation costs make up a
 The Cost and Demographics of Vehicle Acquisition LAURA PASZKIEWICZ Laura Paszkiewicz is an economist in the Branch of Information Analysis, Division of Consumer Expenditure Surveys, Bureau of Labor Statistics.
CONTENTS. About the report 3. Methodology & survey demographics. Key findings. SECTION 1: Most-used online resources and devices
 Published July 2014 Published July 2014 Contents CONTENTS About the report 3 Methodology & survey demographics 4 Key findings 5 SECTION 1: Most-used online resources and devices Online versus offline resources
Public, Private and Hybrid Clouds
 Public, Private and Hybrid Clouds When, Why and How They are Really Used Sponsored by: Research Summary 2013 Neovise, LLC. All Rights Reserved. [i] Table of Contents Table of Contents... 1 i Executive
ENTERPRISE RISK MANAGEMENT SURVEY. 2013 RIMS Enterprise Risk Management (ERM) Survey SPONSORED BY:
 Survey SPONSORED BY:") t RIMS2013 ENTERPRISE RISK MANAGEMENT SURVEY 2013 RIMS Enterprise Risk Management (ERM) Survey SPONSORED BY: Administered by: Advisen Ltd. Zurich Authored by: RIMS and Advisen Ltd. Publishers: Mary Roth,
t RIMS2013 ENTERPRISE RISK MANAGEMENT SURVEY 2013 RIMS Enterprise Risk Management (ERM) Survey SPONSORED BY: Administered by: Advisen Ltd. Zurich Authored by: RIMS and Advisen Ltd. Publishers: Mary Roth,
US FIRE DEPARTMENT PROFILE 2013
 US FIRE DEPARTMENT PROFILE 2013 Hylton J. G. Haynes Gary P. Stein November 2014 National Fire Protection Association Fire Analysis and Research Division US FIRE DEPARTMENT PROFILE 2013 Hylton J. G. Haynes
Lehman Reports Annual Industry Study: Association Management Software Use and Satisfaction
 2012 Lehman Reports Annual Industry Study: Association Management Software Use and Satisfaction Lehman Associates, LLC Minneapolis Washington, DC 2308 Mt Vernon Ave, Suite 713 Alexandria, VA 22301 703-737-7550
Public Opinions, Attitudes and Awareness Regarding Water in Colorado
 Public Opinions, Attitudes and Awareness Regarding Water in Colorado Colorado Water Conservation Board FINAL REPORT Final Report July 22, 2013 Public Opinions, Attitudes and Awareness Regarding Water in
Canadians Views On De-regulating Cable and Other TV Distributors. March 2008
 Canadians Views On De-regulating Cable and Other TV Distributors March 2008 Study Sponsors ACTRA Communications, Energy & Paperworkers Union Friends of Canadian Broadcasting Stornoway Communications Writers
2011 Project Management Salary Survey
 ASPE RESOURCE SERIES 2011 Project Management Salary Survey The skills we teach drive real project success. Table of Contents Introduction... 2 Gender... 2 Region... 3 Regions within the United States...
Help in Defined Contribution Plans:
 May 2014 Help in Defined Contribution Plans: 2006 through 2012 Table of Contents Introduction Executive Summary 3 About This Report 8 Data Sample Information 10 Defining Help 11 Results Participants Using
Quantitative Displays for Combining Time-Series and Part-to-Whole Relationships
 Quantitative Displays for Combining Time-Series and Part-to-Whole Relationships Stephen Few, Perceptual Edge Visual Business Intelligence Newsletter January, February, and March 211 Graphical displays
Customer Experience Survey Report
 O F F I C E O F I N S P E C T O R G E N E R A L OFFICE OF INSPECTOR GENERAL EXPORT-IMPORT BANK of the UNITED STATES Customer Experience Survey Report Summary Report Only - Please contact the Office of
Marketing Accountability Study White Paper
 Marketing Accountability Study White Paper Presented by 2005 INTRODUCTION It s one thing to ask marketers to justify expenses on their well-researched, thoroughly contemplated marketing programs, especially
UBC Mailing List Replacement Project. Feedback Summary Survey & Focus Groups
 UBC Mailing List Replacement Project Feedback Summary Survey & Focus Groups Table of Contents I. Survey Results... 2 Key findings... 2 Demographics... 2 Mailing list services currently in use... 3 Mailing
QUANTIFIED THE IMPACT OF AGILE. Double your productivity. Improve Quality by 250% Balance your team performance. Cut Time to Market in half
 THE IMPACT OF AGILE QUANTIFIED SWAPPING INTUITION FOR INSIGHT KEY FIndings TO IMPROVE YOUR SOFTWARE DELIVERY Extracted by looking at real, non-attributable data from 9,629 teams using the Rally platform
Fannie Mae National Housing Survey. What Younger Renters Want and the Financial Constraints They See
 Fannie Mae National Housing Survey What Younger Renters Want and the Financial Constraints They See Copyright 2014 by Fannie Mae May 2014 Table of Contents Research Methodology... 4 Executive Summary.....
Industry. Head of Research Service Desk Institute
 Asset Management in the ITSM Industry Prepared by Daniel Wood Head of Research Service Desk Institute Sponsored by Declaration We believe the information in this document to be accurate, relevant and truthful
Industry Survey: Trends in Enterprise Cellular Network Data Usage
 Industry Survey: Trends in Enterprise Cellular Network Data Usage Prepared by Rysavy Research March, 2013 R E S E A R C H Overview Mobile deployments that rely on cellular data services for access and
How consumers want Charities to communicate with them
 How consumers want Charities to communicate with them A summary of the latest research findings 2 Listening to consumers Supporters of not-for-profit organisations range from individual donors who make
IAB Mobile Marketing Center of Excellence Apps and Mobile Web:
 IAB Mobile Marketing Center of Excellence Apps and Mobile Web: Understanding the Two Sides of the Mobile Coin 16 December 2014 Introduction Agenda Where Mobile Users Spend Their Time Explaining the App
Great Expectations: The Evolving Landscape of Technology in Meetings 1
 Great Expectations: The Evolving Landscape of Technology in Meetings The Evolving Landscape of Technology in Meetings 1 2 The Evolving Landscape of Technology in Meetings Methodology American Express Meetings
THE STATE OF Social Media Analytics. How Leading Marketers Are Using Social Media Analytics
 THE STATE OF Social Media Analytics May 2016 Getting to Know You: How Leading Marketers Are Using Social Media Analytics» Marketers are expanding their use of advanced social media analytics and combining
IBM SPSS Direct Marketing 23
 IBM SPSS Direct Marketing 23 Note Before using this information and the product it supports, read the information in Notices on page 25. Product Information This edition applies to version 23, release
How Customer Satisfaction Drives Return On Equity for Regulated Electric Utilities
 ANDREW HEATH AND DAN SELDIN, PH.D. A J.D. Power and Associates White Paper May 2012 A Global Marketing Information Company jdpower.com Executive Summary During the past decade, J.D. Power and Associates
Communications/publications Volunteer opportunities Events Awards PREAMBLE
 PREAMBLE Dean Kate VandenBosch charged our committee to offer recommendations related to alumni engagement over the next decade. She asked us to consider alumni interests and the needs of CALS students