FORECASTING THE FUTURE OF PREDICTIVE CRIME MAPPING. Elizabeth R. Groff
|
|
|
- Phoebe Skinner
- 10 years ago
- Views:
Transcription
1 FORECASTING THE FUTURE OF PREDICTIVE CRIME MAPPING by Elizabeth R. Groff National Institute of Justice and Nancy G. La Vigne The Urban Institute Abstract: While the use of mapping in criminal justice has increased over the last 30 years, most applications are retrospective - that is, they examine criminal phenomena and related factors that have already occurred. While such retrospective mapping efforts are useful, the true promise of crime mapping lies in its ability to identify early warning signs across time and space, and inform a proactive approach to police problem solving and crime prevention. Recently, attempts to develop predictive models of crime have increased, and while many of these efforts are still in the early stages, enough new knowledge has been built to merit a review of the range of methods employed to date. This chapter identifies the various methods, describes what is required to use them, and assesses how accurate they are in predicting future crime concentrations, or "hot spots." Factors such as data requirements and applicability for law enforcement use will also be explored, and the chapter will close with recommendations for further research and a discussion of what the future might hold for crime forecasting. INTRODUCTION Methodological rigor in crime prevention initiatives has increased significantly in the last two decades. This is a result of partnerships between researchers and practitioners as well as the introduction of Crime Prevention Studies, volume 13, pp

2 Elizabeth R. Gruff and Nancy G. LaVigne more user-friendly analytic software programs, including Geographic Information Systems (GIS) (Crime Mapping Laboratory, Police Foundation, 2000; Report of the Task Force on Crime Mapping and Data Driven Management, 1999; Weisburd and McEwen, 1997). GIS is often credited for providing a valuable analytic tool for the identification and analysis of crime problems as well as the development and assessment of crime prevention programs (Groff, 1996; Groff et al., 2000; La Vigne and Wartell, 1998, 2000). GIS has been used to produce maps depicting crime "hot spots" as well as to conduct spatial analyses that suggest relationships between crime and characteristics of the social and physical environments in which crime concentrations occur (Rich, 1995; Sherman and Weisburd, 1995; Weisburd and McEwen, 1997). The use of GIS in law enforcement has increased significantly, and the variety of applications for crime control and prevention is quite broad (Dunworth et al., 1998; La Vigne and Groff, 2001; Mamalian and La Vigne, 1999; Crime Mapping Laboratory, Police Foundation, 2000). Most applications, however, are retrospective - that is, they examine criminal phenomena and related factors that have already occurred. While such retrospective mapping efforts are useful, the true promise of crime mapping lies in its ability to identify early warning signs across time and space and inform a proactive approach to police problem solving and crime prevention. Such efforts necessitate predictive models that identify "hot spots" of crime and disorder, as well as areas where crime is abating. Recently, attempts to develop predictive models of crime have increased, 1 and while many of these efforts are still in the early stages, enough new knowledge has been built to merit a review of the range of methods employed to date. This chapter identifies the various methods, describes what is required to use them, and assesses how accurate they are in predicting future crime concentrations, or "hot spots." 2 This review covers methods ranging from simple predictions based on the locations of past events to highly sophisticated modeling methods employed by researchers. Factors such as data requirements and applicability for law enforcement use will also be explored, and the chapter will close with recommendations for further research and a discussion of what the future might hold for crime forecasting. It should be noted that it is beyond the scope of this paper to provide detailed information and accompanying algorithms for the methods reviewed herein. Rather, the intent is to describe these methods with an emphasis on data requirements, ease of use, and applicability to crime prevention. Each method is appropriately cited to enable the reader to obtain more specific information and provide guidance to those wishing to employ the methods themselves. -30-

3 Forecasting the Future of Predictive Crime Mapping WHY PREDICT CRIME? The ability to predict the locations of future crime events can serve as a valuable source of knowledge for law enforcement, both from tactical and strategic perspectives. From a traditional policing perspective, predictive mapping can inform a police department's deployment efforts, helping to allocate patrols more efficiently and reduce response times. Despite the increased emphasis on proactive policing, the core of police work remains that of responding to calls for service, making effective deployment strategies paramount to a well-functioning police department. From a more proactive standpoint, problem-oriented policing efforts may be enhanced by a more accurate scanning of areas with crime problems, in that one can examine both distributions of past crimes and predictions of future concentrations. As detailed below, some of these predictive methods also provide information on "leading indicators," or explanatory variables, which can aid in the analysis stage of problem-oriented policing. Such indicators offer the ability not only to predict future crimes, but to identify underlying causes of those future hot spots. Thus, predictive mapping can assist in the identification of crime problems and enable officers to target intervention efforts to very narrowly defined geographic areas. Predictive mapping holds promise for improving the identification of areas in which to focus interventions, but it also may improve the way those interventions are implemented. A common criticism of crime prevention efforts is that crime is simply displaced most often geographically rendering the intervention ineffective. Studies have demonstrated that displacement is not at all inevitable, and that when it does occur 100% of crime is not displaced (Eck, 1993; Hesseling, 1995). Nonetheless, successful crime prevention strategies consider potential displacement possibilities and craft interventions based upon those considerations. Thus, predictive mapping can help law enforcement to anticipate areas of displacement, and may lead to targeting the intervention in a broader geographic area in order to reduce the possibility of its occurrence. Likewise, predictive mapping may be used to enhance the potential "halo" or "diffusion of benefits" of an intervention, whereby it has a beneficial effect beyond the places that were targeted. Clarke and Weisburd (1994) offer ways in which diffusion of benefits may be enhanced, including the concentration of resources on highly visible or attractive targets to give the impression to potential offenders that the intervention is more widespread that it actually is. Predictive mapping can help identify those attractive targets, thus bolstering this spillover effect. -31-

4 Elizabeth R. Groff and Nancy G. La Vigne This discussion of the potential uses of predictive mapping is by no means exhaustive, but it is designed to illustrate the valuable contributions that predictive models might offer, and emphasizes the importance of this relatively new area of inquiry. Before reviewing the various predictive methods that have been employed, it is important to examine the theoretical underpinnings of this topic. THE ROLE OF THEORY IN PREDICTIVE MAPPING As described in detail below, various means of forecasting crime events and locations exist, and not all of them can be considered "modeling." Some methods are strictly atheoretical, relying on past events to predict future ones. Other methods, however, are developed by modeling the behavior of likely offenders, making it important to review the theory underlying these efforts because theory can play an important role in guiding the selection of independent variables, or leading indicators. Perhaps the most germane theories for forecasting purposes are the rational choice perspective and routine activities theory. Both assume that crime is purposive and that individuals are selfdetermining: when people commit crime, they are seeking to benefit themselves, and certain calculations are involved in determining whether the criminal act will yield positive results (Clarke, 1997). Thus, offenders are influenced by situational and environmental features that provide desirable or undesirable offending opportunities. These theories are based upon the belief that criminals engage in rational (if bounded) decision-making (Becker, 1968; Cornish and Clarke, 1986), and that characteristics of the environment offer cues to the offender that promising opportunities for crime exist (Brantingham and Brantingham,1978, 1981; Newman, 1972; Cohen and Felson, 1979; Harries, 1980; Wilson and Kelling, 1982). The practical implications of these theories are that even motivated criminals may nonetheless be deterred from committing crime if they perceive a potential target to be too risky, to involve too much effort, to yield too meager a profit, or induce too much guilt or shame to make the venture worthwhile (Clarke, 1997; Clarke and Homel, 1997). From a predictive modeling perspective, then, these theories have the potential to guide the selection of independent variables with a focus on those that characterize desirable targets and in turn, desirable locations of crime. Further, theory-based modeling enables us to identify which factors influence crime target selection, and thus inform crime prevention efforts. The models described below include an assessment of whether they are supported by theory, and the extent to which they inform prevention efforts. -32-

5 Forecasting the Future of Predictive Crime Mapping THE ROLE OF GIS IN PREDICTIVE MODELING While geographic information systems (GIS) 3 are most often associated with data aggregation and display, the technology is capable of serving a variety of purposes. In terms of crime forecasting, GIS can be used at the front end, as a data manipulator; in the analysis phase as a spatial analysis engine; at the back end, for display purposes; or throughout the research project. Currently, GIS is used most frequently in the front end as a geocoder and data aggregator. The ability to geocode 4 records in a database to coordinates on the earth's surface unlocks the potential for spatial analysis of phenomena. Once these locations can be displayed, they can be aggregated to whatever boundary is appropriate for the analysis. On the back end, GIS is most often used as a visualization tool. The crime forecasts that are generated by statistical models can be displayed both on the screen to facilitate interactive analysis and in the form of hard copy maps, which are more portable. Both types of output can be used to visually identify concentrations and patterns and to communicate those findings. Finally, GIS has great potential as a data analysis tool in and of itself. The rest of this section describes how spatial analysis and "map algebra" can be used in a GIS to develop spatial models to predict crime. A layer of polygon grids in a vector GIS or a raster GIS are required in order to take advantage of grid cell-based modeling. 5 In both types of GIS, the study area is divided into a series of equalsized cells that together form a grid. Each cell is assigned a value based on the quantity of the variable being measured that it contains. A grid is created for each attribute to be used in the model. One advantage to raster GIS is that it is easy to represent continuous data such as distance from another cell (e.g., distance from a major road) or degree of concentration (e.g., density of crime). Once the individual layers are calculated, they can then be used as parameters in a mathematical equation. Another capability of a raster GIS is the ability to incorporate the effects of neighboring grid cell values on a grid cell. In ArcView's Spatial Analyst Extension, this is known as a "focal function" (ESRI, 1998). The focal function computes a new value for each cell in a grid based on the "neighborhood of cells" defined. 6 This is analogous to a spatial lag using the queen pattern since all cells that share a side or a corner are included up to the specified neighborhood size. These new "smoothed" cell values can then be used in the final model. The use of methods that involve GIS tends to require both broader and more in-depth skill sets. While only a basic level of GIS knowledge is needed to display the results of a statistical technique on a -33-

6 Elizabeth R. Groffand Nancy G. La Vigne map, geocoding requires more skill, and using extensions such as Spatial Analyst to build models requires even more specialized knowledge. Encouragingly, there have been enhancements to Spatial Analyst that have made it easier to learn and to use (Ormsby and AM, 1999). 7 There are several major advantages to using GIS in developing a model for forecasting crime. As mentioned before, a GIS can use data in a spreadsheet and spatially enable it through geocoding. Once spatially enabled, those data can then be aggregated to whatever areal unit is most appropriate to the analysis. These functions of a GIS are important whether or not the model is implemented in GIS. Finally, the ability to visualize patterns in the data cannot be overstated and makes GIS a valuable tool for communicating the results of an analysis. Thus, the phrase "predictive crime mapping" used throughout this chapter is broadly applied to a variety of methods that use GIS in any number of points throughout the forecasting process. Hot Spots REVIEW OF METHODS The most common method of "forecasting" crime in police departments is simply to assume that the hot spots of yesterday are the hot spots of tomorrow. Crime analysts prepare maps of crimes that have already occurred and those maps are used to deploy officers and to identify areas in need of intervention. While surprisingly scant research exists to test this assumption, the few studies we have identified suggest that the effectiveness of this approach depends upon the time period employed. Spelman (1995) found that examining past crimes over a one-month period is not a particularly powerful predictor hardly better than chance, yet one year of data predicts with 90% accuracy. 8 This suggests that hot spots may flare up and diminish over relatively short time periods, but that these flare-ups nonetheless occur in the same places over time, creating longer-term trends. Thus, law enforcement agencies that examine last week's crime statistics to deploy patrols may find it more useful to identify hot spots based on an entire year's worth of data. One means of testing the persistence of hot spots is to analyze the extent to which they coincide over the course of several years. Adams-Fuller's (2001) examination of hot spots of homicide in three U.S. cities found that the vast majority of homicide hot spots per- -34-

7 Forecasting the Future of Predictive Crime Mapping sisted over time, 9 suggesting that past history may indeed be an accurate predictor of future hot spots, at least in the long-term. Adams-Fuller (2001) also attempted to understand the root causes of hot spots by examining their socio-economic and environmental characteristics. She found that most historical homicide hot spots had public housing, were located in economically depressed sections of cities, contained drug markets, and had major thoroughfares running through them, providing easy access into and out of the area. Her research clearly illustrates the ability to integrate theoretical explanations of crime with the search for hot spots. In fact, hot spot methods are one-dimensional without the inclusion of contextual variables. There are many ways in which researchers and analysts identify hot spots (for a thorough review, see Jefferis, 1998). The most simplistic approach is to use GIS to create graduated circles, the radii of which reflect the number of events. While this method requires minimal GIS skills, it also has its drawbacks, in that these circles can often overlap, making it difficult to visually discern patterns of concentrations. A more commonly applied hot spot method among researchers is the use of spatial statistical software such as STAC 10 or CrimeStat. 11 These methods generate a set of ellipses that represent the highest concentrations of points. In recent years, methods for visualizing hot spots have increasingly relied on a raster GIS to interpolate a surface of crime based on reported crime events. The analysis results have the look of a "weather map," and are extremely popular for communicating crime patterns for a jurisdiction. However, this type of hot spot identification treats the known crime events as a sampling of the continuous surface of all crime. In other words, it creates data points in geographic locations where crimes have not occurred, based on averages between actual data points. As a consequence, large-scale maps (e.g., at the neighborhood level) often depict higher crime rates than were reported to the police. This disconnect between reported crime and interpolated crime has yet to be adequately resolved. An additional caveat with any of these methods is that the output is based upon user-defined criteria (e.g., band width and search area) and there are no standard guidelines for what those criteria should be. The popularity of these methods stems from their relative ease of implementation at least as compared to other methods discussed in this chapter as well as their ease of interpretation. The ease of implementation is directly attributable to the existence of software to automate the algorithms for identifying clusters and drawing an ellipse. The methodology for this was outlined almost 25 years ago by Getis and Boots (1978), but languished until incorporated in a soft- -35-

8 Elizabeth R. Groff and Nancy G. La Vigne ware product. Since 1998, several other free software programs have automated the creation of hot spots using ellipses. 12 Thus the current popularity of hot spots may be due to the fact they are relatively easy to generate and understand. Repeat Victimization The above research indicates that temporally aggregated hot spots may serve as accurate predictors of crime, but that relying on shorter previous time periods for predictive purposes is less effective. The exception to these research findings relates to "hot dots" (Pease and Laycock, 1996) rather than hot spots: that is, the repeat victim rather than the high-crime area. The concept of repeat victimization is now well established in the criminological literature (for an early review, see Farrell, 1995): those individuals or places that have been victimized once are likely to be victimized again, and the time course to subsequent victimization is a few short months (Anderson et al., 1995; Farrell and Pease, 1993; Polvi et al., 1990). This research suggests that past victimizations of individual addresses, places, and businesses can be very accurate predictors of future victimizations, even when relying on the previous month's victimization. The crime prevention benefits of focusing on repeat victims to prevent subsequent crimes is well established (for a summary of the preventive impact of repeat victimization strategies on crime, see Pease, 1998), and raises the question: Can repeat victimizations of individuals and places be used to predict not just hot dots, but hot spots? Very few researchers to date have examined the extent to which hot spots are composed of repeat victimizations, except for those who have focused on residential burglary. Both Bennett (1996) and Townsley et al. (2000) found that one-third of all burglaries reported in the hot spot areas under study were repeat burglaries. While Morgan (2001) found a lower degree of repeat victimization concentration within high-crime areas, the areas under study combined multiple census districts and thus were larger than the average hot spot. In his research, Morgan also found what he terms "near repeats": residences close to repeat victims were likely to be victimized. Finally, a recent publication by Farrell and Sousa (2001) concludes that while repeat victimizations and hot spots do coincide, some hot spots experience more repeat victimization than others and may vary based upon crime type. The research on repeat victimization suggests that much more could be learned from further examination of the composition of hot spots and the extent to which repeat victimizations could be used to predict not just future victimizations, but future hot-spot areas. Such -36-
 rather than hot spots: that is, the repeat victim rather than the high-crime area.")
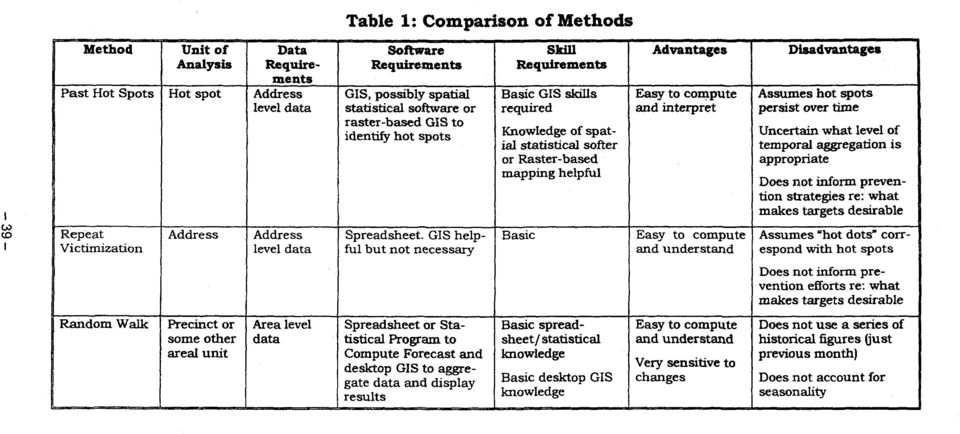
9 Forecasting the Future of Predictive Crime Mapping studies should explore this question across different sized hot spots as well as different types of crime problems, and should explore the "near repeat" concept in further detail. Depending on future research findings in this area, repeat victimization has the potential to provide a simple method that could be employed by users of all skill levels and does not require the use of GIS. The limitation of this approach is that it does not tell us specifically what it is about the predicted hot spots that makes them hot, limiting the extent to which the method would inform prevention efforts. Univariate Methods There are a variety of univariate methods available to predict crime. These methods use previous values of one variable to predict its future value. They are attractive because of their straightforwardness: univariate methods require a minimum of data collection since they involve only one variable. Additionally, they are atheoretical and thus do not demand any thought about which variables should be included in the analysis. These methods range from simple random walk and naive lag 12 to more sophisticated models that incorporate both seasonally and time trends. Among police practitioners the most frequently used crime prediction methods are so-called "naive" univariate ones (Gorr et al., 2002; Gorr and Olligschlaeger, 2001). The two naive univariate methods used by police are the random walk 13 or and the naive lag The random walk method is a good predictor of series in which there are frequent pattern changes (e.g., to predict stock market behavior) because it reflects those changes immediately. However, it is a poor predictor when the series to be forecasted has seasonally or time trends (Gorr et al., 2002; Gorr and Olligschlaeger, 2001). While these basic univariate methods are by far the most straightforward methods of predicting crime, they are also unfortunately by far the least accurate (Gorr et al., 2002; Gorr and Olligschlaeger, 2001). More sophisticated univariate methods are available that more accurately predict crime levels by including seasonally in the model, 15 accounting for time trends using exponential smoothing 16 and pooling data 17 (Gorr et al., 2002; Gorr and Olligschlaeger, 2001). However, the addition of these steps also makes the methods more complicated for the user. While all the more sophisticated univariate methods offer improvements over the simpler ones, the exponential smoothing methods have two main advantages as tools for crime forecasting. First, they offer the ability to account for changes in crime over time rather than relying on the current period to forecast the next period. Sec- -37-

10 Elizabeth R. Groffand Nancy G. LaVigne ond, they are the most accurate type of method when the goal is to forecast "small to medium-level" changes in crime (Gorr and Olligschlaeger, 2001) While the univariate techniques outlined above share many characteristics, they vary in the sophistication of both the software employed and the skills required to use them (Table 1). All of the techniques use area-level data and the results can be displayed easily in a desktop GIS. Both the random walk and the naive lag 12 are very easy to compute and can be calculated within standard spreadsheet packages. The classical decomposition model and the exponential smoothing models are more sophisticated and are most easily calculated using a standard desktop statistical package (e.g. SPSS or SAS ). The more sophisticated models also require an analyst with more advanced statistical training. Consequently, the investment in personnel and equipment is higher for the more sophisticated models than the simpler ones. In an effort to shed some light on the comparative accuracy of these forecasting methods and others, Gorr et al. (2001) employed a rolling-horizon experimental design to test 10 different combinations of data-driven methods and univariate models to account for seasonality and time trends (Gorr et al., 2002; Gorr and Olligschlaeger, 2001). Of the techniques tested, the Holt exponential smoothing with pooled seasonally was the most accurate, and the simple exponential smoothing model with pooled seasonality was second best. These results clearly demonstrate that using citywide, pooled measures of seasonality offers more accuracy regardless of the exponential smoothing method used. Their findings that the random walk and Naive Lag 12 methods were the least accurate at forecasting crime is of immense importance because these statistics are widely used in the field (Gorr et al., 2002; Gorr and Olligschlaeger, 2001). The good news from Gorr and Olligschlaeger's (2001) study is that the more sophisticated univariate methods predict as well as the far more complicated multivariate methods for cases with small to medium changes in crime levels. Specifically, they note that while the pooled exponential smoothing model is not typically used in police agencies, the model is relatively simple to implement and, if used to forecast in areas with an average of 30 or more events per month, it offers good forecast accuracy. Given that simple exponential smoothing methods have already been recommended in one of the most frequently cited crime analysis books (Gottlieb et al., 1998), the real challenge may be in encouraging widespread adoption of these methods by analysts. One strategy for achieving this goal would be to make the methods easier for crime analysts to implement. -38-

11
12

13

14

15

16 Elizabeth R. Groffand Nancy G. La Vigne Leading Indicators "Leading indicator" multivariate methods focus on using current and past values of independent variables to predict the future value of the dependent crime variable (Gorr and Olligschlaeger, 2001). The "leading indicators" term in the title of the model refers to specific characteristics of areas or neighboring areas (e.g., shots fired, calls for service, disorderly conduct offenses, etc.) for which their rise or fall in current and previous months can be used to predict future values of the dependent crime variable. There are three issues that must be addressed when specifying a "leading indicator" model related to crime (Gorr and Olligschlaeger, 2001). First, leading indicator methods require the identification of leading indicator variables before the model can be used. Identification of the appropriate leading indicator variables requires a thorough review of the literature, and grounds this method in theory. Developing theory-based leading indicators is a time consuming task that is critical to the success of the model. 18 Second, because crime forecasts are typically done for short time periods and across smaller areas, often there are not enough events to develop robust model parameters. Thus, it is important to pick an areal unit that is large enough to provide adequate numbers of observations. In general, the greater the volume of crime the more reliable the forecasts will be, and the smaller the volume of crime the more variable the data will be and the more unreliable the forecasts. Gorr and Olligschlaeger (2001) determined that a grid with 4,000-foot cells was the smallest grid cell that would still provide reliable forecasts. The third issue when specifying this type of model concerns the development of leading indicator measures at the same geographic and time scales as the dependent variable (e.g., grid cell data that vary by month). Geographic information systems (GIS) have made the spatial issue much less problematic than in the past, since a GIS enables automated aggregation of points to customized areas. Thus, both crime types and leading indicator variables can be aggregated to the same areal units easily. Furthermore, Gorr and Olligschlaeger found that selected Part 2 crimes and CAD calls are leading indicators of Part 1 dependent variable crimes. Hence police are among the few organizations fortunate enough to generate their own leading indicators. One advantage of this technique is the ability to use spatial econometric methods that enable the inclusion of spatial and temporal lags in the model. Spatial lags allow the explicit modeling of the -44-
 for which their rise or fall in current and previous months can be used to predict future values of the dependent crime variable.")
17 Forecasting the Future of Predictive Crime Mapping effects of the values in neighboring cells on the value of the subject cell. 19 Temporal lags allow the modeling of the effects during previous time periods on the study time period. Over all, leading indicators show great promise since they are the only method that has the ability to "see pattern changes coming" (Gorr, 2001 and Gorr and Olligschlaeger, 2001). Thus, they are very good at predicting large changes in crime levels, while extrapolative methods are better for small to medium changes. Gorr (2001) recommends that police agencies routinely use both extrapolative methods, such as the Holt two parameter exponential smoothing method with pooled seasonality and a leading indicator model. He recommends that if the leading indicator model forecasts a large change, one should use it because the technique forecasts correctly about half the time. If it does not forecast a large change, then one should use the extrapolative method's results. While promising, these methods require significant expertise on the part of the end user. The analyst must be familiar with multivariate statistical methods and have access to statistical or spreadsheet software programs to calculate the statistics. A geographic information system is necessary to aggregate the chosen leading indicator measures to the areal unit used in the study, whether it is a grid cell or some other area such as a police beat. Point Process Model A new method being employed by Brown (2001) and his colleagues is based on the theory of point patterns and multivariate density estimation, and can best be described as a point process model (Brown, 2001). The modeling is akin to neural networks in that there is training involved, and past data are used to predict future events. In essence, this approach glues multivariate models together and uses notions from kriging and density estimation (Brown, 2001). Brown et al. (2000) developed this predictive model based upon the preferences of offenders, or what they term "event initiators": past behavior illustrating the preferences of offenders is used to model both when and where future crimes will occur: "...we do not regard the past crime intensity at a site as a direct factor to influence how soon criminals are going to strike again. However, this past behavior does tell us about the preferences of site selectors and we directly model those preferences..." (Brown et al., 2000:4). The output of the model is a probability surface indicating likely areas of future crimes. Brown and colleagues compared their point process model's predictive powers to that of using past hot spots to predict future ones, testing both models by plotting commercial and residential burgla- -45-

18 Elizabeth R. Groffand Nancy G. La Vigne ries. For all but one comparison, the point process model statistically outperforms the comparison model at the 90% confidence level. Mean percentile scores are calculated to demonstrate how well the model performs, essentially indicating more about how the model performs over all than about its ability to forecast at a particular location. The model narrows down at-risk areas to 15-25% of all potential areas, thus enabling law enforcement to better target resources. The smaller the percent, the better the model, because police can more narrowly focus resources. According to Brown (2001), the model is limited from producing smaller percentages because explanatory data were generated from census block groups, which do not provide enough variation across space. While this method shows promise, in its current form it is not possible for others to replicate and apply it because it was custom programmed for a specific research purpose. Furthermore, the approach requires both high-level programming skills as well as knowledge of kriging and density estimation. Nonetheless, this method has distinct advantages over others in that it is informed by theory (rational choice) and identifies which variables have explanatory power. Artificial Neural Networks One of the earliest efforts to do predictive crime mapping was that of Olligschlaeger (1997), who employed a "feed-forward network with backpropogation" to predict areas where future drug markets will emerge. Best known to laypeople as artificial intelligence, the type of neural network model employed by Olligschlaeger is capable of learning extremely complex space-time patterns (Olligschlaeger, 1997). According to Olligschlaeger, "The goal is to map the input units to a desired output similar to the way in which the dependent variable is a function of the independent variables in a regression analysis. The difference is that regression analysis uses linear direct mapping whereas multi-layer feed-forward networks use non-linear direct mapping" (Olligschlaeger, 1997:325). In essence, the network is trained by feeding it past data and adjusting the weights assigned to the input units; when the network is processed, the error signal is fed back, or "backpropogated" through the network to adjust the weights until, ultimately, the error signals are minimized (Olligschlaeger, 1997). GIS was employed in conjunction with this model in order to process spatial and temporal data, including data aggregation and determination of spatial and temporal lags. This was accomplished by overlaying a grid and summing the data points that fall into each cell, as well as employing contiguity measures. -46-

19 Forecasting the Future of Predictive Crime Mapping The network was used to predict drug markets. Inputs included 35 months of weapon-related, robbery, and assault-related calls-forservice; the relative proportions of residential and commercial properties in each cell; and a seasonally index. The model's performance was tested against Ordinary Least Squares (OLS) regression analysis and the random walk method. A comparison of R-squareds indicated that the network's forecasting abilities were superior (Olligschlaeger, 1997). In more recent work, Olligschlaeger and Gorr (2001) found that neural networks outperform multiple regression leading indicator models when the set of leading indicators is rich and numerous. While this method holds promise, there are no statistical tests of significance associated with it, precluding the ability to determine which inputs (independent variables) are providing predictive power. The model is somewhat atheoretical and the method requires a high degree of expertise, making it difficult to replicate. Polygon Grid/Raster GIS Methods As stated earlier, GIS can be used throughout a research project to incorporate spatial relationships in the crime forecast. In Groff and La Vigne (2001), we used a combination of polygon grid cells and raster-based GIS to generate an opportunity surface for residential burglary. We identified a set of variables based on the theories of routine activities, rational choice and environmental criminology, and used GIS to operationalize those variables. We were very interested in modeling the effects of the values of surrounding properties on a particular property. For example, we wanted to model the effect of having a substandard housing unit or vacant unit nearby. In order to incorporate the effect of surrounding grid cell's values, each layer was recalculated using a focal neighborhood function within the GIS. 20 Map algebra was used to combine the new grid cell values in each layer to produce an overall risk index surface for residential burglary. Reported burglaries were then plotted on top of this new opportunity surface to determine how well the model predicted. The percentage of cells that were accurately predicted was used to empirically compare the actual burglaries with the opportunity surface. Two categories of burglaries were examined: any burglary event and repeat burglaries. Interestingly, the model predicted repeat burglaries better than locations with both single and repeat burglaries. This finding leads to questions about the strength of the predictive power of repeats: could the repeat-address locations serve as a proxy for all of these other variables used to create the opportunity surface? If so, it would support the use of past repeat victimization addresses to predict future -47-
.")
20 Elizabeth R. Groffand Nancy G. La Vigne hot spots. There is a definite need for more research to test the validity of this line of reasoning. However, even if repeat burglaries are good predictors of future hot spots we still do not know why they are more likely to be future hotspots. The method outlined above can be used with any point data or with polygon data. However, the amount of data available definitely determines the level of detail that can be incorporated in the model. Thus, in relation to methods discussed above, this approach has the potential to be data-intensive if used at the micro level. Most data sets that are routinely collected do not have the level of detail required to do this type of modeling. For instance, our analysis required specific characteristics of houses/properties and their surrounding areas that may be difficult to obtain (e.g., housing quality, incivilities, lighting level, etc.). The model can also be used with less specific data sets and at a macro level of analysis, but its results are likely to be less accurate. In addition to having GIS skills, an analyst employing grid-based methods must understand how to build models. The level and breadth of statistical knowledge required will depend upon the sophistication of the model. In the case of the example above, the model was designed for use by law enforcement agencies, so it was purposely kept straightforward and simple. However, as the field evolves, the demand for more complex and more accurate models will continue to grow. This growth is evident in the demand for the integration of spatial statistics and GIS. If achieved, this integration would enable an analyst to combine statistical rigor with effective modeling of context to produce more accurate crime forecasts. CONCLUSIONS As mentioned at the beginning of this chapter, our purpose was to review the current methods employed for predictive crime mapping, from basic approaches currently used by crime analysts, to sophisticated models developed by researchers. Our method was to assess each forecasting approach on the basis of accuracy, data requirements, hardware and software requirements, and ease of use. What we learned is that in many respects, this review is premature. The more sophisticated approaches described in this chapter are still very much in the development stages and can best be considered "alpha versions" that have yet to be tested by the end users. Our review also suffers from the fact that there are few published, refereed works on these methods. Furthermore, the variability of the methods themselves precludes a head-on comparison of the accuracy of one versus another. Nonetheless, this is an appropriate point in which to take -48-

21 Forecasting the Future of Predictive Crime Mapping stock of both current practice and future development, as this review may inform mid-course corrections. Perhaps the most important finding from this review is that, while technology has improved our ability to create, maintain and manipulate data, there is still much work to be done before we can effectively forecast crime trends. GIS has enabled the creation of geographic data (both crime and crime-related) and the integration of data from a variety of sources. However, the most frequently used methods for evaluating the data are the same ones that have been in use for about 30 years. In fact, the current state of knowledge seems to indicate that at least two of the existing and relatively straightforward methods (those based on exponential smoothing) are as effective if not more so than more advanced ones. This is not to say that further examination of new methods should be abandoned. Recent innovations have yet to gain widespread acceptance and we will not be sure of their accuracy until further research is conducted. Specifically, in order to better evaluate the methods that have been created, the field needs more head-to-head comparisons of some of the newer, more sophisticated methods versus the more traditional, univariate ones. These comparisons must also consider the question of what qualifies as an "accurate" prediction, both in relation to the scale of the predicted area and the quality of the prediction itself. Is a 500-foot grid cell necessary, or will a 4,000-foot area (such as the one used by Gorr et al.) suffice? How accurate does the spatial prediction have to be in order to inspire confidence by police officers? If we can identify that there will be an increase in crime, how accurate does the prediction really need to be for effective intervention? Finally, how small does the unit of analysis need to be in order to be practically useful? These are important questions for further investigation; until they are answered, individual researchers and analysts will continue to experiment with their own methods possibly reinventing the wheel rather than learning from each other. One troubling aspect of many of the methods reviewed here is the lack of guiding theory, which not only can help develop better models but also helps us interpret a model's performance so that prevention efforts are improved. The accuracy of the multivariate methods depends upon the appropriateness of the variables included in the model. Since the identification of appropriate variables is grounded in theory, one without the other will only have limited utility. Many of these methods are also very complicated, requiring a high level of specialized statistical and modeling expertise as well as a large volume of data that are not often easily available on a micro level. Ultimately, our goal is to find relatively a simple method that is both ac- -49-
22 Elizabeth R. Groff and Nancy G. La Vigne curate and can tell us something about why future hot spots are likely to emerge in certain locations, so as to inform prevention efforts. Once effective crime forecasting methods are identified, perhaps the most important challenge will be educating practitioners so they can employ them. There is a significant leap that must take place before crime analysts begin to use even the simplest of these methods, and this leap may well be achieved through the automation of forecasting techniques into a user-friendly software program. A parallel can be drawn with the diffusion of statistical techniques and GIS. With the advent of cheap, easy to-use software, the use of statistical software (e.g., SPSS ) increased. The same scenario occurred with GIS software. Recent history suggests that the adoption of sophisticated crime forecasting software would follow the same trajectory if automated tools were available. However, the development of a new set of analytical skills will still be necessary in order to use these new methods. There are several conclusions to be drawn from this review of crime forecasting methods. First, the more complicated methods are not always better predictors. More research is needed that evaluates the relative performance of methods. Second, many questions surrounding the choices made in sophisticated models must be empirically answered before the models will accurately and consistently perform (e.g., size of grid cell size and spatial lag). Third, additional research is needed to identify the input variables in the multivariate models. Choice of variables is critical to the success of the model and must be informed by theory. Finally, the connection between the output of models and how they translate into practice is extremely important. In fact, perhaps the most important measure of a crime forecasting technique may be whether it aids in crime control and prevention. Note: Points of view are those of the authors and do not necessarily represent the views of the U.S. Department of Justice or the National Institute of Justice, or the Urban Institute. Address correspondence to: Nancy G. La Vigne, The Urban Institute, Justice Policy Center, 2100 M Street, NW, Washington, DC E- mail: <[email protected]>. -50-
23 Forecasting the Future of Predictive Crime Mapping Acknowledgments: We would like to thank Professor Wilpen Gorr for his thoughtful and constructive comments on an earlier version of this manuscript. Any errors, misrepresentations or inaccuracies are the fault of the authors. REFERENCES Adams-Fuller, T. (2001). "Historical Homicide Hot Spots: The Case of Three Cities." Doctoral dissertation, Howard University, Washington, DC. Anderson, D., S. Chenery and K. Pease (1995). Biting Back: Tackling Repeat Burglary and Car Crime. (Home Office Crime Prevention Unit Series, No. 58.) London, UK: Home Office. Anselin, L. (1999). Spatial Data Analysis with SpaceStat and ArcView. Ann Arbor, MI: SpaceStat ( Cohen, D. Cook, W.L. Gorr and G. Tita (2000). "Spatial Analysis of Crime." In: D. Duffee (ed.), Measurement and Analysis of Crime and Justice, Criminal Justice 2000, vol. 4. Washington, DC: Office of Justice Programs, National Institute of Justice. Antenucci, J., K. Brown, P. Croswell and M. Kevany, with H. Archer (1991). Geographic Information Systems: A Guide to the Technology. New York, NY: Van Nostrand Reinhold. Bailey, T.C. and A.C. Gatrell (1995). Interactive Spatial Data Analysis. Essex, UK: Addison Wesley Longman Ltd. Becker, G.S. (1968). "Crime and Punishment: An Economic Approach." Journal of Political Economy 76: Bennett, T. (1996). "Identifying, Explaining, and Targeting Burglary Hot Spots." European Journal of Criminal Policy and Research 3: Brantingham, P.J. and P.L. Brantingham (1981). "Notes on the Geometry of Crime." In: P.J. Brantingham and P.L. Brantingham (eds.), Environmental Criminology. Prospect Heights, IL: Waveland Press. and P.L. Brantingham (1978). "A Theoretical Model of Crime Site Selection." In: Krohn and Akers (eds.), Crime Law and Sanctions. Beverly Hills, CA: Sage Publications. Brown, D.E. (2001). Conversation with Professor Donald E. Brown, Chair, Systems and Information Engineering Department, University of Virginia. August 3, H. Liu and Y. Xue (2000). "Mining Preferences from Spatial- Temporal Data." Paper presented at First SIAM International Conference on Data Mining, Chicago, IL, April. -51-
24 Elizabeth R. Groff and Nancy G. La Vigne Brown, R.G. (1963). Smoothing Forecasting and Prediction of Discrete Time Series. Englewood Cliffs, NJ: Prentice Hall. Clarke, K.C. (1997). Getting Started with Geographic Information Systems. Upper Saddle River, NJ: Prentice-Hall. Clarke, R.V. [1992] (1997). Situational Crime Prevention: Successful Case Studies (2 nd ed.). Albany, NY: Harrow and Heston. and R. Homel (1997). "A Revised Classification of Situational Crime Prevention Techniques." In: S.P. Lab (ed.), Crime Prevention at a Crossroad. Cincinnati, OH: Anderson. and D. Weisburd (1994). "Diffusion of Crime Control Benefits: Observations on the Reverse of Displacement." In: R.V. Clarke (ed.), Crime Prevention Studies (vol. 2). Monsey, NY: Criminal Justice Press. Cohen, L.E. and M. Felson (1979). "Social Change and Crime Rate Trends: A Routine Activities Approach." American Sociological Review 44: Cornish, D.B. and R.V. Clarke (1986). The Reasoning Criminal: Rational Choice Perspectives on Offending. New York, NY: Springer. Crime Mapping Laboratory, Police Foundation (2000). "Integrating Community Policing and Computer Mapping: Assessing Issues and Needs Among COPS Office Grantees." Final Report. Washington, DC: Department of Justice, Office of Community Oriented Policing Services ( Dunworth, T., G. Cordner, J. Greene, T. Bynum, S. Decker, T. Rich, S. Ward and V. Webb (1998). "Police Department Information Systems Technology Enhancement Project: ISTEP." Washington, DC: Department of Justice, Office of Community Oriented Policing Services ( Eck, J.E. (1993). "The Threat of Crime Displacement." Criminal Justice Abstracts 25: ESRI (1998). Working with Spatial Analyst: Three Day Course Notebook with Exercises and Training Data. Redlands, CA: ESRI. Farrell, G. (1995). "Predicting and Preventing Revictimisation." In: M. Tonry. and D.P. Farrington (eds.), Building a Safer Society. (Crime and Justice, vol. 19.) Chicago, IL: University of Chicago Press. and K. Pease (2001). Repeat Victimization. (Crime Prevention Studies, vol. 12.) Monsey, NY: Criminal Justice Press. and W. Sousa (2001). "Repeat Vicitimization and Hot Spots: The Overlap and Its Implications for Crime Control and Problem- Oriented Policing." In: G. Farrell and K. Pease (eds.), Repeat Victimization. (Crime Prevention Studies, vol. 12.) Monsey, NY: Criminal Justice Press. -52-
25 Forecasting the Future of Predictive Crime Mapping and K. Pease (1993). Once Bitten, Twice Bitten: Repeat Victimization and its Implications for Crime Prevention. (Home Office Crime Prevention Unit Series No. 46.) London, UK: Home Office. Getis A and B. Boots (1978). Models of Spatial Processes. Cambridge, UK: Cambridge University Press. Gorr, W.L. (2000). "Approaches to Crime Predictive Modeling." Paper presented at annual Crime Mapping Research Conference, San Diego, December. (2001). Conversations with Professor Wilpen Gorr, H. John Heinz HI School of Public Policy, Carnegie Mellon University. August 16 and 17, A. Olligschlaeger and Y. Thompson (forthcoming in 2002). "Assessment of Crime Forecasting Accuracy for Deployment of Police." International Journal of Forecasting. and A. Olligschlaeger (2001). Crime Hot Spot Forecasting: Modeling and Comparative Evaluation. (Draft Final Report.) Washington, DC: Office of Justice Programs, National Institute of Justice. Gottlieb, S., S. Arenberg and R. Singh (1998). Crime Analysis: From First Report to Final Arrest Montclair, CA: Alpha Publishing. Groff, E. (1996). "Information Systems for Community Policing: A Micro- Analysis of Crime." Proceedings of the Urban and Regional Information Systems Association. Park Ridge, IL. and N.G. La Vigne (2001). "Mapping an Opportunity Surface of Residential Burglary." Journal of Research in Crime and Delinquency 38(3): J.K. Fleury and D. Stoe (2000). "Strategic Approaches to Community Safety Initiative (SACSI): Enhancing the Analytic Capacity of a Local Problem-Solving Effort." Washington, DC: National Institute of Justice ( Harries, K.D. (1980). Crime and the Environment. Springfield, IL: Charles C. Thomas. Hesseling, R.B.P. (1995). "Displacement: A Review of the Empirical Literature." In: R.V. Clarke (ed.), Crime Prevention Studies, vol. 3. Monsey, NY: Criminal Justice Press. Jefferis, E. (1998). "A Multi-method Exploration of Crime Hot Spots." Presented at the Academy of Criminal Justice Science's Annual Conference ( pdf). La Vigne, N.G. and E. Groff (2001). "The Evolution of Crime Mapping in the United States: From the Descriptive to the Analytic." In: A. Hirschfield and K. Bowers (eds.), Mapping and Analysing Crime Data: Lessons from Research and Practice. London, UK: Taylor and Francis. -53-
26 Elizabeth R. Groffand Nancy G. La Vigne and J. Wartell (2000). Crime Mapping Case Studies: Successes in the Field (vol. 2). Washington, DC: Police Executive Research Forum. and J. Wartell (1998). Crime Mapping Case Studies: Successes in the Field. Washington, DC: Police Executive Research Forum. Makridakis, S., S.C. Wheelright and V.E. McGee (1983). Forecasting: Methods and Applications (2 nd ed.) Chichester, UK: Wiley. Mamalian, C.A. and N.G. La Vigne (1999). "The Use of Computerized Crime Mapping by Law Enforcement: Survey Results." (National Institute of Justice Research Preview.) Washington, DC: National Institute of Justice. Mathsoft, Data Analysis Division, (1999). S-Plus Guide to Statistics vol. 1. Seattle, WA: Mathsoft. Morgan, F. (2001). "Repeat Burglary in a Perth Suburb: Indicator of Short-term or Long-term Risk?" In: G. Farrell and K. Pease (eds.), Repeat Victimization. (Crime Prevention Studies, vol. 12.) Monsey, NY: Criminal Justice Press. Newman, O. (1972). Defensible Space: Crime Prevention Through Urban Design. New York, NY: Macmillan. Olligschlaeger, A.M. (1997). "Artificial Neural Networks and Crime Mapping." In: D. Weisburd and T. McEwen (eds.), Crime Mapping and Crime Prevention. Monsey, NY: Criminal Justice Press. Ormsby, T. and J. Alvi (1999). Extending ArcView GIS. Redlands, CA: ESRI. Pease, K. (1998). Repeat Victimisation: Taking Stock. (Home Office Crime Prevention and Detection Series, Paper No. 90.) London, UK: Home Office. and G. Laycock (1996). Reducing the Heat on Hot Victims. Washington, DC: Bureau of Justice Statistics. Polvi. N., T. Looman, C. Humphries and K. Pease (1990). "Repeat Break and Enter Victimisation: Time Course and Crime Prevention Opportunity." Journal of Police Science and Administration 17:8-11. Rengert, G. F., S. Chakravorty, K. Henderson and T. Bole (2000). Evolution of Drug Markets: an Analysis of Susceptibility, Accessibility, Opportunity, and Police Action. Draft Final Report. Washington, DC: Office of Justice Programs, National Institute of Justice. Report of the Task Force on Crime Mapping and Data Driven Management (1999). Mapping Out Crime: Providing 21 st Century Tools for Safe Communities. Washington, DC: U.S. Department of Justice and National Partnership for Reinventing Government ( Rich, T. (1995). The Use of Computerized Mapping in Crime Control and Prevention Programs. (National Institute of Justice Research in -54-
27 Forecasting the Future of Predictive Crime Mapping Brief.) Washington, DC: Office of Justice Programs, National Institute of Justice. Sherman, L.W. and D. Weisburd (1995). "General Deterrent Effects of Police Patrol in Crime 'Hot-Spots': A Randomized Controlled Trial." Justice Quarterly 12: P.R. Gartin and M.E. Buerger (1989). "Hot Spots of Predatory Crime: Routine Activities and the Criminology of Place." Criminology 27: Spelman, W. (1995). "Criminal Careers of Public Places." In: D. Weisburd and J. Eck (eds.), Crime and Place. (Crime Prevention Studies, vol. 4.) Monsey, NY: Criminal Justice Press. Townsley, M., R. Homel and J. Chaseling (2000). "Repeat Burglary Victimisation: Spatial and Temporal Patterns." The Australian and New Zealand Journal of Criminology 33(l): Weisburd, D. and T. McEwen (1997). "Introduction." In: D. Weisburd and T. McEwen (eds.), Crime Mapping and Crime Prevention. (Crime Prevention Studies, vol. 8.) Monsey, NY: Criminal Justice Press. Wilson, J.Q. and G.L. Kelling (1982). "Broken Windows: The Police and Neighborhood Safety." The Atlantic Monthly 249(3): NOTES 1. The National Institute of Justice has funded a number of grants to develop predictive models, drawing on spatial regression analysis, environmental modeling, neural network analysis and other methods, and having the capability of being displayed within a GIS ( usdoj.gov/cmrc). 2. This paper is limited to predictions of geographic concentrations of crimes; assessments of "geographic profiling" and other predictive methods to identify the location and time of future serial crimes are beyond the scope of this paper. 3. A GIS consists of hardware, software, and peripherals to create, store, analyze and output geographic data. 4. The term geocode refers to the process of assigning coordinates on the earth's surface to an address or some other location identifier (e.g. zip code, census tract etc.). 5. The terms raster and vector refer to the two main types of geographic information system data models. In a vector GIS all features are repre- -55-
28 Elizabeth R. Groffand Nancy G. LaVigne sented as points, lines or polygons. While a raster GIS is grid cell based. For more information on basic GIS concepts please see K.C. Clarke (1997) and Antenucci et al. (1991). 6. The neighborhood size can be defined by distance from the target cell (e.g., 200 feet) or by specifying a number of cells to use (e.g., 10 cells). 7. Spatial Analyst is a raster GIS extension to ArcView. Version 2.0 of the software includes a visual model builder that allows models to be created and saved so that parameters can be changed and the model run again automatically (i.e., in a "batch" mode). This is a vast improvement over previous versions, for which each layer had to be created in raster form and recreated every time the analyst changed a parameter of the model. 8. It should be noted that this assessment was based upon an examination of hot spots at specific types of locations high schools, public housing projects, subway stations, and parks and playgrounds rather than all hot spots distributed throughout the study area. 9. Persistence was defined as the intersection of five or more hot spot ellipses (based on annual data) over a ten-year period. 10. The software began as a DOS-based program, and was under the auspices of the Illinois Criminal Justice Information Authority (ICJIA). The Spatial and Temporal Analysis of Crime (STAC) is available from the ICJIA's website ( public/index. cfm?metasection= Data&metaPage=StacFacts). 11. CrimeStat is a suite of spatial statistical software tools that is available from NIJ's Crime Mapping Research Center at usdoj.gov/cmrc/tools/welcome.html#crimestat. 12. Three free software programs that contain a hot spot routine using ellipses are ReCAP ( RCAGIS ( and Crime Stat (see footnote 11). 13. The random walk method simply uses the current time period to predict the next time period. One example of this method is when the number of Burglaries in May is used to predict the number of Burglaries in June. 14. In the Naive Lag 12 model the value for the same time period in the previous year is used to predict the value for the current year. Using the above example, Burglaries in June of 2000 would be used to predict Burglaries in June of
29 Forecasting the Future of Predictive Crime Mapping 15. Classical decomposition is used to calculate a seasonal index for each month in relation to other months in the series using multiplicative adjustments to the trend model. 16. Exponential smoothing methods are typically used to forecast shortterm changes in a series and to try and balance sensitivity to structural changes against accuracy of forecasts. Simple exponential smoothing utilizes past values of a series and averages them with exponentially decreasing weights. This method takes into account both the trends and variability in a data series. Recent values in data series with a high degree of variability receive less weight than recent values in series that show a definitive trend. This method "smoothes" out variability in the data series and makes it easier to distinguish actual trends in the data. Another method is Holt's Two-Parameter Linear Exponential Smoothing method (Gorr et al., 2002; Gorr and Olligschlaeger, 2001), which integrates a smoothed time trend model with the generation of two smoothing constants (one for level and one for trend) to create a more accurate forecast of crime. The smoothing constants for both techniques are generated using a grid cell search. 17. Pooling involves combining the data for areas and then computing a common index across all those areas. Pooling provides more homogenous data that, in turn, improve the accuracy of predictions. In Gorr et al.'s (2002) tests they identified the best model for predicting crime as the one that used classical decomposition to calculate pooled seasonal indices by crime type for the whole city (Gorr et al., 2002; Gorr and Olligschlaeger, 2001). Gorr (2001) notes that one potential enhancement to the pooling method he used in his previous research would be to pool the crime data by type of land use (e.g., several categories of residential vs. commercial, etc.). This method has both enough homogeneity in the data and a large enough sample size to get more accurate predictions than those achieved when the pooling was by crime type across the city. 18. Gorr and Olligschlaeger (2001) identified 25 measures of drug calls, 17 measure of property crime and 27 measures of violent crime that they used as leading indicators in their work (Figures 4-6). 19. For more information about incorporating spatial and temporal lag techniques into research see Anselin, 1999; Bailey and Gatrell, 1995 and Mathsoft, Data Analysis Division, For instance, we accounted for the influence of nuisance violations in neighboring grid cells by having the values in those cells be used in the calculation of the target cell. -57-
PREDICTIVE ANALYTICS vs HOT SPOTTING
 PREDICTIVE ANALYTICS vs HOT SPOTTING A STUDY OF CRIME PREVENTION ACCURACY AND EFFICIENCY 2014 EXECUTIVE SUMMARY For the last 20 years, Hot Spots have become law enforcement s predominant tool for crime
An Introduction to Point Pattern Analysis using CrimeStat
 Introduction An Introduction to Point Pattern Analysis using CrimeStat Luc Anselin Spatial Analysis Laboratory Department of Agricultural and Consumer Economics University of Illinois, Urbana-Champaign
LAW ENFORCEMENT AND GEOGRAPHIC INFORMATION SYSTEMS
 LAW ENFORCEMENT AND GEOGRAPHIC INFORMATION SYSTEMS Terra Ann Wright Fayetteville State University 1200 Murchison Road Fayetteville, North Carolina 28301 [email protected] [email protected]
Using a Geographic Information System for Tactical Crime Analysis
 CHAPTER Using a Geographic Information System for Tactical Crime Analysis PHILIP CANTER This chapter discusses the uses of a geographic information system (GIs) for tactical crime analysis. A tactical
Identifying High Crime Areas
 International Association of Crime Analysts (IACA) Identifying High Crime Areas Standards, Methods, & Technology (SMT) Committee White Paper 2013-02 October 2013 IACA SMT Committee Methods Subcommittee
Geocoding in Law Enforcement Final Report
 Geocoding in Law Enforcement Final Report Geocoding in Law Enforcement Final Report Prepared by: The Crime Mapping Laboratory Police Foundation August 2000 Report to the Office of Community Oriented Policing
PREDICTIVE ANALYTICS VS. HOTSPOTTING
 PREDICTIVE ANALYTICS VS. HOTSPOTTING A STUDY OF CRIME PREVENTION ACCURACY AND EFFICIENCY EXECUTIVE SUMMARY For the last 20 years, Hot Spots have become law enforcement s predominant tool for crime analysis.
August 2013. Emory University, Atlanta, GA Double major: Sociology and Political Science December 2005
 CODY W. TELEP School of Criminology and Criminal Justice Arizona State University Mail Code 4420 411 N. Central Avenue, Suite 600 Phoenix, AZ 85004 Phone: 602.496.1295 Fax: 602.496.2366 Email: [email protected]
Alison Hayes November 30, 2005 NRS 509. Crime Mapping OVERVIEW
 Alison Hayes November 30, 2005 NRS 509 Crime Mapping OVERVIEW Geographic data has been important to law enforcement since the beginning of local policing in the nineteenth century. The New York City Police
Spatial Data Analysis
 14 Spatial Data Analysis OVERVIEW This chapter is the first in a set of three dealing with geographic analysis and modeling methods. The chapter begins with a review of the relevant terms, and an outlines
Prediction of Stock Performance Using Analytical Techniques
 136 JOURNAL OF EMERGING TECHNOLOGIES IN WEB INTELLIGENCE, VOL. 5, NO. 2, MAY 2013 Prediction of Stock Performance Using Analytical Techniques Carol Hargreaves Institute of Systems Science National University
Street level Drug Enforcement What Works Briefing
 Street level Drug Enforcement What Works Briefing Summary: Problem-oriented, community, and hot spots policing are each more successful in policing drugs markets than the traditional approach of preventative
Crime Mapping and Crime Prevention
 Crime Mapping and Crime Prevention David Weisburd and Tom McEwen Editors CRIME PREVENTION STUDIES Volume 8 Criminal Justice Press Monsey, New York, U.S.A. 1997 CRIME PREVENTION STUDIES Ronald V. Clarke,
Community Policing. Defined
 Community Policing Defined The Primary Elements of Community Policing Nonprof its / Service Providers Using the Crime Triangle Community policing is a philosophy that promotes organizational strategies
Using Social Media Data to Assess Spatial Crime Hotspots
 Using Social Media Data to Assess Spatial Crime Hotspots 1 Introduction Nick Malleson 1 and Martin Andreson 2 1 School of Geography, University of Leeds 2 School of Criminology, Simon Fraser University,
THE USE OF GEOGRAPHIC INFORMATION SYSTEMS (GIS) FOR STATE AND LOCAL CRIME ANALYSIS
 FOR STATE AND LOCAL CRIME ANALYSIS") STATISTICAL COMMISSION and Working Paper No. 19 ECONOMIC COMMISSION FOR EUROPE English only CONFERENCE OF EUROPEAN STATISTICIANS Work Session on Geographical Information Systems (Ottawa, Canada, 5-7 October
STATISTICAL COMMISSION and Working Paper No. 19 ECONOMIC COMMISSION FOR EUROPE English only CONFERENCE OF EUROPEAN STATISTICIANS Work Session on Geographical Information Systems (Ottawa, Canada, 5-7 October
MAPPING DRUG OVERDOSE IN ADELAIDE
 MAPPING DRUG OVERDOSE IN ADELAIDE Danielle Taylor GIS Specialist GISCA, The National Key Centre for Social Applications of GIS University of Adelaide Roslyn Clermont Corporate Information Officer SA Ambulance
The Impact of Home Burglar Alarm Systems on Residential Burglaries
 EXECUTIVE SUMMARY The Impact of Home Burglar Alarm Systems on Residential Burglaries By Seungmug (a.k.a. Zech) Lee, Ph.D. FACULTY ADVISORY COMMITTEE: Professor Ronald V. Clarke, Ph.D., Rutgers University
Ryan W. Randa. Curriculum Vitae. Sam Houston State University Montgomery, TX 77356 Box 2296 C: 513.807.0943
 Ryan W. Randa Curriculum Vitae PERSONAL DATA Office Address: Home Address: College of Criminal Justice 118 Lake View Circle Sam Houston State University Montgomery, TX 77356 Box 2296 C: 513.807.0943 Huntsville,
NTC Project: S01-PH10 (formerly I01-P10) 1 Forecasting Women s Apparel Sales Using Mathematical Modeling
 1 Forecasting Women s Apparel Sales Using Mathematical Modeling") 1 Forecasting Women s Apparel Sales Using Mathematical Modeling Celia Frank* 1, Balaji Vemulapalli 1, Les M. Sztandera 2, Amar Raheja 3 1 School of Textiles and Materials Technology 2 Computer Information
1 Forecasting Women s Apparel Sales Using Mathematical Modeling Celia Frank* 1, Balaji Vemulapalli 1, Les M. Sztandera 2, Amar Raheja 3 1 School of Textiles and Materials Technology 2 Computer Information
Writing the Empirical Social Science Research Paper: A Guide for the Perplexed. Josh Pasek. University of Michigan.
 Writing the Empirical Social Science Research Paper: A Guide for the Perplexed Josh Pasek University of Michigan January 24, 2012 Correspondence about this manuscript should be addressed to Josh Pasek,
The Effect of Neighborhood Watch. Programs on Neighborhood Crime in. Medford Oregon
 The Effect of Neighborhood Watch Programs on Neighborhood Crime in Medford Oregon Economics 419: Honors Thesis - Draft May 25th, 2014 Abstract: Over the past decade Medford Oregon has expanded their Neighborhood
Gun Availability and Crime in West Virginia: An Examination of NIBRS Data
 Gun Availability and Crime in West Virginia: An Examination of NIBRS Data Presentation at the BJS/JRSA Conference October, 2008 Stephen M. Haas, WV Statistical Analysis Center John P. Jarvis, FBI Behavioral
The relative advantages and disadvantages of the causal and non-causal approaches to tourism demand forecasting.
 The relative advantages and disadvantages of the causal and non-causal approaches to tourism demand forecasting. By Kostas E. Sillignakis The aim of this essay is to discuss the relative advantages and
Using Spatial Statistics In GIS
 Using Spatial Statistics In GIS K. Krivoruchko a and C.A. Gotway b a Environmental Systems Research Institute, 380 New York Street, Redlands, CA 92373-8100, USA b Centers for Disease Control and Prevention;
CHRISTINE N. FAMEGA. California State University-San Bernardino, Department of Criminal
 CHRISTINE N. FAMEGA California State University - San Bernardino Department of Criminal Justice 5500 University Pkwy San Bernardino, CA 92407-2397 (909) 537-5285 [email protected] EDUCATION 2003 Ph.D.,
Marketing Mix Modelling and Big Data P. M Cain
 1) Introduction Marketing Mix Modelling and Big Data P. M Cain Big data is generally defined in terms of the volume and variety of structured and unstructured information. Whereas structured data is stored
A GENERAL TAXONOMY FOR VISUALIZATION OF PREDICTIVE SOCIAL MEDIA ANALYTICS
 A GENERAL TAXONOMY FOR VISUALIZATION OF PREDICTIVE SOCIAL MEDIA ANALYTICS Stacey Franklin Jones, D.Sc. ProTech Global Solutions Annapolis, MD Abstract The use of Social Media as a resource to characterize
ADVANCED GEOGRAPHIC INFORMATION SYSTEMS Vol. II - GIS Project Planning and Implementation Somers R.M. GIS PROJECT PLANNING AND IMPLEMENTATION
 GIS PROJECT PLANNING AND IMPLEMENTATION Somers R. M. Somers-St. Claire, Fairfax, Virginia, USA Keywords: Geographic information system (GIS), GIS implementation, GIS management, geospatial information
Data Visualization Techniques and Practices Introduction to GIS Technology
 Data Visualization Techniques and Practices Introduction to GIS Technology Michael Greene Advanced Analytics & Modeling, Deloitte Consulting LLP March 16 th, 2010 Antitrust Notice The Casualty Actuarial
Comparison of K-means and Backpropagation Data Mining Algorithms
 Comparison of K-means and Backpropagation Data Mining Algorithms Nitu Mathuriya, Dr. Ashish Bansal Abstract Data mining has got more and more mature as a field of basic research in computer science and
The Combination Forecasting Model of Auto Sales Based on Seasonal Index and RBF Neural Network
 , pp.67-76 http://dx.doi.org/10.14257/ijdta.2016.9.1.06 The Combination Forecasting Model of Auto Sales Based on Seasonal Index and RBF Neural Network Lihua Yang and Baolin Li* School of Economics and
Making confident decisions with the full spectrum of analysis capabilities
 IBM Software Business Analytics Analysis Making confident decisions with the full spectrum of analysis capabilities Making confident decisions with the full spectrum of analysis capabilities Contents 2
Data Mining Applications in Higher Education
 Executive report Data Mining Applications in Higher Education Jing Luan, PhD Chief Planning and Research Officer, Cabrillo College Founder, Knowledge Discovery Laboratories Table of contents Introduction..............................................................2
INCREASING FORECASTING ACCURACY OF TREND DEMAND BY NON-LINEAR OPTIMIZATION OF THE SMOOTHING CONSTANT
 58 INCREASING FORECASTING ACCURACY OF TREND DEMAND BY NON-LINEAR OPTIMIZATION OF THE SMOOTHING CONSTANT Sudipa Sarker 1 * and Mahbub Hossain 2 1 Department of Industrial and Production Engineering Bangladesh
COMBINING THE METHODS OF FORECASTING AND DECISION-MAKING TO OPTIMISE THE FINANCIAL PERFORMANCE OF SMALL ENTERPRISES
 COMBINING THE METHODS OF FORECASTING AND DECISION-MAKING TO OPTIMISE THE FINANCIAL PERFORMANCE OF SMALL ENTERPRISES JULIA IGOREVNA LARIONOVA 1 ANNA NIKOLAEVNA TIKHOMIROVA 2 1, 2 The National Nuclear Research
Chapter 2 presents the theoretical foundation for understanding how crime and disorder occur;
 CHAPTER 31 Effectiveness of Police in Reducing Crime and the Role of Crime Analysis Chapter 2 presents the theoretical foundation for understanding how crime and disorder occur; it also details ways to
Comments of the World Privacy Forum To: Office of Science and Technology Policy Re: Big Data Request for Information. Via email to bigdata@ostp.
 3108 Fifth Avenue Suite B San Diego, CA 92103 Comments of the World Privacy Forum To: Office of Science and Technology Policy Re: Big Data Request for Information Via email to [email protected] Big Data
Location Analytics for Financial Services. An Esri White Paper October 2013
 Location Analytics for Financial Services An Esri White Paper October 2013 Copyright 2013 Esri All rights reserved. Printed in the United States of America. The information contained in this document is
Prediction Model for Crude Oil Price Using Artificial Neural Networks
 Applied Mathematical Sciences, Vol. 8, 2014, no. 80, 3953-3965 HIKARI Ltd, www.m-hikari.com http://dx.doi.org/10.12988/ams.2014.43193 Prediction Model for Crude Oil Price Using Artificial Neural Networks
Business Valuation Review
 Business Valuation Review Regression Analysis in Valuation Engagements By: George B. Hawkins, ASA, CFA Introduction Business valuation is as much as art as it is science. Sage advice, however, quantitative
ADVANCED GEOGRAPHIC INFORMATION SYSTEMS Vol. II - Introduction to Spatial Decision Support System Piotr Jankowski and Timothy Nyerges
 INTRODUCTION TO SPATIAL DECISION SUPPORT SYSTEM Piotr Jankowski San Diego State University, San Diego, USA Timothy Nyerges University of Washington, Seattle, USA Keywords: spatial decision support systems,
Accurately and Efficiently Measuring Individual Account Credit Risk On Existing Portfolios
 Accurately and Efficiently Measuring Individual Account Credit Risk On Existing Portfolios By: Michael Banasiak & By: Daniel Tantum, Ph.D. What Are Statistical Based Behavior Scoring Models And How Are
Direct Marketing of Insurance. Integration of Marketing, Pricing and Underwriting
 Direct Marketing of Insurance Integration of Marketing, Pricing and Underwriting As insurers move to direct distribution and database marketing, new approaches to the business, integrating the marketing,
Conceptual Integrated CRM GIS Framework
 Conceptual Integrated CRM GIS Framework Asmaa Doedar College of Computing and Information Technology Arab Academy for science &Technology Cairo, Egypt [email protected] Abstract : CRM system(customer
Gathering and Managing Environmental Quality Data for Petroleum Projects ABSTRACT
 Gathering and Managing Environmental Quality Data for Petroleum Projects Dr. David W. Rich, President, Geotech Computer Systems, Inc., Englewood, CO ABSTRACT Petroleum environmental projects face special
A HYBRID APPROACH FOR AUTOMATED AREA AGGREGATION
 A HYBRID APPROACH FOR AUTOMATED AREA AGGREGATION Zeshen Wang ESRI 380 NewYork Street Redlands CA 92373 [email protected] ABSTRACT Automated area aggregation, which is widely needed for mapping both natural
DECISION TREE ANALYSIS: PREDICTION OF SERIOUS TRAFFIC OFFENDING
 DECISION TREE ANALYSIS: PREDICTION OF SERIOUS TRAFFIC OFFENDING ABSTRACT The objective was to predict whether an offender would commit a traffic offence involving death, using decision tree analysis. Four
Solve your toughest challenges with data mining
 IBM Software IBM SPSS Modeler Solve your toughest challenges with data mining Use predictive intelligence to make good decisions faster Solve your toughest challenges with data mining Imagine if you could
Risk Management Procedure For The Derivation and Use Of Soil Exposure Point Concentrations For Unrestricted Use Determinations
 Risk Management Procedure For The Derivation and Use Of Soil Exposure Point Concentrations For Unrestricted Use Determinations Hazardous Materials and Waste Management Division (303) 692-3300 First Edition
Risk Clusters, Hotspots, and Spatial Intelligence: Risk Terrain Modeling as an Algorithm for Police Resource Allocation Strategies
 DOI 10.1007/s10940-010-9126-2 ORIGINAL PAPER Risk Clusters, Hotspots, and Spatial Intelligence: Risk Terrain Modeling as an Algorithm for Police Resource Allocation Strategies Leslie W. Kennedy Joel M.
IS424 Data Mining and Business Analytics. Term 2 Group Project. Crime Data Analysis. Professor: FeiDa Zhu. George He Shuxian Varun Ponnuru Eric Chow
 IS424 Data Mining and Business Analytics Term 2 Group Project Crime Data Analysis Professor: FeiDa Zhu George He Shuxian Varun Ponnuru Eric Chow 1 Table of Contents INTRODUCTION 3 DATA DESCRIPTION 4 DATA
Statistics in Retail Finance. Chapter 7: Fraud Detection in Retail Credit
 Statistics in Retail Finance Chapter 7: Fraud Detection in Retail Credit 1 Overview > Detection of fraud remains an important issue in retail credit. Methods similar to scorecard development may be employed,
Using simulation to calculate the NPV of a project
 Using simulation to calculate the NPV of a project Marius Holtan Onward Inc. 5/31/2002 Monte Carlo simulation is fast becoming the technology of choice for evaluating and analyzing assets, be it pure financial
Cyber threat intelligence and the lessons from law enforcement. kpmg.com/cybersecurity
 Cyber threat intelligence and the lessons from law enforcement kpmg.com/cybersecurity Introduction Cyber security breaches are rarely out of the media s eye. As adversary sophistication increases, many
Better planning and forecasting with IBM Predictive Analytics
 IBM Software Business Analytics SPSS Predictive Analytics Better planning and forecasting with IBM Predictive Analytics Using IBM Cognos TM1 with IBM SPSS Predictive Analytics to build better plans and
Crime Mapping Methods. Assigning Spatial Locations to Events (Address Matching or Geocoding)
") Chapter 15 Crime Mapping Crime Mapping Methods Police departments are never at a loss for data. To use crime mapping is to take data from myriad sources and make the data appear on the computer screen
Chapter 15 Crime Mapping Crime Mapping Methods Police departments are never at a loss for data. To use crime mapping is to take data from myriad sources and make the data appear on the computer screen
WEB AND SMS BASED GEOGRAPHIC INFORMATION SYSTEM TO MONITOR BURGLARY IN A SAMPLE URBAN CENTRE IN TAMIL NADU, INDIA
 WEB AND SMS BASED GEOGRAPHIC INFORMATION SYSTEM TO MONITOR BURGLARY IN A SAMPLE URBAN CENTRE IN TAMIL NADU, INDIA Dr.P.H.Anand, M.Sc.,M.Phil.,Ph.D. Associate Professor and Head, PG and Research Department
Forward Thinking for Tomorrow s Projects Requirements for Business Analytics
 Seilevel Whitepaper Forward Thinking for Tomorrow s Projects Requirements for Business Analytics By: Joy Beatty, VP of Research & Development & Karl Wiegers, Founder Process Impact We are seeing a change
Better decision making under uncertain conditions using Monte Carlo Simulation
 IBM Software Business Analytics IBM SPSS Statistics Better decision making under uncertain conditions using Monte Carlo Simulation Monte Carlo simulation and risk analysis techniques in IBM SPSS Statistics
What is Data Mining, and How is it Useful for Power Plant Optimization? (and How is it Different from DOE, CFD, Statistical Modeling)
") data analysis data mining quality control web-based analytics What is Data Mining, and How is it Useful for Power Plant Optimization? (and How is it Different from DOE, CFD, Statistical Modeling) StatSoft
data analysis data mining quality control web-based analytics What is Data Mining, and How is it Useful for Power Plant Optimization? (and How is it Different from DOE, CFD, Statistical Modeling) StatSoft
Optimization of technical trading strategies and the profitability in security markets
 Economics Letters 59 (1998) 249 254 Optimization of technical trading strategies and the profitability in security markets Ramazan Gençay 1, * University of Windsor, Department of Economics, 401 Sunset,
Chapter Managing Knowledge in the Digital Firm
 Chapter Managing Knowledge in the Digital Firm Essay Questions: 1. What is knowledge management? Briefly outline the knowledge management chain. 2. Identify the three major types of knowledge management
A Comparison of System Dynamics (SD) and Discrete Event Simulation (DES) Al Sweetser Overview.
 and Discrete Event Simulation (DES) Al Sweetser Overview.") A Comparison of System Dynamics (SD) and Discrete Event Simulation (DES) Al Sweetser Andersen Consultng 1600 K Street, N.W., Washington, DC 20006-2873 (202) 862-8080 (voice), (202) 785-4689 (fax) [email protected]
A Comparison of System Dynamics (SD) and Discrete Event Simulation (DES) Al Sweetser Andersen Consultng 1600 K Street, N.W., Washington, DC 20006-2873 (202) 862-8080 (voice), (202) 785-4689 (fax) [email protected]
Integrated Resource Plan
 Integrated Resource Plan March 19, 2004 PREPARED FOR KAUA I ISLAND UTILITY COOPERATIVE LCG Consulting 4962 El Camino Real, Suite 112 Los Altos, CA 94022 650-962-9670 1 IRP 1 ELECTRIC LOAD FORECASTING 1.1
Lawrence W. Sherman Criminologist
 Lawrence W. Sherman Criminologist Download Publications The following publications can be read, and usually downloaded, free of charge by clicking on the link after each citation. Some citations do not
GIS AT WORK IN THE CRIMINAL JUSTICE SYSTEM
 Frank Chiodi Minneapolis City Attorney s Office #300 Metropolitan Center 333 South Seventh Street Minneapolis, MN 55402 Tel: 612-673-2966 Fax: 612-673-3811 Email: [email protected] Presentation
EXPLORING SPATIAL PATTERNS IN YOUR DATA
 EXPLORING SPATIAL PATTERNS IN YOUR DATA OBJECTIVES Learn how to examine your data using the Geostatistical Analysis tools in ArcMap. Learn how to use descriptive statistics in ArcMap and Geoda to analyze
1 Fundamentals of Crime Analysis
 1 Fundamentals of Crime Analysis Christopher W. Bruce I nformation is the most valuable commodity in the world. It s more valuable than money, for with it one can make money. It s more valuable than power,
Crime Prevention Research Review No. 2
 U.S. Department of Justice Office of Community Oriented Policing Services Crime Prevention Research Review No. 2 Police Enforcement Strategies to Prevent Crime in Hot Spot Areas Anthony A. Braga, Ph.D.
GEOGRAPHIC INFORMATION SYSTEMS (GIS): THE BEDROCK OF NG9-1-1
: THE BEDROCK OF NG9-1-1") GEOGRAPHIC INFORMATION SYSTEMS (GIS): THE BEDROCK OF NG9-1-1 THE TIME IS NOW FOR PSAPS AND REGIONAL AGENCIES TO TAKE ADVANTAGE OF THE ACCURATE GEOSPATIAL DATABASES THAT WILL BE KEY TO NEXT GENERATION EMERGENCY
GEOGRAPHIC INFORMATION SYSTEMS (GIS): THE BEDROCK OF NG9-1-1 THE TIME IS NOW FOR PSAPS AND REGIONAL AGENCIES TO TAKE ADVANTAGE OF THE ACCURATE GEOSPATIAL DATABASES THAT WILL BE KEY TO NEXT GENERATION EMERGENCY
Technology has been a boon to
 Solutions Forecasting Technology The State of the Market By Elizabeth Fu Governments can choose from a number of software packages to use in forecasting, and choosing the right one for any given jurisdiction
Journal of Financial and Economic Practice
 Analyzing Investment Data Using Conditional Probabilities: The Implications for Investment Forecasts, Stock Option Pricing, Risk Premia, and CAPM Beta Calculations By Richard R. Joss, Ph.D. Resource Actuary,
GEOGRAPHIC INFORMATION SYSTEMS AND CRIME ANALYSIS IN BALTIMORE COUNTY, MARYLAND. Philip R. Canter
 GEOGRAPHIC INFORMATION SYSTEMS AND CRIME ANALYSIS IN BALTIMORE COUNTY, MARYLAND by Philip R. Canter Baltimore County Police Department Abstract: Analytic mapping and geographic databases are being increasingly
Local outlier detection in data forensics: data mining approach to flag unusual schools
 Local outlier detection in data forensics: data mining approach to flag unusual schools Mayuko Simon Data Recognition Corporation Paper presented at the 2012 Conference on Statistical Detection of Potential
Risk Terrain Modeling: Brokering Criminological Theory and GIS Methods for Crime Forecasting
 JUSTICE QUARTERLY 2010, 1 22, ifirst Article Risk Terrain Modeling: Brokering Criminological Theory and GIS Methods for Crime Forecasting RJQY_A_486037.sgm 10.1080/07418825.2010.486037 Justice 0741-8825
Practical Time Series Analysis Using SAS
 Practical Time Series Analysis Using SAS Anders Milhøj Contents Preface... vii Part 1: Time Series as a Subject for Analysis... 1 Chapter 1 Time Series Data... 3 1.1 Time Series Questions... 3 1.2 Types
USING LOGISTIC REGRESSION TO PREDICT CUSTOMER RETENTION. Andrew H. Karp Sierra Information Services, Inc. San Francisco, California USA
 USING LOGISTIC REGRESSION TO PREDICT CUSTOMER RETENTION Andrew H. Karp Sierra Information Services, Inc. San Francisco, California USA Logistic regression is an increasingly popular statistical technique
What is GIS? Geographic Information Systems. Introduction to ArcGIS. GIS Maps Contain Layers. What Can You Do With GIS? Layers Can Contain Features
 What is GIS? Geographic Information Systems Introduction to ArcGIS A database system in which the organizing principle is explicitly SPATIAL For CPSC 178 Visualization: Data, Pixels, and Ideas. What Can
Bootstrapping Big Data
 Bootstrapping Big Data Ariel Kleiner Ameet Talwalkar Purnamrita Sarkar Michael I. Jordan Computer Science Division University of California, Berkeley {akleiner, ameet, psarkar, jordan}@eecs.berkeley.edu
John Andrew Hansen Department of Criminology and Criminal Justice Western Carolina University Belk 410-G Cullowhee, NC 28723 jahansen@wcu.
 Revised: August, 2015 John Andrew Hansen Department of Criminology and Criminal Justice Western Carolina University Belk 410-G Cullowhee, NC 28723 [email protected] Education: 2015 Ph.D., Criminology and
A Better Statistical Method for A/B Testing in Marketing Campaigns
 A Better Statistical Method for A/B Testing in Marketing Campaigns Scott Burk Marketers are always looking for an advantage, a way to win customers, improve market share, profitability and demonstrate
The Method of Least Squares
 Hervé Abdi 1 1 Introduction The least square methods (LSM) is probably the most popular technique in statistics. This is due to several factors. First, most common estimators can be casted within this
Using News Articles to Predict Stock Price Movements
 Using News Articles to Predict Stock Price Movements Győző Gidófalvi Department of Computer Science and Engineering University of California, San Diego La Jolla, CA 9237 [email protected] 21, June 15,