Profit is affected by seasonal variations and ramp up of new employees. EBITDA of NOK 1 (-2) million and 0.5% (-2.7%) margin in the third quarter.
|
|
|
- Asher Reed
- 7 years ago
- Views:
Transcription
1

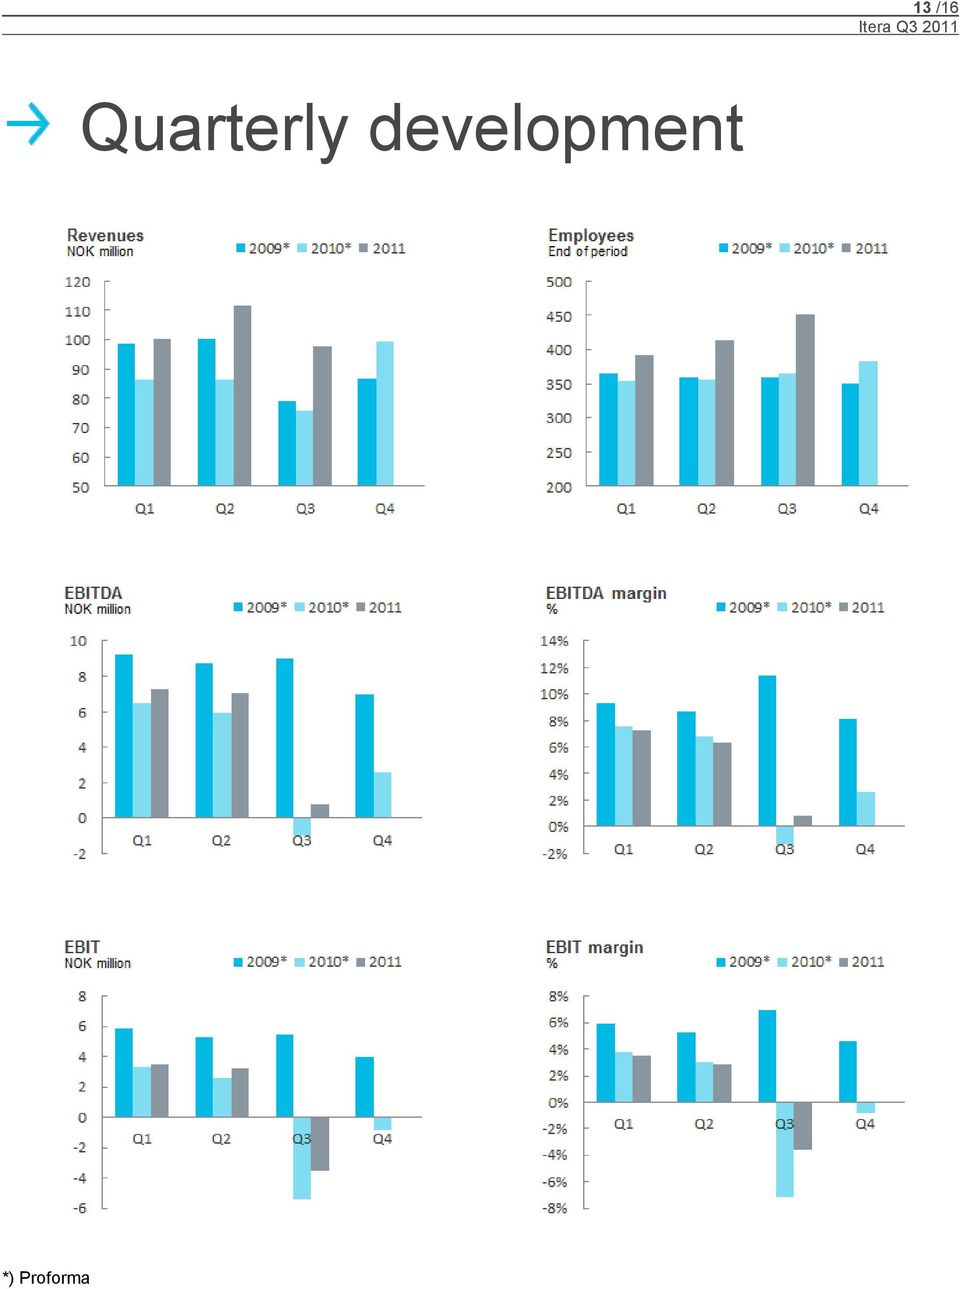
2 2 /16 Highlights Q3 The growth continues in the third quarter with strong growth in number of employees and low turnover rate. Profit is affected by seasonal variations and ramp up of new employees. Cancellation of 2.4 million own shares and equity ratio of 44% (53%). 29% growth in the third quarter and 25% year to date, with revenues of NOK 98 and 310 million, respectively Number of employees has increased to 452, up by 38 in the third quarter and by 87 last 12 months. EBITDA of NOK 1 (-2) million and 0.5% (-2.7%) margin in the third quarter. Operating profit (EBIT) of NOK 4 (-5) million and -3.6% (-7.1%) margin in the third quarter. Good development in sales and increasing deliveries of the Group s full range of services. Good market outlook, strengthened brand and motivated people are providing a platform for profitable growth. KEY FIGURES change change 2010 All figures in NOK million * % * % 1-12 Sales revenue % % 384 Gross profit % % 309 EBITDA % % 26 EBITDA margin 0.8 % -2.7 % 4.9 % 4.1 % 6.7 % EBIT % % 12 EBIT margin -3.6 % -7.1 % 1.0 % 0.2 % 3.2 % Profit before tax % % 13 Profit for the period % % 12 Profit margin -2.6 % -4.2 % 0.8 % 0.7 % 3.0 % Earnings per share % % 0.14 Fully diluted earnings per share % % 0.14 Net cash flow from operating activities Bank deposits Number of employees at the end of the period % % 382 * Pro forma
 million and 0.5% (-2.7%) margin in the third quarter. Operating profit (EBIT) of NOK 4 (-5) million and -3.6% (-7.1%) margin in the third quarter.")
3 3 /16 Interim Report Q3 FINANCIAL PERFORMANCE Accounting principles The consolidated interim report includes Itera ASA with subsidiaries. The accounting principles are unchanged in The consolidated interim report has been prepared in accordance with the Norwegian Securities Trading Act and IAS 34 Interim Financial Reporting. The interim report has not been audited and does not include all information required for a complete annual report. Further information and complete description of the accounting principles can be read in the annual report for Pro forma figures The statement of comprehensive income for 2010 shows pro forma figures. The pro forma figures take into account the sale of a subsidiary in the third quarter last year. Pro forma figures are shown in a columns labeled "* " in the statement of comprehensive income. In the following, all comparisons made against the pro forma figures unless otherwise are specified. This is to provide more relevant information. The statement of financial position (balance sheet) and statement of cash flow have not been restated for pro forma figures. Operating revenue Operating revenues amounted to NOK 97.6 (75.6) million in the third quarter and NOK (248.2) million in the first three quarters. The organic growth was 29 (-5) percent in the third quarter and 25 (-9) percent in the first three quarters compared to the same periods last year. Gross margin 1 amounted to NOK 76.6 (62.6) million in the third quarter and NOK (202.4) in the first three quarters, corresponding to an increase of 22 (-8) respectively 23 (-10) percent compared to same periods last year. The group experienced an increase in revenue in all subsidiaries and countries. The operation in Denmark is improving after a period with weak results. Operating expenses Itera s operating expenses amounted to NOK (81.0) million the third quarter and NOK (247.7) million in the first three quarters, corresponding to an increase of 25 respectively 24 percent. Cost of sales amounted to NOK 21.1 (13.0) million in the third quarter and NOK 61.4 (45.8) in the first three quarters. Cost of sales mainly consists of purchases of services from the consultants and expenses related to the Group's hosting business and will vary from quarter to quarter. The personnel expenses are increased in the third quarter by 15 percent to NOK 64.1 million compared to the same period last year. In the first three quarters the personnel expenses amounted to NOK (168.6) million, corresponding to an increase of 17 percent. The increase is due to the increase in number of employees to secure the delivery capacity. An increasing proportion of the employees are located at the nearshore operation in Ukraine, that isolated reduce the personnel expenses per employee. Other operating expenses amounted to NOK 11.6 (8.8) million in the third quarter and NOK 35.9 (23.6) year to date. The increase is mainly due to costs related to the Group's growth, including recruitment, new nearshore location in Ukraine, marketing activities and the hosting operations. Profit Operating profit before depreciation (EBITDA) amounted to NOK 0.8 (-2.0) million in the third quarter and NOK 15.2 (10.3) in the first three quarters, corresponding to a margin of 0.8 (-2.7) respectively 4.9 (4.1) percent. Depreciations amounted to NOK 4.3 (3.4) million in the third quarter and NOK 11.9 (9.8) million year to date. Operating profit (EBIT) amounted to NOK -3.5 (-5.4) million in the third quarter and NOK 3.2 (0.5) million in the first three quarters, corresponding to a margin of -3.6 (-7.1) respectively 1.0 (0.2) percent. The operating profit was negatively impacted by the introduction of 38 new employees in the third quarter to ensure the delivery capacity. Normal ramp up time before billable projects is 6-8 weeks per employee, depending on the competency profile and level of experience. In addition, the quarter charged with NOK 1 million in project overruns. Net financial items amounted to NOK 0 (0.1) million in the third quarter and NOK 0.1 (1.0) million year to date. Profit after tax amounted to NOK -2.5 (-3.2) million in the third quarter and NOK 2.4 (1.7) million in the first three quarters. Estimated income tax amounted to NOK +1.0 (2.1) million in the third quarter and NOK 0.9 (+0.2) million in the first three quarters, of which NOK 0 (0) million is payable. The Group has NOK 14.3 million in total deferred tax assets, of which NOK 10.3 million is recognized in the statement of financial position. The deferred tax assets will ensure that the group probably not will pay tax until 2012.

4 4 /16 Cash flow and equity Cash flow from operations amounted to NOK -6.7 (-2.3) million in the third quarter and NOK 0.7 (0.4) million in the first three quarters. The increase in other receivable of NOK 4.5 million in the third quarter and the reduction in short term liabilites of NOK 6 million affect the cash flow negative. The sales and lease back transaction has a positive effect. The bank deposits amounted to NOK 11.2 (45.0) million at the end of the third quarter. In addition, the Group has a credit facility of NOK 25 million. At year-end the bank deposits was amounted to NOK 40.1 million. In the third quarter a sales and lease back transaction has generated a non-current interest bearing debt of NOK 7.2 million. Itera re-purchased 85,000 (193,000) own shares year to date. After cancellation of 2.4 million own shares, Itera holds the total of 0.9 (2.8) own shares at the end of the third quarter with a market value of NOK 2.3 (9.2) million. The share capital is reduced with NOK 720,000 in the third quarter by cancellation of 2,400,000 own shares. The share capital after this transaction is NOK 24,882,104 equal to 82,940,346 shares at a face value of NOK The equity at the end of the third quarter was NOK 69 (79) million, corresponding to an equity ratio of 44 (53) percent. Investments Total investments amounted to NOK 3.7 (2.7) million in the third quarter and NOK 21.2 (9.1) million in the first three quarters. The increase is mainly due to investments related to the Group's hosting business. Investments in hardware and software related to the hosting business was amounted to NOK 2.3 (1.7) million in the third quarter and NOK 17.0 (4.9) million year to date. Investments in intangible assets, such as SaaSofferings with subscription based fixed income are on the same level as earlier and was amounted to NOK 1.5 (1.1) million in the third quarter and NOK 4.2 (4.2) million in the first three quarters. In the third quarter the Group's hosting business has performed a sales and lease back transaction amounted to NOK 7 million. The assets was invested in the first half year and recognized as investments. The sales price was equal to the historical purchase price The transaction is recognized net in the statement of cash flow, but gross in the statement of financial position. BUSINESS REVIEW The Group finds it satisfactory to see that the growth in the first half of the year is reinforced in the third quarter. The planned delivery capacity is now secured, and the Group is now capable to take on bigger and more challenging commitments than ever before. The Group is now entering a phase of optimization, where focus will be on utilization to secure profit. Strategic target areas Customer development Itera targets larger, long-term customer relationships in order to be a close business partner and actively participate in the customers strategic development. Furthermore, this will contribute to improved activity and profit visibility, larger order book and internal stability. Itera has defined a set of strategic customers across the Group. The customers are potential buyers of Itera s complete range of services, from consulting, concepts and solutions to system development, project management, application management and operations. Several of the customers operate in the same countries as Itera, they are innovation-driven, they represent sectors with high levels of change, and they see smart use of technology as a key driver to achieve business goals. Revenue related to the 10 largest customers shows a positive trend, increasing from 22 percent in the third quarter of 2010 to 32 percent in the same period this year. During third quarter, Itera has signed agreements with Bergen University College, The Western Norway Regional Health Authority (WNRHA, "Helse Vest"), The Norwegian National Opera & Ballet, Hjelp 24, Optimarin, Faroe Petroleum Norge, Lillehammer, Gjøvik and Hedmark University Colleges, Aker Solutions and the Norwegian Automobile Federation (NAF). Employee satisfaction and attractiveness Itera aims to be an attractive employer for both existing and potential employees. To attract, retain and develop employees is a leading objective of the Group s strategy. Attract The recruitment activity in the third quarter has been very high. During 2011, the media coverage of Itera has been extensive and positive, and the Group is experiencing that the awareness of and knowledge about the Itera brand is increasing. This has positive effects, amongst others in the recruitment activities. The talents are attracted to a group that can offer challenging tasks and teamwork with large customers across national borders. The Group has during the third quarter increased by 38 employees, which represents the most extensive net staffing increase ever. Among these, only two are nonbillable resources. The Group has now 452 employees. The last 12 months, the Group has increased by 87 employees, equivalent to 24 percent. The share of resources located nearshore is increasing, and amounted to 15 percent at the end of the quarter. Itera has 67 employees based in its two offices in Kiev and Lviv, Ukraine. Retain We are working purposefully to continuously improve employee satisfaction, and all employees have the opportunity to give their input. The Group has worked goal-oriented and in close cooperation with all employees with initiatives based on last year s employee satisfaction survey results. Positive effects are emerging, among

5 5 /16 others has the turn over rate decreased considerably during the year. This year s survey will be carried out in the beginning of the fourth quarter, and the Group expects a considerable improvement from last year as a result of the work performed during This year s results will form the basis for sharing best practice across the Group and the establishment of joint arrangements and measures that will help strengthen a common corporate culture. Develop Itera is actively working to maintain and further develop one of the most professional communities in the industry. All employees have the opportunity to develop their skills within a wide range of competency areas, both within the frames of the Group s core areas but also within the areas of strategy and management. Media has shown interest in describing how Itera is inviting employees to participate actively in the strategy process in close cooperation with the management group. This way to organize the work has been very positively received by the employees. Service range Itera offers a wide range of services that reflects the entire life cycle of the customers' IT solutions, from consulting and project management through development and integration to management and operations. The reinforcement of the service range in the second quarter has continued in the third quarter, and with strong focus on.net and Java, integration, security, Microsoft SharePoint and senior consulting competency in banking and finance and operations. Nearshoring To meet the private and public sectors IT services today and in the future, the Nordic competence market is already under substantial pressure. To build additional capacity, Itera has established a development centre in Kiev, Ukraine. With geographic and cultural proximity to the Nordic countries, the project cooperation works smoothly and efficiently across borders. The cooperation between the Itera companies in the Nordics and in Ukraine works seamlessly. Sales and delivery processes work efficiently across borders, and the Ukraine operation contributes increasingly strategically through entering long term customers relations with large customers in the Nordic market. Itera is experiencing the delivery model as mature in the market. The interest in using the resources placed nearshore to meet the capacity and competency challenges is increasing. The new development center in Lviv, western Ukraine, is fully operational at the end of third quarter. Market and customer development The Nordic market for IT services was strong also in the third quarter. The Group has a solid customer base, and more than half of the revenues are from customers with more than employees. More and more customers are offered a full range of services across group companies. Itera is working increasingly across group companies, with smooth cooperation between the specialized units. The companies are cooperating in both tender and delivery processes, and the competence is put together based on customers' overall needs for services. Significant risks and uncertainties Itera s business is affected by a number of different factors, some of which are within the company s control while others are beyond our control. As a consulting firm, the business is affected by business-related risks such as competition and price pressure, recruitment and our customer s development and bad debts. Market risks include risks related to the business cycle. Financial risks include interest risks and exchange risks. Outlook The Group is experiencing good activity in all the markets where the Group is represented. The unstability in the financial markets and decreased growth in several European countries has not affected the investment activities in the Group s customer base negatively. The Group is monitoring the development thoroughly and will carry out operational adjustments in customer portfolio and acitivity level to secure the position in case the situastion should change. The strategy is well implemented in the Group, and all employees are sharing our new vision: Making a difference. Always! This vision applies for all stakeholders: our employees should feel that Itera is more than "just a job, our customers should find that Itera brings solid business value and our shareholders should experience good returns compared to competing investments. The Group will continue to focus on the synergy effects of cooperation across the companies. The planned delivery capacity is now secured, and the Group is now entering a phase of optimization, where focus will be on utilization to secure profit. Competitiveness in relation to large, long-term customer relationships has been enhanced, and solid relationships with strategically important customers in need of Itera s whole range of services has been established. The company is well positioned for growth and profitability. Interim report Q4 The Interim Report for the fourth quarter of 2011 will be presented February/March 2012.

6 6 /16 Directors responsibility statement We declare that, to the best of our knowledge and belief, the interim accounts for the period 1 January to 30 September 2011 have been prepared in accordance with IAS 34 and that the information in the accounts provides a true and fair view of the Itera ASA group s assets, liabilities, financial position and overall results. We also declare that, to the best of our knowledge and belief, the interim report provides a true and fair overview of information according to the Norwegian Securities Trading Act (verdipapirloven) 5-6 (4). Oslo, 18 th of October 2011 The Board of Directors of Itera ASA Ole Jørgen Fredriksen Chairman Mimi K. Berdal Vice chairman John Markus Lervik Board member Johan Lindqvist Board member Trude S. Husebø Board member Arne Mjøs CEO
. Oslo, 18 th of October 2011 The Board of Directors of Itera ASA Ole Jørgen Fredriksen Chairman Mimi K.")
7 7 /16 Statement of comprehensive income change change 2010 All figures in NOK * % * % 1-12 Sales revenue % % Operating expenses Cost of sales % % Personell expenses % % Depreciation % % Other operating expenses % % Total operating expenses % % Operating profit % % Financial items Other financial income % % Other financial expenses % % 415 Net financial items % % 966 Profit before taxes % % Income tax % % Profit for the period % % Earnings per share % % 0.14 Fully diluted earnings per share % % 0.14 Statement of other income and costs Currency translation differences % % Unrealized net effect on investments in foreign subsidaries % % 618 Profit for the period % % Total profit % % Attributable to: Shareholders in parent company % % * Pro forma

8 8 /16 Statement of financial position change 2010 All figures in NOK Sep 30 Sep % 31 Dec ASSETS Non-current assets Deferred tax asset % Other intangible assets % Fixed assets % Total non-current assets % Current assets Work in progress % Accounts receivable % Other receivables % Bank deposits % Total current assets % Total assets % EQUITY AND LIABILITIES Equity Share capital % Ow n shares % -913 Other equity % Net profit for the period % 0 Total equity % Non-current liabilities Non-current interest bearing liabilities % 0 Total non-current liabilities % 0 Current liabilities Accounts payable % Tax payable Public duties payable % Other short-term liabilites % Total current liabilities % Total liabilities % Total equity and liabilites %

9 9 /16 Statement of cash flow All figures in NOK Cash flow from operating activities Profit before taxes Profit from sale of subsidiary Income tax Depreciation Change in w ork in progress Change in account receivables Change in account payables Change in other accruals Net cash flow from operating activities Cash flow from investments activities Investment in fixed assets Investment in intangible assets Net payment from sale of subsidiary Net cash flow from investments activities Cash flow from financing activities Purchase of ow n shares External dividend paid Net cash flow from financing activities Currency effect on cash Net cash flow Bank deposits at the beginning of the period Bank deposits at the end of the period

10 10 /16 Statement of changes in equity Share Ow n Translation Other Total All figures in NOK 1000 capital shares differences equity equity Shareholders' equity as of 31 Dec Comprehensive income for the year Purchase of ow n shares Dividend Shareholders' equity as of 31 Dec Comprehensive income for the year Purchase of ow n shares Reduction of the share premium reserve Dividend Shareholders' equity as of 30 Sep

11 11 /16 Notes Note 1: Transaction with related parties There have been no material transactions with related parties during the reporting period. Note 2: Events after balance sheet date There have been no material events after 30 th of September 2011 of significance for this quarterly report.

12 12 /16 Key figures change change 2010 All figures in NOK * % * % 1-12 Profit & Loss Sales revenue % % Gross profit % % EBITDA % % EBITDA-margin 0.8 % -2.7 % 4.9 % 4.1 % 6.7 % Operating profit (EBIT) % % EBIT-margin -3.6 % -7.1 % 1.0 % 0.2 % 3.2 % Profit before taxes % % Profit for the period % % Balance sheet Non-current assets % % Bank deposits % % Current assets % % Total assets % % Equity % % Total current liabilities % % Equity ratio 44.1 % 0 % 44.1 % 0 % 49.3 % Liquidity factor % % 1.38 Cash flow Net cash flow from operating activities % % Net cash flow % % Share inform ation Number of shares Weighted average basic shares outstanding Weighted average diluted shares outstanding EBIT per share % % 0.14 Diluted EBIT per share % % 0.14 EBITDA per share % % 0.31 Equity per share % % 0.93 Dividend per share % % 0.20 Employees Number of employees at the end of the period % % 382 Average number of employees % % 373 Operating revenue per employee % % Gross profit 1 per employee % % 829 Personell expenses per employee % % 656 Other operating expenses per employee % % 104 EBITDA per employee % % 69 EBIT per employee % % 33 * Pro forma

13 13 /16 Quarterly development *) Proforma
14 14 /16
15 15 /16

INTERIM REPORT Q1 2016 PROTECTOR FORSIKRING ASA
 INTERIM REPORT Q1 2016 PROTECTOR FORSIKRING ASA (UNAUDITED) APRIL 2016 Highlights Q1 2016 Growth 26% - First UK client on board Protector delivers a strong premium growth for the first quarter of 2016,
Vizrt Group AS Reports H1 and Q2 2015 Results
 Vizrt Group AS Reports H1 and Q2 2015 Results - 1 - Bergen, Norway, August 31, 2015. Vizrt Group AS. Vizrt today reported its financial results for the second quarter of 2015 and the first six months of
Interim Report. 4th quarter 2008
 Interim Report 4th quarter 2008 Nordic Semiconductor ASA 4th quarter 2008 Revenue in Q4 68.9 MNOK, an increase of 40% over Q4 2007 of 49.2 MNOK. A stronger USD rated contributed NOK 14 relative to Q4 2007.
Carnegie Investment Bank AB (publ) Year-end report
 Year-end report") Carnegie Investment Bank AB (publ) (Corp. reg. no. 516406-0138) Year-end report 1 January 31 December 2009 Carnegie Investment Bank AB (publ) is a leading independent investment bank with Nordic focus.
Carnegie Investment Bank AB (publ) (Corp. reg. no. 516406-0138) Year-end report 1 January 31 December 2009 Carnegie Investment Bank AB (publ) is a leading independent investment bank with Nordic focus.
Interim Report Second Quarter 2012
 Interim Report CEO Arne Mjøs CFO Frank Martinsen Oslo, 11th July 2012 Page 1 Highlights in the second quarter Revenue NOK 112 million EBITDA EBIT NOK 7.5 million NOK 3.2 million Improving profitability
IBM Finans Norge AS. Condensed Interim Financial Statements. 30 September 2014
 Condensed Interim Financial Statements Condensed Interim Financial Statements For the Quarter Ended Contents Page Condensed Interim Statement of Comprehensive Income 2 Condensed Interim Statement of Financial
Equity per share (NOK) 147 123 131 Equity ratio 39 % 38 % 36 % Non-current net asset value per share (NOK) (EPRA NNNAV) 2) 184 152 165
 147 123 131 Equity ratio 39 % 38 % 36 % Non-current net asset value per share (NOK) (EPRA NNNAV) 2) 184 152 165") REPORT FOR Q2 AND THE FIRST 6 MONTHS OF 2015 KEY FIGURES Amounts in NOK million Q2 2015 Q2 2014 30.06.15 30.06.14 2014 Net rental income 501 450 1 005 904 1 883 Fair value adjustments in investment properties
REPORT FOR Q2 AND THE FIRST 6 MONTHS OF 2015 KEY FIGURES Amounts in NOK million Q2 2015 Q2 2014 30.06.15 30.06.14 2014 Net rental income 501 450 1 005 904 1 883 Fair value adjustments in investment properties
Financial Results. siemens.com
 s Financial Results Fourth Quarter and Fiscal 2015 siemens.com Key figures (in millions of, except where otherwise stated) Volume Q4 % Change Fiscal Year % Change FY 2015 FY 2014 Actual Comp. 1 2015 2014
Vizrt Group AS Reports Q1 2015 Results
 Vizrt Group AS Quarterly report March 31, 2015 Vizrt Group AS Reports Q1 2015 Results Business Overview On March 19, 2015, Vizrt Group AS (formerly Aksjeselskapet av 17. Oktober 2014 AS ) ( the Company
HIGHLIGHTS FIRST QUARTER 2016
 Q1-16 EUROPRIS ASA 2 CONTENTS / HIGHLIGHTS FIRST QUARTER 2016 HIGHLIGHTS FIRST QUARTER 2016 (Figures for the corresponding period of last year in brackets. The figures are unaudited.) Group revenues increased
FIRST QUARTER 2005. Highlights from first quarter 2005 include: Operating profit 10 MNOK (42 MNOK last year)
") FIRST QUARTER 2005 Highlights from first quarter 2005 include: Revenues 599 MNOK (+1 percent relative to first quarter 2004) Operating profit 10 MNOK (42 MNOK last year) Acquisition of Orwak Group completed
FIRST QUARTER 2005 Highlights from first quarter 2005 include: Revenues 599 MNOK (+1 percent relative to first quarter 2004) Operating profit 10 MNOK (42 MNOK last year) Acquisition of Orwak Group completed
FINANCIAL REPORT Q4 2015
 CRAYON GROUP HOLDING AS FINANCIAL REPORT Q4 2015 Management commentary Q4 2015 Crayon continues to invest in geographic expansion centred on Software Asset Management (SAM) and cloud first, providing its
EDB Business Partner ASA FIRST QUARTER 2005 INTERIM REPORT
 - 1 - EDB Business Partner ASA FIRST QUARTER 2005 INTERIM REPORT Growth in revenues and profit as a consequence of acquisitions Successful integration of acquired businesses and subsequent cost reductions
INTERIM REPORT for the period January 1 June 30, 2006
 ICA AB, corporate identity number 556582-1559 INTERIM REPORT for the period January 1 June 30, 2006 Strong development for ICA Group during first half year Stockholm, August 15, 2006 Net sales during the
NORWEGIAN AIR SHUTTLE ASA QUARTERLY REPORT THIRD QUARTER 2005 [This document is a translation from the original Norwegian version]
![NORWEGIAN AIR SHUTTLE ASA QUARTERLY REPORT THIRD QUARTER 2005 [This document is a translation from the original Norwegian version]](/thumbs/40/21604770.jpg "NORWEGIAN AIR SHUTTLE ASA QUARTERLY REPORT THIRD QUARTER 2005 [This document is a translation from the original Norwegian version]") NORWEGIAN AIR SHUTTLE ASA QUARTERLY REPORT THIRD QUARTER 2005 THIRD QUARTER IN BRIEF The operating revenue has increased by 78 % to MNOK 589,9 compared to MNOK 331,7 in the same period last year. The total
NORWEGIAN AIR SHUTTLE ASA QUARTERLY REPORT THIRD QUARTER 2005 THIRD QUARTER IN BRIEF The operating revenue has increased by 78 % to MNOK 589,9 compared to MNOK 331,7 in the same period last year. The total
INTERIM REPORT Q2 2016 PROTECTOR FORSIKRING ASA
 INTERIM REPORT Q2 2016 PROTECTOR FORSIKRING ASA (UNAUDITED) JULY 2016 Highlights Q2 2016 Very strong operating profit Protector delivers an operating profit of NOK 255 million in the second quarter of
TELIO HOLDING ASA QUARTERLY REPORT Q1 2007
 TELIO HOLDING ASA QUARTERLY REPORT Q1 2007 Q1 Revenues NOK 88.4 million up 34% vs Q1 06, EBITDA of 18% of revenues, and operating profits of NOK 4.1 million, best ever. Strong customer growth in Denmark
Equity per share (NOK) 135 123 131 Equity ratio 37 % 39 % 36 % Non-current net asset value per share (NOK) (EPRA NNNAV) 2) 170 153 165
 135 123 131 Equity ratio 37 % 39 % 36 % Non-current net asset value per share (NOK) (EPRA NNNAV) 2) 170 153 165") REPORT Q1/2015 KEY FIGURES Amounts in NOK million Q1 2015 Q1 2014 31.12.14 Net rental income 503 454 1 883 Fair value adjustments in investment properties and interest rate derivatives 1 294-9 281 Profit
REPORT Q1/2015 KEY FIGURES Amounts in NOK million Q1 2015 Q1 2014 31.12.14 Net rental income 503 454 1 883 Fair value adjustments in investment properties and interest rate derivatives 1 294-9 281 Profit
IBM Finans Norge AS. Condensed Interim Financial Statements. 31 March 2015
 Condensed Interim Financial Statements Condensed Interim Financial Statements For the Quarter Ended Contents Page Condensed Interim Statement of Comprehensive Income 2 Condensed Interim Statement of Financial
INTERIM REPORT SECOND QUARTER 2015 CEO ARNE MJØS OSLO, 27 AUGUST 2015
 INTERIM REPORT SECOND QUARTER 2015 CEO ARNE MJØS OSLO, 27 AUGUST 2015 Highlights of the second quarter Revenue NOK 114 million, unchanged from last year. Improved EBITDA of NOK 9.9 million, 8.6 % margin
Visual Management 4Q01. From 150 to 1500 employees in 12 months
 Visual Management Visual Management 4Q01 From 150 to 1500 employees in 12 months Liinos 93,6% of shareholders have accepted offer by Visma! Recap from 3Q presentation in October We expected improvements
Interim report 1st quarter 2016
 Interim report 1st quarter 2016 About Komplett Bank ASA Komplett Bank ASA started banking operations on 21 March 2014 when the company received its banking licence from the Norwegian authorities. Komplett
Apptix Sells Public Cloud Business Funds MSP Growth Strategy
 Apptix Sells Public Cloud Business Funds MSP Growth Strategy Herndon, VA and Oslo, Norway September 9, 2015 Apptix (OSE: APP), the premier provider of managed and hosted solutions, today announced it sold
EDB Business Partner ASA FOURTH QUARTER 2003 INTERIM REPORT
 - 1 - EDB Business Partner ASA FOURTH QUARTER 2003 INTERIM REPORT Summary The EDB group reports its best quarterly earnings since the fourth quarter of 2001 All business areas report improved operating
Consolidated Interim Earnings Report
 Consolidated Interim Earnings Report For the Six Months Ended 30th September, 2003 23th Octorber, 2003 Hitachi Capital Corporation These financial statements were prepared for the interim earnings release
INTERIM REPORT Q2 2013
 INTERIM REPORT Q2 2013 April June 2013 Betting turnover: 127,865 KEUR (170,589) Net turnover after trading fees: 502 KEUR (842) Gross margin: 0.39% (0.49) 1 Operating income: -255 KEUR (3) Operating margin:
WE SIMPLIFY YOUR BUSINESS
 WE SIMPLIFY YOUR BUSINESS Visma ASA Biskop Gunnerusgt. 6, Postboks 774 Sentrum, NO-0106 OSLO, Norway, tel +47 46 40 40 00, fax +47 23 15 81 58, www.visma.com 4 QUARTER 2005 PRINTED ON 23. JANUARY 2006
FOURTH QUARTER 2015. Financials. Safe Zephyrus is scheduled to commence a contract in Norway early Q3 2016.
 FOURTH QUARTER 2015 Financials (Figures in brackets refer to the corresponding period of 2014) Full year 2015 Operating profit for 2015 amounted to USD 167 million (USD 248.3 million) and utilisation of
INTERIM REPORT 2012 FOURTH QUARTER (Q4)
") INTERIM REPORT 2012 FOURTH QUARTER (Q4) Summary - In January 2013 Norway Seafoods entered into an agreement to sell most of the company s Farming operations in France - Revenue in the fourth quarter came
INTERIM REPORT 2012 FOURTH QUARTER (Q4) Summary - In January 2013 Norway Seafoods entered into an agreement to sell most of the company s Farming operations in France - Revenue in the fourth quarter came
Consolidated Financial Results for the nine months of Fiscal Year 2010
 Consolidated Financial Results for the nine months of Fiscal Year 2010 (Fiscal Year 2010: Year ending March 31, 2010) Noritake Co., Limited Company Name Stock Exchange Listings Tokyo, Nagoya Code Number
1st Quarter Report 2004. Aarhus United A/S
 Erik Højsholt Direct line: +45 8730 6102 Fax: +45 8730 6002 erik.hojsholt@aarhusunited.com 2004-05-24 1st Quarter Report 2004 Aarhus United A/S CVR no. 45 95 49 19 Stock exchange announcement no. 12/2004
Consolidated Balance Sheets
 Consolidated Balance Sheets March 31 2015 2014 2015 Assets: Current assets Cash and cash equivalents 726,888 604,571 $ 6,057,400 Marketable securities 19,033 16,635 158,608 Notes and accounts receivable:
TOMAS CARLSSON, PRESIDENT AND CEO JONAS DAHLBERG, CFO Q2 2015 17 JULY
 TOMAS CARLSSON, PRESIDENT AND CEO JONAS DAHLBERG, CFO Q2 2015 17 JULY 1 Q2 highlights Strong profitability and organic growth +15% EBITA adj for calender and E/O 10% organic growth in 3 of 4 BAs Actions
Interim report April-June 2003
 Interim report April-June 2003 Pre-tax profit for the second quarter amounted to SEK -34m, which is a SEK 30m improvement compared to last year (SEK -64m). Software revenue grew by 5% during the second
INTERIM REPORT 2015 SECOND QUARTER (Q2)
") INTERIM REPORT 2015 SECOND QUARTER (Q2) Summary - Revenue in the second quarter came to 519 million kroner, 122 million kroner higher than the second quarter of 2014 - Higher revenue was a result of increased
INTERIM REPORT 2015 SECOND QUARTER (Q2) Summary - Revenue in the second quarter came to 519 million kroner, 122 million kroner higher than the second quarter of 2014 - Higher revenue was a result of increased
Aalberts Industries increases earnings per share +10%
 Aalberts Industries increases earnings per share +10% Langbroek, 26 February 2015 Highlights o Revenue EUR 2,201 million, increase +8% (organic +3.1%) o Operating profit (EBITA) +10% to EUR 247 million;
Half-year report 2003. Aarhus United A/S
 Direct line: +45 8730 6102 Fax: +45 8730 6002 ehh@aarhus.com 2003-08-25 Half-year report 2003 Aarhus United A/S CVR no. 45 95 49 19 Announcement no. 20/2003 to the Copenhagen Stock Exchange Further information
Preliminary Accounts 2012
 Q4 Preliminary Accounts Presentation of results from SpareBank 1 Gruppen Kirsten Idebøen, CEO 14 February 2013 The pre-tax profit for was more than doubled compared with 2011 Pre-tax profit Group (MNOK)
Audited (Restated) (*)
 (*)") 31 December 2015 31 December 2014 31 December 2013 ASSETS Current assets 459.875.342 251.625.938 233.029.758 Cash and cash equivalents 5 123.908.125 123.909.277 101.043.123 Financial investments 6 -- 15.126.664
31 December 2015 31 December 2014 31 December 2013 ASSETS Current assets 459.875.342 251.625.938 233.029.758 Cash and cash equivalents 5 123.908.125 123.909.277 101.043.123 Financial investments 6 -- 15.126.664
Aurora LPG Holding ASA
 Unaudited Condensed Interim Financial Statements Q1 2016 2 Contents Highlights of operational review... 3 Unaudited consolidated income statement for the first quarter of 2016, first quarter 2015 and full
INTERIM REPORT for the period January 1 March 31, 2007
 Interim report for ICA AB January 1 - March 31, 2007 INTERIM REPORT for the period January 1 March 31, 2007 Stockholm, May 15, 2007 Strong sales growth but lower operating income during first quarter Net
Cover photo: Sturlason
 Financial highlights 03 Report from the board of directors 04 Results 04 Balance sheet 05 Lending 05 Securities 05 Liquidity 06 Prospects for the second half-year of 2016 07 Events after the balance sheet
FY2011 Third Quarter Consolidated Financial Results (Prepared in accordance with U.S. GAAP) (Period ended December 31, 2011) (Unaudited)
 (Period ended December 31, 2011) (Unaudited)") FY2011 Third Quarter Consolidated Financial Results (Prepared in accordance with U.S. GAAP) (Period ended December 31, 2011) (Unaudited) Advantest Corporation (FY2011 Q3) January 27, 2012 Company name
FY2011 Third Quarter Consolidated Financial Results (Prepared in accordance with U.S. GAAP) (Period ended December 31, 2011) (Unaudited) Advantest Corporation (FY2011 Q3) January 27, 2012 Company name
Interim report for the 3rd quarter of 2008. Glitnir Bank ASA
 Interim report for the 3rd quarter of 2008 Glitnir Bank ASA contents Report of the Directors...3 Consolidated Income Statement...5 Consolidated Balance Sheet...6 Consolidated Statement of Changes in Equity...7
Q3 2015. Interim Report January - September 2015
 Q3 2015 Interim Report January - September 2015 Atea returned to EBITDA growth in the third quarter of 2015. Sweden and the Baltics delivered excellent results, and Denmark and Norway had sequential improvement
2014 INTERIM REPORT GEARED FOR GROWTH BE A PART OF IT.
 2014 INTERIM REPORT Q3 GEARED FOR GROWTH BE A PART OF IT. Interim Management s Discussion and Analysis as at September 30, 2014 Quarterly highlights 1 Preliminary comments to the Management s Discussion
YEAR-END REPORT for the period January 1 December 31, 2006
 Year-end report for ICA AB January 1 - December 31, 2006 YEAR-END REPORT for the period January 1 December 31, 2006 Stockholm, February 21, 2007 Strong net income for ICA Group in 2006 despite weak fourth
Interim Report for the period 1 January 31 March 2015
 Interim Report for the period 1 January 31 March 2015 ALL FIGURES IN THIS REPORT ARE EXPRESSED IN SEK, UNLESS STATED OTHERWISE. FIGURES IN PARENTHESES REFER TO THE CORRESPONDING FIGURES FOR THE PREVIOUS
Agasti Holding ASA Interim report 1st quarter 2015. 5 May 2015
 Agasti Holding ASA Interim report 1st quarter 2015 5 May 2015 First quarter highlights Solid profitability after restructuring and strategic changes EBIT of NOK 20 million and EBITDA of NOK 23 million
Western Energy Services Corp. Condensed Consolidated Financial Statements September 30, 2015 and 2014 (Unaudited)
") Condensed Consolidated Financial Statements September 30, 2015 and 2014 (Unaudited) Condensed Consolidated Balance Sheets (Unaudited) (thousands of Canadian dollars) Note September 30, 2015 December 31,
Condensed Consolidated Financial Statements September 30, 2015 and 2014 (Unaudited) Condensed Consolidated Balance Sheets (Unaudited) (thousands of Canadian dollars) Note September 30, 2015 December 31,
Registration no. 33 36 97 94
 Registration no. 33 36 97 94 Viking Supply Ships A/S Financial Report Contents Page Summary of events 3 Operational highlights 3 Financial highlights 3 Financing and capital structure 4 Subsequent events
CONSOLIDATED FINANCIAL REPORT FIRST QUARTER FISCAL 2009
 CONSOLIDATED FINANCIAL REPORT FIRST QUARTER FISCAL 2009 (March 1, 2009 to May 31, 2009) July 9, 2009 F&A Aqua Holdings, Inc. is listed on the First Section of the Tokyo Stock Exchange under the securities
CONSOLIDATED FINANCIAL HIGHLIGHTS
 CONSOLIDATED FINANCIAL HIGHLIGHTS January 29, 2014 Nintendo Co., Ltd. 111 Hokotatecho, Kamitoba, Minamiku, Kyoto 6018501 Japan Consolidated Results for the Nine Months Ended December 2012 and 2013 (1)
FOR IMMEDIATE RELEASE 28 September 2015 BOND INTERNATIONAL SOFTWARE PLC UNAUDITED INTERIM RESULTS
 FOR IMMEDIATE RELEASE 28 September 2015 BOND INTERNATIONAL SOFTWARE PLC UNAUDITED INTERIM RESULTS Bond International Software Plc ( the Group ), the specialist provider of software for the international
Net sales increased with 16% to SEK 76.1 m (65.6). Net sales for the last four quarters totalled SEK 255.0 m (306.6)
. Net sales for the last four quarters totalled SEK 255.0 m (306.6)") HMS Networks AB (publ) Interim report January-March 2010 First quarter 2010 Net sales increased with 16% to SEK 76.1 m (65.6). Net sales for the last four quarters totalled SEK 255.0 m (306.6) Operating
HMS Networks AB (publ) Interim report January-March 2010 First quarter 2010 Net sales increased with 16% to SEK 76.1 m (65.6). Net sales for the last four quarters totalled SEK 255.0 m (306.6) Operating
Income Statement (1) First Quarter 2002
 First Quarter 2002") Income Statement (1) (in millions of EUR) 1 st Q 2002 1 st Q 2001 2002/2001 Sales 5,402.2 4,993.6 +8.2% (2) EBITDA (FIFO) 408.7 366.1 +11.6% EBITDA margin 7.6% 7.3% - Depreciation (145.5) (134.6) +8.1%
Income Statement (1) (in millions of EUR) 1 st Q 2002 1 st Q 2001 2002/2001 Sales 5,402.2 4,993.6 +8.2% (2) EBITDA (FIFO) 408.7 366.1 +11.6% EBITDA margin 7.6% 7.3% - Depreciation (145.5) (134.6) +8.1%
Shifting Gears Driving Growth 2016 FIRST QUARTER INTERIM REPORT
 Shifting Gears Driving Growth 2016 FIRST QUARTER INTERIM REPORT MANAGEMENT S DISCUSSION AND ANALYSIS March 31, 2016 Quarterly highlights 3 Preliminary comments to Management s discussion and analysis 4
Half Year 2015 Results
 Half Year 2015 Results Letter to shareholders LifeWatch First Half Highlights Revenue growth of 9.1% to USD 52.5 million Above-market growth of over 12% in core monitoring services resulting in market
WE SIMPLIFY YOUR BUSINESS. Report for the 1st quarter of 2006
 WE SIMPLIFY YOUR BUSINESS Report for the 1st quarter of 2006 Oslo, April 9, 2006 In the first quarter of 2006, Visma achieved revenues of MNOK 587 (468). The total revenue growth of 25,5% was achieved
(Formerly CVTech Group Inc.)
") (Formerly CVTech Group Inc.) Condensed Interim Consolidated Financial Statements For the three months ended, 2014 Consolidated Statement of Financial Position (in thousands of Canadian dollars) December
(Formerly CVTech Group Inc.) Condensed Interim Consolidated Financial Statements For the three months ended, 2014 Consolidated Statement of Financial Position (in thousands of Canadian dollars) December
2015 Results and Prospects
 PRESS RELEASE Paris, 23 March 2016 2015 Results and Prospects Revenues: 2,579.3 million, up 3.2% EBITDA: 342.0 million, an operating margin of 13.3% 2016 Objectives: revenues close to 3 billion and an
NORWEGIAN AIR SHUTTLE ASA
 NORWEGIAN AIR SHUTTLE ASA SECOND QUARTER AND FIRST HALF REPORT 2009 HIGHLIGHTS First half revenue up by 24.5% to MNOK 3,287.8, quarterly revenue up by 22.5 % to MNOK 1,900.5 (1,551.2). Earnings before
NOTICE OF NO AUDITOR REVIEW OF INTERIM FINANCIAL STATEMENTS
 Condensed Interim Consolidated Financial Statements of THE BRICK LTD. For the three months ended March 31, 2013 NOTICE OF NO AUDITOR REVIEW OF INTERIM FINANCIAL STATEMENTS Under National Instrument 51-102,
Consolidated Statements of Profit or Loss Ricoh Company, Ltd. and Consolidated Subsidiaries For the Years Ended March 31, 2014 and 2015
 Consolidated Statements of Profit or Loss Sales: Products 1,041,794 1,071,446 8,928,717 Post sales and rentals 1,064,555 1,068,678 8,905,650 Other revenue 89,347 91,818 765,150 Total sales 2,195,696 2,231,942
Year-end report. President s comments. The fourth quarter. January - December
 Year-end report The fourth quarter > > Net sales increased by 17 percent during the fourth quarter to SEK 1,758 M (1,504). In local currencies, net sales increased by 7 percent > > Operating profit increased
Q3 2012. CONDENSED CONSOLIDATED INTERIM FINANCIAL STATEMENTS FOR THE 9 MONTHS ENDED 30 September 2012
 Q3 2012 CONDENSED CONSOLIDATED INTERIM FINANCIAL STATEMENTS FOR THE 9 MONTHS ENDED 30 September 2012 Consolidated statement of financial position As at 30 September 2012 in thousands of Qatari Riyals 30
2 Badger Explorer ASA - 2Q 2007
 Quarterly Report 2Q 2007 2 Badger Explorer ASA - 2Q 2007 SUMMARY The development, construction and testing of Badger Explorer progresses with test results as expected. During 2Q 2007 the full scale onshore
Q1/2010 Report for the 1st quarter of 2010
 Q1/2010 Report for the 1st quarter of 2010 CONTENTS The quarter in brief 3 Highlights Key figures Financial review Outlook for 2010 Business areas Software 5 BPO, Accounting and Payroll 6 Procurement and
SEAGATE TECHNOLOGY PLC CONDENSED CONSOLIDATED BALANCE SHEETS
 CONDENSED CONSOLIDATED BALANCE SHEETS (In millions) June 28, ASSETS Current assets: Cash and cash equivalents $ 2,259 $ 1,708 Short-term investments 47 480 Restricted cash and investments 4 101 Accounts
SUMMARY OF CONSOLIDATED BUSINESS RESULTS for the nine months ended December 31, 2012
 SUMMARY OF CONSOLIDATED BUSINESS RESULTS for the nine months ended December 31, 2012 February 8, 2013 ARRK Corporation 2-2-9 Minami Hommachi, Chuo-ku, Osaka, 541-0054, JAPAN 1. Consolidated financial results
ACER INCORPORATED AND SUBSIDIARIES. Consolidated Balance Sheets
 Consolidated Balance Sheets June 30, 2015, December 31, 2014, and (June 30, 2015 and 2014 are reviewed, not audited) Assets 2015.6.30 2014.12.31 2014.6.30 Current assets: Cash and cash equivalents $ 36,400,657
Quarterly Financial Results for the Fiscal Year Ending September 30, 2016 (J-GAAP)
") February 10, 2016 Quarterly Financial Results for the Fiscal Year Ending September 30, 2016 (J-GAAP) (1st Quarter / October 1, 2015 December 31, 2015) Company Name Hosokawa Micron Corporation Stock Exchange
February 10, 2016 Quarterly Financial Results for the Fiscal Year Ending September 30, 2016 (J-GAAP) (1st Quarter / October 1, 2015 December 31, 2015) Company Name Hosokawa Micron Corporation Stock Exchange
TO OUR SHAREHOLDERS PROFITABLE GROWTH COURSE INTERNATIONALIZATION FURTHER EXTENDED US MARKET IN FOCUS
 QUARTERLY STATEMENT AS OF MARCH 31, 2015 TO OUR SHAREHOLDERS Patrik Heider, Spokesman of the Executive Board and CFOO The Nemetschek Group has made a dynamic start in the 2015 financial year and continues
Consolidated Statement of Profit or Loss (in million Euro)
") Consolidated Statement of Profit or Loss (in million Euro) Q2 2012 Q2 2013 % H1 2012 H1 2013 % Restated * change Restated * change Revenue 779 732-6.0% 1,513 1,437-5.0% Cost of sales (553) (521) -5.8%
Consolidated Statement of Profit or Loss (in million Euro) Q2 2012 Q2 2013 % H1 2012 H1 2013 % Restated * change Restated * change Revenue 779 732-6.0% 1,513 1,437-5.0% Cost of sales (553) (521) -5.8%
FOURTH QUARTER 2005. Highlights from fourth quarter 2005 include:
 FOURTH QUARTER 2005 Highlights from fourth quarter 2005 include: Revenues of 675 MNOK (+2% percent relative to fourth quarter 2004, +6% after adjusting for currency effects and acquisitions/disposals)
Year-end report for the period 1 January 31 December 2015. Revenue in the fourth quarter increased by 28 per cent
 Year-end report for the period 1 January 31 December 2015 ALL FIGURES IN THIS REPORT ARE EXPRESSED IN SEK, UNLESS STATED OTHERWISE. FIGURES IN PARENTHESES REFER TO THE CORRESPONDING PERIOD FOR THE PREVIOUS
2 ND QUARTER 2016 RESULTS ANNOUNCEMENT
 2 ND QUARTER 2016 RESULTS ANNOUNCEMENT TOMRA SYSTEMS ASA 2 nd Quarter Results 19.07.2016 HIGHLIGHTS FROM THE QUARTER Revenues Gross margin Operating expenses EBITA Cashflow TOMRA Collection TOMRA Sorting
N Brown Group plc Interim Report 2013
 N Brown Group plc Interim Report 2013 2013 4CUSTOMER CENTRIC SEGMENTS FINANCIAL SUMMARY Financial Highlights 2013 2012 Revenue 409.6m 379.3m Operating profit 48.4m 45.7m Adjusted profit before taxation*
Interim report Q3 2015
 Interim report Q3 2015 Interim report Q3 2015 Dear Shareholders 2 November 2015 marked a milestone in the history of Kid when the company's shares were listed on the Oslo Stock Exchange. Over the last
Consolidated Statement of Profit or Loss (in million Euro)
") Consolidated Statement of Profit or Loss (in million Euro) Q3 2013 Q3 2014 % change 9m 2013 9m 2014 % change Revenue 689 636-7.7% 2,126 1,909-10.2% Cost of sales (497) (440) -11.5% (1,520) (1,324) -12.9%
Consolidated Statement of Profit or Loss (in million Euro) Q3 2013 Q3 2014 % change 9m 2013 9m 2014 % change Revenue 689 636-7.7% 2,126 1,909-10.2% Cost of sales (497) (440) -11.5% (1,520) (1,324) -12.9%
Interim report January March 2009
 14 May, 2009 Interim report January March 2009 STRONG FIRST QUARTER EBIT INCREASED BY 20 PER CENT Revenues increased by 19 per cent to SEK 744 M (626). EBIT increased by 20 per cent to SEK 57 M (48) and
Analyzing the Statement of Cash Flows
 Analyzing the Statement of Cash Flows Operating Activities NACM Upstate New York Credit Conference 2015 By Ron Sereika, CCE,CEW NACM 1 Objectives of this Educational Session u Show how the statement of
Kvartalsrapport. Quarterly Report
 Kvartalsrapport Quarterly Report Fourth Quarter 2015 1 Summary The Group s operating revenues developed positively in 2015. Nominal growth was 2.7 % compared with 2014. Adjusted for acquisitions, currency
Zayo Group Holdings, Inc. Reports Financial Results for the Third Fiscal Quarter Ended March 31, 2016
 Zayo Group Holdings, Inc. Reports Financial Results for the Third Fiscal Quarter Ended March 31, 2016 Third Fiscal Quarter 2016 Financial Highlights $478.0 million of consolidated revenue, including $96.1
FINANCIAL REPORT H1 2014
 FINANCIAL REPORT H1 2014 HIGH SPEED BY PASSION 02_Key Figures 03_Group Status Report 05_Consolidated Financial Statements 10_Notes 11_Declaration of the Legal Representatives 02 PANKL KEY FIGURES EARNING
INTERIM REPORT Q2 and H1 2015
 INTERIM REPORT Q2 and H1 2015 HIGHLIGHTS Significant improvement in the billing ratio Strong revenue growth and increased profitability Order backlog remains solid with strong order intake, supporting
Interim Report January 1 st March 31 st, 2003
 Interim Report January 1 st March 31 st, 2003 First Quarter 2003 Earnings before taxes increased by 23 per cent to 70 MSEK. Earnings after taxes increased by 36 per cent to 45 MSEK. Earnings per share
Consolidated Statement of Profit or Loss
 Consolidated Statement of Profit or Loss Sales: Products 864,699 1,041,794 $ 10,114,505 Post sales and rentals 941,610 1,064,555 10,335,485 Other revenue 79,686 89,347 867,447 Total sales 1,885,995 2,195,696
EVENTS AFTER THE END OF THE PERIOD
 BE Q1 Interim report BE Group AB (publ) January March 2015 Malmö, April 28, 2015 FIRST QUARTER 2015 Net sales rose by 2 percent compared with the year-earlier period, amounting to SEK 1,104 M (1,083).
Year ended 31 Dec 2009
 PACE PLC CHANGE OF FUNCTIONAL AND PRESENTATIONAL CURRENCY AND COMPARATIVES RE-PRESENTED IN US DOLLARS Introduction Pace announced at the time of its preliminary results announcement that the Board had
About Komplett Bank ASA. Outlook. Developments to date
 Interim report 4th quarter 2015 About Komplett Bank ASA Komplett Bank ASA started banking operations on 21 March 2014 when the company received its banking licence from the Norwegian authorities. Komplett
Consolidated Financial Results for Fiscal Year 2013 (April 1, 2013 March 31, 2014)
") Consolidated Financial Results for Fiscal Year 2013 (April 1, 2013 March 31, 2014) 28/4/2014 Name of registrant: ShinMaywa Industries, Ltd. Stock Exchange Listed: Tokyo Code number: 7224 (URL: http://www.shinmaywa.co.jp
Consolidated Financial Results for Fiscal Year 2013 (April 1, 2013 March 31, 2014) 28/4/2014 Name of registrant: ShinMaywa Industries, Ltd. Stock Exchange Listed: Tokyo Code number: 7224 (URL: http://www.shinmaywa.co.jp
INTERIM REPORT 2014 SECOND QUARTER (Q2)
") INTERIM REPORT 2014 SECOND QUARTER (Q2) Summary - Revenue in the second quarter came to 397 million kroner, 35 million kroner lower than the second quarter of 2013 - Lower revenue was a result of decreased
INTERIM REPORT 2014 SECOND QUARTER (Q2) Summary - Revenue in the second quarter came to 397 million kroner, 35 million kroner lower than the second quarter of 2013 - Lower revenue was a result of decreased
Registration no. 33 36 97 94
 Registration no. 33 36 97 94 Viking Supply Ships A/S Financial Report FINANCIAL REPORT Contents Page Summary of events 3 Operational highlights 3 Financial highlights 4 Financing and capital structure
Q2 REPORT 2016. Variance Percentage variance Figures in MNOK except for per share figures 2Q 2016 2Q 2015 1Q 2016 2Q 2015 1Q 2016 2Q 2015 1Q 2016
 Q2 REPORT 2016 Highlights; - Earnings from shipping activities (ship management and ship ownership combined) of NOK 52 million, up from NOK 35.6 million in second quarter 2015. - Earnings before tax of
Oslo Børs VPS Holding ASA 2nd Quarter 2015
 Oslo Børs VPS Holding ASA 2nd Quarter 215 12 August 215 2nd quarter at a glance Good level of trading and settlement activity continued in the quarter Continuing strong interest in admission of both shares
1 st Quarter 2013. Presentation of results from SpareBank 1 Gruppen. Kirsten Idebøen, CEO
 1 st Quarter 2013 Presentation of results from SpareBank 1 Gruppen Kirsten Idebøen, CEO 25 April 2013 Best result in SpareBank 1 Gruppen's history Pre-tax profit in last 5 years (MNOK) 360 Pre-tax profit:
Press release from Elanders AB (publ) 2011-10-28
 2011-10-28") Press release from Elanders AB (publ) 2011-10-28 Net sales increased by 7 % totaling MSEK 1,300 (MSEK 1,215). Operating result amounted to MSEK 52 (-82). The result was affected by one-off items of MSEK
Press release from Elanders AB (publ) 2011-10-28 Net sales increased by 7 % totaling MSEK 1,300 (MSEK 1,215). Operating result amounted to MSEK 52 (-82). The result was affected by one-off items of MSEK
Words from the President and CEO 3 Financial highlights 4 Highlights 5 Export lending 5 Local government lending 6 Funding 6 Results 6 Balance sheet
 Words from the President and CEO 3 Financial highlights 4 Highlights 5 Export lending 5 Local government lending 6 Funding 6 Results 6 Balance sheet 7 Events after the balance sheet date 8 Income statement
NOBINA AB INVESTOR PRESENTATION, Q3, SEPTEMBER NOVEMBER 2015
 NOBINA AB INVESTOR PRESENTATION,, SEPTEMBER NOVEMBER 2015 LARGEST PUBLIC TRANSPORT COMPANY IN THE NORDIC REGION Nobina s economies of scale, market expertrise and outstanding bus fleet, combined with long-term