Market Prices of Houses in Atlanta. Eric Slone, Haitian Sun, Po-Hsiang Wang. ECON 3161 Prof. Dhongde
|
|
|
- Emma Cooper
- 7 years ago
- Views:
Transcription
1 Market Prices of Houses in Atlanta Eric Slone, Haitian Sun, Po-Hsiang Wang ECON 3161 Prof. Dhongde Abstract This study reveals the relationships between residential property asking price and various explanatory variables, including home square footage, land parcel square footage, number of bedrooms, and year of construction, in Atlanta, Georgia. Simple and multiple linear regressions were developed using the method of ordinary least squares. Square footage of the house was found to be the most influential factor in determining asking price, number of bathrooms exhibited a significant relationship, and garage capacity and year of construction were found to be the weakest relationships.

2 I. Introduction One of the most diverse real estate markets in the country, Atlanta housing prices exhibit large fluctuations across geographic locations. Many factors affect residential housing prices across the metropolitan area, including land parcel size, home square footage, and amenities. Intuition leads to the conclusion land parcel size will have higher impacts on residential housing prices towards the city center, while suburban area prices will be more affected by home square footage and amenities, such as garages, swimming pools, and fireplaces. The objective of this study is to reveal the relationships between the dependent variable, asking price, with the explanatory variables, including land parcel size, home square footage, number of bedrooms and bathrooms, garage capacity, and neighborhood. Using the ordinary least squares regression method, the constructed model will enable the prediction of housing market values based on various property characteristics, thus enabling buyers and sellers alike to create a preliminary appraisal of any property in Atlanta. Data were gathered on April 15 th, The city of Atlanta was divided into five distinct neighborhoods: Intown, Southeastern, Southwestern, Northwestern, and Buckhead. Twenty single family houses were randomly selected from each neighborhood, resulting in 100 observations. II. Literature Review Hanonnen (2008) investigates the best practices and modeling techniques when attempting to find relationships between various variables, including permitted building volume, house price index, northing, and easting. An ordinary least squares estimation resulted in all explanatory variables being plausible in sign and magnitude, indicating the OLS method is accurate. Other modeling methods included robust MM-estimation, structural time-series estimation, and robust local regression. While permitted building volume, house price index, northing, and easting all had significant relationships with market values, land parcel size was found to have a much weaker relationship. The data used for the study was gathered in the city of Espoo, Finland. Inspired by the significant increase in United States legislative action in favor of land conservation during the period, Cho (2009) examines the relationship between both land parcel size and proximity to open space with housing sale prices. Particularly, the study investigated the trade-off between the two

3 explanatory variables, and found that proximity to open spaces, such as parks, greenways, and bodies of water, is a very close substitute for land parcel size in relation to sale prices. All of the data used in the study was obtained from a single county in Tennessee. Abelson (2013) models median housing prices in various neighborhoods across Sydney, Australia using numerous explanatory variables, including land parcel size, housing size, access to public transportation, and housing density. The findings include significant relationships between sale price and many of the explanatory variables, especially land parcel and housing sizes. Cebula (2009) analyzed 2,888 single-family homes in the city of Savannah, Georgia. Using the method of ordinary least squares, the models constructed in the study revealed positive relationships between the dependent variable, housing price, and multiple explanatory variables, including number of bedrooms, bathrooms, fireplaces, stories, garage capacity, and various amenities. Spatial relationships were also analyzed; proximity to open land, lakes, and the presence of cul-de-sacs were found to positively affect home prices, while proximity to apartment complexes and busy roads negatively affected sale prices. Although no literature could be located analyzing the factors of housing sale prices in the Atlanta, Georgia area, all of the aforementioned studies have relevant findings in other areas. Hanonnen (2008) provided insight into various modeling techniques, and provided assurance the OLS method, which is used in this study, is best for the purposes of discovering relationships between various explanatory variables and housing prices. Abelson (2013) provided relevant insight into the explanatory variables affecting housing prices, which can be compared to the findings of housing price factors in Atlanta, Georgia, analyzed in this study. The most relevant literature was found in The Hedonic Pricing Model to the Housing Market of the City of Savannah, in which various explanatory variables, many identical to those analyzed in this study, were found to both positively and negatively affect home prices in the city of Savannah. III. Data The data used in this study were collected from Residential lot asking price and home characteristics were obtained for properties in five Atlanta city neighborhoods: Intown, Southeastern, Southwestern, Northwestern, and Buckhead. Twenty single family homes were randomly selected from each neighborhood, resulting in 100 observations.

4 The property asking price represents the dependent variable, and five quantitative independent variables are used in the OLS regression: home square footage, lot square footage, number of bedrooms, number of bathrooms, year of construction, and number of cars accommodated in a garage. The primary Atlanta neighborhoods represent the qualitative variables, and Intown Atlanta was used as the base neighborhood. The data collected for this study are used to specify the model, create parameter estimates, check for model adequacy, reiterate until the model is adequate, validate the model, reiterate until the model is valid, and then use the final model to estimate asking price of property within each Atlanta neighborhood. Table 1 below outlines all of the variables used in this study. Table 1. Variables used in OLS Regression Dependent Variable Independent Variables Asking Price (USD) Home Square Footage (ft 2 ) Lot Square Footage (ft 2 ) Number of Bedrooms Number of Bathrooms Year Built Number of Cars Garage Accommodates Neighborhood (qualitative) An analysis of the data reveals that all of the Gauss-Markov assumptions are satisfied. The model utilizes linear regression, so the first assumption of linear parameters is satisfied. All of the data were collected randomly from large lists of housing characteristics, so the assumption of random sampling is satisfied. Due to the impossibility of perfect correlation between any of the explanatory variables, the third assumption is satisfied. The highest correlation was found to be between the number of bathrooms and home square footage, with a value of Lastly, all of the relevant information available for each home was utilized, so the model is not believed to be under- or mis-specified, and the assumption of zero conditional mean is satisfied. Table 2 below outlines the summary statistics for each of the variables used in this study.

5 Table 2. Variable Summary Statistics Table 3 below outlines the correlations between each explanatory variable. All of the variables are positively correlated, as expected. Some variables are highly correlated. Bedrooms and sqfeet, as well as bathrooms and bedrooms have correlation values of 0.8. This indicates that there is a possibility of multicollinearity, so several different models need to be tested. In Table 4, all of the explanatory variables present positive relationships with price since the slopes seem to be positive, consistent with positive correlations. Table 3. Explanatory Variable Correlation

6 Table 4. Scatter Plot e+06 Price 2.0e e Sq Feet Lot Size Bedrooms 2 10 Bathrooms Const Year Car Garage e+062.0e+063.0e

7 III. Results The collected data were first used to develop a simple linear regression using the method of ordinary least squares. Home asking price was taken to be the dependent variable, and home square footage was used for the explanatory variable. Table 6 below outlines the results of the simple linear regression. Table 6. Simple Linear Regression Results The results above correspond with intuition; the positive coefficient indicates the positive relationship between asking price and home square footage. A percent change of square footage results in a 1.64% change in the asking price. The p-value is 0.000, which is less than 0.01; therefore, this variable is statistically significant at 1%. Considering only one explanatory variable was used in this regression, the r-squared value of 0.58 is much higher than expected. The data were then used to develop a multiple linear regression using the method of ordinary least squares. Table 7 below outlines the results.

8 Table 7. Multiple Linear Regression Results The results above once again correspond with intuition; home square footage, land parcel size, number of bathrooms, and garage capacity all have a positive effect on the asking price. The negative relationship between the year of home construction and the market price is not as expected; however, possible explanations could include the fact older homes often feature better construction, unique architectural features, and larger living areas. The number of bedrooms has a negative relationship with the market price, and is also another counter-intuitive variable. Two simple linear regression models were tested with these two variables. Each of the models resulted in a positive coefficient. Therefore, the negative coefficient may be due to effects on the model from other explanatory variables. The home square footage is the main factor affecting the dependent variable; a percent increase in lot square footage results in a 0.56% change in the asking price. lnconstyear, Cargarage, and buckhead have very high p-values. These variables are not statistically significant. Bedrooms is significant at 5%, while all other variables are significant at 1%. It is important to note the home square footage coefficient decreased as compared to the simple linear regression result, indicating a bias existed due to the omission of important explanatory variable in the simple regression. The adjusted r-squared value of 0.84 is exceptionally high.

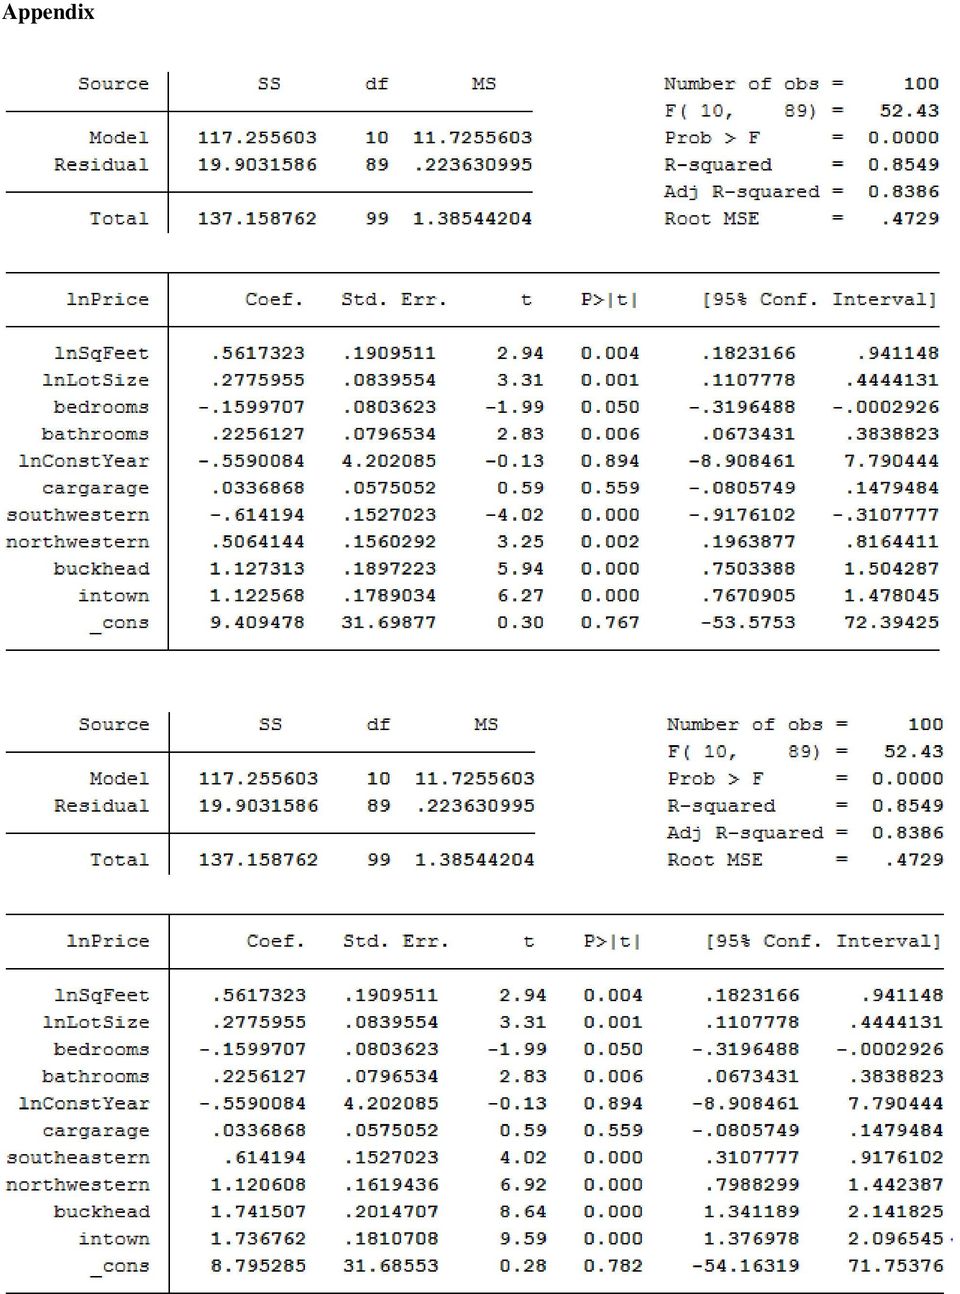
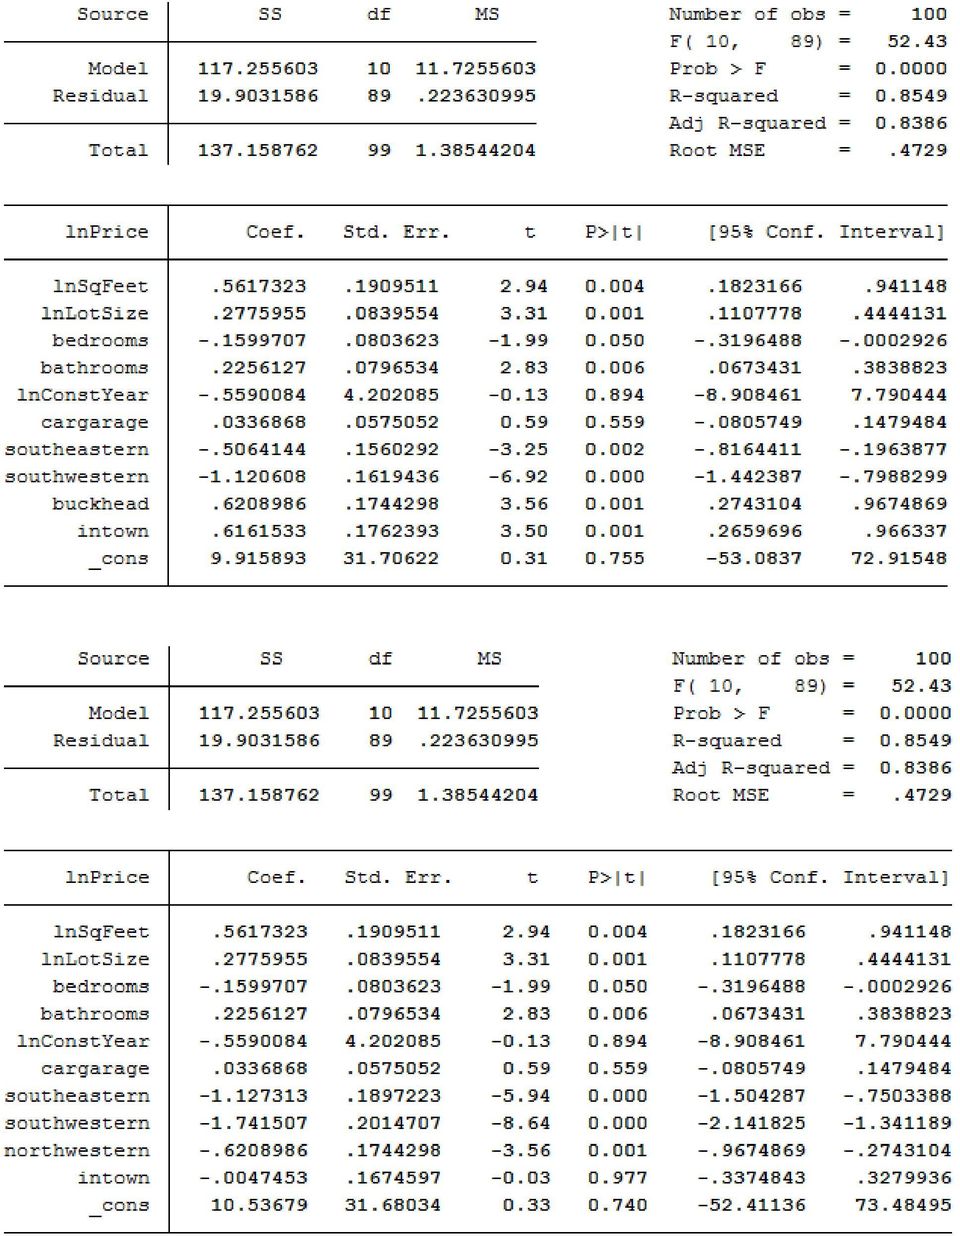
9 Holding all other factors constant, the location of a home within the Atlanta city limits can significantly affect the home market price. Buckhead proved to have the most positive affect on home prices, a conclusion consistent with local opinion and prestige, while the Southwestern area of Atlanta had the most negative affect, consistent with the high crime and poverty rates characterizing the region. The Intown neighborhood, which includes the Downtown and Midtown skyscraper regions, was used as the base neighborhood value. To test whether other neighborhoods are statistically different from each other, models using different neighborhoods as the base levels were tested. In Appendix, the results from those regression models indicate that all of the five areas are significantly different from each other except for Intown and Buckhead, since the p-value of those variables are much smaller than The null hypothesis of the areas having the same price is therefore rejected. The lowest price to highest price region is given in the following order: southwestern, southeastern, northwestern, Intown and Buckhead. Variables that are not significant were removed from the model in an attempt to improve the regression model. Table 8 below outlines the results Table 8. Multiple Linear Regression Results

10 The interpretations of the coefficients are identical to the previous model. However, these variables became more significant as the insignificant variables were eliminated from the model. R-squared decreases as expected but only a very slightly decrease from to However, R-square Adj increased from to , suggesting a more accurate model. To compare the two multiple regression model, an F- test was conducted with the null hypothesis defined as joint significance exists in the model. The F statistic was calculated to be 0.19, which is much smaller than 2.71, the critical value of F-distribution at 5% with (3, 92) degrees of freedom. The null hypothesis cannot be rejected, suggesting the model is more accurate without the extra variables. Table 9 below outlines the results from all three models.
 degrees of freedom.")
11 Table 9. Results Dependent Variable SellingPrice Independent Variables Single Regression Multiple Regression Final Multiple Regression lnsqfeet 1.64*** (11.74) 0.561*** (2.94) 0.587*** (3.39) lnsqftlot *** (3.31) bedroom * (-1.99) bathroom *** (2.83) lnconstyear (-0.13) cargarage (0.59) southeastern *** (-6.27) southwestern *** (-9.59) northwestern *** (-3.5) buckhead (0.03) 0.292*** (3.70) ** (-2.15) 0.227*** (2.95) *** (-7.16) *** (-10.47) *** (-4.23) - Intercept (0.12) (0.33) 6.035*** (5.21) No. of obs R-square R-square Adj *** significant at 1% ** significant at 5% *significant at 10%
 - Intercept 0.123 (0.12) 10.532 (0.33) 6.035*** (5.21) No. of obs. 100 100 100 R-square 0.5846 0.8549 0.8543 R-square Adj. 0.5803 0.8386 0.")
12 IV. Conclusions In this study, the relationships between various home characteristics and the asking price of a residential property were analyzed using both a simple linear regression and a multiple linear regression using the method of ordinary least squares. Home square footage was utilized as the explanatory variable in the simple linear regression, and the multiple linear regression consisted of the addition of land parcel size, number of bedrooms, year of construction, and other explanatory variables. The results of the multiple linear regression proved the bias due to the omission of important factors in the simple linear regression. Home square footage was found to be the most important factor in the determination of residential property price, while garage capacity proved to be the weakest factor. Home location also significantly affects market prices within the Atlanta city limits; Buckhead proved to have the most positive effect on home values, while Southwestern Atlanta had the most negative effect. The exceptionally high adjusted r- squared value of 0.84 indicates the model constructed in this study is valid for estimating the asking price of a residential property using various home characteristics.

13 References Abelson, Peter, Roselyne Joyeux, and Stephane Mahuteau. "Modelling House Prices Across Sydney." Australian Economic Review (2013): Print. Cebula, Richard. "The Hedonic Pricing Model Applied to the Housing Market of the City of Savannah." Review of Regional Studies 39 (): Print. Cho, Seong-Hoon, Christopher Clark, William Park, and Seung Kim. "Spatial and Temporal Variation in the Housing Market Values of Lot Size and Open Space." Land Economics. (2009): n. page. Print. Hanonnen, Marko. "Predicting Urban Land Prices: A Comparison of Four Approaches." International Journal of Strategic Property Management. 12. (2008): Print. "Homes for Sale." Realtor. National Association of Realtors, Web. 12 Mar <
: 217-236. Print. \"Homes for Sale.\" Realtor.")
14 Appendix
15
Regression step-by-step using Microsoft Excel
 Step 1: Regression step-by-step using Microsoft Excel Notes prepared by Pamela Peterson Drake, James Madison University Type the data into the spreadsheet The example used throughout this How to is a regression
Multiple Linear Regression
 Multiple Linear Regression A regression with two or more explanatory variables is called a multiple regression. Rather than modeling the mean response as a straight line, as in simple regression, it is
Real Estate Agent Remarks: Help or Hype?
 Real Estate Agent Remarks: Help or Hype? Authors Jerry T. Haag, Ronald C. Rutherford and Thomas A. Thomson Abstract This article groups the remarks of a multiple listing service listing into common themes
Module 5: Multiple Regression Analysis
 Using Statistical Data Using to Make Statistical Decisions: Data Multiple to Make Regression Decisions Analysis Page 1 Module 5: Multiple Regression Analysis Tom Ilvento, University of Delaware, College
Regression Analysis: A Complete Example
 Regression Analysis: A Complete Example This section works out an example that includes all the topics we have discussed so far in this chapter. A complete example of regression analysis. PhotoDisc, Inc./Getty
Course Objective This course is designed to give you a basic understanding of how to run regressions in SPSS.
 SPSS Regressions Social Science Research Lab American University, Washington, D.C. Web. www.american.edu/provost/ctrl/pclabs.cfm Tel. x3862 Email. SSRL@American.edu Course Objective This course is designed
Introduction to Regression and Data Analysis
 Statlab Workshop Introduction to Regression and Data Analysis with Dan Campbell and Sherlock Campbell October 28, 2008 I. The basics A. Types of variables Your variables may take several forms, and it
Econometrics Problem Set #3
 Econometrics Problem Set #3 Nathaniel Higgins nhiggins@jhu.edu Assignment The assignment was to read chapter 3 and hand in answers to the following problems at the end of the chapter: C3.1 C3.8. C3.1 A
ECON 142 SKETCH OF SOLUTIONS FOR APPLIED EXERCISE #2
 University of California, Berkeley Prof. Ken Chay Department of Economics Fall Semester, 005 ECON 14 SKETCH OF SOLUTIONS FOR APPLIED EXERCISE # Question 1: a. Below are the scatter plots of hourly wages
Determining Factors of a Quick Sale in Arlington's Condo Market. Team 2: Darik Gossa Roger Moncarz Jeff Robinson Chris Frohlich James Haas
 Determining Factors of a Quick Sale in Arlington's Condo Market Team 2: Darik Gossa Roger Moncarz Jeff Robinson Chris Frohlich James Haas Executive Summary The real estate market for condominiums in Northern
Solución del Examen Tipo: 1
 Solución del Examen Tipo: 1 Universidad Carlos III de Madrid ECONOMETRICS Academic year 2009/10 FINAL EXAM May 17, 2010 DURATION: 2 HOURS 1. Assume that model (III) verifies the assumptions of the classical
CHAPTER 13 SIMPLE LINEAR REGRESSION. Opening Example. Simple Regression. Linear Regression
 Opening Example CHAPTER 13 SIMPLE LINEAR REGREION SIMPLE LINEAR REGREION! Simple Regression! Linear Regression Simple Regression Definition A regression model is a mathematical equation that descries the
Factors affecting online sales
 Factors affecting online sales Table of contents Summary... 1 Research questions... 1 The dataset... 2 Descriptive statistics: The exploratory stage... 3 Confidence intervals... 4 Hypothesis tests... 4
NATIONAL ASSOCIATION OF REALTORS. National Center for Real Estate Research
 NATIONAL ASSOCIATION OF REALTORS National Center for Real Estate Research THE VALUE OF HOUSING CHARACTERISTICS by G. Stacy Sirmans, PhD Kenneth G. Bacheller Professor of Real Estate Department of Insurance,
Chapter 13 Introduction to Linear Regression and Correlation Analysis
 Chapter 3 Student Lecture Notes 3- Chapter 3 Introduction to Linear Regression and Correlation Analsis Fall 2006 Fundamentals of Business Statistics Chapter Goals To understand the methods for displaing
Public Choices and Property Values
 C E N T R A L I N D I A N A U N D E R S T A N D I N G T H E R E G I O N A N D I D E N T I F Y I N G C H O I C E S CENTER FOR URBAN POLICY AND THE ENVIRONMENT DECEMBER 2003 Public Choices and Property Values
Unit 31 A Hypothesis Test about Correlation and Slope in a Simple Linear Regression
 Unit 31 A Hypothesis Test about Correlation and Slope in a Simple Linear Regression Objectives: To perform a hypothesis test concerning the slope of a least squares line To recognize that testing for a
August 2012 EXAMINATIONS Solution Part I
 August 01 EXAMINATIONS Solution Part I (1) In a random sample of 600 eligible voters, the probability that less than 38% will be in favour of this policy is closest to (B) () In a large random sample,
The Effects of Unemployment on Crime Rates in the U.S.
 The Effects of Unemployment on Crime Rates in the U.S. Sandra Ajimotokin, Alexandra Haskins, Zach Wade April 14 th, 2015 Abstract This paper aims to analyze the relationship between unemployment and crime
Urban Economics. Land Rent and Land Use Patterns PART II. 03.06.2009 Fachgebiet Internationale Wirtschaft Prof. Dr. Volker Nitsch Nicolai Wendland
 Urban Economics Land Rent and Land Use Patterns PART II Housing Prices To assess the variation of housing prices within a city, we focus on commuting as the key determinant for residential location decisions.
Correlation and Simple Linear Regression
 Correlation and Simple Linear Regression We are often interested in studying the relationship among variables to determine whether they are associated with one another. When we think that changes in a
1. What is the critical value for this 95% confidence interval? CV = z.025 = invnorm(0.025) = 1.96
 = 1.96") 1 Final Review 2 Review 2.1 CI 1-propZint Scenario 1 A TV manufacturer claims in its warranty brochure that in the past not more than 10 percent of its TV sets needed any repair during the first two years
1 Final Review 2 Review 2.1 CI 1-propZint Scenario 1 A TV manufacturer claims in its warranty brochure that in the past not more than 10 percent of its TV sets needed any repair during the first two years
The siting of cellular phone transmitting antennas, their base stations, and
 FEATURES abstract This article outlines the results of a study carried out in Florida in 2004 regarding the effect that cell phone tower proximity has on residential property prices. The study involved
IAPRI Quantitative Analysis Capacity Building Series. Multiple regression analysis & interpreting results
 IAPRI Quantitative Analysis Capacity Building Series Multiple regression analysis & interpreting results How important is R-squared? R-squared Published in Agricultural Economics 0.45 Best article of the
MULTIPLE REGRESSION AND ISSUES IN REGRESSION ANALYSIS
 MULTIPLE REGRESSION AND ISSUES IN REGRESSION ANALYSIS MSR = Mean Regression Sum of Squares MSE = Mean Squared Error RSS = Regression Sum of Squares SSE = Sum of Squared Errors/Residuals α = Level of Significance
Accessibility and Residential Land Values: Some Tests with New Measures
 Accessibility and Residential Land Values: Some Tests with New Measures University Autonoma of Barcelona July 2010 Genevieve Giuliano Peter Gordon Qisheng Pan Jiyoung Park Presentation Outline Purpose
Effects of CEO turnover on company performance
 Headlight International Effects of CEO turnover on company performance CEO turnover in listed companies has increased over the past decades. This paper explores whether or not changing CEO has a significant
Issues in Information Systems Volume 16, Issue IV, pp. 30-36, 2015
 DATA MINING ANALYSIS AND PREDICTIONS OF REAL ESTATE PRICES Victor Gan, Seattle University, gany@seattleu.edu Vaishali Agarwal, Seattle University, agarwal1@seattleu.edu Ben Kim, Seattle University, bkim@taseattleu.edu
Effects of GDP on Violent Crime
 Effects of GDP on Violent Crime Benjamin Northrup Jonathan Klaer 1. Introduction There is a significant body of research on crime, and the economic factors that could be correlated to criminal activity,
Premaster Statistics Tutorial 4 Full solutions
 Premaster Statistics Tutorial 4 Full solutions Regression analysis Q1 (based on Doane & Seward, 4/E, 12.7) a. Interpret the slope of the fitted regression = 125,000 + 150. b. What is the prediction for
Module 5: Statistical Analysis
 Module 5: Statistical Analysis To answer more complex questions using your data, or in statistical terms, to test your hypothesis, you need to use more advanced statistical tests. This module reviews the
Simple linear regression
 Simple linear regression Introduction Simple linear regression is a statistical method for obtaining a formula to predict values of one variable from another where there is a causal relationship between
How to Discredit Most Real Estate Appraisals in One Minute By Eugene Pasymowski, MAI 2007 RealStat, Inc.
 How to Discredit Most Real Estate Appraisals in One Minute By Eugene Pasymowski, MAI 2007 RealStat, Inc. Published in the TriState REALTORS Commercial Alliance Newsletter Spring 2007 http://www.tristaterca.com/tristaterca/
Session 9 Case 3: Utilizing Available Software Statistical Analysis
 Session 9 Case 3: Utilizing Available Software Statistical Analysis Michelle Phillips Economist, PURC michelle.phillips@warrington.ufl.edu With material from Ted Kury Session Overview With Data from Cases
Comparing Nested Models
 Comparing Nested Models ST 430/514 Two models are nested if one model contains all the terms of the other, and at least one additional term. The larger model is the complete (or full) model, and the smaller
1. The parameters to be estimated in the simple linear regression model Y=α+βx+ε ε~n(0,σ) are: a) α, β, σ b) α, β, ε c) a, b, s d) ε, 0, σ
 are: a) α, β, σ b) α, β, ε c) a, b, s d) ε, 0, σ") STA 3024 Practice Problems Exam 2 NOTE: These are just Practice Problems. This is NOT meant to look just like the test, and it is NOT the only thing that you should study. Make sure you know all the material
STA 3024 Practice Problems Exam 2 NOTE: These are just Practice Problems. This is NOT meant to look just like the test, and it is NOT the only thing that you should study. Make sure you know all the material
Market Segmentation: The Omaha Condominium Market
 Market Segmentation: The Omaha Condominium Market Page 1 Market Segmentation: The Omaha Condominium Market Roger P. Sindt Steven Shultz Department of Economics and Real Estate University of Nebraska at
Multiple Regression Analysis A Case Study
 Multiple Regression Analysis A Case Study Case Study Method 1 The first step in a case study analysis involves research into the subject property and a determination of the key factors that impact that
VALUING LAND IN DISPUTE RESOLUTION USING COEFFICIENT OF VARIATION TO DETERMINE UNIT OF MEASUREMENT BY BRYAN YOUNGE, MAI, ASA July 2016 Update
 VALUING LAND IN DISPUTE RESOLUTION USING COEFFICIENT OF VARIATION TO DETERMINE UNIT OF MEASUREMENT BY BRYAN YOUNGE, MAI, ASA July 2016 Update Investors of commercial land who are engaged in a legal dispute
Augmenting Housing Sales Data to Improve Hedonic Estimates of Golf Course Frontage
 Augmenting Housing Sales Data to Improve Hedonic Estimates of Golf Course Frontage Abstract Hedonic price modeling quantified the impact of golf course frontage on single-family housing prices at 20 different
Financial Risk Management Exam Sample Questions/Answers
 Financial Risk Management Exam Sample Questions/Answers Prepared by Daniel HERLEMONT 1 2 3 4 5 6 Chapter 3 Fundamentals of Statistics FRM-99, Question 4 Random walk assumes that returns from one time period
Table 1 Occupancy Status of Owner Occupied Single-Family Homes Vacated by Homeowner by Householder Age Group (Counts in parentheses) e
 e") Table 1 Occupancy Status of Owner Occupied Single-Family Homes Vacated by Homeowner by Householder Age Group (Counts in parentheses) e Status 2 Years Later: New Household, Owner Occupied 69.8% (4,919)
Table 1 Occupancy Status of Owner Occupied Single-Family Homes Vacated by Homeowner by Householder Age Group (Counts in parentheses) e Status 2 Years Later: New Household, Owner Occupied 69.8% (4,919)
A Primer on Forecasting Business Performance
 A Primer on Forecasting Business Performance There are two common approaches to forecasting: qualitative and quantitative. Qualitative forecasting methods are important when historical data is not available.
Class 19: Two Way Tables, Conditional Distributions, Chi-Square (Text: Sections 2.5; 9.1)
") Spring 204 Class 9: Two Way Tables, Conditional Distributions, Chi-Square (Text: Sections 2.5; 9.) Big Picture: More than Two Samples In Chapter 7: We looked at quantitative variables and compared the
Spring 204 Class 9: Two Way Tables, Conditional Distributions, Chi-Square (Text: Sections 2.5; 9.) Big Picture: More than Two Samples In Chapter 7: We looked at quantitative variables and compared the
Example: Boats and Manatees
 Figure 9-6 Example: Boats and Manatees Slide 1 Given the sample data in Table 9-1, find the value of the linear correlation coefficient r, then refer to Table A-6 to determine whether there is a significant
Multivariate Regression Modeling for Home Value Estimates with Evaluation using Maximum Information Coefficient
 Multivariate Regression Modeling for Home Value Estimates with Evaluation using Maximum Information Coefficient Gongzhu Hu, Jinping Wang, and Wenying Feng Abstract Predictive modeling is a statistical
1. Suppose that a score on a final exam depends upon attendance and unobserved factors that affect exam performance (such as student ability).
.") Examples of Questions on Regression Analysis: 1. Suppose that a score on a final exam depends upon attendance and unobserved factors that affect exam performance (such as student ability). Then,. When
Examples of Questions on Regression Analysis: 1. Suppose that a score on a final exam depends upon attendance and unobserved factors that affect exam performance (such as student ability). Then,. When
Statistics 2014 Scoring Guidelines
 AP Statistics 2014 Scoring Guidelines College Board, Advanced Placement Program, AP, AP Central, and the acorn logo are registered trademarks of the College Board. AP Central is the official online home
Regression III: Advanced Methods
 Lecture 16: Generalized Additive Models Regression III: Advanced Methods Bill Jacoby Michigan State University http://polisci.msu.edu/jacoby/icpsr/regress3 Goals of the Lecture Introduce Additive Models
Pearson's Correlation Tests
 Chapter 800 Pearson's Correlation Tests Introduction The correlation coefficient, ρ (rho), is a popular statistic for describing the strength of the relationship between two variables. The correlation
The Market Value of Mature Trees in Single-Family Housing Markets.
 The Market Value of Mature Trees in Single-Family Housing Markets. By Jonathan Dombrow, Mauricio Rodriguez, and C.F. Sirmans January 1, 2000 Appraisal Journal Abstract How does the existence of mature
Exploratory Study of Spatial Variation in Car Insurance Premiums, Traffic Volume and Vehicle Accidents 1
 Exploratory Study of Spatial Variation in Car Insurance Premiums, Traffic Volume and Vehicle Accidents 1 Introduction: Paul Ong with Hyun-Gun Sung July 18, 2003 Traffic accidents are inevitable, albeit
Part 2: Analysis of Relationship Between Two Variables
 Part 2: Analysis of Relationship Between Two Variables Linear Regression Linear correlation Significance Tests Multiple regression Linear Regression Y = a X + b Dependent Variable Independent Variable
OFFICIAL FILING BEFORE THE PUBLIC SERVICE COMMISSION OF WISCONSIN DIRECT TESTIMONY OF JANNELL E. MARKS
 OFFICIAL FILING BEFORE THE PUBLIC SERVICE COMMISSION OF WISCONSIN Application of Northern States Power Company, a Wisconsin Corporation, for Authority to Adjust Electric and Natural Gas Rates Docket No.
Chapter 7: Simple linear regression Learning Objectives
 Chapter 7: Simple linear regression Learning Objectives Reading: Section 7.1 of OpenIntro Statistics Video: Correlation vs. causation, YouTube (2:19) Video: Intro to Linear Regression, YouTube (5:18) -
2. Linear regression with multiple regressors
 2. Linear regression with multiple regressors Aim of this section: Introduction of the multiple regression model OLS estimation in multiple regression Measures-of-fit in multiple regression Assumptions
Economic Principles LEARNING OBJECTIVES KEY TERMS INTRODUCTION. Students will be able to
 4C H A P T E R F O U R Economic Principles LEARNING OBJECTIVES Students will be able to 1. understand, be able to differentiate, and give examples of the fifteen economic principles that drive real estate
Basic Statistics and Data Analysis for Health Researchers from Foreign Countries
 Basic Statistics and Data Analysis for Health Researchers from Foreign Countries Volkert Siersma siersma@sund.ku.dk The Research Unit for General Practice in Copenhagen Dias 1 Content Quantifying association
Yao Zheng University of New Orleans. Eric Osmer University of New Orleans
 ABSTRACT The pricing of China Region ETFs - an empirical analysis Yao Zheng University of New Orleans Eric Osmer University of New Orleans Using a sample of exchange-traded funds (ETFs) that focus on investing
1046 E Highland Ave, Phoenix, AZ 85014
 MINI PROPERTY REPORT 1046 E Highland Ave, Phoenix, AZ 85014 Presented by Mark Gowlovech Arizona Real Estate License: SA640376000 Fax: (623) 889-7101 www.level4funding.com HomeSmart 17215 N. 72nd Drive,
Introduction to Quantitative Methods
 Introduction to Quantitative Methods October 15, 2009 Contents 1 Definition of Key Terms 2 2 Descriptive Statistics 3 2.1 Frequency Tables......................... 4 2.2 Measures of Central Tendencies.................
Statistics 104 Final Project A Culture of Debt: A Study of Credit Card Spending in America TF: Kevin Rader Anonymous Students: LD, MH, IW, MY
 Statistics 104 Final Project A Culture of Debt: A Study of Credit Card Spending in America TF: Kevin Rader Anonymous Students: LD, MH, IW, MY ABSTRACT: This project attempted to determine the relationship
AVALON PARK WEST (FORMERLY NEW RIVER) PD/MPUD- NARRATIVE FOR DRI RESCISSION, PD SUBAREA AMENDMENT AND MPUD SUBSTANTIAL MODIFICATION.
 PD/MPUD- NARRATIVE FOR DRI RESCISSION, PD SUBAREA AMENDMENT AND MPUD SUBSTANTIAL MODIFICATION.") AVALON PARK WEST (FORMERLY NEW RIVER) PD/MPUD- NARRATIVE FOR DRI RESCISSION, PD SUBAREA AMENDMENT AND MPUD SUBSTANTIAL MODIFICATION DRI Rescission On January 7, 1992, the Pasco County Board of County Commissioners
AVALON PARK WEST (FORMERLY NEW RIVER) PD/MPUD- NARRATIVE FOR DRI RESCISSION, PD SUBAREA AMENDMENT AND MPUD SUBSTANTIAL MODIFICATION DRI Rescission On January 7, 1992, the Pasco County Board of County Commissioners
Statistical Models in R
 Statistical Models in R Some Examples Steven Buechler Department of Mathematics 276B Hurley Hall; 1-6233 Fall, 2007 Outline Statistical Models Linear Models in R Regression Regression analysis is the appropriate
ANNUITY LAPSE RATE MODELING: TOBIT OR NOT TOBIT? 1. INTRODUCTION
 ANNUITY LAPSE RATE MODELING: TOBIT OR NOT TOBIT? SAMUEL H. COX AND YIJIA LIN ABSTRACT. We devise an approach, using tobit models for modeling annuity lapse rates. The approach is based on data provided
DEPARTMENT OF PSYCHOLOGY UNIVERSITY OF LANCASTER MSC IN PSYCHOLOGICAL RESEARCH METHODS ANALYSING AND INTERPRETING DATA 2 PART 1 WEEK 9
 DEPARTMENT OF PSYCHOLOGY UNIVERSITY OF LANCASTER MSC IN PSYCHOLOGICAL RESEARCH METHODS ANALYSING AND INTERPRETING DATA 2 PART 1 WEEK 9 Analysis of covariance and multiple regression So far in this course,
Nonlinear Regression Functions. SW Ch 8 1/54/
 Nonlinear Regression Functions SW Ch 8 1/54/ The TestScore STR relation looks linear (maybe) SW Ch 8 2/54/ But the TestScore Income relation looks nonlinear... SW Ch 8 3/54/ Nonlinear Regression General
From Saving to Investing: An Examination of Risk in Companies with Direct Stock Purchase Plans that Pay Dividends
 From Saving to Investing: An Examination of Risk in Companies with Direct Stock Purchase Plans that Pay Dividends Raymond M. Johnson, Ph.D. Auburn University at Montgomery College of Business Economics
STATISTICAL ANALYSIS OF RESIDENTIAL HOUSING PRICES IN AN UP AND DOWN REAL ESTATE MARKET: A GENERAL FRAMEWORK AND STUDY OF COBB COUNTY, GA
 STATISTICAL ANALYSIS OF RESIDENTIAL HOUSING PRICES IN AN UP AND DOWN REAL ESTATE MARKET: A GENERAL FRAMEWORK AND STUDY OF COBB COUNTY, GA A Thesis Presented to The Academic Faculty By Kenneth Richard Corsini
DETERMINANTS OF CAPITAL ADEQUACY RATIO IN SELECTED BOSNIAN BANKS
 DETERMINANTS OF CAPITAL ADEQUACY RATIO IN SELECTED BOSNIAN BANKS Nađa DRECA International University of Sarajevo nadja.dreca@students.ius.edu.ba Abstract The analysis of a data set of observation for 10
2. What is the general linear model to be used to model linear trend? (Write out the model) = + + + or
 = + + + or") Simple and Multiple Regression Analysis Example: Explore the relationships among Month, Adv.$ and Sales $: 1. Prepare a scatter plot of these data. The scatter plots for Adv.$ versus Sales, and Month versus
Simple and Multiple Regression Analysis Example: Explore the relationships among Month, Adv.$ and Sales $: 1. Prepare a scatter plot of these data. The scatter plots for Adv.$ versus Sales, and Month versus
Fiscal impact analysis of three development scenarios in Nashville-Davidson County, TN
 Fiscal impact analysis of three development scenarios in Nashville-Davidson County, TN April 2013 Prepared by 1 SUMMARY BY SMART GROWTH AMERICA Summary This study examines the relative fiscal costs and
1.5 Oneway Analysis of Variance
 Statistics: Rosie Cornish. 200. 1.5 Oneway Analysis of Variance 1 Introduction Oneway analysis of variance (ANOVA) is used to compare several means. This method is often used in scientific or medical experiments
CRIME IN MOBILE HOME COMMUNITIES IN DURHAM, NC
 1 CRIME IN MOBILE HOME COMMUNITIES IN DURHAM, NC INTRODUCTION: Mobile home units and trailers are often perceived as ugly in today s society, and the people who live there have been accused of not paying
Journal Of Financial And Strategic Decisions Volume 11 Number 1 Spring 1998
 Journal Of Financial And Strategic Decisions Volume 11 Number 1 Spring 1998 AN EMPIRICAL STUDY OF THE IMPACT OF FOREIGN OWNERSHIP ON THE VALUES OF U.S. COMMERCIAL PROPERTIES Arnold L. Redman * and N. S.
A Great House? Realtors and Hedonic Analysis. Kyle Pate. Economics. Faculty Mentor: Dr. Dan Rubenson, Ph.D., Professor of Economics
 A Great House? Realtors and Hedonic Analysis Kyle Pate Economics Faculty Mentor: Dr. Dan Rubenson, Ph.D., Professor of Economics Southern Oregon University P a t e 2 Introduction It is time we consolidate
Linear Models in STATA and ANOVA
 Session 4 Linear Models in STATA and ANOVA Page Strengths of Linear Relationships 4-2 A Note on Non-Linear Relationships 4-4 Multiple Linear Regression 4-5 Removal of Variables 4-8 Independent Samples
Density, Design and Infrastructure Costs: Physical Survey of New Jersey Development
 Density, Design and Infrastructure Costs: Physical Survey of New Jersey Development OSP Technical Reference Document #104 June 1990 Prepared by: The New Jersey Office of State Planning 33 West State Street,
Causal Forecasting Models
 CTL.SC1x -Supply Chain & Logistics Fundamentals Causal Forecasting Models MIT Center for Transportation & Logistics Causal Models Used when demand is correlated with some known and measurable environmental
Tenure by Household Size - 2009
 NEIGHBORHOOD APARTMENT MARKET ANALYSIS CITY OF CHICAGO Market Composition & Distribution The neighborhood apartment market consists of a range of properties developed from the early 1900s to more modern,
ASSESSMENT METHODOLOGY
 2016 ASSESSMENT METHODOLOGY COST APPROACH A summary of the methods used by the City of Edmonton in determining the value of residential and non-residential properties valued using the cost approach in
Poverty Rates and Spending on Public Education at the K-12 Level: Is There a Correlation? Copyright 2007 University of Wisconsin Board of Regents
 Poverty Rates and Spending on Public Education at the K-12 Level: Is There a Correlation? S. Larry Chomsisengphet, author pp. 13-18, Volume II, April 2007 Copyright 2007 University of Wisconsin Board of
Kendell Keith, RLA, AICP, LEED AP Executive Vice President RELEVANT EXPERIENCE
 EDUCATION Master of Business Administration, Rollins College, Winter Park, Florida (2006) Master of City Planning, Georgia Institute of Technology, Atlanta, Georgia (1991) Graduate Certificate in Real
An Analysis of the Telecommunications Business in China by Linear Regression
 An Analysis of the Telecommunications Business in China by Linear Regression Authors: Ajmal Khan h09ajmkh@du.se Yang Han v09yanha@du.se Graduate Thesis Supervisor: Dao Li dal@du.se C-level in Statistics,
Relationships Between Two Variables: Scatterplots and Correlation
 Relationships Between Two Variables: Scatterplots and Correlation Example: Consider the population of cars manufactured in the U.S. What is the relationship (1) between engine size and horsepower? (2)
You have data! What s next?
 You have data! What s next? Data Analysis, Your Research Questions, and Proposal Writing Zoo 511 Spring 2014 Part 1:! Research Questions Part 1:! Research Questions Write down > 2 things you thought were
11. Analysis of Case-control Studies Logistic Regression
 Research methods II 113 11. Analysis of Case-control Studies Logistic Regression This chapter builds upon and further develops the concepts and strategies described in Ch.6 of Mother and Child Health:
Email: jungx219@umn.edu St. Paul, MN 55108
 Updated 2/1/15 SUHYUN JUNG Department of Applied Economics, 337K Ruttan Hall Phone: 650-862-1424 1994 Buford Avenue Email: jungx219@umn.edu St. Paul, MN 55108 EDUCATION Ph.D. in Applied Economics, (Expected)
Appendix 11: AFFORDABLE HOUSING TERMS & CRITERIA
 Appendix 11: AFFORDABLE HOUSING TERMS & CRITERIA (Provided by the Southampton Housing Authority March 18, 2013) What is Affordable Housing? There are a number of definitions of affordable housing as federal
NCSS Statistical Software Principal Components Regression. In ordinary least squares, the regression coefficients are estimated using the formula ( )
") Chapter 340 Principal Components Regression Introduction is a technique for analyzing multiple regression data that suffer from multicollinearity. When multicollinearity occurs, least squares estimates
Chapter 340 Principal Components Regression Introduction is a technique for analyzing multiple regression data that suffer from multicollinearity. When multicollinearity occurs, least squares estimates
1) Write the following as an algebraic expression using x as the variable: Triple a number subtracted from the number
 Write the following as an algebraic expression using x as the variable: Triple a number subtracted from the number") 1) Write the following as an algebraic expression using x as the variable: Triple a number subtracted from the number A. 3(x - x) B. x 3 x C. 3x - x D. x - 3x 2) Write the following as an algebraic expression
1) Write the following as an algebraic expression using x as the variable: Triple a number subtracted from the number A. 3(x - x) B. x 3 x C. 3x - x D. x - 3x 2) Write the following as an algebraic expression
Lents Town Center Mixed-Use Market Study Office Market Analysis Lents, Oregon
 Lents Town Center Mixed-Use Market Study Office Market Analysis Lents, Oregon Portland Development Commission January 2008 Draft Copy 9220 SW Barbur Boulevard Portland, Oregon 97219 503.636.1659 www.marketekinc.com
Final Exam Practice Problem Answers
 Final Exam Practice Problem Answers The following data set consists of data gathered from 77 popular breakfast cereals. The variables in the data set are as follows: Brand: The brand name of the cereal
HYPOTHESIS TESTING: CONFIDENCE INTERVALS, T-TESTS, ANOVAS, AND REGRESSION
 HYPOTHESIS TESTING: CONFIDENCE INTERVALS, T-TESTS, ANOVAS, AND REGRESSION HOD 2990 10 November 2010 Lecture Background This is a lightning speed summary of introductory statistical methods for senior undergraduate
We extended the additive model in two variables to the interaction model by adding a third term to the equation.
 Quadratic Models We extended the additive model in two variables to the interaction model by adding a third term to the equation. Similarly, we can extend the linear model in one variable to the quadratic
INDIANA BOARD OF TAX REVIEW. Final Determination Findings and Conclusions Lake County
 INDIANA BOARD OF TAX REVIEW Final Determination Findings and Conclusions Lake County Petition #: 45-037-02-1-5-00030 Petitioners: Respondent: Department of Local Government Finance Parcel #: 010100100690003
The central question addressed in this paper involves the effect of previous
 features abstract This paper presents an empirical study of the The Effect of Previous Environmental Contamination on Industrial Real Estate Prices by Thomas O. Jackson, MAI, PhD effect of previous contamination
Pricing, Exposure and Residential Listing Strategies
 Pricing, Exposure and Residential Listing Strategies Authors John D. Benjamin and Peter T. Chinloy Abstract Sellers of houses signal their motivation or willingness to sell through price and contractual
Economics of Strategy (ECON 4550) Maymester 2015 Applications of Regression Analysis
 Maymester 2015 Applications of Regression Analysis") Economics of Strategy (ECON 4550) Maymester 015 Applications of Regression Analysis Reading: ACME Clinic (ECON 4550 Coursepak, Page 47) and Big Suzy s Snack Cakes (ECON 4550 Coursepak, Page 51) Definitions
Economics of Strategy (ECON 4550) Maymester 015 Applications of Regression Analysis Reading: ACME Clinic (ECON 4550 Coursepak, Page 47) and Big Suzy s Snack Cakes (ECON 4550 Coursepak, Page 51) Definitions
Econometric analysis of the Belgian car market
 Econometric analysis of the Belgian car market By: Prof. dr. D. Czarnitzki/ Ms. Céline Arts Tim Verheyden Introduction In contrast to typical examples from microeconomics textbooks on homogeneous goods