Earnings conference call. Q4 and Full year 2014
|
|
|
- Ashley Deborah Gallagher
- 9 years ago
- Views:
Transcription
1 Earnings conference call Q4 and Full year 2014 Bo Annvik, CEO / Andreas Ekberg, CFO 12 February

2 Agenda Business Highlights Market Update Sales Financials Restructuring Outlook 2

3 Business Highlights Q Sales growth of 10% (currency adjusted) with net sales reaching SEK 1,092 (908) million. Operating margin of 9.3 (7.3) %, excluding oneoff items. Operating income, excluding one-off items, increased to SEK 101 (66) million. 3

4 Business Highlights Full year 2014 Disc brake contracts with several European trailer manufacturers with an estimated value of SEK 650 million from 2014 to Increased market share for disc brakes in Europe. Last phase of the restructuring program now being implemented after German union negotiations being finalized. New R&D center in Pune, India. Construction of the new R&D center at MIRA test track in UK started and finalized in Q

5 Business Highlights Full year 2014 Sales growth of 8% (currency adjusted) with net sales reaching SEK 4,380 (3,920) million. Operating margin of 9.3 (7.3) %, excluding one-off items. Operating income, excluding one-off items, SEK 408 (281) million. Earnings per share increased to SEK 2.32 (0.80). Cash flow from operations of SEK 435 (282) million. Proposed dividend of SEK 3.00 (2.00) per share. 5
. Cash flow from operations of SEK 435 (282) million.")
6 Stable platform created Past Focus on footprint consolidation Present Improving and stabilizing the platform Future Profitable growth

7 2014 vs. long term objectives OPERATING MARGIN ORGANIC GROWTH NET DEBT/EQUITY DIVIDEND 9.3% 8% < SEK 7

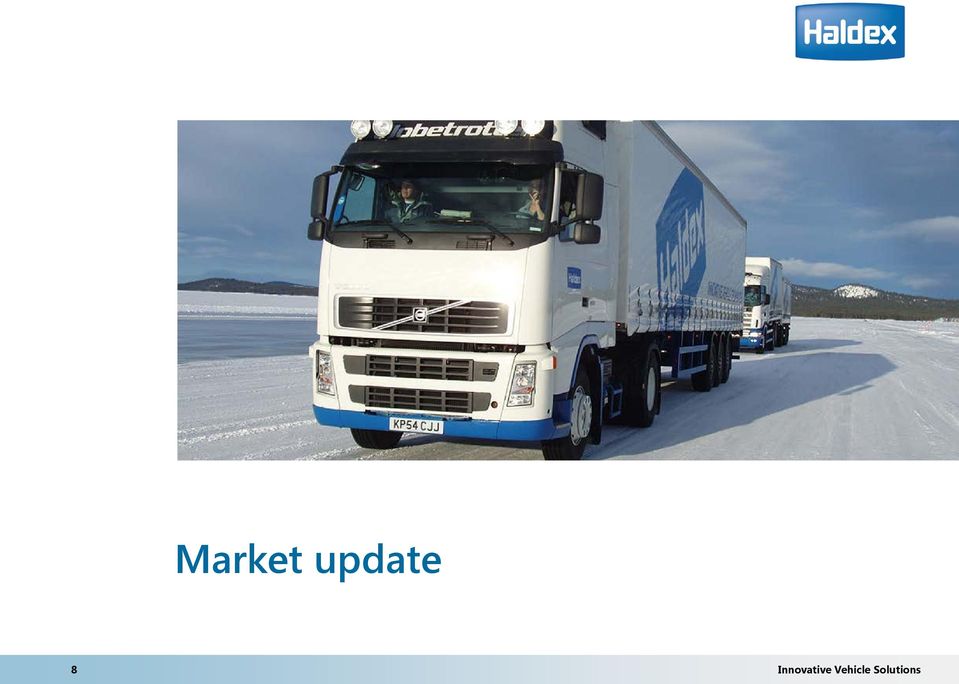
8 Market update 8
9 Build rates Heavy truck Thousands of units North America official build rates increased by 22% in 2014 compared to The North American market is expected to increase by 12% in China Europe North America India Brazil Europe official build rates decreased by 9% in 2014 compared to The European market is expected to grow with 4% in Source: The data concerning trucks is based on statistics from JD Powers, unless otherwise stated. The data on the trailer market concerning Europe is based on statistics from CLEAR; the data on trucks and trailers in North America is based on statistics from ACT; and the trailer data from South America and Asia is based on local sources. 9

10 Build rates - Trailer Thousands of units North America official build rates indicating a increase of 17% in 2014 compared to The North American market is expected to increase with 4% in China Europe North America India Brazil European build rates are 8% higher in 2014 compared to The European market is expected to grow with 3% in Source: The data concerning trucks is based on statistics from JD Powers, unless otherwise stated. The data on the trailer market concerning Europe is based on statistics from CLEAR; the data on trucks and trailers in North America is based on statistics from ACT; and the trailer data from South America and Asia is based on local sources. 10

11 Sales 11

12 Sales, Haldex Group Currency adjusted growth of 10% in Q4 and growth of 8% in SEK m Net sales 1/13 2/13 3/13 4/13 1/14 2/14 3/14 4/14 Q4/14 Q4/ Net sales, SEK million 1, ,380 3,920 Growth, currency adjusted 10% 6% 8% 3% 12

13 Sales per region Europe North America SEK m SEK m SEK million Q4/14 Q4/13 change 1 Europe % North America % Asia & Middle East % South America % 1/13 2/13 3/13 4/13 1/14 2/14 3/14 4/14 1/13 2/13 3/13 4/13 1/14 2/14 3/14 4/14 SEK m Asia & Middle East SEK m South America SEK million change 1 Europe 1,522 1,386 6% North America 2,280 2,019 8% Asia & Middle East % South America % 1 currency adjusted 1/13 2/13 3/13 4/13 1/14 2/14 3/14 4/14 1/13 2/13 3/13 4/13 1/14 2/14 3/14 4/14 13

14 Sales per product line Foundation Brake: Wheel-end products for brake actuation and lining wear adjustment. SEK m Sales Air Controls: Products to dehumidify, clean and control compressed air in the brake system. 1/13 2/13 3/13 4/13 1/14 2/14 3/14 4/14 Foundation Brake Air Controls SEK million Q4/14 Q4/13 change change 1 Foundation Brake % 2,420 2,107 11% Air Controls % 1,960 1,813 3% 1 currency adjusted 14

15 Sales per customer category Largest growth in the truck category in Q4, mainly driven by good sales growth in North America. For the full year, the trailer category represents the largest growth, partly driven by increased disc brake revenue in Europe. 2014: 29% Truck 29% Trailer 42% Aftermarket SEK million Q4/14 Q4/13 change change 1 Truck % 1,276 1,117 10% Trailer % 1,269 1,087 13% Aftermarket % 1,835 1,716 3% 1 currency adjusted 15

16 Financials 16

17 Earnings Operating margin excluding one-off items at record high 9.3% in 2014, and at 9.3% also in Q4. SEK m Operating income & margin % Income Margin SEK Earnings per share 1/13 2/13 3/13 4/13 1/14 2/14 3/14 4/14 1/13 2/13 3/13 4/13 1/14 2/14 3/14 4/14 Q4/14 Q4/13 change change Operating income (excl one-off items), SEK million % % Operating income, SEK million % % Operating margin (excl. one-off items), % Operating margin, % Net income, SEK million % % Earnings per share, (excl one-off items), SEK % % Earnings per share, SEK % % 17
, % 9.3 7.3 2.0 9.3 7.2 2.1 Operating margin, % 3.0 5.9-2.9 5.3 3.9 1.")
18 Sales & Operating Margin Sales, SEK m Operating Margin % 6.4% 6.4% 4.8% 6.0% 5.6% 5.6% 3.9% 5.8% 7.1% 8.4% 7.3% 8.1% 9.7% 10.1% 9.3% 12,0% 10,0% 8,0% 6,0% 4,0% 700 2,0% 600 Q1-11 Q2-11 Q3-11 Q4-11 Q1-12 Q2-12 Q3-12 Q4-12 Q1-13 Q2-13 Q3-13 Q4-13 Q1-14 Q2-14 Q3-14 Q4-14 0,0% Sales Operating Margin 18

19 Statement of Financial Position Dec 2014 vs. Dec 2013 SEK million Dec 31 Dec 31 annual change Working capital % Intangible assets % Capital employed 1,963 1,855 +6% Total assets 2,936 2, % Equity 1,278 1, % Net debt % Equity ratio, % Net debt/equity ratio, % Contingent liabilities

20 Cash Flow Working Capital & Cash Conversion Days Working Capital, MSEK Cash Conversion Cycle, days Working Capital Cash Conversion Days SEK million Q4/14 Q3/14 Q2/14 Q1/14 Operating cash flow Cash flow after net investments excluding one-off items 20

21 Field inspection and replacement program One of the smaller product lines for actuators in North America. In November, Haldex launched a field inspection campaign due to a diaphragm that could get out of position. Based on a thorough analysis of the field inspection results, an additional root cause, that can occur during special conditions, has been identified. The field inspection campaign has been extended to include product replacements. The number of vehicles is approximately 20,000. The cost is estimated at SEK 65 million. Failure rate is estimated to 0.03 percent. 21
22 Restructuring program The final step in the program was completed with the German union negotiations. Annual savings of SEK 85 million and total costs of SEK 250 million, with cash effects of approximately SEK 100 million. SEK 240 million booked as one-off items, of which SEK 112 million in Two thirds of the payments remain. The German/Hungary relocation project will be carried out during 2015 and completed latest at the end of
23 Outlook 23
24 Market outlook 2015 North America High demand to continue in H1/15. Europe A couple of percentage points up. China Continue to be somewhat negative. India Good improvement. Brazil Weaker than the previous year. 24
25 Stable platform created Past Focus on footprint consolidation Present Improving and stabilizing the platform Future Profitable growth
26 Profitable Growth Future Profitable growth Product range Fill gaps in the product range on a regional basis. Extend product range with further variants where applicable. Aftermarket 2015 Follow vehicles over lifetime with competitive offerings. Extension of Reman business scope. 26
27 Profitable Growth cont. Future Profitable growth M&A Acquisitions to complement product range and/or build stronger customer base/ critical mass in selective markets. Simplify customer interface 2015 Extend and improve E-commerce platform with relevant solutions for different customer groups. Upgrade ERP system, stepwise approach. 27
28 Thank You! Questions? 28
FIRST QUARTER REPORT 2008-04-25
 FIRST QUARTER REPORT This presentation contains forward looking statements. Such statements are based on our current expectations and are subject to certain risks and uncertainties that could negatively
Technology + Innovation = Sustainability
 Technology + Innovation = Sustainability David Woolley (CEO) & David Bessant (CFO) Q3 2012 Interim Report 1 Agenda Q3-12 Highlights DW Summary of financial results DB Economic head wind and de-stocking
Focus on fleet customers SAF-HOLLAND 1st half-year results 2014
 Focus on fleet customers SAF-HOLLAND 1st half-year results 214 Detlef Borghardt, CEO Wilfried Trepels, CFO August 7, 214 Executive Summary 1 Increase in group sales by 1.7% to 482.mn (previous year: 435.6)
April 1, 2010. Rudi Ludwig, CEO Wilfried Trepels, CFO
 Annual Financial i Statements t t 2009 April 1, 2010 Rudi Ludwig, CEO Wilfried Trepels, CFO 1 Agenda 1. Executive Summary 2. Background Market Performance 3. Business Performance 4. Financials 5. Next
Roadshow. April 26/29, 2010. Rudi Ludwig, CEO Wilfried Trepels, CFO
 Roadshow April 26/29, 2010 Rudi Ludwig, CEO Wilfried Trepels, CFO 1 SAF-HOLLAND - Components Fifth Wheels Suspensions Kingpins Landing Gear Axle Systems 2 SAF-HOLLAND - Business Units Trailer Systems Powered
Q3 YTD 2007 AND FULL-YEAR OUTLOOK
 Q3 YTD 2007 AND FULL-YEAR OUTLOOK Presentation by: President & CEO Niels Henrik Jensen Group CFO Michael Østerlund Madsen 8 November 2007 Copenhagen AGENDA EAC s Q3 YTD 2007 results Group highlights Performance
Q3 2015. EKORNES ASA November 16 th 2015
 Q3 215 EKORNES ASA November 16 th 215 Agenda Highlights Operational review Financial review Summary & outlook Highlights Stable development in underlying operating revenue and margin Stressless Q3 revenue
Q4 2003. Outlook. Getinge Group Financial Statement 2003
 Getinge Group Financial Statement 2003 Orders received totalled SEK 9,153.8 million (8,772.9) Net sales rose to SEK 9,160.2 million (8,640.1) Profit before tax climbed by 25 % to SEK 1,095.4 million (875.6)
Interim Report January 1 st March 31 st, 2003
 Interim Report January 1 st March 31 st, 2003 First Quarter 2003 Earnings before taxes increased by 23 per cent to 70 MSEK. Earnings after taxes increased by 36 per cent to 45 MSEK. Earnings per share
FY2016 Annual Results Announcement For The Year Ended 31 March 2016
 FY2016 Annual Results Announcement For The Year Ended 31 March 2016 Highlights For the year ended 31 March (million ) 2015 2016 Change Net sales 1,177.9 1,282.7 +8.9% Gross profit 963.2 1,061.5 +10.2%
MEDIA RELEASE SIKA WITH STRONG GROWTH IN EMERGING MARKETS
 DATUM 1 / 6 Zugerstrasse 50 6341 Baar, Switzerland www.sika.com CONTACT TELEPHONE E MAIL Dominik Slappnig Corporate Communications & Investor Relations +41 58 436 68 21 [email protected] SIKA
Volvo Group FIRST QUARTER 2015 JAN GURANDER. Volvo Group Headquarters First quarter 2015 1
 Volvo Group FIRST QUARTER 2015 JAN GURANDER 1 VOLVO GROUP First quarter summary IMPROVED MARGIN DESPITE NEGATIVE MARKET MIX FOR TRUCKS AND VOLVO CE VOLVO CE MARKET HEADWINDS CONTINUE, VOLUMES -33% OPERATING
Focus on fleet customers SAF-HOLLAND Annual Financial Statements 2013
 Focus on fleet customers SAF-HOLLAND Annual Financial Statements 213 Detlef Borghardt, CEO Wilfried Trepels, CFO March 13, 214 Agenda 1 Financials 3 2 Appendix 21 2 Executive Summary 1 2 3 Group sales
Interim report ICA AB. January 1 March 31, 2009
 Interim report ICA AB January 1 March 31, 2009 Interim report Stockholm, May 6, 2009 Increased net sales and improved operating income for the ICA Group during the first quarter First quarter Net sales
Full Year Report 2005. 26 January 2006
 Full Year Report 2005 26 January 2006 Important Notice This Presentation has been produced by TradeDoubler AB (the Company ) and is furnished to you solely for your information. This document contains
Drägerwerk AG & Co. KGaA Analyst Conference 2015. Frankfurt, March 11, 2015
 Drägerwerk AG & Co. KGaA Analyst Conference 2015 Frankfurt, March 11, 2015 Disclaimer This presentation does not constitute an offer of securities for sale or a solicitation of an offer to purchase any
GrandVision reports Revenue growth of 13.8% and EPS growth of 31.7%
 GrandVision reports Revenue of 13.8% and EPS of 31.7% Schiphol, the Netherlands 16 March 2015. GrandVision NV (EURONEXT: GVNV) publishes Full Year and Fourth Quarter 2015 results. 2015 Highlights Revenue
FUCHS PETROLUB SE The leading independent lubricants manufacturer of the world
 FUCHS PETROLUB SE The leading independent lubricants manufacturer of the world Dr. Alexander Selent, Vice Chairman & CFO Dagmar Steinert, Head of Investor Relations January 2014 The leading independent
CONFERENCE CALL RESULTS JANUARY MARCH 2015
 WELCOME DÜRR AKTIENGESELLSCHAFT CONFERENCE CALL RESULTS JANUARY MARCH 2015 Ralf W. Dieter, CEO Ralph Heuwing, CFO Hanover, May 12, 2015 www.durr.com DISCLAIMER This presentation has been prepared independently
Interim report ICA AB. January 1 June 30, 2009
 Interim report ICA AB January 1 June 30, 2009 Interim report Stockholm, Sweden, August 19, 2009 Increased sales and improved operating income excluding capital gains and impairments Second quarter Net
Q2 report 2015 Press- and analyst presentation
 Q2 report 2015 Press- and analyst presentation 19 August 2015 Per Strömberg, CEO Sven Lindskog, CFO Q2 Highlights: Solid second quarter 2015 Stable financial development Improved net sales +15% +4.3% excl
Preliminary results FY2015. November 27, 2015
 Preliminary results FY2015 November 27, 2015 Disclaimer Stabilus S.A. (the Company, later Stabilus ) has prepared this presentation solely for your information. It should not be treated as giving investment
Significant result increase due to higher sales volumes and efficiency improvements
 Herrliberg, February 5, 2016 MEDIA INFORMATION EMS Group: Annual results 2015 Significant result increase due to higher sales volumes and efficiency improvements 1. Summary The EMS Group, with its companies
Innovative Vehicle Solutions
 Innovative Vehicle Solutions ANNUAL REPORT 2013 Content Haldex in brief 3 Highlights 4 Key figures 5 Business overview 6 Report from the CEO 10 Statement from the Chairman 13 Market trends and forces 14
Elekta Full-year report 2014/15
 Elekta Full-year report 2014/15 Tomas Puusepp President and CEO Håkan Bergström Chief Financial Officer 1 Performance Results significantly below expectations and guidance Action program initiated to return
SAF-HOLLAND Annual Financial Statements 2012. Detlef Borghardt, CEO Wilfried Trepels, CFO. March 14, 2013
 SAF-HOLLAND Annual Financial Statements 212 Detlef Borghardt, CEO Wilfried Trepels, CFO March 14, 213 Executive Summary business volume successfully expanded in 212 1 Group sales increased yoy by 3.4%
Disclaimer. Telenor First Quarter 2010
 Telenor First Quarter 2010 Jon Fredrik Baksaas, President and CEO Disclaimer The following presentation is being made only to, and is only directed at, persons to whom such presentation may lawfully be
Tieto Corporation. 26 October 2015. Tanja Lounevirta Head of IR
 Tieto Corporation 26 October 215 Tanja Lounevirta Head of IR Financial facts Customer sales in 214: EUR 1 523 million EBIT margin excl. one-off items *) : 9.9% Sales by Service Line Tieto s market position:
Group Financial Outlook and Strategy. Mark Langer, CFO Paris, November 19, 2014
 Investor Day 2014 Group Financial Outlook and Strategy Mark Langer, CFO Paris, November 19, 2014 HUGO BOSS 19-Nov-14 2 Agenda Review of past financial performance Current trading update Financial implications
Earnings Release Q3 FY 2015 April 1 to June 30, 2015
 Munich, Germany, July 30, 2015 Earnings Release FY 2015 April 1 to June 30, 2015 Solid performance, softening market environment»overall our businesses delivered solid underlying profitability despite
Q2 report 2014. August 20, 2014. Per Strömberg, CEO Sven Lindskog, CFO
 Q2 report 2014 August 20, 2014 Per Strömberg, CEO Sven Lindskog, CFO Continued increase of sales and profit in Q2 Net sales increased by 4.7%. Net sales in local currencies +4.4% EBIT excluding non-recurring
Financial Information
 Financial Information Solid results with in all key financial metrics of 23.6 bn, up 0.4% like-for like Adjusted EBITA margin up 0.3 pt on organic basis Net profit up +4% to 1.9 bn Record Free Cash Flow
ANNUAL REPORT FOR THE 2011/12 FINANCIAL YEAR
 ANNUAL REPORT FOR THE 20 FINANCIAL YEAR 15 August 2012 1 AGENDA THE FULL YEAR AND FOURTH QUARTER HIGHLIGHTS Tue Mantoni, CEO THE FINANCIAL RESULT FOR THE FOURTH QUARTER OF 20 Henning Bejer Beck, CFO THE
THIRD QUARTER REPORT 2008
 THIRD QUARTER REPORT 2008 This presentation contains forward looking statements. Such statements are based on our current expectations and are subject to certain risks and uncertainties that could negatively
Half year results 2011
 Half year results 2011 29 July 2011 Bert De Graeve, Chief Executive Officer Bruno Humblet, Chief Financial Officer Address by Bert De Graeve, Chief Executive Officer Introductory remark The consolidated
Investor Presentation 2010 Financial Results Full Year ended 30 June. Rebecca Norton, Chief Financial Officer
 Investor Presentation 2010 Financial Results Full Year ended 30 June Simon Full Year Woodfull, results Group CEO for year ended Rebecca Norton, Chief Financial Officer August 2010 AGENDA Group Highlights
Full-year results 2014. December 02, 2014
 Full-year results 2014 December 02, 2014 Disclaimer Stabilus S.A. (the Company, later Stabilus ) has prepared this presentation solely for your information. It should not be treated as giving investment
Interim report April-June 2003
 Interim report April-June 2003 Pre-tax profit for the second quarter amounted to SEK -34m, which is a SEK 30m improvement compared to last year (SEK -64m). Software revenue grew by 5% during the second
Aalberts Industries Net profit and earnings per share +15%
 PRESS RELEASE 1 ST HALF YEAR 2015 Aalberts Industries Net profit and earnings per share +15% Langbroek, 13 August 2015 Highlights o Revenue EUR 1,244 million, increase +18% (organic +2%). o Operating profit
CONFERENCE CALL PRELIMINARY FIGURES FISCAL YEAR 2013
 WELCOME DÜRR AKTIENGESELLSCHAFT CONFERENCE CALL PRELIMINARY FIGURES FISCAL YEAR 2013 Ralf W. Dieter, CEO Ralph Heuwing, CFO Bietigheim-Bissingen, February 25, 2014 www.durr.com DISCLAIMER This presentation
Interim report for the period April 1 December 31, 2001 (9 months)
") Addtech Group Interim report for the period April 1 December 31, (9 months) Net revenues amounted to MSEK 1 793 (1 784). Operating income, not including items affecting comparability, amounted to MSEK
Addtech Group Interim report for the period April 1 December 31, (9 months) Net revenues amounted to MSEK 1 793 (1 784). Operating income, not including items affecting comparability, amounted to MSEK
CONFERENCE CALL RESULTS JANUARY SEPTEMBER 2015
 WELCOME DÜRR AKTIENGESELLSCHAFT CONFERENCE CALL RESULTS JANUARY SEPTEMBER 2015 Ralf W. Dieter, CEO Ralph Heuwing, CFO Bietigheim-Bissingen, November 3, 2015 www.durr.com DISCLAIMER This presentation has
Earnings Release Q1 FY 2016 October 1 to December 31, 2015
 Munich, Germany, January 25, 2016 Earnings Release FY 2016 October 1 to December 31, 2015 Strong start into the fiscal year earnings outlook raised»we delivered a strong quarter and are well underway in
ELEKTA AB (publ) Interim report for the three months ended July 31, 2001
 Interim report for the three months ended July 31, 2001") ELEKTA AB (publ) Interim report for the three months ended July 31, 21 Operating profit was improved by SEK 5 M to SEK 33 M (loss: 17) and the operating margin increased to 6 percent (neg: 4). Strong order
ELEKTA AB (publ) Interim report for the three months ended July 31, 21 Operating profit was improved by SEK 5 M to SEK 33 M (loss: 17) and the operating margin increased to 6 percent (neg: 4). Strong order
Press Release. FY 2012/13 Alstom achieves a solid commercial and operational performance and free cash flow turns positive
 Press Release 7 May 2013 FY 2012/13 Alstom achieves a solid commercial and operational performance and free cash flow turns positive Between 1 April 2012 and 31 March 2013, Alstom booked 23.8 billion of
An attractive business model with a high return on capital
 KONE CMD 2015 An attractive business model with a high return on capital Eriikka Söderström, CFO Agenda Global position in a life cycle business Strong order book combined with recurring revenues Flexible
General Motors Company Q2 2013 Results
 General Motors Company 2013 Results July 25, 2013 Forward Looking Statements In this presentation and in related comments by our management, our use of the words expect, anticipate, possible, potential,
Ericsson reports good development in profitability, orders and sales
 First quarter report April 23, Ericsson reports good development in profitability, orders and sales First quarter summary Net sales SEK 28.1 (25.9) b., up 9% year-over-year Gross margin 44.7% (34.1%) 1)
ACE: Leader in the European Automotive Components Market
 ACE: Leader in the European Automotive Components Market ACE 2012-2015 Strategy 21/12/2011 Following on from our Current Report in December 2010, ACE s management herein presents its 2011 update on the
Ludwigshafen, February 25, 2014
 Ludwigshafen, February 25, 2014 Analyst Conference FY2013 Cautionary note regarding forward-looking statements This presentation may contain forward-looking statements that are subject to risks and uncertainties,
FOURTH QUARTER REPORT 2008 1
 FOURTH QUARTER REPORT 2008 Copyright Telefon AB LM Ericsson 2009. All rights reserved FOURTH QUARTER REPORT 2008 1 FOURTH QUARTER REPORT HENRY STÉNSON Senior Vice President Communications 2008 2 Copyright
Interim report January - March 2015
 Interim report January - March 2015 April 22 th 2015 Lars Wollung, CEO Erik Forsberg, CFO Q1 Key highlights Strong financial performance EBIT excluding revaluations and fx-impact +12% Investment grade
Vattenfall three-month Interim Report 2002 January - March
 1 Vattenfall three-month Interim Report 2002 January - March Presentations by Lars G Josefsson, CEO and Matts Ekman, CFO May 15, 2002 2 Highlights Net sales more than doubled to SEK 28.4 billion Return
Earnings Release Q4 FY 2015 July 1 to September 30, 2015
 Munich, Germany, November 12, 2015 Earnings Release FY 2015 July 1 to September 30, 2015 Strong finish for fiscal 2015»We delivered what we promised, and are well positioned to deliver on our plans for
Klöckner & Co SE. Q3 2014 Results
 Klöckner & Co SE A Leading Multi Metal Distributor Gisbert Rühl CEO Marcus A. Ketter CFO Results Analysts and Investors Conference November 6, Disclaimer This presentation contains forward-looking statements
K3 BUSINESS TECHNOLOGY GROUP PLC ( K3 or the Group ) Announces. Unaudited Half Yearly Report For the six months to 30 June 2009.
 Announces. Unaudited Half Yearly Report For the six months to 30 June 2009.") KBT 2 September K3 BUSINESS TECHNOLOGY GROUP PLC ( K3 or the Group ) Announces Half Yearly Report For the six months Key Points Encouraging results in more difficult trading environment demonstrate resilience
KBT 2 September K3 BUSINESS TECHNOLOGY GROUP PLC ( K3 or the Group ) Announces Half Yearly Report For the six months Key Points Encouraging results in more difficult trading environment demonstrate resilience
Service Tax Planning - Expected Revenue Growth in FY 2015
 Munich, Germany, May 7, 2015 Earnings Release FY 2015 January 1 to March 31, 2015 Portfolio gains drive income»for business volume, we performed well in our markets. The profitability of our Industrial
July September 2013. July September 2014
 Interim Report Interim Report Sales in the quarter increased to SEK 225.1 (216.9) million. In local currencies the decrease was 1.1 per cent. Operating profit for the quarter was SEK 12.9 (5.7) million.
DB2020 guiding us toward the future Annual Results Press Conference 2014. Deutsche Bahn AG DB Mobility Logistics AG Frankfurt, March 27, 2014
 DB2020 guiding us toward the future Annual Results Press Conference 2014 Deutsche Bahn AG DB Mobility Logistics AG Frankfurt, March 27, 2014 2013 Financial Year At a glance Weak development in 2013 2013
FOURTH QUARTER 2005. Highlights from fourth quarter 2005 include:
 FOURTH QUARTER 2005 Highlights from fourth quarter 2005 include: Revenues of 675 MNOK (+2% percent relative to fourth quarter 2004, +6% after adjusting for currency effects and acquisitions/disposals)
Vattenfall Q2 2013 results
 Vattenfall Q2 2013 results Øystein Løseth, CEO and Ingrid Bonde, CFO Conference call for analysts and investors, 23 July 2013 Q2 Highlights Impairment charges on thermal assets and goodwill amounting to
FINANCIAL RESULTS Q2 2015
 FINANCIAL RESULTS Q2 2015 CEO CHRISTIAN RYNNING-TØNNESEN CFO HALLVARD GRANHEIM 23 July 2015 Highlights Solid underlying results (EBITDA) - Lower Nordic prices offset by increased production and contribution
CONFERENCE CALL RESULTS JANUARY JUNE 2015
 WELCOME DÜRR AKTIENGESELLSCHAFT CONFERENCE CALL RESULTS JANUARY JUNE 2015 Ralf W. Dieter, CEO Ralph Heuwing, CFO Bietigheim-Bissingen, August 6, 2015 www.durr.com DISCLAIMER This presentation has been
Financial Results. siemens.com
 s Financial Results Fourth Quarter and Fiscal 2015 siemens.com Key figures (in millions of, except where otherwise stated) Volume Q4 % Change Fiscal Year % Change FY 2015 FY 2014 Actual Comp. 1 2015 2014
SSH COMMUNICATIONS SECURITY CORPORATION FINANCIAL STATEMENT RELEASE, JANUARY 1 MARCH 31, 2016
 SSH COMMUNICATIONS SECURITY CORPORATION FINANCIAL STATEMENT RELEASE April 21, 2016 AT 9:00 A.M SSH COMMUNICATIONS SECURITY CORPORATION FINANCIAL STATEMENT RELEASE, JANUARY 1 MARCH 31, 2016 January March