Health Atlas and the Community Health and Equity Index:
|
|
|
- Mervyn Austin Palmer
- 9 years ago
- Views:
Transcription
1 Health Atlas and the Community Health and Equity Index: An Examination of Health Conditions in the City of Los Angeles Presented by Eric Yurkovich, Raimi + Associates March 13, 2014

2 Purpose Spatial analysis that is a snapshot of the City today Identify locational disparities in: Health problems Environmental conditions Socio-economics Point us to targeted outreach and policy development

3 Health Element and Atlas Topics Demographics Socio-economics Education Health and healthcare Land use and employment Transportation Food systems Crime Housing Environmental health

4 Health Framework Source: Social Determinants of Health: How Social and Economic Factors Affect Health, LA County Public Health Department

5 Metrics Health & Socio-Economic Health Life Expectancy at Birth Percent Childhood Obesity Rate of Heart Disease Deaths per 100,000 Residents Rate of Heart Attacks in Population 45 and Over per 10,000 Residents Rate of Asthma-Related Emergency Department Visits in Population 17 and Under per 10,000 Percent Very Low [<1,500g] and Low Birth Weight Rate [1,500g to 2,500g] Rate of Respiratory Disease Deaths per 100,000 Residents Socio-Economic / Housing / Education Hardship Index Percentage of Housing Units with More than 1 Person per Room Percentage of Population with Income Less than the Federal Poverty Level Percentage of Unemployed Workers Age 16 and Over Percentage of Population Over 25 That Did Not Graduate High School Percentage of Population Over Age 65; & Percentage of Population Under Age 18 Median Household Income

6 Metrics Land Use and Community Character Walkability Index Housing Units per Acre of Residential Land Intersections per Square Mile Composite score of six land use categories [SF, MF, retail, office, education, entertainment] Retail Building Square Feet per Acre of Retail Land Complete Communities Index Food Retail (Supermarket, other food store) Services (Bank, Gym, Restaurant) Community Serving Retail ((Clothing store, convenience store, hardware store, pharmacy, other retail) Community and Civic Facilities (Number of Libraries, Community Centers, Churches, Senior Centers, etc.)
 Community and Civic Facilities (Number of Libraries, Community Centers, Churches,")
7 Metrics Transportation, Environmental Health, Crime and Food Systems Transportation Percentage of Workers Walking and Biking to Work Total Daily Boardings at Metro Transit Stops Linear Miles of Class I and II Bicycle Facilities Bus Stops with Transit Frequencies Less than 15 Minutes during the Peak Periods Motor Vehicle Crashes with Pedestrians/Cyclists per 10,000 Residents Additional Metrics Pollution Burden Score (CalEnviroScreen) mrfei (Ratio of Healthy to Unhealthy Food Retailers Rate of Violent and Property Crime per 10,000 Residents
 mrfei (Ratio of Healthy to Unhealthy Food Retailers Rate of Violent and Property Crime per")
8 Health Variables Health Life Expectancy at Birth Percent Childhood Obesity Rate of Heart Disease Deaths per 100,000 Residents Rate of Heart Attacks in Population 45 and Over per 10,000 Residents Rate of Asthma-Related Emergency Department Visits in Population 17 and Under per 10,000 Percent Very Low [<1,500g] and Low Birth Weight Rate [1,500g to 2,500g] Rate of Respiratory Disease Deaths per 100,000 Residents Key Issues related to the Health Variables Data accessibility Geographic scale Issues addressed in the Health Element of the General Plan
![Under per 10,000 Percent Very Low [<1,500g] and Low Birth Weight Rate [1,500g to 2,500g] Rate of Respiratory Disease Deaths per 100,000](/docs-images/48/18419416/images/page_8.jpg "Residents Key Issues related to the Health Variables Data accessibility Geographic scale Issues addressed in the Health Element of the")
9 Community Health and Equity Index Weighting Hardship Index (Standardized Index Score for Overcrowding, Poverty, Employment Status, Educational Attainment, Age Dependency, and Income) Demographic, Socio-- economics, Housing, and Education 35 Life Expectancy at Birth Health 15 Health Outcomes (Respiratory Disease, Heart Disease, Heart Attacks, Asthma, Low Birth Weight) Health 10 Walkability Index (Standardized Index Score for Housing Density, Retail Density, Street Connectivity, and Land Use Mix) Land Use 5 Complete Communities Index (Index Score of the Diversity of Amenities and Establishments) Land Use 2.5 Multi-Modal Transportation Index (Walk and Bike Commuting, Transit Ridership, Street Connectivity, Bicycle Facilities, High-Frequency Transit Service, Collisions with Bicyclists and Pedestrians) Transportation 7.5 Modified Retail Food Environment Index (Index Score of the Ratio of Healthy to Unhealthy Food Retailers) Food 10 Crime Rate Index (Rate of Violent and Property Crime per 10,000 Residents) Crime 7.5 Pollution Burden Index (Index Score for Pollution Exposure and Environmental Effects) Environmental Health 7.5 Subtotal: Demographic, Economic, Housing, and Education Indicators 35 Subtotal: Health 25 Subtotal: Land Use 7.5 Subtotal: Transportation 7.5 Subtotal: Food 10 Subtotal: Crime 7.5 Subtotal: Environmental Health 7.5
 Land Use 2.")
10 Community Health and Equity Index

11 Community Health and Equity Index Top Quintile

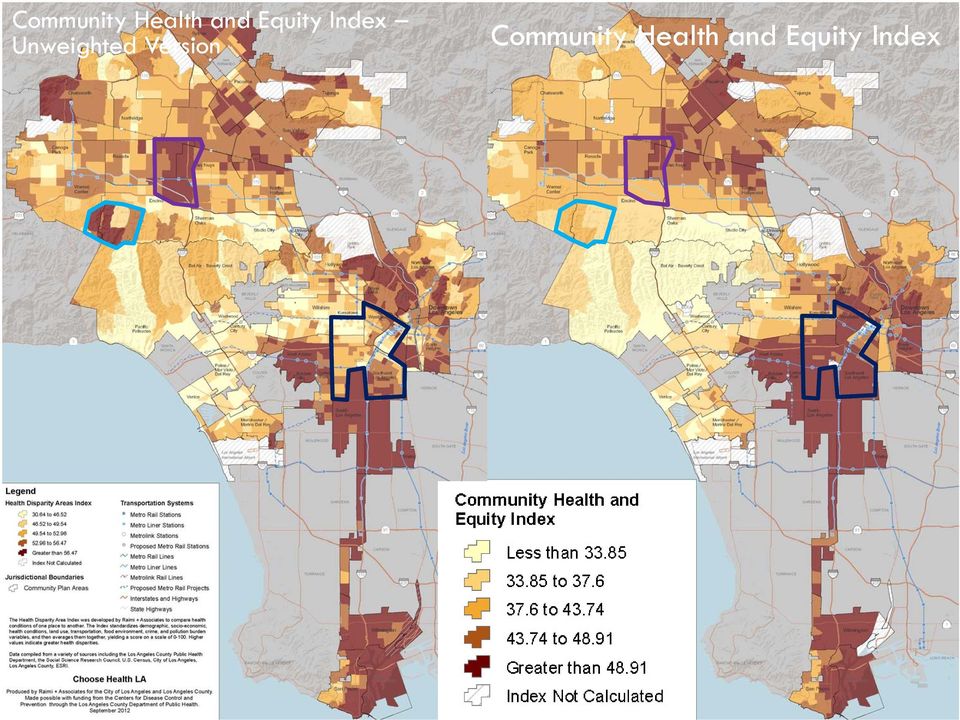
12 Community Health and Equity Index Unweighted Version Community Health and Equity Index
13 Community Health and Equity Index Excluding Health Variables Community Health and Equity Index

14 Discussion / Additional Maps

15 Economic Hardship Index Community Health and Equity Index

16 Economic Hardship Index

17 Life Expectancy at Birth Community Health and Equity Index

18

19 Modified Retail Food Environment Index Community Health and Equity Index

20 CalEnviroScreen Pollution Burden Score Community Health and Equity Index

21 Discussion
CITY OF EAST PALO ALTO A COMMUNITY HEALTH PROFILE
 CITY OF EAST PALO ALTO A COMMUNITY HEALTH PROFILE www.gethealthysmc.org Contact us: 650-573-2398 [email protected] HEALTH BEGINS WHERE PEOPLE LIVE Over the last century, there have been dramatic increases
Healthy, Equitable Transportation Performance Measures and Creative Place-making
 THE HONORABLE Mayor KEN WILBER, Karl Dean, CHAIRMAN Chairman Healthy, Equitable Transportation Performance Measures and Creative Place-making Rochelle Carpenter PSRC Bicycle/Pedestrian Advisory Committee
Appendix J Santa Monica Travel Demand Forecasting Model Trip Generation Rates
 Appendix J Santa Monica Travel Demand Forecasting Model Trip Generation Rates SANTA MONICA TRAVEL DEMAND FORECASTING MODEL TRIP GENERATION RATES SUBMITTED BY: 201 Santa Monica Blvd., Suite 500 Santa Monica,
Performance Measures for a Sustainable Transportation Network Pasadena s Approach Frederick C. Dock, Ellen Greenberg, Mark Yamarone
 Performance Measures for a Sustainable Transportation Network Pasadena s Approach Frederick C. Dock, Ellen Greenberg, Mark Yamarone Abstract. As California cities move into the second decade of the 21st
Chapter 9: Transportation
 Chapter 9: Transportation What is this chapter about? The goals and policies in this chapter convey the City s intent to: Create a coordinated, efficient, and more affordable multimodal transportation
20,000 s.f. office space available for lease
 20,000 S.F. OFFICE SPACE Highlights: 20,000 s.f. office space available for lease 638 Bloomfield Avenue, Montclair, New Jersey Limited office space in new mixed-use development in downtown Montclair Highly
HOW WILL PROGRESS BE MONITORED? POLICY AREA. 1. Implement the 2040 Growth Concept and local adopted land use and transportation plans
 PERFORMANCE MONITORING APPROACH OAR 660-044-0040(3)(e) directs Metro to identify performance measures and targets to monitor and guide implementation of the Climate Smart Strategy. The purpose of performance
A SNAPSHOT OF ALPENA COUNTY
 A SNAPSHOT OF ALPENA COUNTY agbioresearch.msu.edu msue.msu.edu About the Data This County Profile is to be used with the 2015-2016 Issue Identification process for State University Extension. Unless otherwise
Rapid City Downtown Area Master Plan. Draft Plan Concepts April 2016
 Rapid City Downtown Area Master Plan Draft Plan Concepts April 2016 CALL TO ACTION! A Thriving Downtown = Regional Economic Prosperity Rapid City is competing nationally for a limited supply of young skilled
Johnson Ferry Landing
 Atlanta Investment Opportunity The Offering Through its exclusive broker CBRE, the owner of 30 prime acres in East Cobb referred to as Johnson Ferry Landing is seeking quality-oriented, well-capitalized
Los Angeles Union Station, CA Sustainable Neighborhood Assessment. April 22-23, 2014
 Los Angeles Union Station, CA Sustainable Neighborhood Assessment April 22-23, 2014 Sustainable Neighborhood Assessment Through the Sustainable Neighborhood Assessment Tool developed by Global future development
San Francisco Complete Streets Strategy
 San Francisco Complete Streets Strategy Timothy Papandreou Deputy Director Sustainable Streets 2013 Sacramento 2 million San Francisco Bay Area 8 million Central Valley 4 million Los Angeles 19 million
Motorcycle & Pedestrian Master Plans in Indianapolis, Indiana
 PROJECT PURPOSE The Warsaw + Winona Lake Bicycle and Pedestrian Master Plan establishes a comprehensive framework for a connected bicycle and pedestrian system that will be used for both recreation and
Citizen Advisory Group Meeting #1 December 8, 2011 6:00 p.m.
 Citizen Advisory Group Meeting #1 December 8, 2011 6:00 p.m. Meeting Agenda 1. Background Information 2. Policy Framework 3. Plan Development Process 4. Public Input Results 5. Vision Statement 6. Group
30 Years of Smart Growth
 30 Years of Smart Growth Arlington County s Experience with Transit Oriented Development in the Rosslyn-Ballston Metro Corridor A Presentation by the Arlington County Department of Community Planning,
Examples of Transportation Plan Goals, Objectives and Performance Measures
 Examples of Transportation Plan Goals, Objectives and Performance Measures The next step in the Long Range Transportation Plan (LRTP) process is to develop goals, objectives, and performance measures.
IMAGINE FLINT MASTER PLAN FOR A SUSTAINABLE FLINT Goals and Objectives
 IMAGINE FLINT MASTER PLAN FOR A SUSTAINABLE FLINT Goals and Objectives Adopted October 28, 2013 The City of Flint s Imagine Flint Master Plan for a Sustainable Flint is a blueprint for the future, guiding
TCRP Report 153: Guidelines for Providing Access to Public Transportation Stations. Part 2: Station Typology and Mode of Access Planning Tool
 TCRP Report 153: Guidelines for Providing Access to Public Transportation Stations Part 2: Station Typology and Mode of Access Planning Tool Jamie Parks, AICP Kittelson & Associates, Inc. Acknowledgements
The Road to Health Care Parity: Transportation Policy and Access to Health Care
 The Road to Health Care Parity: Transportation Policy and Access to Health Care April 2011 The Leadership Conference Education Fund 202.466.3434 voice 202.466.3435 fax www.civilrights.org I. Transportation
Applying the Triple Bottom Line
 Applying the Triple Bottom Line Brownfields Inventory Completed Inventory in 5 Targeted Areas Preliminarily Identified 400 Brownfields Refined to Include Top 120 Brownfields Ranked Sites Using Triple Bottom
Data Analysis and Interpretation. Eleanor Howell, MS Manager, Data Dissemination Unit State Center for Health Statistics
 Data Analysis and Interpretation Eleanor Howell, MS Manager, Data Dissemination Unit State Center for Health Statistics Why do we need data? To show evidence or support for an idea To track progress over
Cuyahoga County Community Health Data Dashboard
 Cuyahoga County Community Health Data Dashboard Presentation to MetroHealth November 22, 2013 1 Meeting Goals & Agenda Community Health Data Dashboard Cuyahoga County Community Health Data Dashboard (C3HD2)
Health Disparities in New Orleans
 Health Disparities in New Orleans New Orleans is a city facing significant health challenges. New Orleans' health-related challenges include a high rate of obesity, a high rate of people without health
New Mexico. Comparison Profile prepared by the New Mexico Economic Development Department State Data Center. Page 1 of 5
 DEMOGRAPHICS Population estimates, July 1, 2014 2,085,572 Population, percent change - April 1, 2010 to July 1, 2014 1.4% Population estimates, July 1, 2013 2,085,287 Population, percent change - April
Lincoln Downtown Master Plan Update
 Lincoln Downtown Master Plan Update Table of Contents Executive Summary........................................... 1 Complete Streets Framework.................................... 3 Promenade Creating
A PPENDICES C OLLIERVILLE 2040 LAND USE PLAN UPDATE
 A PPENDICES C OLLIERVILLE 2040 LAND USE PLAN UPDATE Traditional Neighborhood Character Study with a Neighborhood Center Commercial Node Aldi s is appropriate in a Neighborhood Center School Greenbelt Trail
Technical Report 1: Regional Demographic Profile
 Technical Report 1: Regional Demographic Profile Compiled by the Piedmont Triad Regional Council January, 2013 Triad Tomorrow Figure 1. Piedmont Triad Region CONTEXT The Piedmont Triad region consists
Memorial Hermann Rehabilitation Hospital Katy Community Health Needs Assessment
 Memorial Hermann Rehabilitation Hospital Katy Memorial Hermann Rehabilitation Hospital Katy Prepared by: Community Hospital Consulting August 2012 Table of Contents Executive Summary... Facility Background..
College of Southern Maryland. Hughesville Transportation Study
 College of Southern Maryland Project Overview Existing Conditions Transit Service Land Use CSM Student Demographics Recommendations Methodology Transit Recommendations Transportation Demand Management
Comparison Profile prepared by the New Mexico Economic Development Department State Data Center. Page 1 of 5
 Comparing New Mexico to Colorado DEMOGRAPHICS Colorado New Mexico Population estimates, July 1, 2014 5,355,866 2,085,572 Population, percent change - April 1, 2010 to July 1, 2014 1.4% 1.4% Population
Wheaton Urban District Market Analysis: Part I Report. Submitted To: Maryland Department of Transportation
 Wheaton Urban District Market Analysis: Part I Report Submitted To: Maryland Department of Transportation January 2010 Executive Summary Summary of Market Findings 1. How much new development could Wheaton
Lynnwood Place. FOR LEASE 184th Street SW & 33rd Avenue, Lynnwood. Exciting New Mixed-Use Development
 FOR LEASE 184th Street SW & 33rd Avenue, Lynnwood Entrance to the project from 184th St SW directly across from Alderwood Mall Exciting New Mixed-Use Development Retail, restaurant, entertainment, and
Chapter 1: Background
 Chapter 1: Background 1.1 Trends in Bicycle Ridership and Collisions in Toronto Toronto has relatively high levels of bicycle traffic on its downtown streets. On a typical weekday, bicycles make up roughly
REGIONAL NON-MOTORIZED TRANSPORTATION NETWORK
 Chapter 10 Bicycle and Pedestrian SAFETEA-LU legislation requires that non-motorized users be considered in the LRTP. The legislation allows for bicycle and pedestrian safety to be incorporated into the
MARKET OPPORTUNITIES. Incentives for Food Retailers
 MARKET OPPORTUNITIES Incentives for Food Retailers South : Opportunity for Growth... Increasing healthy eating options by locating new grocery stores, sit-down restaurants and fresh food markets in the
Care, Fairness & Housing Policy Development Panel 21 November 2005
 Agenda Item No: 6 Developing a Corporate Health & Well-being Strategy Head of Environmental Services Summary: This report proposes the development of a health & well-being strategy for the Council, which
This report card was produced by: 995 Market St, Suite 1450 San Francisco, CA 94702 www.walksf.org
 This report card was produced by: 995 Market St, Suite 1450 San Francisco, C 94702 www.walksf.org Special thanks to interns Christina Blackston and Haley Meisenholder for their contributions to this report
Overview of the Travel Demand Forecasting Methodology
 Overview of the Travel Demand Forecasting Methodology Prepared by the Central Transportation Planning Staff (CTPS) Authors: Scott A. Peterson, Manager Ian Harrington, Chief Planner March 29, 2008 1 OVERVIEW
Needs Analysis. Long Beach Bicycle Master Plan. Bicycle Commuter Needs. LONG BEACH BICYCLE MASTER PLAN Needs Analysis
 Long Beach Bicycle Master Plan Needs Analysis The purpose of reviewing the needs of commuter and recreational bicyclists is twofold: (1) it is instrumental when planning a system which must serve both
BICYCLE TRENDS IN CAMBRIDGE
 BICYCLE TRENDS IN CAMBRIDGE Cambridge promotes bicycling as a healthy, environmentally friendly way of getting around as an important part of the City's efforts to improve mobility and protect our environment.
SECTION ONE CHAPTER 2: A LAND USE PROFILE OF MANCHESTER
 SECTION ONE CHAPTER 2: A LAND USE PROFILE OF MANCHESTER Land use is the central element of a comprehensive plan because it establishes the overall physical configuration of the city, including the mix
What we build today will create Denver s tomorrow. Signature development projects will strengthen our economy, create jobs and improve neighborhoods.
 Mayor Hancock s Vision for Building a World-Class City What we build today will create Denver s tomorrow. Signature development projects will strengthen our economy, create jobs and improve neighborhoods.
The Gateway Temple City
 The Gateway Temple City California Pacific Group Regional Center (CPG-RC) has been designated as Regional Center by the United States Citizenship and Immigration Services. (See exhibit A ) We assist foreign
Baltimore Food Policy Initiative: A Catalyst to Address Health, Economic and Environmental Disparities
 Baltimore Food Policy Initiative: A Catalyst to Address Health, Economic and Environmental Disparities Mayor Stephanie Rawlings-Blake Baltimore City [email protected] August 29 th, 2014 Baltimore
A Bicycle Accident Study Using GIS Mapping and Analysis
 A Bicycle Accident Study Using GIS Mapping and Analysis Petra Staats, Graduate Assistant, Transportation Policy Institute, Rutgers University, New Brunswick, NJ, USA [email protected] Summary Surveys
 Walkable Communities Florida Department of Transportation State Safety Office Pedestrian and Bicycle Program April 1995 www.dot.state.fl.us/safety Twelve Steps for an Effective Program Page 1 Twelve Steps
EPA Technical Assistance for Sustainable Communities Building Blocks
 EPA Technical Assistance for Sustainable Communities Technical Assistance Tool: Complete Streets Deerfield Beach, Florida February 16, 2012 To: CC: Amanda Martinez, City of Deerfield Beach Roger Millar,
PUBLIC SCHOOL FACILITIES ELEMENT
 PUBLIC SCHOOL FACILITIES ELEMENT GOALS, OBJECTIVES AND POLICIES JULY 2006 Prepared By: The City of Miami Gardens Planning and Zoning Department 1515 NW 167 th Street, Building 5, Suite 200 Miami Gardens,
Oregon City Clackamas County Red Soils Campus
 Oregon City Clackamas County Red Soils Campus Clackamas County Red Soils Campus Oregon City The Clackamas County Red Soils Campus focus area is located in the City of Oregon City. It is situated approximately
East Somerville. What is important to me Survey Results
 What is important to me Survey Results The What is important to me survey was used at the Somerville by Design: Crowdsourcing meeting on May 28, 213. About 35 people filled out the survey at that meeting,
Community Design and Health Promotion: Local Public Health Response
 Community Design and Health Promotion: Local Public Health Response Cheza Garvin, PhD, MPH, MSW Program Director, Chronic Disease Prevention and Healthy Aging Public Health Seattle & King County Public
Supplemental Plan Check Corrections Sheet for Bicycle Parking Ordinance (Effective 3/13/2013)
") Supplemental Plan Check Corrections Sheet for Bicycle Parking Ordinance (Effective 3/13/2013) Plan Check PCIS application number: - - Job Address Zone: P.C. Engineer (E-mail: [email protected])
Supplemental Plan Check Corrections Sheet for Bicycle Parking Ordinance (Effective 3/13/2013) Plan Check PCIS application number: - - Job Address Zone: P.C. Engineer (E-mail: [email protected])
Summary Community Workshop #2 Fruitvale San Antonio Senior Center. Wednesday, April 22, 2009 7:00-9:00 p.m.
 Summary Community Workshop #2 Wednesday, April 22, 2009 7:00-9:00 p.m. Workshop Format and Process The City of Oakland is preparing a Specific Plan that will help define and determine a common vision for
COUNTY HEALTH RANKINGS 2015. Joseph P. Iser, MD, DrPH, MSc Chief Health Officer, Southern Nevada Health District Introductions and Welcome
 COUNTY HEALTH RANKINGS 2015 Joseph P. Iser, MD, DrPH, MSc Chief Health Officer, Southern Nevada Health District Introductions and Welcome OVERVIEW OF TODAYS MEETING Welcome and Introductions, Joseph P.
ORANGE COUNTY TRANSPORTATION AUTHORITY. Final Long-Range Transportation Plan - Destination 2035. Attachment A
 ORANGE COUNTY TRANSPORTATION AUTHORITY Final Long-Range Transportation Plan - Destination 2035 Attachment A DESTINATION 2035 DESTINATION 2035 EXECUTIVE SUMMARY ATTACHMENT A Moving Toward a Greener Tomorrow
Cycle safety. Monograph 17. Cycle safety: a national perspective. Cycle helmets
 Monograph 17 Cycle safety ISSN: 1444-3503 ISBN: 1 877071 85 4 Cycle safety: a national perspective Cycling is an important form of transport and recreation for many Australians. It is accessible to a wide
Stone Way N Rechannelization: Before and After Study. N 34th Street to N 50th Street
 City of Seattle Department of Transportation Stone Way N Rechannelization: Before and After Study N 34th Street to N 50th Street May, 2010 INTRODUCTION Population density in Seattle is increasing within
Social Trends Health Outcomes
 Social Trends Health Outcomes Minnesota Council on Foundations Health Briefing May 10, 2011 Paul Mattessich, Ph.D. Wilder Research Minnesota Compass Working to change the equation From: Good intentions
911 UNIVERSITY DRIVE STATE COLLEGE, PA
 911 UNIVERSITY DRIVE STATE COLLEGE, PA HIGH PROFILE OFFICE CENTER FOR SALE OR LEASE Excellent property and location 10,750 (+/-) S.F. Can divide into 2,000 SF+ Office Spaces Convenient access to downtown,
CARMEL, IN RETAIL OFFICE OUTLOTS. Retail, Office Space & Land Available
 CARMEL, IN RETAIL OFFICE OUTLOTS Retail, Office Space & Land Available PROVIDENCE AT OLD MERIDIAN Providence at Old Meridian is a 23-acre mixed-use Traditional Neighborhood Development consisting of residential
Applying GIS and Survey Data to Transportation Demand Management. Richard Hsu, M.S. Carina Anttila-Suarez, Ph.D.
 Applying GIS and Survey Data to Transportation Demand Management Richard Hsu, M.S. Carina Anttila-Suarez, Ph.D. Skyline College at a Glance: Campus population: 16,000+ students 500+ employees Campus environment:
ASPEN HILL Minor Master Plan Amendment
 ASPEN HILL Minor Master Plan Amendment Agenda Welcome and Introductions (6:30 PM) Staff Presentation (6:40-7:30 PM) Q&A (7:30-8:00 PM) Community Meeting #2 April 1, 2014 Aspen Hill Library Planning Process
Population Health Management: Using Geospatial Analytics to Enable Data-Driven Decisions
 Population Health Management: Using Geospatial Analytics to Enable Data-Driven Decisions Brian Jacobs, MD VP, CMIO & CIO Children s National Health System Washington, DC Volume vs Value Based Care Delivery
Pedestrian & Bicycle Plan
 RAMSEY COMMUNITIES COUNTYWIDE Pedestrian & Bicycle Plan PRIMER: LEGAL FRAMEWORK PRIMER: LEGAL FRAMEWORK Walking and Biking for All e 2 CHAPTER 2: Walking and Biking for All This page intentionally left
d r a f t Division Street: 15.4 du/a Damen Avenue: 14.1 du/a Western Avenue: 12.8 du/a
 Transit [take transit: We live in the City, people. We can t expect to have parking. ] The ability of people to travel by transit is not only an equity issue, it is a matter of economic vitality for the
Using Built Environment Indicators in Public Health: Proximity to a Community Focal Point Indicator
 Using Built Environment Indicators in Public Health: Proximity to a Community Focal Point Indicator APHEO Built Environment Sub-group September 15, 2014 Built Environment Sub-Group The built environment
For more information, visit: rethinkingstreets.com
 For more information, visit: rethinkingstreets.com 37 Arterial Rehab Busy, multi-lane streets, often referred to as arterials, crisscross the landscape of our cities and suburbs. Alongside these wide thoroughfares,
Ohio County Profiles Prepared by the Office of Research
 Ohio County Profiles Prepared by the Office of Research Established: Act - April 1, 182 214 Population: 28,462 Land Area: 41.1 square miles County Seat: Van Wert City Named for: Isaac Van Wert, Revolutionary