Visualisatie BMT. Introduction, visualization, visualization pipeline. Arjan Kok Huub van de Wetering
|
|
|
- Jeffry Griffith
- 9 years ago
- Views:
Transcription
1 Visualisatie BMT Introduction, visualization, visualization pipeline Arjan Kok Huub van de Wetering 1

2 Lecture overview Goal Summary Study material What is visualization Examples Visualization pipeline 2

3 Goal Provide theoretical and practical knowledge in: Data visualization Data representation Computer graphics Data processing in Java Visualization in MayaVi 3

4 Summary (1) Introduction What is visualization Related disciplines Fields of applications The visualization pipeline Definition Data enrichment, mapping, rendering 4

5 Summary (2) Basic data representation Datasets Sampling Interpolation Graphics rendering Rendering process Color Lighting, shading 5

6 Summary (3) Algorithms Scalar algorithms Vector algorithms Tensor algorithms Modeling algorithms Volume visualization Ray tracing, ray sampling Volume interpolation 6

7 Study material Theory Book Slides Practice MayaVi (visualization tool) Jaspis (java programming tool) Assignments 7
")
8 Book The Visualization Toolkit An Object-Oriented Approach to 3D Graphics W. Schroeder, K. Martin, B. Lorensen Prentice Hall Book contains a lot more than the course does (course will address specific parts/chapters) Book contains software (VTK) we shall not (directly) use 8
 Book contains software")
9 Slides Slides used in lectures will be available at: 9

10 Visualization 10
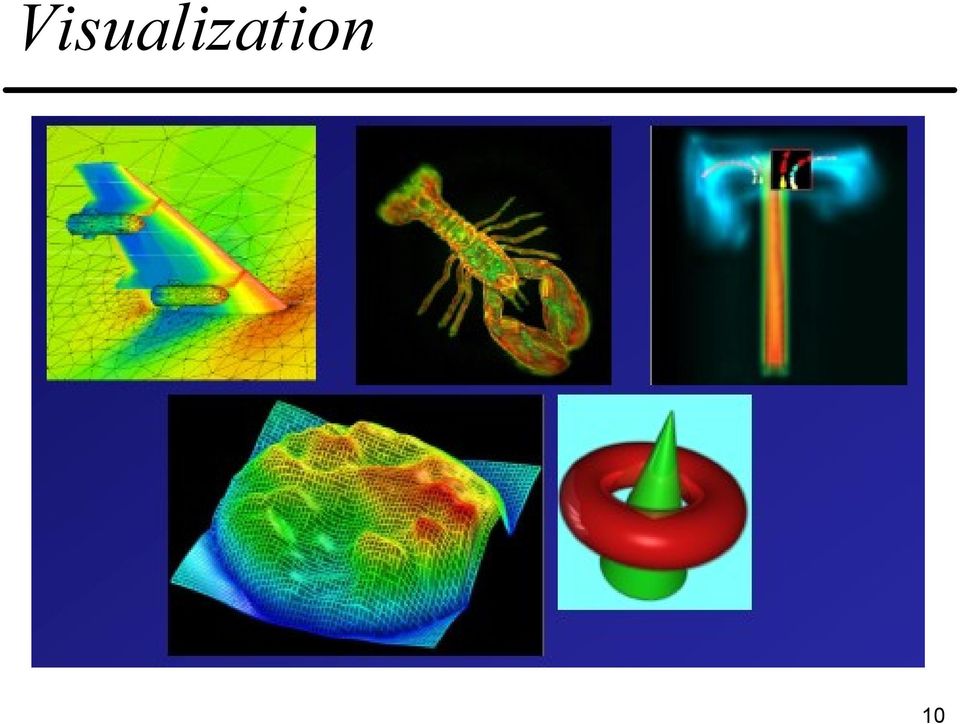


11 What do we visualize? 11

12 Visualization The purpose of computing is insight, not numbers - Richard Hamming 12

13 Visualization - insight in data 13

14 From data to pictures Attributes of Visualization Making abstract data visible (complex, many) Forming a mental image of something abstract Using the abilities of human vision and interaction DATA VISUALIZATION PICTURES E a: b: 43.3 C:

15 Scientific visualization The use of computer imaging techniques as a tool for comprehending data obtained by simulation or physical measurements The techniques that allow scientists and engineers to extract knowledge from the results of simulations and computations 15

16 Goals in visualization Exploration of data and information Enhancing understanding of concepts and processes Gaining new (unexpected) insight Making invisible visible Effective presentation of significant features Quality control of simulations and measurements Increasing scientific production 16

17 Visualization challenges Getting usable data Parsable Visualizable Defining your goal What is the focus of attention or primary features Who is the audience What is the message Choosing meaningful/compelling visual representations 17

18 Graphs

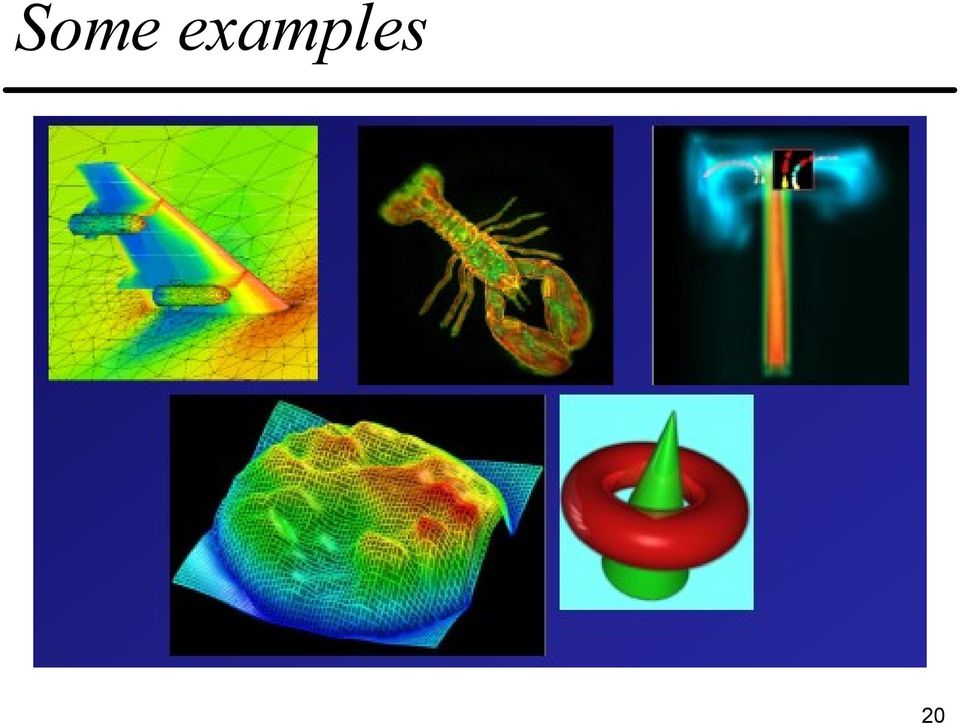
19 Complex data We are interested in more complex data Multi-dimensional Complex geometry Computed or collected Simulations MRI, CT,.. Microscopic to galactic data collections 19

20 Some examples 20
21 Related disciplines USER INTERFACE STUDIES IMAGE PROCESSING PERCEPTUAL PSYCHOLOGY COMPUTER AIDED DESIGN V I S U A L I Z A T I O N GEOMETRIC MODELING COMPUTER GRAPHICS SIGNAL PROCESSING 21
22 Imaging, graphics, visualization Imaging The study of 2D images (transformations, enhancement, information extraction) Graphics Creating images using a computer (2D drawing techniques, 3D rendering techniques) Visualization Exploring, transforming, and viewing data as images 22
23 Imaging, graphics, visualization Visualization uses computer graphics and imaging as tools for the higher level goal of getting insight into data Graphics and imaging are particular forms of visualization 23
24 Imaging, graphics, visualization Data dimensionality Data transformation Imaging Graphics Visualization 2D 2D, 3D nd image 2D/3D object any data image image image 24
25 Applications 25
26 Applications Biochemistry Molecular modeling/dynamics Industrial research on molecular structures Drug design DATA VISUALIZATION PICTURES molecule structures 26
27 Molecular visualization 27
28 Molecular visualization 28
29 Applications Mathematics Understanding complex concepts (functions, surfaces, fields,..) DATA VISUALIZATION PICTURES functions f(x,y,z) function plot 29
30 Mathematics z = F(x,y) = e-rcos(10r) nested implicit functions saddle quadric surface F(x,y,z) = 0 30
31 Applications Medicine Diagnosis Treatment planning Education Research DATA VISUALIZATION PICTURES 2D/3D scan data surfaces/ slices 31
32 Medicine 32
33 Examples Geosciences Weather forecast Topography Geology DATA VISUALIZATION PICTURES surface/ volume data surfaces/ height plots 33
34 Geosciences Rain during summer 2004 Ocean surface height during the El Nino event 34
35 Applications Space sciences Astronomy Astrophysics Remote sensing 35
36 Space sciences Orion Nebula as seen from a virtual spacecraft 36
37 Applications Engineering and physics Computational fluid dynamics Fluid flow simulation Surface modeling Finite element simulations Physical processes (strength, elasticity, flow,..) 37
38 Computational fluid dynamics velocity of a turbulent jet flow air pressure on a plane wing internal waves inside the ocean 38
39 Finite element methods pressure on a plane wing 2D flow past a cylinder 39
40 Applications Architecture Simulations of: Indoor lighting Sound Heath Air 40
41 Architecture Simulation of light in a theatre 41
42 Applications Visualization is applicable in any research or engineering field DATA VISUALIZATION PICTURES E a: b: 43.3 C:
43 Visualization pipeline Describes the steps to transform raw data into displayable images Goal of these steps is to convert the information to a format amenable to understanding by the human perceptual system while maintaining the integrity of information 43
44 Visualization pipeline Raw Data Data Enrichment/Enhancement Derived Data Visualization Mapping Abstract Visualization Object Rendering Displayable Image 44
45 Getting the data Measured data Simulation data Data formats Data compression HDF, NetCDF, XDR, Dicom,. RLE, Fractal methods,. my own format Visualization internal data (ready for the pipeline) 45
46 Step 1: Data enrichment Data enrichment Interpolation Filtering and smoothing Selection Merging Format conversion 2D and 3D conversions (rotation, translation) data object(s) data enrichment (filter object) data object(s) 46
47 Step 2: Mapping Mapping Generating displayable data (2D and 3D objects) whose shape, dimensions and color represent the enriched data Abstract visualization objects The 2D and 3D objects resulting from the mapping stage (graphical primitives) data object(s) mapping (mapper object) abstract visualization objects 47
48 Step 3: Rendering Rendering Produces an image (view) of the 2D/3D abstract visualization objects Several rendering parameters (lighting, shadows, reflections, etc) abstract visualization objects rendering image(s) 48
49 Step 3: Rendering Rendering Special rendering techniques such as volume rendering for non-opaque data data object(s) volume rendering image(s) 49
50 Example 50
51 Example pipeline reader outline filter data mapper lines mapper surfaces mapper surface polydata data render str. pnts geometry filter data polydata image 51
52 Visualization and interaction Raw Data u s e r i n p u t Data Enrichment/Enhancement Derived Data Visualization Mapping Abstract Visualization Object Rendering Displayable Image 52
53 Visualization and research process Visualization plays a large role in forming the link between hypothesis and experiment, and between insight and new hypothesis 53

54 Visualization and research process 54
55 Visualization pipeline (revisited) Raw Data Data Enrichment/Enhancement Derived Data Visualization Mapping Abstract Visualization Object Rendering Displayable Image 55
The Visualization Pipeline
 The Visualization Pipeline Conceptual perspective Implementation considerations Algorithms used in the visualization Structure of the visualization applications Contents The focus is on presenting the
MayaVi: A free tool for CFD data visualization
 MayaVi: A free tool for CFD data visualization Prabhu Ramachandran Graduate Student, Dept. Aerospace Engg. IIT Madras, Chennai, 600 036. e mail: [email protected] Keywords: Visualization, CFD data,
Introduction to Computer Graphics
 Introduction to Computer Graphics Torsten Möller TASC 8021 778-782-2215 [email protected] www.cs.sfu.ca/~torsten Today What is computer graphics? Contents of this course Syllabus Overview of course topics
Outline. Fundamentals. Rendering (of 3D data) Data mappings. Evaluation Interaction
 Data mappings. Evaluation Interaction") Outline Fundamentals What is vis? Some history Design principles The visualization process Data sources and data structures Basic visual mapping approaches Rendering (of 3D data) Scalar fields (isosurfaces
Outline Fundamentals What is vis? Some history Design principles The visualization process Data sources and data structures Basic visual mapping approaches Rendering (of 3D data) Scalar fields (isosurfaces
IDL. Get the answers you need from your data. IDL
 Get the answers you need from your data. IDL is the preferred computing environment for understanding complex data through interactive visualization and analysis. IDL Powerful visualization. Interactive
COSC 6344 Visualization
 COSC 64 Visualization University of Houston, Fall 2015 Instructor: Guoning Chen [email protected] Course Information Location: AH 2 Time: 10am~11:am Tu/Th Office Hours: 11:am~12:pm Tu /Th or by appointment
Visualization Process. Alark Joshi
 Visualization Process Alark Joshi Task-specific Visualization Design LA Treinish, Task-specific visualization design, IEEE Computer Graphics and Applications, 1999 Generalized visualization systems are
Introduction to Visualization with VTK and ParaView
 Introduction to Visualization with VTK and ParaView R. Sungkorn and J. Derksen Department of Chemical and Materials Engineering University of Alberta Canada August 24, 2011 / LBM Workshop 1 Introduction
A Short Introduction on Data Visualization. Guoning Chen
 A Short Introduction on Data Visualization Guoning Chen Data is generated everywhere and everyday Age of Big Data Data in ever increasing sizes need an effective way to understand them History of Visualization
Computer Animation and Visualisation. Lecture 1. Introduction
 Computer Animation and Visualisation Lecture 1 Introduction 1 Today s topics Overview of the lecture Introduction to Computer Animation Introduction to Visualisation 2 Introduction (PhD in Tokyo, 2000,
Visualization methods for patent data
 Visualization methods for patent data Treparel 2013 Dr. Anton Heijs (CTO & Founder) Delft, The Netherlands Introduction Treparel can provide advanced visualizations for patent data. This document describes
Volume visualization I Elvins
 Volume visualization I Elvins 1 surface fitting algorithms marching cubes dividing cubes direct volume rendering algorithms ray casting, integration methods voxel projection, projected tetrahedra, splatting
Multi-Dimensional Data Visualization
 Multi-Dimensional Data Visualization Matthew J. Pastizzo University at Albany, State University of New York and Haskins Laboratories Robert F. Erbacher University at Albany, State University of New York
CPIT-285 Computer Graphics
 Department of Information Technology B.S.Information Technology ABET Course Binder CPIT-85 Computer Graphics Prepared by Prof. Alhasanain Muhammad Albarhamtoushi Page of Sunday December 4 0 : PM Cover
CAD and Creativity. Contents
 CAD and Creativity K C Hui Department of Automation and Computer- Aided Engineering Contents Various aspects of CAD CAD training in the university and the industry Conveying fundamental concepts in CAD
Course Overview. CSCI 480 Computer Graphics Lecture 1. Administrative Issues Modeling Animation Rendering OpenGL Programming [Angel Ch.
 CSCI 480 Computer Graphics Lecture 1 Course Overview January 14, 2013 Jernej Barbic University of Southern California http://www-bcf.usc.edu/~jbarbic/cs480-s13/ Administrative Issues Modeling Animation
UNIVERSITY OF MACAU DEPARTMENT OF COMPUTER AND INFORMATION SCIENCE SFTW 463 Data Visualization Syllabus 1 st Semester 2011/2012 Part A Course Outline
 Elective required course in Computer Science UNIVERSITY OF MACAU DEPARTMENT OF COMPUTER AND INFORMATION SCIENCE SFTW 463 Data Visualization Syllabus 1 st Semester 2011/2012 Part A Course Outline Catalog
Visualizing Electromagnetic Fields: The Visualization Toolkit. Michael Selvanayagam
 Visualizing Electromagnetic Fields: The Visualization Toolkit Michael Selvanayagam Visualization What is the purpose of visualizing electromagnetic (EM) Fields? Visualization 1. Understand the geometry
Big Data: Rethinking Text Visualization
 Big Data: Rethinking Text Visualization Dr. Anton Heijs [email protected] Treparel April 8, 2013 Abstract In this white paper we discuss text visualization approaches and how these are important
Information Visualization WS 2013/14 11 Visual Analytics
 1 11.1 Definitions and Motivation Lot of research and papers in this emerging field: Visual Analytics: Scope and Challenges of Keim et al. Illuminating the path of Thomas and Cook 2 11.1 Definitions and
ICS : 435. Computer Graphics Applications. Instructor : Da'ad Albalawneh
 ICS : 435 Computer Graphics Applications Instructor : Da'ad Albalawneh Course Outline Applications CAD/CAM, Art, Entertainment, Education, Training, Visualization, GUI, Image Processing. Overview of Computer
Visualization with ParaView. Greg Johnson
 Visualization with Greg Johnson Before we begin Make sure you have 3.8.0 installed so you can follow along in the lab section http://paraview.org/paraview/resources/software.html http://www.paraview.org/
GRAVE: An Interactive Geometry Construction and Visualization Software System for the TORT Radiation Transport Code
 GRAVE: An Interactive Geometry Construction and Visualization Software System for the TORT Radiation Transport Code E. D. Blakeman Oak Ridge National Laboratory Oak Ridge, TN 37831 [email protected] ABSTRACT
Lecture Notes, CEng 477
 Computer Graphics Hardware and Software Lecture Notes, CEng 477 What is Computer Graphics? Different things in different contexts: pictures, scenes that are generated by a computer. tools used to make
The Design and Implementation of a C++ Toolkit for Integrated Medical Image Processing and Analyzing
 The Design and Implementation of a C++ Toolkit for Integrated Medical Image Processing and Analyzing Mingchang Zhao, Jie Tian 1, Xun Zhu, Jian Xue, Zhanglin Cheng, Hua Zhao Medical Image Processing Group,
Visualization. For Novices. ( Ted Hall ) University of Michigan 3D Lab Digital Media Commons, Library http://um3d.dc.umich.edu
 University of Michigan 3D Lab Digital Media Commons, Library http://um3d.dc.umich.edu") Visualization For Novices ( Ted Hall ) University of Michigan 3D Lab Digital Media Commons, Library http://um3d.dc.umich.edu Data Visualization Data visualization deals with communicating information about
Visualization For Novices ( Ted Hall ) University of Michigan 3D Lab Digital Media Commons, Library http://um3d.dc.umich.edu Data Visualization Data visualization deals with communicating information about
Curves and Surfaces. Goals. How do we draw surfaces? How do we specify a surface? How do we approximate a surface?
 Curves and Surfaces Parametric Representations Cubic Polynomial Forms Hermite Curves Bezier Curves and Surfaces [Angel 10.1-10.6] Goals How do we draw surfaces? Approximate with polygons Draw polygons
A FRAMEWORK FOR THE INTERACTIVE VISUALIZATION OF ENGINEERING MODELS
 17 th International Conference on the Application of Computer Science and Mathematics in Architecture and Civil Engineering K. Gürlebeck and C. Könke (eds.) Weimar, Germany, 12 14 July 2006 A FRAMEWORK
Visualization with ParaView
 Visualization with ParaView Before we begin Make sure you have ParaView 4.1.0 installed so you can follow along in the lab section http://paraview.org/paraview/resources/software.php Background http://www.paraview.org/
An example. Visualization? An example. Scientific Visualization. This talk. Information Visualization & Visual Analytics. 30 items, 30 x 3 values
 Information Visualization & Visual Analytics Jack van Wijk Technische Universiteit Eindhoven An example y 30 items, 30 x 3 values I-science for Astronomy, October 13-17, 2008 Lorentz center, Leiden x An
VisIt Visualization Tool
 The Center for Astrophysical Thermonuclear Flashes VisIt Visualization Tool Randy Hudson [email protected] Argonne National Laboratory Flash Center, University of Chicago An Advanced Simulation and Computing
FDVis: the Interactive Visualization and Steering Environment for the Computational Processes Using the Finite-Difference Method
 Nonlinear Analysis: Modelling and Control, 2003, Vol. 8, No. 2, 71 82 FDVis: the Interactive Visualization and Steering Environment for the Computational Processes Using the Finite-Difference Method A.
Visualization Plugin for ParaView
 Alexey I. Baranov Visualization Plugin for ParaView version 1.3 Springer Contents 1 Visualization with ParaView..................................... 1 1.1 ParaView plugin installation.................................
Data Visualization. Principles and Practice. Second Edition. Alexandru Telea
 Data Visualization Principles and Practice Second Edition Alexandru Telea First edition published in 2007 by A K Peters, Ltd. Cover image: The cover shows the combination of scientific visualization and
COMP-557: Fundamentals of Computer Graphics McGill University, Fall 2010
 COMP-557: Fundamentals of Computer Graphics McGill University, Fall 2010 Class times 2:25 PM - 3:55 PM Mondays and Wednesdays Lecture room Trottier Building 2120 Instructor Paul Kry, [email protected] Course
 First Prev Next Last MayaVi: A Free Tool for 3D/2D Data Visualization Prabhu Ramachandran October, 25, 2002 Abstract MayaVi (http://mayavi.sf.net) is an easy to use tool for interactive 3D/2D data visualization
The Art Institute of Philadelphia Catalog Addendum GAME ART & DESIGN
 The Art Institute of Philadelphia Catalog Addendum GAME ART & DESIGN See AiPrograms.info for program duration, tuition, fees, and other costs, median debt, federal salary data, alumni success, and other
VisIVO, a VO-Enabled tool for Scientific Visualization and Data Analysis: Overview and Demo
 Claudio Gheller (CINECA), Marco Comparato (OACt), Ugo Becciani (OACt) VisIVO, a VO-Enabled tool for Scientific Visualization and Data Analysis: Overview and Demo VisIVO: Visualization Interface for the
VisCMD: Visualizing Cloud Modeling Data
 CPSC-533C Information Visualization Project Report VisCMD: Visualizing Cloud Modeling Data Quanzhen Geng (#63546014) and Jing Li (#90814013) Email: [email protected] [email protected] (Master of Software
Efficient Storage, Compression and Transmission
 Efficient Storage, Compression and Transmission of Complex 3D Models context & problem definition general framework & classification our new algorithm applications for digital documents Mesh Decimation
DATA VISUALIZATION. Lecture 1 Introduction. Lin Lu http://vr.sdu.edu.cn/~lulin/ [email protected]
 DATA VISUALIZATION Lecture 1 Introduction Lin Lu http://vr.sdu.edu.cn/~lulin/ [email protected] Visualization 可 视 化 Visualization now seen as key part of modern computing High performance computing generates
Zhenping Liu *, Yao Liang * Virginia Polytechnic Institute and State University. Xu Liang ** University of California, Berkeley
 P1.1 AN INTEGRATED DATA MANAGEMENT, RETRIEVAL AND VISUALIZATION SYSTEM FOR EARTH SCIENCE DATASETS Zhenping Liu *, Yao Liang * Virginia Polytechnic Institute and State University Xu Liang ** University
A Short Introduction to Computer Graphics
 A Short Introduction to Computer Graphics Frédo Durand MIT Laboratory for Computer Science 1 Introduction Chapter I: Basics Although computer graphics is a vast field that encompasses almost any graphical
Advanced visualization with VisNow platform Case study #2 3D scalar data visualization
 Advanced visualization with VisNow platform Case study #2 3D scalar data visualization This work is licensed under a Creative Commons Attribution- NonCommercial-NoDerivatives 4.0 International License.
MMGD0203 Multimedia Design MMGD0203 MULTIMEDIA DESIGN. Chapter 3 Graphics and Animations
 MMGD0203 MULTIMEDIA DESIGN Chapter 3 Graphics and Animations 1 Topics: Definition of Graphics Why use Graphics? Graphics Categories Graphics Qualities File Formats Types of Graphics Graphic File Size Introduction
Using Photorealistic RenderMan for High-Quality Direct Volume Rendering
 Using Photorealistic RenderMan for High-Quality Direct Volume Rendering Cyrus Jam [email protected] Mike Bailey [email protected] San Diego Supercomputer Center University of California San Diego Abstract With
Data, Measurements, Features
 Data, Measurements, Features Middle East Technical University Dep. of Computer Engineering 2009 compiled by V. Atalay What do you think of when someone says Data? We might abstract the idea that data are
Design and Deployment of Specialized Visualizations for Weather-Sensitive Electric Distribution Operations
 Fourth Symposium on Policy and Socio-Economic Research 4.1 Design and Deployment of Specialized Visualizations for Weather-Sensitive Electric Distribution Operations Lloyd A. Treinish IBM, Yorktown Heights,
MEng, BSc Applied Computer Science
 School of Computing FACULTY OF ENGINEERING MEng, BSc Applied Computer Science Year 1 COMP1212 Computer Processor Effective programming depends on understanding not only how to give a machine instructions
Bachelor of Games and Virtual Worlds (Programming) Subject and Course Summaries
 Subject and Course Summaries") First Semester Development 1A On completion of this subject students will be able to apply basic programming and problem solving skills in a 3 rd generation object-oriented programming language (such as
First Semester Development 1A On completion of this subject students will be able to apply basic programming and problem solving skills in a 3 rd generation object-oriented programming language (such as
GUI GRAPHICS AND USER INTERFACES. Welcome to GUI! Mechanics. Mihail Gaianu 26/02/2014 1
 Welcome to GUI! Mechanics 26/02/2014 1 Requirements Info If you don t know C++, you CAN take this class additional time investment required early on GUI Java to C++ transition tutorial on course website
James Ahrens, Berk Geveci, Charles Law. Technical Report
 LA-UR-03-1560 Approved for public release; distribution is unlimited. Title: ParaView: An End-User Tool for Large Data Visualization Author(s): James Ahrens, Berk Geveci, Charles Law Submitted to: Technical
Avizo AvizoFire - The 3D visualization Software for NDT & Materials Science
 Avizo AvizoFire - The 3D visualization Software for NDT & Materials Science Peter Westenberger Application Enginieer May 7, 2010 Avizo Visualize to Understand Avizo software is a powerful, multifaceted
Complete a table of values. Graph the values given in a table. Create an equation representing the information in a table or graph.
 Activity III: Surface Area of a Leaf (Grades 7-9) Objectives: Complete a table of values. Graph the values given in a table. Create an equation representing the information in a table or graph. NCTM Standards
Introduction to Paraview. H.D.Rajesh
 Introduction to Paraview H.D.Rajesh 1.Introduction 2.file formats 3.How to use Brief Overview Info: www.paraview.org http://www.paraview.org/wiki/paraview Open source,multi-platform application (Linux,
Master of Science in Computer Science
 Master of Science in Computer Science Background/Rationale The MSCS program aims to provide both breadth and depth of knowledge in the concepts and techniques related to the theory, design, implementation,
MEng, BSc Computer Science with Artificial Intelligence
 School of Computing FACULTY OF ENGINEERING MEng, BSc Computer Science with Artificial Intelligence Year 1 COMP1212 Computer Processor Effective programming depends on understanding not only how to give
Visualization and Feature Extraction, FLOW Spring School 2016 Prof. Dr. Tino Weinkauf. Flow Visualization. Image-Based Methods (integration-based)
") Visualization and Feature Extraction, FLOW Spring School 2016 Prof. Dr. Tino Weinkauf Flow Visualization Image-Based Methods (integration-based) Spot Noise (Jarke van Wijk, Siggraph 1991) Flow Visualization:
Visualization and Feature Extraction, FLOW Spring School 2016 Prof. Dr. Tino Weinkauf Flow Visualization Image-Based Methods (integration-based) Spot Noise (Jarke van Wijk, Siggraph 1991) Flow Visualization:
Steady Flow: Laminar and Turbulent in an S-Bend
 STAR-CCM+ User Guide 6663 Steady Flow: Laminar and Turbulent in an S-Bend This tutorial demonstrates the flow of an incompressible gas through an s-bend of constant diameter (2 cm), for both laminar and
Introduction to Information Visualization
 Universidade de Aveiro Departamento de Electrónica, Telecomunicações e Informática Introduction to Information Visualization www.portugal-migration.info Information Visualization Beatriz Sousa Santos,
TEXTURE AND BUMP MAPPING
 Department of Applied Mathematics and Computational Sciences University of Cantabria UC-CAGD Group COMPUTER-AIDED GEOMETRIC DESIGN AND COMPUTER GRAPHICS: TEXTURE AND BUMP MAPPING Andrés Iglesias e-mail:
Dhiren Bhatia Carnegie Mellon University
 Dhiren Bhatia Carnegie Mellon University University Course Evaluations available online Please Fill! December 4 : In-class final exam Held during class time All students expected to give final this date
An interactive 3D visualization system for displaying fieldmonitoring
 icccbe 2010 Nottingham University Press Proceedings of the International Conference on Computing in Civil and Building Engineering W Tizani (Editor) An interactive 3D visualization system for displaying
Exploratory Climate Data Visualization and Analysis
 Exploratory Climate Data Visualization and Analysis by Thomas Maxwell, Jerry Potter & Laura Carriere, NASA NCCS and the UVCDAT Development Consortium Scientific Visualization! We process, understand, and
The Scientific Data Mining Process
 Chapter 4 The Scientific Data Mining Process When I use a word, Humpty Dumpty said, in rather a scornful tone, it means just what I choose it to mean neither more nor less. Lewis Carroll [87, p. 214] In
OpenFOAM postprocessing and advanced running options
 OpenFOAM postprocessing and advanced running options Tommaso Lucchini Department of Energy Politecnico di Milano The post processing tool: parafoam The main post-processing tool provided with OpenFOAM
Doctor of Philosophy in Computer Science
 Doctor of Philosophy in Computer Science Background/Rationale The program aims to develop computer scientists who are armed with methods, tools and techniques from both theoretical and systems aspects
COMP175: Computer Graphics. Lecture 1 Introduction and Display Technologies
 COMP175: Computer Graphics Lecture 1 Introduction and Display Technologies Course mechanics Number: COMP 175-01, Fall 2009 Meetings: TR 1:30-2:45pm Instructor: Sara Su ([email protected]) TA: Matt Menke
VALLIAMMAI ENGNIEERING COLLEGE SRM Nagar, Kattankulathur 603203.
 VALLIAMMAI ENGNIEERING COLLEGE SRM Nagar, Kattankulathur 603203. DEPARTMENT OF COMPUTER SCIENCE AND ENGINEERING Year & Semester : III Year, V Semester Section : CSE - 1 & 2 Subject Code : CS6504 Subject
Facts about Visualization Pipelines, applicable to VisIt and ParaView
 Facts about Visualization Pipelines, applicable to VisIt and ParaView March 2013 Jean M. Favre, CSCS Agenda Visualization pipelines Motivation by examples VTK Data Streaming Visualization Pipelines: Introduction
DEGREE CURRICULUM COMPUTER GRAPHICS AND MULTIMEDIA Master's Degree in Informatics Enginneering
 Academic year 2015- DEGREE CURRICULUM COMPUTER GRAPHICS AND MULTIMEDIA Master's Degree in Informatics Enginneering Teaching staff: Francesc Sebé Feixas Subject's general information Subject name Typology
Avizo Inspect New software for industrial inspection and materials R&D
 Avizo Inspect New software for industrial inspection and materials R&D Reduce your design cycle, inspection times, and meet higher-level quality standards at a lower cost. Avizo Inspect software streamlines
Universidade de Aveiro Departamento de Electrónica, Telecomunicações e Informática. Introduction to Information Visualization
 Universidade de Aveiro Departamento de Electrónica, Telecomunicações e Informática Introduction to Information Visualization www.portugal-migration.info Information Visualization Beatriz Sousa Santos,
Prentice Hall Algebra 2 2011 Correlated to: Colorado P-12 Academic Standards for High School Mathematics, Adopted 12/2009
 Content Area: Mathematics Grade Level Expectations: High School Standard: Number Sense, Properties, and Operations Understand the structure and properties of our number system. At their most basic level
Image Processing and Computer Graphics. Rendering Pipeline. Matthias Teschner. Computer Science Department University of Freiburg
 Image Processing and Computer Graphics Rendering Pipeline Matthias Teschner Computer Science Department University of Freiburg Outline introduction rendering pipeline vertex processing primitive processing
Stage III courses COMPSCI 314
 Stage III courses To major in Computer Science, you have to take four Stage III COMPSCI courses, plus one other Stage III course chosen from the BSc Schedule. This may be another Stage III COMPSCI course.
VisIVO, an open source, interoperable visualization tool for the Virtual Observatory
 Claudio Gheller (CINECA) 1, Ugo Becciani (OACt) 2, Marco Comparato (OACt) 3 Alessandro Costa (OACt) 4 VisIVO, an open source, interoperable visualization tool for the Virtual Observatory 1: [email protected]
Improving Data Mining of Multi-dimension Objects Using a Hybrid Database and Visualization System
 Improving Data Mining of Multi-dimension Objects Using a Hybrid Database and Visualization System Yan Xia, Anthony Tung Shuen Ho School of Electrical and Electronic Engineering Nanyang Technological University,
Interactive Visualization of Magnetic Fields
 JOURNAL OF APPLIED COMPUTER SCIENCE Vol. 21 No. 1 (2013), pp. 107-117 Interactive Visualization of Magnetic Fields Piotr Napieralski 1, Krzysztof Guzek 1 1 Institute of Information Technology, Lodz University
Introduction to Flow Visualization
 Introduction to Flow Visualization This set of slides developed by Prof. Torsten Moeller, at Simon Fraser Univ and Professor Jian Huang, at University of Tennessee, Knoxville And some other presentation
Introduction of Information Visualization and Visual Analytics. Chapter 2. Introduction and Motivation
 Introduction of Information Visualization and Visual Analytics Chapter 2 Introduction and Motivation Overview! 2 Overview and Motivation! Information Visualization (InfoVis)! InfoVis Application Areas!
Technical Report. An Interactive Iso-Surface Based 3D Weather Radar Data Visualization Package Using VisAD for WDSSII
 Technical Report An Interactive Iso-Surface Based 3D Weather Radar Data Visualization Package Using VisAD for WDSSII (Jianting Zhang, Last Modified 2/5/2004) Abstract... 2 1 Introduction... 3 2 Overviews
Comp 410/510. Computer Graphics Spring 2016. Introduction to Graphics Systems
 Comp 410/510 Computer Graphics Spring 2016 Introduction to Graphics Systems Computer Graphics Computer graphics deals with all aspects of creating images with a computer Hardware (PC with graphics card)
INTRODUCTION TO RENDERING TECHNIQUES
 INTRODUCTION TO RENDERING TECHNIQUES 22 Mar. 212 Yanir Kleiman What is 3D Graphics? Why 3D? Draw one frame at a time Model only once X 24 frames per second Color / texture only once 15, frames for a feature
Data Analysis with MATLAB. 2013 The MathWorks, Inc. 1
 Data Analysis with MATLAB 2013 The MathWorks, Inc. 1 Agenda Introduction Data analysis with MATLAB and Excel Break Developing applications with MATLAB Solving larger problems Summary 2 Modeling the Solar