System: Portfolio Manager
|
|
|
- Cory Malone
- 10 years ago
- Views:
Transcription
1 EPA s Energy Performance Rating System: Portfolio Manager Kevin Dick Washoe County Air Quality Management Division and Business Environmental Program, UNR Western Sustainability and Pollution Prevention Conference October 28, 2010

2

3
4 Need for a Rating System for Buildings Is 80 kbtu/sf/yr high or low for a building? Statement of Energy Performance EPA Rating Fuel Efficiency MPG Is 60 MPG high or low for Is 60 MPG high or low for an automobile?

5 Portfolio Manager Helping You Track Your Performance Free online tool where you can: Benchmark the energy use of all of your buildings all will receive an energy use intensity (EUI) and some will receive ratings on a scale Track changes in energy use over time in single buildings, g,groups of buildings, g, or entire portfolios Track cost savings and CO 2 emissions Apply for ENERGY STAR recognition Track water usage

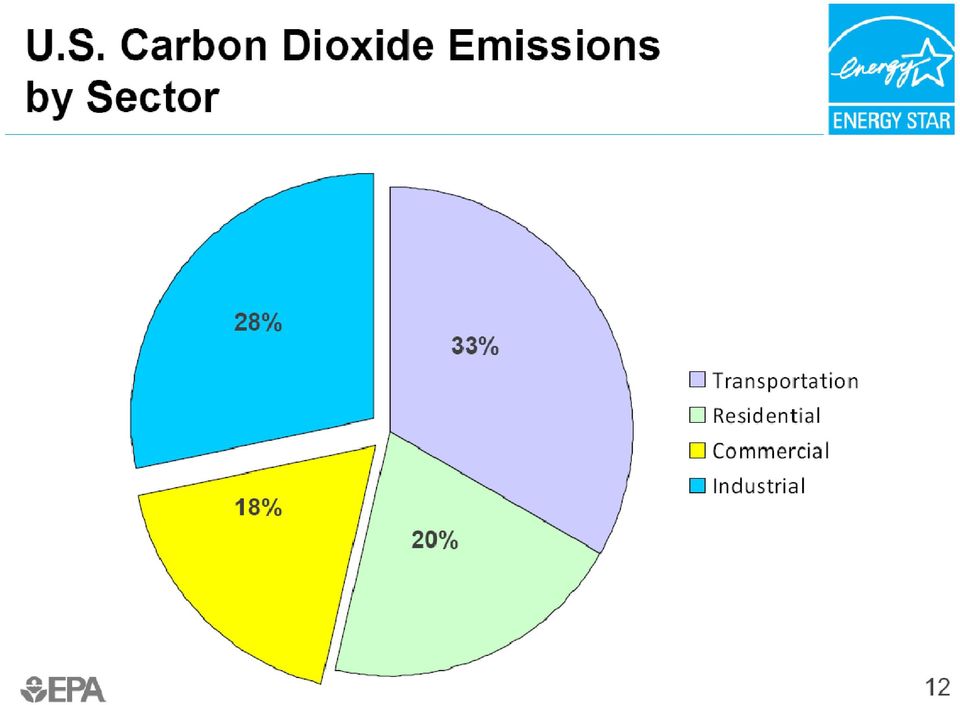
6 Energy and the Lodging Industry 5th largest commercial energy consumer Spend $7.5 billion per year on energy Utility costs rose 4.5% in 2007 Lighting, space conditioning, & water heating account for 75% of energy costs

7 Lodging Environmental Impact Annual energy consumption 69 billion kwh of electricity 208 billion cubic feet of natural gas Equivalent to 53 million metric tons of CO2 per year A 10% reduction in lodging industry energy consumption would be equivalent to Reducing CO2 emissions by 5.3 million metric tons Taking almost 1 million cars off the road for 1 year Offsetting the annual electricity consumption of more than 730,000 homes

8
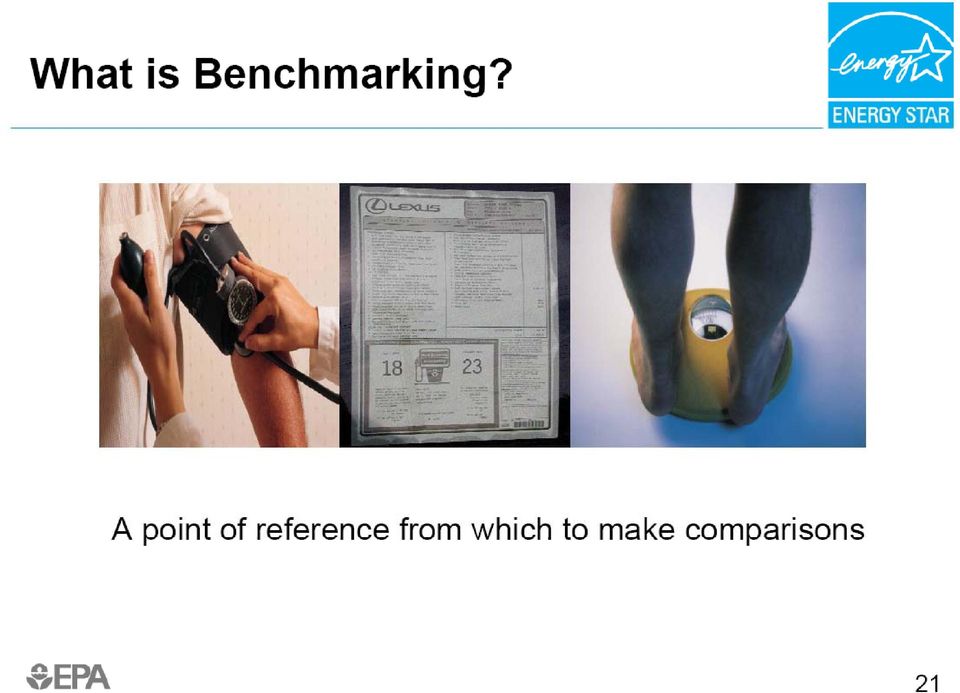
9 Benchmarking The First Step to Energy Savings in Buildings Benchmarking g through ENERGY STAR allows you to: Compare one building against a national sample of similar buildings Track changes in energy use over time in single buildings, groups of buildings, or entire portfolios Set priorities for use of limited staff time and/or investment capital

10 Energy Performance Gap Numbe er of Buildin ngs 39 percent of buildings with a rating of 75 or better are less than 25 years old 42 percent of buildings with a rating between 25 and 74 are less than 25 years old 35 percent of buildings with a rating between 0 and 24 are less than 25 years old Top performing buildings use 3 to 4 times less energy per ft 2 than the worst performers. Newer buildings are equally represented across all quartiles. Based on a sample of 4,000 buildings nationwide Best Performers EPA Performance Rating & Energy Intensity (kbtu/ft 2 -year) Worst Performers

11 Energy Star Label Buildings in the top 25 percent nationwide are eligible to earn for the ENERGY STAR, provided d they meet or exceed industry standards for comfort levels.

12

13 Before You Start Collect Required Information Building Identifiers Name, street address, zip code for weather normalization Energy Use Bldg specific invoice information from all purchased energy At least 11 consecutive months for each source Space Type Data Square footage, hours of operation, number of students, # of PC s,

14 Data Collection for Hotels

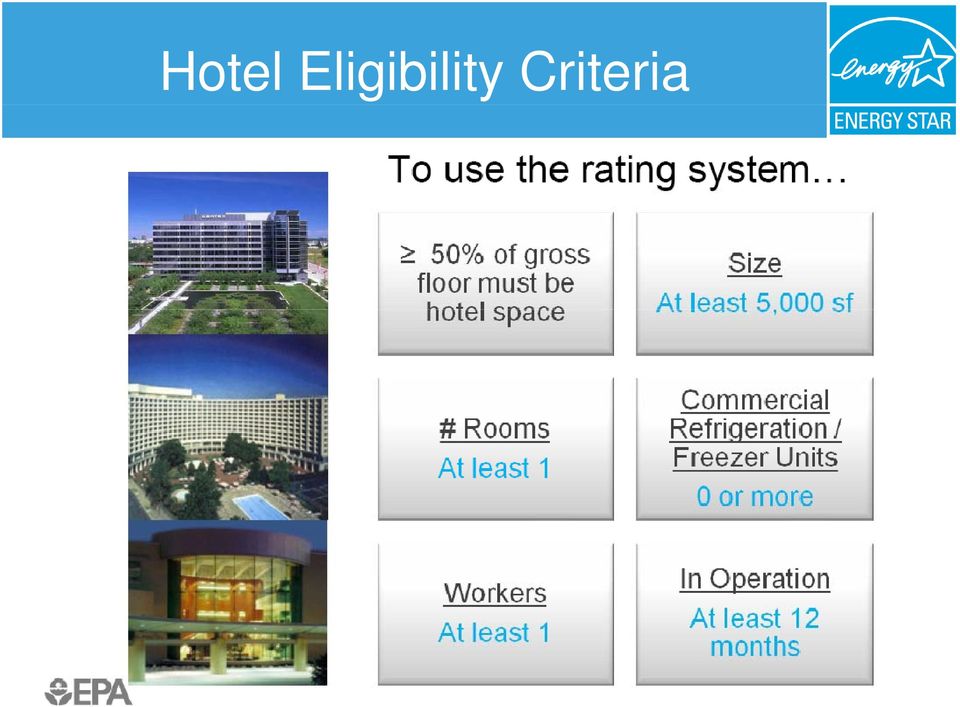
15 Hotel Eligibility Criteria
16

17

18 Find Portfolio Manager 1. Go to: 2. Click on: Buildings and Plants

19 Find Portfolio Manager 3. Click on: Portfolio Manager

20 Find Portfolio Manager 3. Click on: Portfolio Manager

21 Portfolio Manager Log-in Page My Portfolio Page Layout Portfolio Average Rating Portfolio Adjusted Percent Energy Reduction Views Add Facility Facility Summary Page Facility Performance Space Use Energy Meters Water Meters Energy Meters Add Meter Entries Start Date, End Date, kwh, Cost
22 Portfolio Manager Features Master account feature View (and Reporting) Options Statement of Energy Performance Percent energy reduction Water tracking Automated benchmarking Multi-Facility Meter Update
23 Tracking Campaigns: Master Accounts Objective: Allows colleges and universities to track progress of campaigns, for example: University systems can track individual campuses Energy saving competitions among residence halls or other buildings Process: Institution creates a Master Account Master Account appears in a public registry Individual users can share facilities with Master Account Master Account holder can view progress for all facilities that t have been shared
24 View (and Reporting) Options The My Portfolio page uses views to display summarized data A view is a set of columns that display various data in a table Portfolio Manager provides the ability for a user to create their own view by selecting the columns (up to seven at a time) to display on the My Portfolio page It also enables the user to select the number of facilities that can display on the My Portfolio page (e.g., 25, 50). There are over 30 different data columns that can be selected Any view can be set as the default view and these views can be downloaded into a Microsoft Excel spreadsheet for further analysis
25 Statement of Energy Performance Objective: The SEP can be generated for purposes other than applying for the ENERGY STAR Label LEED-EB certification process Real estate t transactions ti Maintaining a Facility Summary Report Process: User selects time period of performance Tool generates 1 page summary with energy use, cost, and emissions figures Summary also included d as second page when full SEP is generated to apply for the ENERGY STAR
26 Percent Energy Reduction Objective: Provide a metric to show a percent change in energy use over time Creates tracking capability for all space types Process: For non-ratable spaces the tool compares weather normalized source energy use between two periods and adjusts for any changes in square footage For ENERGY STAR ratable space types, the tool compares energy use between two periods adjusting for changes in weather and business activity
27 Water Tracking Objective: Allow users to track water use in Portfolio Manager Continued emphasis on tracking all utilities Lay groundwork for understanding the relationships between water and energy use Process: User can select Add Water Meter for any facility User can identify water meters as indoor, outdoor, or wastewater Tool displays water use totals for any 12 month period User can compare two different periods and track over time Upcoming Enhancement: percent change between two time periods will be displayed
28 Automated Benchmarking Allows utilities and energy info service providers to: Securely exchange building and utility data with the EPA ENERGY STAR program Leverage the ENERGY STAR rating within their own systems Reduce the burden on energy end users of benchmarking their energy performance
29 Portfolio Manager Demo
Tools for Energy Tracking and Benchmarking. ENERGY STAR Portfolio Manager for Congregations
 Tools for Energy Tracking and Benchmarking ENERGY STAR Portfolio Manager for Congregations Steve Bell (Contractor) Energy and Security Group LLC ENERGY STAR Congregations Why Does Green Start With Energy?
ENERGY STAR Portfolio Manager Data Collection Worksheet
 ENERGY STAR Portfolio Manager Data Collection Worksheet This worksheet was designed to help building owners and managers collect data to benchmark buildings using EPA ENERGY STAR s Portfolio Manager. The
ENERGY STAR for Data Centers
 ENERGY STAR for Data Centers Alexandra Sullivan US EPA, ENERGY STAR February 4, 2010 Agenda ENERGY STAR Buildings Overview Energy Performance Ratings Portfolio Manager Data Center Initiative Objective
ENERGY STAR Portfolio Manager Data Collection Worksheet
 ENERGY STAR Portfolio Manager Data Collection Worksheet This worksheet was designed to help building owners and managers collect data to benchmark buildings using EPA s ENERGY STAR Portfolio Manager. The
Using ENERGY STAR Portfolio Manager
 Using ENERGY STAR Portfolio Manager A Workshop for Energy Services Providers Manage Energy Use and Help Your Clients Meet Building Energy Reporting Requirements in Boston and Cambridge U.S.EPA ENERGY STAR
PORTFOLIO MANAGER SOFTWARE Step-by-Step Instructions for Energy Consumption Tracking
 PORTFOLIO MANAGER SOFTWARE Step-by-Step Instructions for Energy Consumption Tracking Step 1: Collect Background Information and Utility Bills for your Building: - See Table at end of this document for
Energy Benchmarking Report for Lafayette Elementary School Bound Brook, NJ
 Energy Benchmarking Report for Lafayette Elementary School Bound Brook, NJ (for the period: March 2007 through February 2009) Prepared by: Background & Findings The New Jersey Clean Energy Program (NJCEP)
Using esight to Drive Down Costs. Janie Jefferies-Freer President [email protected] 847-701-2340
 Using esight to Drive Down Costs Janie Jefferies-Freer President [email protected] 847-701-2340 esight Energy esight Energy is the developer of esight - the most sophisticated energy management suite
Energy Benchmarking Report for Lakeside Middle School. Millville, NJ
 Energy Benchmarking Report for Lakeside Middle School Millville, NJ (for the period: June 1, 2008 through May 31, 2009) Prepared by: Background & Findings: The New Jersey Clean Energy Program (NJCEP) developed
Energy Benchmarking City of New Westminster: Corporate Facilities
 UBC Sustainability Scholar Project Report Energy Benchmarking City of New Westminster: Corporate Facilities August 2015 Priyanka R. Chakrabarti UBC Sustainability Scholar 2015 1 Executive Summary Introduction
Energy Performance Benchmarking Report For:
 Energy Performance Benchmarking Report For: Example NJ Office Building 100 Efficient Way Secaucus, New Jersey 07094 Prepared by: TRC Energy Services, NJCEP C&I Marketing Manager Report Generated May 20,
Integrated Tools for Multifamily Green Asset Management. Energy Upgrade CA Web Portal Funding Finder Compass Portfolio Tracker Webinar May 22, 2012
 Integrated Tools for Multifamily Green Asset Management Energy Upgrade CA Web Portal Funding Finder Compass Portfolio Tracker Webinar May 22, 2012 Webinar Agenda 2 Introductions Energy Upgrade California
Metropolitan Boston Health Care Energy Profile for 2011-2013
 Boston Green Ribbon Commission Health Care Working Group Coordinated by Health Care Without Harm Analytics by Metropolitan Boston Health Care Energy Profile for 2011-2013 December 11, 2014 This report
How to Benchmark Your Building. Instructions for Using ENERGY STAR Portfolio Manager and Southern California Gas Company s Web Services
 How to Benchmark Your Building Instructions for Using ENERGY STAR Portfolio Manager and Southern California Gas Company s Web Services This document is a quick-start guide for entering your property into
Bill Younger, Manager Business Energy Management Puget Sound Energy Bellevue, Washington
 Bill Younger, Manager Business Energy Management Puget Sound Energy Bellevue, Washington Multifunction Portals for Commercial and Industrial Customers Customer Needs Energy Information Pipeline Customer
Emissions Inventory, Fiscal Year 2013. Siemens Building Technologies Division, U.S. usa.siemens.com/buildingtechnologies
 usa.siemens.com/buildingtechnologies Emissions Inventory, Fiscal Year 2013 Siemens Building Technologies Division, U.S. Answers for infrastructure and cities. Executive Summary The Building Technologies
Energy Efficiency Operations & Maintenance Plan August 25, 2010
 Energy Efficiency Operations & Maintenance Plan August 25, 2010 Table of Contents Introduction... 3 Repair, Maintain and Operate Existing Equipment Efficiently... 3 Citywide Requirements Contract... 4
Uncovering Hidden Savings: Audits and Assessments. Presented by: Brian Dattellas, CEM TRC Kathryn Zilka, CEM LEED AP TRC
 Uncovering Hidden Savings: Audits and Assessments Presented by: Brian Dattellas, CEM TRC Kathryn Zilka, CEM LEED AP TRC Audits and Assessments 1. The Drivers 2. Commercial Building Anatomy 3. Energy Benchmarking
Energy Usage Data System
 Energy Usage Data System Kevin Bricknell Energy Data Services Program Manager Minnesota Public Utilities Commission Data Privacy Solutions Workshop February 13, 2015 ComEd: 3.8 Million Electric Customers
ASSET & FACILITIES MANAGEMENT CORPORATE ENERGY EFFICIENCY POLICY
 ASSET & FACILITIES MANAGEMENT CORPORATE ENERGY EFFICIENCY POLICY Paul Stokes Kevin Munford Asset & Facilities Manager Energy Officer 01/03/2006 THE COUNCIL S ENERGY POLICY FOR PUBLIC BUILDINGS AND TRANSPORT
Summary: Apollo Group Greenhouse Gas Inventory (Worldwide)
") Summary: Apollo Group Greenhouse Gas Inventory (Worldwide) Table of Contents Overview... 1 Boundaries... 1 Scopes... 1 Estimated Components... 1 Calculation Methodologies and Assumptions... 2 Tables...
Summary: Apollo Group Greenhouse Gas Inventory (Worldwide) Table of Contents Overview... 1 Boundaries... 1 Scopes... 1 Estimated Components... 1 Calculation Methodologies and Assumptions... 2 Tables...
Operating Sustainable Facilities
 Operating Sustainable Facilities Introduction... 1 Chapter 1: Energy Topic 1: Energy and Sustainable Facilities... 8 Topic 2: Energy Metrics... 11 Topic 3: Sustainable Facility Energy Initiatives... 20
Building Energy Efficiency Opportunity Report
 Building Energy Efficiency Opportunity Report September 2013 Building Energy Efficiency Opportunity Report TABLE OF CONTENTS Introduction 3 Building Efficiency Opportunities 4 #1: High Potential Buildings
Texas School District Energy Management: The Status of Energy Management in Texas Schools
 2014 Texas School District Energy Management: The Status of Energy Management in Texas Schools Texas School District Energy Management Study: The Status of Energy Management in Texas Schools Prepared by
Pilot Program Description: Building EMIS
 Pilot Program Description: Introduction Over time building systems do not operate as efficiently as they once did, using more energy than they should in order to satisfy occupant comfort and lighting requirements.
Identify Ways to Save with Energy Audits
 Identify Ways to Save with Energy Audits Kristine Chalifoux Director of Management and Operations, SEDAC Mary Bentsen Education & Training Coordinator, SAIC, an Ameren Illinois ActOnEnergy partner Kristine
Energy Efficiency Programs in K-12 Schools
 LOCAL GOVERNMENT CLIMATE AND ENERGY STRATEGY SERIES Energy Efficiency Programs in K-12 Schools A Guide to Developing and Implementing Greenhouse Gas Reduction Programs Energy Efficiency U.S. ENVIRONMENTAL
ENERGY AUDITS (OR SURVEYS) & ENERGY MANAGEMENT PROGRAMS SECTION B
 & ENERGY MANAGEMENT PROGRAMS SECTION B") ENERGY AUDITS (OR SURVEYS) & ENERGY MANAGEMENT PROGRAMS SECTION B GOALS OF THE ENERGY AUDIT Clearly identify types and costs of energy use Understand how energy is being used--and possibly wasted Identify
ENERGY AUDITS (OR SURVEYS) & ENERGY MANAGEMENT PROGRAMS SECTION B GOALS OF THE ENERGY AUDIT Clearly identify types and costs of energy use Understand how energy is being used--and possibly wasted Identify
By: Crystal Warren IMPLEMENTATION OF SOLAR PANELS ON COMMERCIAL PROPERTIES AND THE COST-BASED INCENTIVES
 By: Crystal Warren IMPLEMENTATION OF SOLAR PANELS ON COMMERCIAL PROPERTIES AND THE COST-BASED INCENTIVES MY PLAN Encourage commercial property/business owners to install solar panels to reduce the amount
Understanding Energy Bills
 Understanding Energy Bills Energy bills are notoriously difficult to understand. YouGov research on behalf of uswitch found 75% of people find energy bills confusing, and only 4 in 10 could understand
Getting Started with Web Service Tools for Whole Building Analysis
 Autodesk Ecotect Analysis 2010 Getting Started with Web Service Tools for Whole Building Analysis Customers who add subscription to their Autodesk Ecotect Analysis license can access 1 whole building energy,
Section 1 Bills Bills Bills All copies of bills and information obtained from company websites
 Page 1 of 8 Section 1 Bills Bills Bills All copies of bills and information obtained from company websites Nevada Power Bill: Your power bill is based on your usage, in KWH (kilowatt hours). Your electric
Section 2: Estimating Energy Savings and Incentives
 Section 2: Estimating Energy Savings and Incentives 2.1 Estimating Energy Savings and Incentives... 2 2.2 Customized Measures - Estimation Software... 2 2.2.1 AC&R I - High Efficiency Chiller... 3 2.2.2
THE BENEFITS OF PC POWER MANAGEMENT (PPM) SOLUTIONS
 SOLUTIONS") THE BENEFITS OF PC POWER MANAGEMENT (PPM) SOLUTIONS PC Power Management Made Simple Updated January 2012 Why Green IT Isn t Enough If You Want to Cut Energy Costs PC Power Management (PPM) Saves Energy
THE BENEFITS OF PC POWER MANAGEMENT (PPM) SOLUTIONS PC Power Management Made Simple Updated January 2012 Why Green IT Isn t Enough If You Want to Cut Energy Costs PC Power Management (PPM) Saves Energy
Prudential plc. Basis of Reporting: GHG emissions data and other environmental metrics.
 Prudential plc. Basis of Reporting: GHG emissions data and other environmental metrics. This Basis of Reporting document supports the preparation and reporting of GHG emissions data and other environmental
User Guide. The Business Energy Dashboard
 User Guide The Business Energy Dashboard 1 More Ways to Understand and Control Your Energy Use At FPL, we re investing in smart grid technologies as part of our commitment to building a smarter, more reliable
Energy Audits. Good energy management begins with an energy audit
 Energy Audits Good energy management begins with an energy audit Effective management of energy-consuming systems can lead to significant cost and energy savings as well as increased comfort, lower maintenance
Commercial Energy Use Worksheet
 Commercial Energy Use Worksheet Did you know? The City of Austin requires all commercial buildings that are 10,000 square feet or greater in size located within its city limits and served electricity by
Product Catalog. Trane eview Energy Reporting Software BAS-PRC054-EN. November 2010
 Product Catalog Trane eview Energy Reporting Software November 2010 BAS-PRC054-EN Copyright 2010 Trane This document and the information in it are the property of Trane and may not be used or reproduced
Transforming America s Energy Future. Kentucky. Energy Statistics. Developed by
 Transforming America s Energy Future Kentucky Energy Statistics Developed by 2 2 Summary The first edition of Kentucky Energy Statistics is offered by the National Association for State Energy Officials
Metro Washington, D.C., Greenprint Performance Report VOLUME 1, 2012: PUBLISHED SPRING 2014
 1, Greenprint Performance Report VOLUME 1, 2012: PUBLISHED SPRING 2014 1. 2 About the DowntownDC Business Improvement District The Downtown Business Improvement District (DowntownDC) is a private, nonprofit
Southern California Edison s
 Welcome to Southern California Edison s Energy Efficiency Programs 1 Energy Efficiency #1 Resource The California Energy Action Plan of 2005 establishes energy efficiency as the state s top priority procurement
Energy math.notebook February 26, 2015. Energy Practice Problems for APES. ***last weeks math problems
 Energy Practice Problems for APES ***last weeks math problems 1. The conventional gas powered 2004 Honda Civic is one of the best gas powered cars in its class for mileage. The conventional Honda Civic
Understanding Your Bill
 To make your bill easier to understand, simply take a look at the example bill below and refer to the list of terms on Page. 6 7 8 9 . Reference: This is your reference number. You will need to provide
2030 Districts Performance Metrics Toolkit
 Portfolio Reporting Guide Portfolio Report Tutorial The following guide accompanies the Portfolio Report Template, and is intended to assist with the initial population of the spreadsheet and the production
How to Sell Energy Efficiency
 How to Sell Energy Efficiency PRESENTED BY SCOTT JASINSKI THE SMART ENERGY DESIGN ASSISTANCE CENTER (SEDAC) OF THE UNIVERSITY OF ILLINOIS ChicaGO Green 2011 Conference How To Sell Energy Efficiency: I.
Mechanical Insulation. Hospitals and Schools
 Study on Mechanical Insulation in Hospitals and Schools March 1, 2011 Study Mechanical Insulation in Hospitals and Schools G. Christopher P. Crall, P.E. Ronald L. King Executive Summary Mechanical insulation
User Guide. The Business Energy Dashboard
 User Guide The Business Energy Dashboard 1 More Ways to Understand and Control Your Energy Use At FPL, we re investing in smart grid technologies as part of our commitment to building a smarter, more reliable
Residential & Commercial Sectors Overview CLIMATE
 CLIMATE TECHBOOK Residential and Commercial Emissions in the United States Greenhouse gas (GHG) emissions data can be reported either by economic sector, which includes electric power generation as a separate
New Fuel Economy and Environment Labels for a New Generation of Vehicles
 New Fuel Economy and Environment Labels for a New Generation of Vehicles Why New Label Designs? The U.S. Department of Transportation joined with EPA today in unveiling new fuel economy and environment
Greater Los Angeles County Region
 Attachment 6 Greater Los Angeles County Region IRWM Implementation Grant Proposal Monitoring, Assessment, and Attachment 6 consists of the following items: Monitoring, Assessment, and. The purpose of this
ENERGY STAR OVERVIEW OF 2005 ACHIEVEMENTS
 ENERGY STAR OVERVIEW OF 2005 ACHIEVEMENTS HOME PERFORMANCE WITH ENERGY STAR A COST-EFFECTIVE STRATEGY FOR IMPROVING EFFICIENCY IN EXISTING HOMES BRINGING ENERGY EFFICIENCY TO HOMES AND BUSINESS State Energy
Enterprise Energy Management Technical Session
 Enterprise Energy Management Technical Session Presented By: Leighton Wolffe Peter Kelly-Detwiler Enterprise Energy Management o What is EEM? o How do we define it? o How can we all agree on the definition?
ENERGY STAR Data Verification Checklist
 ENERGY STAR Data Verification Checklist 86 ENERGY STAR Score 1 Sample Property Primary Function: Office Gross Floor Area (ft²): 200,000 Built: 1980 For Year Ending: 04/30/2013 Date Generated: 06/28/2013
: US Letter. PSA Suite Basic for CRM 2013. Invoicing 7.1: Single project invoicing
 7.1 SINGLE PROJECT INVOICING PSA 2013 Report Solution for CRM 2013 : US Letter PSA Suite Basic for CRM 2013 Invoicing 7.1: Single project invoicing Table Of Contents INTRODUCTION... 2 SYSTEM REQUIREMENTS...
Optimising building HVAC services through control
 Optimising building HVAC services through control AIRAH Divisional Meeting September 2014 Chris Flanagan AIRAH Committee President What s keeping you up at night? Owner-occupied Occupant complaints and
Federal Metering Data Analysis Needs and Existing Tools
 PNNL-24191 Federal Metering Data Analysis Needs and Existing Tools July 2015 JW Henderson KM Fowler PNNL-24191 Federal Metering Data Analysis Needs and Existing Tools JW Henderson KM Fowler July 2015
Energy Efficiency: Integrated Design and HVAC Systems HEALTHCARE - TOP 5 GREEN BUILDING STRATEGIES
 EPA Publication 909-F-07-001 What? Energy use in healthcare facilities is higher than nearly all other building types. With rising energy costs and climate change concerns energy efficiency is financially
1. GETTING STARTED... 5 1.1 Basic Application Navigation... 6 2. Home Overview... 9 2.1 Dashboard Widgets... 10 2.2 User Preferences... 15 3.
 1. GETTING STARTED......................................................................................... 5 1.1 Basic Application Navigation...............................................................................
Mayor s Office of Sustainability. City of Philadelphia Energy Benchmarking Report
 Mayor s Office of Sustainability DECEMBER 2014 City of Philadelphia Energy Benchmarking Report 2014 CiTy of PhiladelPhia EnERgy BEnchmaRking REpoRt Table of Contents executive Summary...3 Background and