Full year 2014 results presentation (January December)
|
|
|
- Percival Griffin
- 8 years ago
- Views:
Transcription
1 Full year 2014 results presentation (January December) Madrid, February 26 th 2015

2 Millions FY14 FY13 Var. +1.7pp Total net revenues 932,1 826,8 12,7% Total operating costs 768,2 739,6 3,9% EBITDA adj* 163,9 87,2 87,9% EBITDA margin 17,6% 10,5% EBIT 144,8 70,2 106,3% EBIT margin 15,5% 8,5% -1.1pp PayTV Others NET PROFIT 59,5 4,2 EPS adjusted ** 0,162 0,010 44,2% 41,5% Net cash position 265,7 93,5 172,2 +0.5pp -1.1pp * EBITDA Adj, includes TV rights consumption ** Adjusted excluding the treasury stocks owned at December 31 st 6,8% 3,1% PayTV Source: Kantar media and Infoadex 4,4% Others 2

3

4 * Vs ,0 +0,7 +0,6 +0,4 0,0 +0,3 +1,7 Source: Kantar media * Includes 0,6 points of audience generated by the two channels closed on May 6 th (La Siete and Nueve) 4

5 PayTV Others Source: Kantar media +1,7-0,7 Vs ,0 +0,6-0,5-1,1 5

6 Antena3 La1 Antena3 La1 Vs ,0 +0,2-0,2 Antena3 Source: Kantar media La1 6

7 Vs. 2014* +0,9 +1,2 +0,7 +0,7 +0,1 +0,3 +2,4 Source: Kantar media * Average audience January 1 st - February 24 th 7

8 Vs. 2014* Antena3 +0,9-0,5 La1 0,0 15,4 Vs. 2014* PayTV Others +2,4-3,3 0,0-0,5 +0,8 +0,6 15,0 14,8 13,5 13,3 Antena3 11,5 Source: Kantar media * Average audience January 1 st - February 24 th January 1-6 January 7-31 February

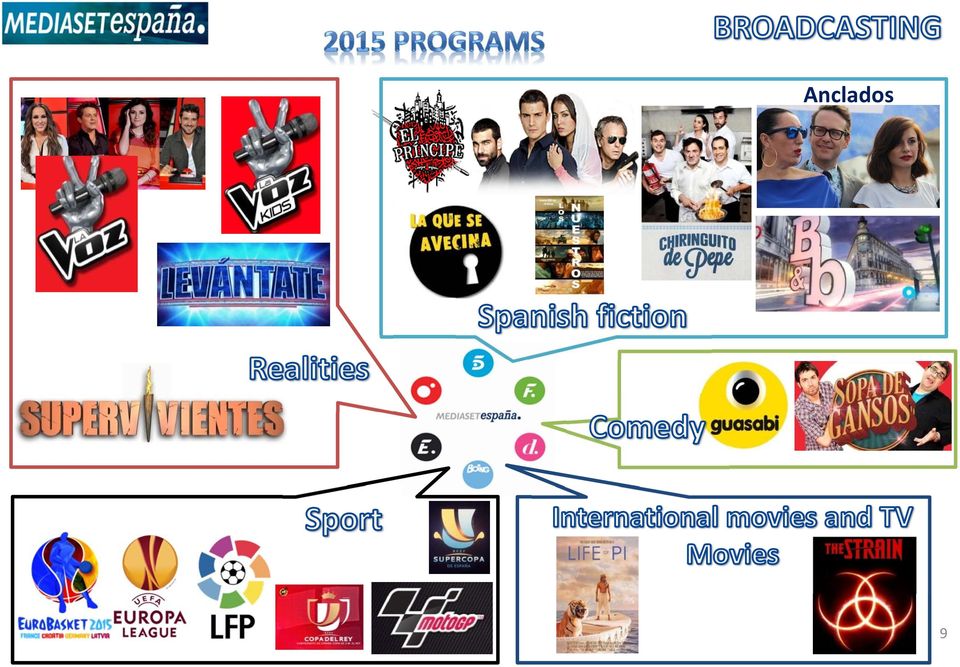
9 Anclados 9
10 1 Ocho apellidos vascos 56,0m 2 El Niño 16,1m 3 Torrente 5: Misión Eurovegas 10,7m 4 Exodus: Dioses y Reyes 7,9m 5 La Isla Mínima 6,1m 6 Mortadelo y Filemón contra Jimmy el 4,5m Cachondo 7 Relatos salvajes 4,4m 8 Pancho, el Perro Millonario 2,5m 9 Perdona si te llamo amor 2,0m 10 Carmina y Amen 1,9m Cien Años de Perdón Source: Rentrak *Data: boxoffice of the year

11 Unique browsers (mill.) Video streamed (mill.) 216,8 +57% January August December % January August December Apps download (mill.) Social network fans 7,7 +143% 25,3 +40% January April August December January April August December Source: OJD, Comscore 11
 Social network fans 7,7 +143% 25,3 +40% January April August")
12

13 Cinema Outdoor Millions Internet Radio Television +6,4% Press/ Magazines +11,0% Internet Television Source: Infoadex Radio Outdoor Cinema Press / Magazines Total MKT evolution: +271,9m Millions 13

14 2.377, , , , , ,4-23% +4% -9% -19% -6% +11% FY09 FY10 FY11 FY12 FY13 FY14 Source: Infoadex 14

15 767,1 22,1 +10,9% 850,9 14,9 +0.5pp 745,0 836,0-1.1pp Millions FY13 TV (est. Infoadex) FY14 Others Others Audience Var % Seconds GRP (20 ) C/GRP s FY14 30,7% +5,9% -1,9% +8,1% +4,2% 4Q14 31,0% +6,1% -5,1% +6,8% +5,4% Source: Infoadex, Kantar media and Publiespaña 15

16 Finance Automotive Retail Telecoms Others Finance Retail Food Others Automotive Food Health & Beauty Telecoms Health & Beauty TV MKT evolution: +11,0% Source: Infoadex 16

17

18 Millions FY14 FY13 VAR % Net advertising revenues 855,7 766,6 11,6% Other revenues 76,4 60,3 26,8% Total net revenues 932,1 826,8 12,7% +87,9% 17,6% Total operating costs 768,2 739,6 3,9% Personnel 106,2 104,9 1,3% TV rights amortisation 199,2 173,9 14,5% Other operating costs 462,8 460,8 0,4% EBITDA adj (1) 163,9 87,2 87,9% PPA Amortisations 8,0 8,0 0,0% Amortisations & depreciations 11,1 9,0 23,2% EBIT 144,8 70,2 106,3% Pre-Tax profit 85,5-2,3 Net profit reported 59,5 4,2 EPS* 0,162 0,010 EBITDA adj/ Total net revenues 17,6% 10,5% +7,1pp EBIT/ Total net revenues 15,5% 8,5% +7,0pp NET PROFIT Reported/ Total net revenues 6,4% 0,5% +5,9pp 10,5% * EBITDA adj./total net revenues +106,3% 15,5% 8,5% (1) Recurring EBITDA Adj, includes TV rights consumption * Adjusted excluding the treasury stocks owned at December 31 st * EBIT/Total net revenues 18

19 Millions FY14 Tax-credit FY14 ex oneoff impact DTS reported adjustment Total net revenues 932,1 932,1 Total operating costs 768,2 768,2 EBITDA adj* 163,9 163,9 EBIT 144,8 144,8 Equity consolidated results -59,2 60,0 0,8 Financial results 0,0 0,0 EBT 85,5 60,0 145,5 Income taxes -30,0-18,0 14,1-33,9 Minority interest 3,9-3,5 0,4 NET PROFIT 59,5 42,0 10,6 112,1 EPS Adjusted** 0,162 0,305 NET PROFIT/NET REVENUES 6,4% 12,0% 112,1 59,5 12,0% 6,4% * EBITDA Adj, includes TV rights consumption ** adjusted excluding the treasury stocks owned at December 31 st FY14 reported FY14 ex one-off 19

20 Millions 4Q14 4Q13 VAR % Total net revenues 273,9 242,9 12,8% Total recurring costs 206,9 213,3-3,0% Personnel 25,8 27,2-5,1% TV Rights Amortisation 54,7 65,0-15,8% Other Operating Costs 126,4 121,1 4,3% EBITDA adj (1) 67,1 29,6 126,4% PPA Amortizations 2,0 2,0 0,0% Amortizations & Depreciations 4,5 2,8 57,8% EBIT 60,6 24,8 144,5% 24,8 10,2% +144,5% 60,6 22,1% 4T13 4T14 * EBIT/Total net revenues Pre-Tax Profit 60,6-32,7 Net Profit Reported 34,3-18,0 EPS* 0,093-0,045 EBITDA adj/ Total net revenues 24,5% 12,2% +12,3pp EBIT/ Total net revenues 22,1% 10,2% +11,9pp NET PROFIT Reported/ Total net revenues 12,5% -7,4% +19,9pp 34,3 12,5% 44,9 16,4% 4Q14 reported 4Q14 ex one-off (1) Recurring EBITDA Adj, includes TV rights consumption * Adjusted excluding the treasury stocks owned at December 31 st 20
 Recurring EBITDA Adj, includes TV rights consumption * Adjusted excluding the treasury stocks owned at December 31")
21 Millions 65,4 41,4 60,6 48,6 +126,4% 67,1 24,5% 24,3 29,6 26,5% 18,5% 18,9% 17,5% 9,5% 12,2% 4Q08 4Q09 4Q10 PF 4Q11 4Q12 4Q13 4Q14 * Recurring EBITDA adj./total net revenues 21
22 88,3% Millions Diff. in FY14 FY13 million Initial cash position 93,5 73,7 19,7 Free cash flow 144,7 10,9 133,7 12,5% 144,7 163,9 Cash flow from operations 356,6 252,5 104,1 Net investments -203,3-185,7-17,6 Change in net working capital -8,6-55,8 47,2 Change in equity 9,9 6,6 3,4 Financial Investments 15,7-0,6 16,3 Dividends received 1,9 2,8-0,9 Dividend payments 0,0 0,0 0,0 Total net cash flow 172,2 19,8 152,5 Final net cash position 265,7 93,5 172,2 Free cash flow/ebit 99,9% 15,6% 87,2 10,9 FY13 FCF FY14 EBITDA adj +293,7m Millions 22
23 Millions FY14 FY 2013 Fixed assets 569,6 962,9 -Financial 303,6 686,8 -Non financial 265,9 276,1 Audiovisual rights and pre-payments 228,6 235,5 -TV, third party rights 182,5 183,3 -TV, Spanish fiction rights 25,7 35,1 -Co-production / distribution 20,4 17,1 Tax credit 164,8 186,3 TOTAL NON-CURRENT ASSETS 963, ,7 Current assets 246,4 236,4 Financial investments and cash 277,1 113,5 TOTAL CURRENT ASSETS 523,5 349,9 TOTAL ASSETS 1.486, ,6 SHAREHOLDERS' EQUITY 1.189, ,4 Non-current provisions 9,7 10,4 Non-current payables 10,4 10,1 Non-current financial liabilities 11,2 0,0 TOTAL NON-CURRENT LIABILITIES 31,3 20,5 Current payables 265,5 262,7 Current financial liabilities 0,2 20,1 TOTAL CURRENT LIABILITIES 265,8 282,8 TOTAL LIABILITIES 1.486, ,6 523,5 Current assets Financial inv. & cash CURRENT ASSETS 265,8 Current payables Financial liabilities CURRENT LIABILITIES 23
24 **Pro-forma consolidated P&L accounts under IFRS of Telecinco s Group and Sogecuatro s Group Source: Kantar media (24h total individual audience share) and Infoadex Millions 24
25 47,6 Dividend* 0,13 per share (excluding the treasury stock) 80% pay-out Returning to the usual dividend policy Up to 500 Buyback plan Launched on July 2014 Partially executed Cancelation of 10% treasury stock in the next AGM execution July 24 th 2014: acquisition of 8,5% for 307,51m YTD** 2015: acquisition of 0,28% for 12,67m Total buyback amount executed: 320,28m * Dividend proposed by the Board of Directors to the approval of the Shareholder s meeting ** information as of February 20 th 2015 as communicated to the CNMV Millions 25
26 Leader in audience share Our group of channels has achieved a new audience record for a commercial TV group amplifying the gap with the competitors Leader in advertising market share Increasing share and enhancing the gap with the competitors Leader in profitability Best FY EBITDA since 2011 Leader in internet and social network impacts Use of cash 26
27
28 Millions FY14 FY13 Var % Gross Advertising Revenues 889,2 802,2 10,8% - Mediaset España's medias 850,9 767,1 10,9% - Third party's medias 38,3 35,2 8,7% Discounts -33,5-35,7-6,1% Net Advertising revenues 855,7 766,6 11,6% Other Revenues 76,4 60,3 26,8% TOTAL NET REVENUES 932,1 826,8 12,7% +87,9% 17,6%* Personnel 106,2 104,9 1,3% TV Rights amortisation 199,2 173,9 14,5% Other operating costs 462,8 460,8 0,4% Total operating costs (1) 768,2 739,6 3,9% EBITDA adj* 163,9 87,2 87,9% EBITDA adj*/net REVENUES 17,6% 10,5% 10,5%* * EBITDA adj./total net revenues * EBITDA Adj, includes TV rights consumption 28
29 Millions FY14 FY13 Var % EBITDA adj* 163,9 87,2 87,9% PPA amortisation (2) 8,0 8,0 0,0% Depreciation tangible assets & provisions (3) 11,1 9,0 23,2% Total Costs (1+2+3) 787,3 756,6 4,1% EBIT 144,8 70,2 106,3% EBIT/NET REVENUES 15,5% 8,5% Equity consolidated results -59,2-69,2 14,4% Financial results 0,0-3,3 99,6% EBT 85,5-2,3 Income taxes -30,0 6,2 Minority interest 3,9 0,3 8,5%* +106,3% 15,5%* NET PROFIT 59,5 4,2 EPS** 0,162 0,010 NET PROFIT/NET REVENUES 6,4% 0,5% * EBIT/Total net revenues * EBITDA Adj, includes TV rights consumption ** adjusted excluding the treasury stocks owned at December 31 st 29
30 Millions 30
31 -190.1M -19.6% **Pro-forma consolidated P&L accounts under IFRS of Telecinco s Group and Sogecuatro s Group Millions 31
32 Millions 4Q14 4Q13 Var % Gross Advertising Revenues 260,9 237,7 9,7% - Mediaset España's medias 249,3 226,9 9,9% - Third party's medias 11,6 10,8 7,2% Discounts -4,8-9,4-48,7% Net Advertising revenues 256,1 228,3 12,2% Other Revenues 17,8 14,5 22,5% TOTAL NET REVENUES 273,9 242,9 12,8% 29,6 +126,4% 67,1 24,5%* Personnel 25,8 27,2-5,1% TV Rights Amortisation 54,7 65,0-15,8% Other Operating Costs 126,4 121,1 4,3% Total costs (1) 206,9 213,3-3,0% EBITDA adj* 67,1 29,6 126,4% EBITDA adj*/net revenues 24,5% 12,2% 12,2%* 4Q13 4Q14 * EBITDA adj./total net revenues * EBITDA Adj, includes TV rights consumption 32
33 Millions 4Q14 4Q13 Var % EBITDA adj* 67,1 29,6 126,4% PPA amortisation (2) 2,0 2,0 0,0% Depreciation tangible assets & provisions (3) 4,5 2,8 57,8% Total Costs (1+2+3) 213,3 218,1-2,2% EBIT 60,6 24,8 144,5% EBIT/Net revenues 22,1% 10,2% +144,5% 60,6 22,1%* Equity Consolidated Results -0,6-55,8 Financial results 0,6-1,7 EBT 60,6-32,7 Income Taxes -29,9 14,6 Minority Interest 3,6 0,1 NET PROFIT 34,3-18,0 EPS Adjusted** 0,093-0,045 NET PROFIT/NET REVENUES 12,5% -7,4% 24,8 10,2%* 4Q13 4Q14 * EBIT/Total net revenues * EBITDA Adj, includes TV rights consumption ** adjusted excluding the treasury stocks owned at December 31 st 33
34 * La Sexta Antena3 La1 * * Source: Kantar media * Audience average 1/2-24/2/15 34
35 Nova Neox Nova * * Clan Neox Disney Ch * * Source: Kantar media * Audience average 1/2-24/2/15 35
36 2,5x 7,8x 1,6x 1,5x Source: Kantar media * Audience average 1/1-24/2/15 36
37 Years Minutes Thousands Source: Kantar media 37
38 Third party rights In-house production 38
39 FY13 FY14 44,3% FY13: 45,0% 23,5% FY13: 25,7% 32,2% FY13: 29,3% 39
40 Investor Relations Department Phone: Fax: inversores@telecinco.es WEB: Statements contained in this document, particularly the ones regarding any Mediaset España possible or assumed future performance, are or may be forward looking statements and in this respect they involve some risks and uncertainties. Mediaset España actual results and developments may differ materially from the ones expressed or implied by the above statements depending on a variety of factors. Any reference to past performance of Mediaset España shall not be taken as an indication of future performance. The content of this document is not, and shall not be considered as, an offer document or an offer or solicitation to subscribe for, buy or sell any stock. The shares of Mediaset España may not be offered or sold in the United States of America except pursuant to an effective registration statement under the U.S. Securities Act of 1933, as amended, or pursuant to a valid exemption from registration 40
MEDiASET ESPA A Comunicaci n S.A. 9m15 results presentation (January September) Madrid, october 28 th 2015
 Madrid, october 28 th 2015") MEDiASET ESPA A Comunicaci n S.A. 9m15 results presentation (January September) Madrid, october 28 th 2015 9M15 highlights 9M15 financials 9M15 audience share Million 9M15 9M14 Var. Total net revenues
MEDiASET ESPA A Comunicaci n S.A. 9m15 results presentation (January September) Madrid, october 28 th 2015 9M15 highlights 9M15 financials 9M15 audience share Million 9M15 9M14 Var. Total net revenues
January March 2015. Madrid May 6 th, 2015 CONTENTS:
 QUARTERLY RESULTS January March 2015 Madrid May 6 th, 2015 CONTENTS: Financial and operating highlights 1. Profit and loss account 2. Cash flow generation 3. Summary balance sheet 4. Audience share performance
FY 14 Results. February 26, 2015. FY 14 Results. www.atresmediacorporacion.com
 February 26, 2015 www.atresmediacorporacion.com 1 FY 14 Highlights According to external sources, Total Ad market increased by 6% in 2014 (TV, the best-in-class, grew by +11% and Radio by +4%) Television
Q1 15 Results. April 23, 2015. Q1 15 Results. www.atresmediacorporacion.com
 April 23, 2015 www.atresmediacorporacion.com 1 Q1 15 Highlights According to internal estimates, Total Ad market increased by 8% in Q1 15 (TV and Radio grew by 12% and 13% yoy respectively ) Antena 3 led
Jan-December 2014 Results. Madrid, May 2015
 Jan-December 2014 Results Madrid, May 2015 January- December 2014 Highlights Reported Net profit exc. PPA reaches 8.3 million, from the -3.2 million losses accounted in 2013. 2014 has been a year of transformation
JANUARY JUNE 2015 RESULTS
 JANUARY JUNE 2015 RESULTS 30 June 2015 Atresmedia's consolidated financial statements were prepared in accordance with International Financial Reporting Standards (IFRS), taking into account all mandatory
Third quarter results as of December 31, 2014. Investor presentation
 Third quarter results as of December 31, 2014 Investor presentation February, 26 th 2015 Disclaimer Certain statements included or incorporated by reference within this presentation may constitute forwardlooking
Kuehne + Nagel International AG Analyst Conference Call Q1 results 2015. April 14, 2015 (CET 14.00) Schindellegi, Switzerland
 Schindellegi, Switzerland") Kuehne + Nagel International AG Analyst Conference Call Q1 results 2015 (CET 14.00) Schindellegi, Switzerland Forward-looking statements This presentation contains forward-looking statements. Such statements
Kuehne + Nagel International AG Analyst Conference Call Q1 results 2015 (CET 14.00) Schindellegi, Switzerland Forward-looking statements This presentation contains forward-looking statements. Such statements
Software AG Results 1 st Quarter 2015 (IFRS, unaudited)
") Software AG Results 1 st Quarter (IFRS, unaudited) April 29, 1 Safe Harbor This presentation includes forward-looking statements based on the beliefs of Software AG management. Such statements reflect
Software AG Results 1 st Quarter (IFRS, unaudited) April 29, 1 Safe Harbor This presentation includes forward-looking statements based on the beliefs of Software AG management. Such statements reflect
ANNUAL RESULTS PRESENTATION Madrid, March 2015
 ANNUAL RESULTS PRESENTATION Madrid, March 2015 1 Disclaimer In addition to figures prepared in accordance with IFRS, PRISA presents non-gaap financial performance measures, e.g., EBITDA, EBITDA margin,
TXT e-solutions CORPORATE PRESENTATION
 TXT e-solutions CORPORATE PRESENTATION April 16 th, 2014 April 2014 A bit of History Founded by A.Braga Illa Until 2000: healthy, but very small «Italy-only» System Integrator July 2000: IPO Borsa Italiana
FURTHER PROFIT GROWTH IN FIRST-HALF 2015
 FURTHER PROFIT GROWTH IN FIRST-HALF 2015 Net sales of 37.7bn, up +5.2% (+2.9% on an organic basis) Growth in Recurring Operating Income: 726m, +2.6% at constant rates Strong growth in adjusted net income,
Interim Nine Months 2015 Results
 1 February 2015 to 31 October 2015 Inditex continues to expand its global, fully integrated store and online sales platform. Strong operating performance: Store & Online sales in local currencies increased
Consolidated Results 2011
 SAG GEST Soluções Automóvel Globais, SGPS, SA Listed Company Estrada de Alfragide, nº 67, Amadora Registered Share Capital: 169,764,398 euros Registered at the Amadora Registrar of Companies under the
1stH 2014 CONSOLIDATED RESULTS
 Gruppo 1stH 2014 CONSOLIDATED RESULTS Conference Call 1 Contents Financial highlights Ascopiave Group structure as of June, 30th 2014 Application of IFRS 11 international accounting standard 1stH 2013
Herzogenaurach, Germany, July 27, 2004 PUMA AG announces its consolidated nd
 P Quarter P Half-Year For immediate release MEDIA CONTACT: INVESTOR CONTACT: U.S.A.: Lisa Beachy, Tel. +1 617 488 2945 Europe: Ulf Santjer, Tel. +49 9132 81 2489 Dieter Bock, Tel. +49 9132 81 2261 Herzogenaurach,
How To Report Third Quarter 2013 Results From Tomtom.Com
 De Ruyterkade 154 1011 AC Amsterdam, The Netherlands corporate.tomtom.com ir@tomtom.com 30 October 2013 TomTom reports third quarter 2013 results Financial summary Group revenue of 244 million (Q3 '12:
Q3 2013 Conference Call. Dr. Tobias Wagner 31 October 2013
 Q3 2013 Conference Call Dr. Tobias Wagner 31 October 2013 Agenda Executive summary Financial data Brands and projects Outlook Appendix 1 Highlights in the first nine months 2013 New executive board Dr.
RTL Group reports strong digital growth and a record fourth quarter EBITA in 2014
 RTL Group reports strong digital growth and a record fourth quarter EBITA in 2014 Q4/2014: EBITA up 7.1 per cent to 466 million, driven by Mediengruppe RTL Deutschland and Groupe M6 Full-year revenue and
Q1 2014 Earnings Call. April 30 th, 2014
 Q1 2014 Earnings Call April 30 th, 2014 Agenda Executive summary Financial data Outlook 2014 Appendix 2 Summary Q1 2014 (1) Revenue growth factors Positive start in FY 2014 with Q1 revenue increase of
EUROPE S LEADING ONLINE FASHION DESTINATION Q3 Earnings Call 26 November 2014
 EUROPE S LEADING ONLINE FASHION DESTINATION Q3 Earnings Call 26 November 2014 Results highlights and business update 1 CLEAR FOCUS ON EXECUTION Continued strong revenue growth above market (Revenue in
Financials at a glance: Strong growth in topline and net adjusted income
 1 Ströer Financials Financials at a glance: Strong growth in topline and net adjusted income Change Revenues Organic growth (1) Operational EBITDA 282.3 242.2 +16.6% 7.3% 10.0% 59.8 52.4 +14.0% Net adjusted
Disclaimer. This document has been prepared by Tele Columbus AG (the "Company") solely for informational purposes.
 solely for informational purposes.") Disclaimer This document has been prepared by Tele Columbus AG (the "Company") solely for informational purposes. This presentation may contain forward-looking statements. These statements are based on
Disclaimer This document has been prepared by Tele Columbus AG (the "Company") solely for informational purposes. This presentation may contain forward-looking statements. These statements are based on
WE ARE. SHOWROOMPRIVE.com FY2015 RESULTS February, 16 th 2016
 WE ARE SHOWROOMPRIVE.com FY2015 RESULTS February, 16 th 2016 I BUSINESS UPDATE AND 2015 RESULTS HIGHLIGHTS 2015: A YEAR FULL OF ACHIEVEMENTS A STRONG AND PROFITABLE GROWTH 443m net sales and 24m EBITDA
1H/14 Results Presentation
 1H/14 Results Presentation September 1st, 2014 YTD Highlights Good operating performance impacted by f/x effects Like for like* growth in Sales, EBIT & Net Profit Stable net debt LTM despite significant
Grupo PRISA Overview An integrated media and education company
 October, 2013 Disclaimer In addition to figures prepared in accordance with IFRS, PRISA presents non-gaap financial performance measures, e.g., EBITDA, EBITDA margin, adjusted EBITDA, adjusted EBITDA margin,
Consolidated Statement of Profit or Loss (in million Euro)
") Consolidated Statement of Profit or Loss (in million Euro) Q3 2014 Q3 2015 % change 9m 2014 9m 2015 % change Revenue 636 661 3.9% 1,909 1,974 3.4% Cost of sales (440) (453) 3.0% (1,324) (1,340) 1.2% Gross
Consolidated Statement of Profit or Loss (in million Euro) Q3 2014 Q3 2015 % change 9m 2014 9m 2015 % change Revenue 636 661 3.9% 1,909 1,974 3.4% Cost of sales (440) (453) 3.0% (1,324) (1,340) 1.2% Gross
ISS Governance Services Proxy Research. Company Financials Compustat Data Definitions
 ISS Governance Services Proxy Research Company Financials Compustat Data Definitions June, 2008 TABLE OF CONTENTS Data Page Overview 3 Stock Snapshot 1. Closing Price 3 2. Common Shares Outstanding 3 3.
Management Presentation Q2/2012 Results. 8 August 2012
 Management Presentation Q2/2012 Results 8 August 2012 Cautionary statement This presentation contains forward-looking statements which involve risks and uncertainties. The actual performance, results and
Meeting with Investors & Analysts. December 17 th, 2013
 Meeting with Investors & Analysts December 17 th, 2013 9-Months 2013 - Results 9 Months - 2013 Revenues: 39,6 m (+16,2% vs. 9-months 2012) of which 54% International (vs. 40,1 m Full Year 2011) 26% Software
Consolidated Statement of Profit or Loss (in million Euro)
") Consolidated Statement of Profit or Loss (in million Euro) Q2 2012 Q2 2013 % H1 2012 H1 2013 % Restated * change Restated * change Revenue 779 732-6.0% 1,513 1,437-5.0% Cost of sales (553) (521) -5.8%
Consolidated Statement of Profit or Loss (in million Euro) Q2 2012 Q2 2013 % H1 2012 H1 2013 % Restated * change Restated * change Revenue 779 732-6.0% 1,513 1,437-5.0% Cost of sales (553) (521) -5.8%
SAF-HOLLAND Annual Financial Statements 2012. Detlef Borghardt, CEO Wilfried Trepels, CFO. March 14, 2013
 SAF-HOLLAND Annual Financial Statements 212 Detlef Borghardt, CEO Wilfried Trepels, CFO March 14, 213 Executive Summary business volume successfully expanded in 212 1 Group sales increased yoy by 3.4%
EUROPE S LEADING ONLINE FASHION DESTINATION Q1 2015 Earnings Call 12 May 2015
 EUROPE S LEADING ONLINE FASHION DESTINATION Q1 2015 Earnings Call 12 May 2015 Results highlights and business update 1 REACCELERATED REVENUE GROWTH WHILE PROFITABILITY IMPROVEMENTS CONTINUE Strong Revenue
First Half 2015 Results (January-June) Madrid, July 24 th 2015
 Madrid, July 24 th 2015") First Half 2015 Results (January-June) Madrid, July 24 th 2015 Table of Contents 1. 1H 2015 Highlights 2. Backlog Execution 3. Update on Tulpar Transaction 4. Commercial Activity 5. Profit & Loss 6. Cash
First Half 2015 Results (January-June) Madrid, July 24 th 2015 Table of Contents 1. 1H 2015 Highlights 2. Backlog Execution 3. Update on Tulpar Transaction 4. Commercial Activity 5. Profit & Loss 6. Cash
KLÖCKNER & CO GROUP FIGURES 2 INTERIM GROUP MANAGEMENT REPORT 3 KLÖCKNER & CO SHARE 20 CONSOLIDATED STATEMENT OF INCOME FOR THE SIX-MONTH PERIOD
 KLÖCKNER & CO GROUP FIGURES 2 INTERIM GROUP MANAGEMENT REPORT 3 KLÖCKNER & CO SHARE 20 CONSOLIDATED STATEMENT OF INCOME FOR THE SIX-MONTH PERIOD ENDING JUNE 30, 2015 22 STATEMENT OF COMPREHENSIVE INCOME
TXT e-solutions. STAR Conference London 3 October 2014
 TXT e-solutions STAR Conference London 3 October 2014 FY 2013 & H1 2014 Results FY 2013 (Actual) H1 2014 Revenues: 52,6 m (+13%) 29,0 m (+ 10,3%) of which 54% International 58% International EBIT 5 m (vs.
Kuehne + Nagel International AG Analyst Conference Call Full-year 2015 results. March 2, 2016 (CET 14.00) Schindellegi, Switzerland
 Schindellegi, Switzerland") Kuehne + Nagel International AG Analyst Conference Call Full-year results March 2, 2016 (CET 14.00) Schindellegi, Switzerland Forward-looking statements This presentation contains forward-looking statements.
Kuehne + Nagel International AG Analyst Conference Call Full-year results March 2, 2016 (CET 14.00) Schindellegi, Switzerland Forward-looking statements This presentation contains forward-looking statements.
2013 Third Quarter Review October 25, 2013 1
 October 25, 213 1 Panalpina Group October 25, 213 213 Third Quarter Review October 25, 213 2 Highlights and key figures Operating and financial review Outlook Growth in profitability and margins in the
For Immediate Release Toronto Stock Exchange Symbol: RC
 For Immediate Release Toronto Stock Exchange Symbol: RC RDM Corporation Reports Third Quarter Financial Results Payment Processing Services Revenue grows 15% year over year WATERLOO, ON, July 26, 2012
FY RESULTS 27 FEBRUARY 2015. Tom Enders I Chief Executive Officer Harald Wilhelm I Chief Financial Officer
 1 FY RESULTS 27 FEBRUARY 2015 Tom Enders I Chief Executive Officer Harald Wilhelm I Chief Financial Officer SAFE HARBOUR STATEMENT 2 Disclaimer This presentation includes forward-looking statements. Words
Consolidated Statement of Profit or Loss (in million Euro)
") Consolidated Statement of Profit or Loss (in million Euro) Q3 2013 Q3 2014 % change 9m 2013 9m 2014 % change Revenue 689 636-7.7% 2,126 1,909-10.2% Cost of sales (497) (440) -11.5% (1,520) (1,324) -12.9%
Consolidated Statement of Profit or Loss (in million Euro) Q3 2013 Q3 2014 % change 9m 2013 9m 2014 % change Revenue 689 636-7.7% 2,126 1,909-10.2% Cost of sales (497) (440) -11.5% (1,520) (1,324) -12.9%
Alternative Networks plc Interim results for the six months to 31 March 2015
 Alternative Networks plc Interim results for the six months to 31 March 2015 Edward Spurrier, Chief Executive Officer Mark Quartermaine, Chief Operating Officer (CEO Designate) Gavin Griggs, Chief Financial
Kuehne + Nagel International AG Analyst Conference Call First quarter 2016 results. April 19, 2016 (CET 14.00) Schindellegi, Switzerland
 Schindellegi, Switzerland") Kuehne + Nagel International AG Analyst Conference Call First quarter 2016 results April 19, 2016 (CET 14.00) Schindellegi, Switzerland Forward-looking statements This presentation contains forward-looking
Kuehne + Nagel International AG Analyst Conference Call First quarter 2016 results April 19, 2016 (CET 14.00) Schindellegi, Switzerland Forward-looking statements This presentation contains forward-looking
2013 Second Quarter Review July 26, 2013 1
 213 Second Quarter Review July 26, 213 1 Panalpina Group Basel, July 26, 213 213 Second Quarter Review 213 Second Quarter Review July 26, 213 2 Highlights and key figures Operating and financial review
2015 annual results. 16 th March 2016
 2015 annual results 16 th March 2016 Legal disclaimer Certain statements in this document are forward-looking statements. These forward-looking statements speak only as at the date of this document. These
Q1/2015 Results VTG AG Connecting worlds. Dr. Heiko Fischer, CEO Dr. Kai Kleeberg, CFO May 21, 2015
 Q1/2015 Results VTG AG Connecting worlds Dr. Heiko Fischer, CEO Dr. Kai Kleeberg, CFO May 21, 2015 Table of content 1 Discussion of Q1/2015 2 Outlook FY 2015 3 Questions & Answers 4 Financial Calendar
Consolidated balance sheet
 Consolidated balance sheet Non current assets 31/12/2009 31/12/2008 (*) 01/01/2008 (*) Property, plant and equipment 1,352 1,350 1,144 Investment property 7 11 11 Fixed assets held under concessions 13,089
How To Profit From A Profit From The Year
 Results for the 12 months ended 30 June 2014 28 th August 2014 Peter George, CEO Geoff Stephenson, CFO INVESTOR PRESENTATION 2 Contents FY14 Highlights Reconciliation of EBITDA Transformation Financial
CASH FLOW CALCULATION: THE IMPORTANCE OF WORKING CAPITAL
 CASH FLOW CALCULATION: THE IMPORTANCE OF WORKING CAPITAL Lesson 5 Castellanza, 15 th October 2014 SUMMARY Financial statements a brief review Financial statements and cash flows The cash source / cash
July 30 th, 2015 2015 HALF-YEAR RESULTS
 Disclaimer Confidential IMPORTANT NOTICE: By attending the meeting where this presentation is given, or by reading the presentation slides, you agree to be bound by the following limitations and qualifications:
Focus on fleet customers SAF-HOLLAND Annual Financial Statements 2013
 Focus on fleet customers SAF-HOLLAND Annual Financial Statements 213 Detlef Borghardt, CEO Wilfried Trepels, CFO March 13, 214 Agenda 1 Financials 3 2 Appendix 21 2 Executive Summary 1 2 3 Group sales
Europe: Growth of +7.8% in Recurring Operating Income France: New half of improved profitability
 2014 FIRST HALF RESULTS: CONTINUED GROWTH Organic sales growth of 4.3% Increase in Recurring Operating Income of +13.8% Strong increase in adjusted net income, Group share of +16.7% Strong profit growth
Group 9-month report Bastei Lübbe AG 1 Apr - 31 Dec 2015
 Group 9-month report Bastei Lübbe AG 1 Apr - 31 Dec 2015 At a Glance Key figures (IFRS) 01/04/2015-2015 01/04/- Change in % Business development in million Group turnover 79.4 86.8-8.5 % EBITDA 14.0 11.5
Year-end Dec 2013A 2014E 2015E 2016E Key data. # Priced at market close, 29/09/14
 This research is intended for UK institutional investors only and market professionals. It is not intended for retail customers and any retail customer should seek professional, independent advice before
EUROPE S LEADING ONLINE FASHION DESTINATION Q3 2015 Earnings Call 12 November 2015
 EUROPE S LEADING ONLINE FASHION DESTINATION Q3 2015 Earnings Call 12 November 2015 Results highlights and business update 1 ACCELERATING GROWTH THROUGH TARGETED INVESTMENTS Strong Growth revenue accelerates
Advanced Corporate Finance. 2. Financial Planning, from Accounting to Free Cash Flows
 Advanced Corporate Finance 2. Financial Planning, from Accounting to Free Cash Flows Objectives of the session 1. Show how to use accounting information to compute cash flows 2. Understand and compute
Any reference to M6 Group past performance should not be interpreted as an indicator of future performance.
 DISCLAIMER Statements contained in this document, particularly those concerning forecasts on future M6 Group performance, are forward looking statements that are potentially subject to various risks and
EUROPE S LEADING ONLINE FASHION DESTINATION Q4 / Full-Year 2014 Earnings Call 5 March 2015
 EUROPE S LEADING ONLINE FASHION DESTINATION Q4 / Full-Year 2014 Earnings Call 5 March 2015 Results highlights and business update 1 CONTINUED CLEAR FOCUS ON EXECUTION Strong revenue growth outperforms
Financial Results. siemens.com
 s Financial Results Fourth Quarter and Fiscal 2015 siemens.com Key figures (in millions of, except where otherwise stated) Volume Q4 % Change Fiscal Year % Change FY 2015 FY 2014 Actual Comp. 1 2015 2014
ASX code - LCM. 2015 full year results investor briefing
 ASX code - LCM 2015 full year results investor briefing 3 September 2015 performance summary FY15 against previous corresponding period (pcp) $133.8m Revenue FY14: $127.9m $8.3m Statutory NPAT FY14: $5.0m
Full Year 2012 Results. Madrid, February 28 th, 2013
 Full Year 2012 Results Madrid, February 28 th, 2013 Our progress in 2012 1. A new company identity and mission 2. A fully integrated organization 3. A strong plan going forward 4. Solid business and financial
Investor Presentation. April 2014
 Investor Presentation April 2014 Safe Harbor Statement This document includes supplemental financial measures that are or may be non-gaap financial measures. These supplemental financial measures should
Quarterly Report. Grupo Clarín announces its Results for the Nine Months (9M15) and Third Quarter of 2015 (3Q15)
 and Third Quarter of 2015 (3Q15)") Quarterly Report GCLA: Ps.117.0 / share (BCBA) GCLA: USD 16.0 / GDS (LSE) Total Shares: 287,418,584 Total GDSs: 143,709,292 Market Value: USD 2,299.3 MM Closing Price: November 10th, Grupo Clarín announces
Quarterly Report GCLA: Ps.117.0 / share (BCBA) GCLA: USD 16.0 / GDS (LSE) Total Shares: 287,418,584 Total GDSs: 143,709,292 Market Value: USD 2,299.3 MM Closing Price: November 10th, Grupo Clarín announces
Business Review & 4Q10 Results
 Business Review & 4Q10 Results Apr 4, 2011 www.dyh.com.tr Notice The financial statements are reclassed for presentation purposes, the CMB format is also available through ISE and DYH websites.the figures
Luxottica s net income from continuing operations for fiscal year 2006 rises by 100 million or by 30% Cash dividend for FY 2006 to increase by 45%
 Luxottica s net income from continuing operations for fiscal year 2006 rises by 100 million or by 30% Cash dividend for FY 2006 to increase by 45% Milan, Italy March 5, 2007 - Luxottica Group S.p.A. (NYSE:
Kuehne + Nagel International AG Analyst Conference Call Q1 Results 2014
 Kuehne + Nagel International AG Analyst Conference Call Q1 Results 2014 April 14, 2014 Schindellegi, Switzerland Forward-Looking Statements This presentation contains forward-looking statements. Such statements
Income Statement (1) First Quarter 2002
 First Quarter 2002") Income Statement (1) (in millions of EUR) 1 st Q 2002 1 st Q 2001 2002/2001 Sales 5,402.2 4,993.6 +8.2% (2) EBITDA (FIFO) 408.7 366.1 +11.6% EBITDA margin 7.6% 7.3% - Depreciation (145.5) (134.6) +8.1%
Income Statement (1) (in millions of EUR) 1 st Q 2002 1 st Q 2001 2002/2001 Sales 5,402.2 4,993.6 +8.2% (2) EBITDA (FIFO) 408.7 366.1 +11.6% EBITDA margin 7.6% 7.3% - Depreciation (145.5) (134.6) +8.1%
TXT e-solutions. Corporate Overview September 2015
 TXT e-solutions Corporate Overview September 2015 FY 2014 & H1 2015 Results FY 2014 (Actual) H1 2015 Revenues: 55.9 m (+6.3%) 31.1 m (+13.2%) EBIT 5.5 m (+10%) 2.8 m (+22.8%) Free Cash Flow 9.3% of Rev.
1H 2009/2010 Results Presentation
 1H 2009/2010 Results Presentation 23 November 2009 1 1H 2009/10 Results Key Facts Consolidated Sales of 56,3m, -14.8% YoY Retail Sales of 14.7m, +118.3% YoY Wholesale Sales of 41.4m, -29.7% YoY EBITDA
Investor & Analyst Presentation Eigenkapitalforum Frankfurt November 24-26th, 2014. Dr. Cornelius Patt, CEO Andreas Grandinger, CFO
 Investor & Analyst Presentation Eigenkapitalforum Frankfurt November 24-26th, 2014 Dr. Cornelius Patt, CEO Andreas Grandinger, CFO Safe Harbor Statement This document includes supplemental financial measures
Oslo Børs VPS Holding ASA 2nd Quarter 2015
 Oslo Børs VPS Holding ASA 2nd Quarter 215 12 August 215 2nd quarter at a glance Good level of trading and settlement activity continued in the quarter Continuing strong interest in admission of both shares
March 10, 2011 Company name:
 Second Quarter Financial Results For the Six Months Ended January 31, 2011-[Japanese Standards]Consolidated March 10, 2011 Company name: Dr. Ci:Labo Co., Ltd. Shares listed on: The First Section of the
Quarter Report 2014 ESSANELLE HAIR GROUP AG
 Quarter Report 2014 ESSANELLE HAIR GROUP AG Q1 2 Q1/2014 ESSANELLE HAIR GROUP KEY FIGURES for 1 January to 31 March 2014/2013 (IFRS) million 2014 2013 Change* Consolidated sales 32.3 30.8 +4.7% essanelle
How To Make A Profit From Telecolumna.Com
 FY 2015 Q1 Results Presentation Berlin, 12 May 2015 Disclaimer This document has been prepared by Tele Columbus AG(the"Company") solely for informational purposes. This presentation may contain forward-looking
CONSOLIDATED INCOME STATEMENTS
 ATTACHMENTS TO THE PRESS RELEASE The consolidated Income Statements, consolidated Statements of Financial Position and the Consolidated Statements of Cash Flows as well as the Net Financial Debt of INWIT,
STATEMENT ON FINANCIAL POSITION
 STATEMENT ON FINANCIAL POSITION DESCRIPTION NOTE DAY 30.06.2013 31.12.2012 Fixed assets 218 532 221 493 214 682 Intangibles 3 583 3 057 3 033 Tangible fixed assets 2 69 812 69 272 63 027 Investment properties
HMS Group 3 months 2015 IFRS Results Conference call presentation. 16 June 2015
 HMS Group 3 months 2015 IFRS Results Conference call presentation 16 June 2015 Financial results Business & Outlook Appendix Financial Highlights Financial highlights, Rub mn 3m 2015 3m 2014 chg, yoy Revenue
Vizrt Group AS Reports Q1 2015 Results
 Vizrt Group AS Quarterly report March 31, 2015 Vizrt Group AS Reports Q1 2015 Results Business Overview On March 19, 2015, Vizrt Group AS (formerly Aksjeselskapet av 17. Oktober 2014 AS ) ( the Company
Preliminary Consolidated Financial Statements 2015 >
 Preliminary Consolidated Financial Statements 2015 > The following results and amounts are preliminary statements that have not yet been approved or adopted by the Supervisory Board. Preliminary Consolidated
RTL Group reports a successful start into 2015: EBITA slightly up, net profit significantly higher
 RTL Group reports a successful start into 2015: EBITA slightly up, net profit significantly higher Mediengruppe RTL Deutschland with significant revenue and EBITA growth Very strong revenue growth in digital:
Promising FY 2018 targets
 A cc or # $TypCap$ 1628 1 0 4 2 Page 1/7 Equity flash Trading Update Automotive BUY (BUY) Target EUR 2.30 (EUR 2.00) Price (last closing price) : 1.10 EUR Upside : 109% Est. change 2015e 2016e EPS - -
NWC = current assets - current liabilities = 2,100
 Questions and Problems Chapters 2,3 pp45-47 1. Building a balance sheet. Penguin Pucks, Inc., has current assets of $3,000, net fixed assets $6,000, current liabilities of $900, and long-term debt of $5,000.
Hi-Media: Recovery in advertising business and significant increase in profitability after the downturn observed in H2 2012
 Hi-Media: Recovery in advertising business and significant increase in profitability after the downturn observed in H2 2012 Return to growth in advertising thanks to the success of new advertising solutions
Telio & NextGenTel. NextGenTel Holding ASA. Q1 2015 Presentation. Eirik Lunde, CEO. Felix Konferansesenter Oslo 7 May 2015
 Telio & NextGenTel NextGenTel Holding ASA Q1 215 Presentation Eirik Lunde, CEO Felix Konferansesenter Oslo 7 May 215 This is NextGenTel Group Background Telio Pioneer in the Norwegian VoIP market rapid
Company presentation. bet-at-home.com AG March 2016
 Company presentation bet-at-home.com AG March 2016 bet-at-home.com is a Europe-wide leading online gaming provider with offices in Austria, Germany, Malta and Gibraltar a listed company with 264 employees
3. CONSOLIDATED QUARTERLY FINANCIAL STATEMENTS
 3. CONSOLIDATED QUARTERLY FINANCIAL STATEMENTS (1) Consolidated Quarterly Balance Sheets September 30, 2014 and March 31, 2014 Supplementary Information 2Q FY March 2015 March 31, 2014 September 30, 2014
9M2004 Consolidated Results
 9M2004 Consolidated Results Fulvio Conti Chief Financial Officer Rome, 11 November 2004 Income statement (Euro Mn) 9M2004 9M2003 % change 3Q2004 3Q2003 % change 25,984 23,293 11.6% Revenues 9,036 7,872
Kuehne + Nagel International AG Analyst Conference Call Nine-months 2015 results. October 13, 2015 (CET 14.00) Schindellegi, Switzerland
 Schindellegi, Switzerland") Kuehne + Nagel International AG Analyst Conference Call Nine-months results October 13, (CET 14.00) Schindellegi, Switzerland Forward-looking statements This presentation contains forward-looking statements.
Kuehne + Nagel International AG Analyst Conference Call Nine-months results October 13, (CET 14.00) Schindellegi, Switzerland Forward-looking statements This presentation contains forward-looking statements.
Second Quarter 2007 Results. July 31, 2007
 Second Quarter 2007 Results July 31, 2007 Safe Harbor For Forward Looking Statements Except for historical information, all other information in this presentation consists of forward-looking statements
Consolidated Interim Report
 Consolidated Interim Report as of 31 March 2015 UNIWHEELS AG CONTENTS 1. Key performance data 2. Condensed group management report as of 31 March 2015 3. Condensed consolidated financial statements as
for 2014 achieved but increased uncertainty due to reduced spending in the oil & gas industry 2014E figures: Underlying EBITDA above our expectations
 A cc or # Targets $T ypcap$ 1628 1 0 4 2 Page 1/8 Equity flash Trading Update Alternative Energy BUY (BUY) Target EUR 6.50 (EUR 7.00) Price (last closing price) : 5.14 EUR Upside : 26% Est. change 2015e
Third Quarter 2015 Financial Highlights:
 DISCOVERY COMMUNICATIONS REPORTS THIRD QUARTER 2015 RESULTS, INCREASES BUYBACK AUTHORIZATION BY $2 BILLION AND ANNOUNCES RESUMPTION OF SHARE REPURCHASES BEGINNING IN FOURTH QUARTER 2015 Third Quarter 2015
Interim report Q3 2015
 Interim report Q3 2015 Interim report Q3 2015 Dear Shareholders 2 November 2015 marked a milestone in the history of Kid when the company's shares were listed on the Oslo Stock Exchange. Over the last
CONSOLIDATED STATEMENT OF INCOME
 CONSOLIDATED STATEMENT OF INCOME 4 th quarter (a) 3 rd quarter 4 th quarter 2009 Sales 40,157 40,180 36,228 Excise taxes (4,397) (4,952) (4,933) Revenues from sales 35,760 35,228 31,295 Purchases, net
RTL Group s growth accelerates in Q3/2015
 RTL Group s growth accelerates in Q3/2015 Revenue up 7.5 per cent, digital revenue up 86.6 per cent, EBITA up 13.8 per cent in Q3/2015 to record levels FremantleMedia broadens content portfolio with investments
Interim financial report third quarter 2014 Investor presentation. Koen Van Gerven, CEO Pierre Winand, CFO
 Interim financial report third quarter 204 Investor presentation Koen Van Gerven, CEO Pierre Winand, CFO Brussels November, 4th 204 Investor presentation - Interim financial report 3Q4 2 Financial Calendar
Concentration on core business leads to one-off effects in first quarter results of SCHMOLZ + BICKENBACH
 Media release Concentration on core business leads to one-off effects in first quarter results of SCHMOLZ + BICKENBACH Revenue increased by 2.3% despite lower sales volume Impairment losses and provisions
Ternium Announces First Quarter 2015 Results
 Sebastián Martí Ternium - Investor Relations +1 (866) 890 0443 +54 (11) 4018 2389 www.ternium.com Ternium Announces First Quarter 2015 Results Luxembourg, April 29, 2015 Ternium S.A. (NYSE: TX) today announced
First quarter 2015 results
 First quarter 205 results FINANCIAL AND OPERATIONAL HIGHLIGHTS Financial summary Q '5 Group revenue of 205 million (Q '4: 205 million) Gross margin of 54% (Q '4: 57%) EBITDA of 2 million (Q '4: 30 million)
Apptix Sells Public Cloud Business Funds MSP Growth Strategy
 Apptix Sells Public Cloud Business Funds MSP Growth Strategy Herndon, VA and Oslo, Norway September 9, 2015 Apptix (OSE: APP), the premier provider of managed and hosted solutions, today announced it sold