Do Individuals Make Sensible (Health) Insurance Decisions? Evidence from a Menu with Dominated Options
|
|
|
- Claire Harrington
- 8 years ago
- Views:
Transcription
1 Do Individuals Make Sensible (Health) Insurance Decisions? Evidence from a Menu with Dominated Options Saurabh Bhargava *, George Loewenstein *, and Justin Sydnor + Carnegie Mellon University * University of Wisconsin-Madison + This Version: February 2015 PRELIMINARY PLEASE DO NOT CITE OR CIRCULATE Abstract The economic rationale for recent expansion in health plan choice presumes that individuals are able to sensibly choose from available options. We test this presumption by assessing the quality of over 50,000 health insurance decisions from a U.S. firm which permitted employees to build their own plans from a standardized menu of 48 plan options of which a large share were financially dominated. The menu offers a unique litmus test for evaluating choice in that no set of standard risk preferences or beliefs regarding future health can rationalize enrollment into dominated plans. We find that a majority of employees choose dominated options, resulting in excess spending equivalent to an average of 42% of the annual plan premium. Employees fail to improve plan choice over time, and older workers, women, and low earners were disproportionately likely to make costly errors in choice. We then report findings from follow-up hypothetical choice experiments which suggest that while search complexities may have modestly contributed to poor choice, such choices are more fundamentally due to a lack of understanding of basic health insurance concepts. We find that plan selection is ultimately consistent with a heuristic choice strategy whereby individuals sort into available plans based on crude self-assessments of health and the configuration of plan menus rather than a careful evaluation of the financial value of plan options. Our results challenge the standard practice of inferring risk attitudes and from insurance choices and raise doubts as to whether recent reform will deliver on its promised benefits. Acknowledgements: We thank a number of individuals for their generous advice and feedback including Alan Auerbach, Ned Augenblick, Zarek Brot-Goldberg, Ryan Bubb, David Card, David Coughlin, Stefano DellaVigna, Joe Farrell, Ben Handel, Hilary Hoynes, Botond Koszegi, Prasad Krishnamurthy, David Laibson, Bridget Madrian, Daniel McFadden, John Miller, Sendhil Mullainathan, Devin Pope, Matthew Rabin, Emmanuel Saez, Andrei Shleifer, and David Sraer. We additionally thank seminar participants at U.C. Berkeley, Carnegie Mellon University, Georgia State, Harvard University, the London School of Economics, and Oxford University.

2 Among the many financial decisions facing Americans, those involving health insurance are among the most economically consequential and poorly understood. A majority of insured Americans worry that unexpected health expenses pose a threat to a secure retirement and financial well-being, but only 14% of the insured are able to define the basic cost-sharing concepts fundamental to most health insurance plans (Loewenstein et al. 2013). 1 This lack of health-insurance literacy mattered less when most individuals simply accepted the single-plan offered by their employer, Medicare, or Medicaid, but in recent years there has been a trend towards providing individuals with greater choice. Seniors select from numerous and highly differentiated plan options when enrolling in Medicare Part D or Medicare Advantage, and the median enrollee on the exchanges of the Affordable Care Act (ACA) chooses from 47 available plans. In theory, choice should improve consumer welfare both by enhancing the ability of individuals to sort into suitable plans and by encouraging provider competition. As Kathleen Sebelius, former Secretary of Health and Human Services, stated during the rollout of the ACA exchanges, Exchanges offer Americans competition, choice, and clout. Insurance companies will compete for business on a transparent, level playing field, driving down costs, and Exchanges will give individuals a choice of plans to fit their needs. However, recent research has challenged the economic rationale for the expansion of health-plan choice by questioning whether consumers can sensibly navigate their options. A series of influential studies has established that seniors make poor decisions in their choice of drug coverage on the highly complex exchanges of Medicare Part D. Abaluck and Gruber (2011) conclude that a majority of enrollees could have selected alternative plans with both lower premiums and lower variance in cost suggesting widespread inefficiency in choice. 2 Kling et al (2012) find that providing seniors with simple information on the expected spending associated with different plans led to substantial plan switching, implying that prior to obtaining such information seniors had not compared the financial value of different plans. Seniors do reduce excess spending over time (Ketcham, et al. 2012), but appear to exhibit considerable inertia when it comes to changing plans (Ericson, forthcoming). Outside the complicated domain of Medicare, most evidence on the quality of plan choice has been limited to the problem of consumer inertia. Inertia in plan choice has been documented in employee populations (Strombom et al. 2002; Frank and Lamiraud, 2009), and Handel (2013) reports cases in which this inertia leaves employees with substantially dominated plans. Diagnosing the quality of plan choice has been more challenging since plan choices reflect factors such as a consumer s tolerance for risk and expectations regarding future medical care that are not readily observed by the researcher. 1 Survey involved 1,847 insured US adults and was retrieved November 2014 from images/9022/media_gallery/knowyourbenefits/2014_health_financial_well-being-how_strong_is_the_link-final.pdf. 2 See also Heiss, McFadden and Winter (2010) and Zhou and Zhang (2012) for similar evidence in this market. 1

3 In this paper, we present new evidence on the quality of insurance plan choices made by over 50,000 employees of a large US firm. Employees in our sample were required to assemble their own health plan by selecting options for four cost-sharing dimensions (deducible, out-of-pocket maximum, copay and coinsurance). The resulting build-your-own menu featured 48 plans which varied in costsharing and premium. The choices these employees faced provide a unique litmus test for assessing the quality of plan choice, due to two key features. The first key feature is that the majority of the plan options were financially dominated by other available plans. That is, each employee chose a health plan from a menu in which some plans were less costly regardless of the employee s ultimate level of medical care. A menu with a significant share of financially dominated options can reveal choice quality without requiring assumptions of consumer beliefs or preferences for risk. The second key feature is the fact that the plans, apart from varying across the four cost-sharing dimensions and premium, were otherwise identical and were presented in a highly standardized manner. The plans, for example, were all offered by the same health insurance company (eliminating possible covariance of plan features with the reputation of the offering company), and featured the same coverage in-network as well as out-of-network. As a result of these two features, the apparent dominance of plans was not confounded by small differences in other plan attributes, and the identification of such dominance should not have required extraordinary sophistication on the part of consumers. As an illustration of plan dominance in this setting, employees shopping for single-person coverage who had the choice of four deductibles ($1000; $750; $500; $250) typically had to pay more than $500 to reduce their deductible from $1,000 to $750, holding all other plan features equivalent. This price difference that cannot be rationalized by any level of health care utilization since, at most, such a reduction could save the employee only $ Of the 36 low-deductible plans available, 35 were dominated by the otherwise equivalent $1,000 deductible plan. Our main empirical result is that the majority of employees chose plans that were financially dominated. 4 The economic consequences of these poor choices for those who made them were significant. The average employee opting into a dominated plan could have saved $373 per year by choosing an otherwise equivalent plan with a higher deductible, which is equivalent to an average of 2% of annual income and 42% of the average employee-paid premium. The choice quality we observe varies by employee characteristics. Lower-income employees, female employees, older employees, and employees with chronic health conditions were all significantly more likely to select dominated contracts. Indicative of the welfare consequences of these choices, the significant share of employees in the lowest 3 While we focus on employees choosing single coverage plans, we find that choices of other employees are similar. 4 61% chose a transparently dominated plan before tax considerations, while 55% chose a dominated plan adjusting for the differential tax deductibility of premiums over out-of-pocket spending. 2

4 reported income band could have saved over 4% of annual income, on average, if they had chosen the actuarially best plan. This evidence suggests that the burden of complex insurance decisions may disproportionately affect those in most need. Consistent with prior studies documenting consumer inertia, we also find that only a modest share of employees switched into new plans the subsequent year including disproportionately fewer low earners. While the plurality of these switchers moved to financially superior plans, switching rates were lower for low-income employees. Given the financial consequences of plan choice, why do so many employees choose dominated plans? One possibility is that sophisticated employees knowingly pay a premium for the ease and predictability of incurring steady payroll deductions as compared to a more variable flow of out-of-pocket expenses. For the 36% of employees choosing the $500 deductible, such preferences imply a willingness to accept an additional $625 in premiums through payroll deductions to avoid $226 in expected out-ofpocket expenses, and a maximum of $500, over the course of the year. While such willingness cannot be definitively ruled out, given the availability of flexible savings accounts, as well alternative sources of financing almost certainly available to most employees, it is unlikely that the observed behavior is largely explained by a preference for avoiding the inconvenience or unpredictability of out-of-pocket expenses. We investigate alternative explanations through a series of online experiments in which we asked thousands of subjects to make plan choices from stylized menus that were designed to mimic the firm s menu in price and structure, but featured far fewer, and dramatically simplified, plans. Speaking to the reliability of the approach, overall, the experiments yield the same double-peaked pattern of deductible choice as that exhibited by employees in our sample (with peaks in demand for the $500 and $1,000 deductibles). An initial explanation we consider is that poor employee choice is due to search complexity associated with the large number of available plan options and the design of the enrollment interface faced by employees. The online interface through which employees enrolled in a plan was designed to emphasize the sense that employees could build their own health plan by sequentially selecting levels within each of four cost-sharing attributes after which plan features and the monthly cost was displayed. After building a first candidate plan, employees had the option of enrolling in that plan or building subsequent plans which would be iteratively added to a plan comparison matrix. Our experimental tests of search complexity, in which we varied the ease with which participants can compare plans, the number of plans and plan attributes available, and consistency in the presentation of plan premiums and deductibles, suggest that reducing such complexity improved choice, but only modestly. A majority of participants failed to detect dominated plans even when presented with an extremely simple menu featuring four plans differing only in their deductible and price. Given the modest role of search complexity in explaining poor choice, in a second online experiment, we explore the possibility that poor choice is a consequence of low search motivation. 3

5 Consistent with this explanation, we find that a majority of participants fail to anticipate that plan menus might include plans of low financial value. However, informing people of this fact led to very little improvement in plan choice. In the same study we tested whether poor plan choice might result from consumers inability to evaluate and compare plans due to low insurance literacy. Confirming prior work, most participants lack definitional and conceptual understanding of insurance concepts such as a deductible and copayment, and these deficits in health plan literacy predicted poor plan choices. Moreover, providing further support for the importance of this factor, real-time decision-aids designed to educate participants led to significant improvements in choice quality. While the basic complexity of insurance, and consumer illiteracy, may reasonably contribute to the large degree of choice inefficiency, the observed pattern of deductible choices appears far from random. A final experiment, in which we systematically vary the relative cost of plans in dramatically simplified menus, points to an intriguing explanation for the observed patterns of choice by both employees and participants in the online experiments. Choices appear to be consistent with a heuristic choice strategy in which individuals select plans by sorting themselves into deductibles based on recognition of approximate differences in cost-sharing across deductible options and perceptions of their own relative healthiness (c.f., Prelec, Wernerfelt & Zettelmeyer 1997). Even in the simplest of settings, participants choices are predicted by beliefs regarding their own relative health. The possibility that individuals rely on imperfect heuristics to navigate consequential decisions is consistent with broader evidence that individuals, faced with complex choices, make systematic mistakes, due to limits to cognition, motivation, and self-control (see DellaVigna 2009). The poor health plan choices we document have important implications for policy. A first implication is that the pervasiveness, and persistence, of poor plan choices undermines the stated rationales for choice expansion. If employees are not able to sensibly compare across plans in a standardized menu in which plans share the same provider and where all but a small number of plan features are held fixed, then it is likely that consumers faced with the far more heterogeneous menus that characterize public and employee-sponsored exchanges will be at least as challenged. Beyond failing to improve plan selection, our findings suggest that the availability of choice led to excess spending of a larger magnitude than other aspects of health policy design (e.g., the downward effect on premiums of competition in healthcare exchanges (e.g., Burke et al. 2014), or the effect of the mandate on plan prices (e.g., Eibner and Price 2012)), that have attracted considerable attention. While the long-run costs to consumers are less clear, given that likelihood that improvements in choice quality would lead firms to adjust prices to maintain a constant level of spending, higher choice quality is likely to produce welfare gains for employees, of generally lower incomes, who are currently more likely to sort into expensive low deductible plans. Moreover, if most consumers are unable to financially compare plans, then providers 4

6 may not only fail to compete on price and quality in the manner anticipated by policy-makers but may actually leverage product complexity to extract additional economic rents (Sandroni and Squintani 2007; Ho, Hogan, and Morton 2014; Gabaix and Laibson 2006; DellaVigna and Malmendier 2004; Heidhues and Koszegi 2014). The widespread lack of health plan literacy also speaks to the importance of simplification and appropriate decision-aids. Among both employees and our experimental subjects, those with low literacy or low self-reported income made inferior plan choices. In the experiments, simplification and, to a far greater extent, educational decision-aids not only improved choice quality, but reduced differences in choice quality across participant sub-groups. Yet, the persistence of a non-trivial share of poor choice across our studies even with aggressive treatments, nearly 30% of participants continued to select dominated options implies a ceiling in the efficacy of even the most benevolent of choice settings. Ultimately, to the extent that policymakers are concerned about consumer welfare and competitive prices, it may be necessary to move beyond simplifying choice environments towards explicitly restricting choice to plans that are suitable for a particular consumer, or even requiring providers to simplify, and standardize, the structure and incentives that underlie insurance products (Loewenstein and Volpp 2011; Bhargava and Loewenstein 2015). More broadly, our study presents an important challenge for the sophisticated set of methods that has recently emerged to estimate risk preferences and evaluate welfare from consumer choices in insurance (see Einav, Finkelstein and Levin, 2010 for a review). The approach of this literature is to estimate risk from empirical models of insurance demand in which an individual s choice of coverage is, in part, determined by her tolerance for risk and risk exposure. Our setting, in which employees are asked to make active choices from a plan menu of dominated options, provides the first unambiguous test of this paradigm. The majority of choices we observe, by employees and the participants in our online studies, cannot be rationalized with models of informed decisions even permitting non-standard preferences for risk, or distorted beliefs about health expectations. Our online experiments also offer no evidence for a correlation of risk preferences with the choice of insurance coverage. The implication that risk may not easily be inferred from insurance choice suggests the need for amended behavioral models of insurance choice grounded in the psychology underlying such decisions. Our work builds on several interconnected literatures. Our primary analysis of plan choice and inertia follows up on studies that have documented sub-optimal health plan decisions by seniors and inertia in plan choice over time. Unlike the complex environment of Medicare Part D, which features a wide variation in plan price, coverage, and design, and requires consumers to make complicated multiattribute comparisons, we investigate choice in highly standardized setting. The experiments we use to explore decision-making mechanisms, and to identify possible strategies to improve choice, parallel other 5

7 studies in which subjects are asked to make choices from hypothetical plan menus (Johnson et al. 2013; Schram and Sonnemans, 2011; Bhargava, Loewenstein and Benartzi 2014). In documenting the pervasiveness and consequences of low health plan literacy, we contribute to a growing literature that engages the possibility that individuals may misconstrue or ignore important health incentives (e.g., Loewenstein et al. 2013; Winter et al., 2006; Handel and Kolstad 2013). Our findings on the adverse effects of complexity, broadly defined, on choice quality, and the potentially regressive costs of complexity, is in line with other demonstrations of the effects of complexity in a range of economically important settings. 5 Finally, our challenge to the traditional practice of inferring risk inferences from standard models of insurance demands relate to other challenges involving cognitive limitations and search frictions (Fang, Keane and Silverman, 2008; Handel and Kolstad, 2014; Spinnewijn, 2014), non-standard risk preferences (Koszegi and Rabin, 2007; Sydnor, 2010; Bordalo et al.., 2012; Barseghyan et al., 2013, 2014) and decision heuristics on insurance choices (Ericson and Starc, 2012). Our findings imply that consumer demand for insurance systematically departs from the choices implied in the standard model in a manner that has far different implications for policy and welfare than models which include white-noise parameters or choice-heuristics based on plan cost. SECTION 2. DATA AND INSTITUTIONAL BACKGROUND In our main analysis, we draw on administrative data on medical claims and plan choice for 2010 and 2011 from a Fortune 100 firm whose identity we suppress for confidentiality. This section summarizes relevant institutional detail, the data, and descriptive statistics. We separately describe the data and participant characteristics for the mechanism experiments in Section Background and Institutional Detail Structure of Health Plan Menu. The firm, in 2010, replaced its existing menu of three plans with a highly varied bundle of plan attributes (Basic, Plus, Premium), with a Build Your Own regime in which employees were offered a choice from a standardized menu of 48 plans (i.e., Plan 1 to Plan 48 ). For employees choosing single coverage, the focus of our analysis, these plans represented the full conjoint of available options across 4 deductibles ($1000; $750; $500; $350), 3 levels of maximum-outof-pocket spending ($3000; $2500; $1500; MOOP), 2 coinsurance rates (80%; 90%), and 2 office copayments ($15 for Primary Care Visits / $40 for Specialist Visits; $25 for Primary Care Visits / $35 for Specialists). Out-of-network, all plans featured a $3,500 deductible a $7500 out-of-pocket maximum and 5 These include studies that examine the effects of informational complexity on choice in domains ranging from school choice (Hastings and Weinstein 2008), retirement savings (e.g., Choi et al. 2009), and take-up of social benefit programs (Bhargava and Manoli 2012). 6

8 either a 50% or 60% coinsurance rate depending on the choice of in-network coinsurance. Beyond the described variation in cost-sharing, plans were otherwise identical. In the following year, the set of available plans did not change with respect to their cost-sharing features. Table 1 reports details for the plan menu. 6 Plan Pricing and Dominated Choices. Our ability to characterize choice quality rests on the price domination reflected in plan menus and a high degree of plan standardization which facilitates easy comparisons across plans. For example, Plan 13 is identical to Plan 37, except in the deductible level which varies by $500. Plan 13 (with the $500 deductible) costs $638 more in annual premium than Plan 37 (the $1,000 deductible). Because the difference in plan premiums exceeds the difference in deductibles, Plan 13 is financially dominated by the otherwise equivalent plan with the $1,000 deductible. Of the 36 low-deductible plans, 35 are financially dominated as indicated by the highlighted sections of Table 1, with the premium of Plan 24 falling $20 short of a fully dominated plan menu by deductible. As an alternative depiction of dominance, Figure 1 displays the cost schedules for the 24 plans with $25 office copayment (the price schedules for the 24 plans with the $15 copay level are nearly identical and are available from the authors on request). 7 Each panel of the figure depicts how the total costs of health care for the employee (i.e., premium plus out-of-pocket costs) varies with total medical spending for the four different deductible levels within each set of remaining cost-sharing features. A plan is dominated if the plan s cost schedule is always below that of another plan within the same panel. The figure offers graphical illustration for the dominance of the $1,000 deductible plans, relative to lowdeductible equivalent plans. The only exception is the plan with the $500 deductible depicted in Panel A (the same Plan 24 mentioned above). Given that health-insurance premiums are generally tax deductible, while out-of-pocket expenses are not, plans that appear to be dominated on a nominal basis may not be strictly dominated after adjusting for an employee s marginal tax rate. Table 1, which also depicts plan dominance using the average marginal tax rate across employees of 19% to adjust for premium deductibility, shows little erosion in the share of dominated plans due to tax adjustments in that 30 plans remain dominated. When feasible, we report our analysis of plan choice after adjusting for taxes using estimates of employeespecific marginal federal income tax rates. Our analysis includes a description of plan switching by employees in While the 2011 plan menu was identical with respect to the structure of plans, plan prices grew by an average of 31% across plans and this increase was fairly consistent across plans by level of cost-sharing. The consistency in this 6 Plan prices feature small differences across geographic area and business units. Prices are averaged across geographies and business units (but not coverage tier) for our analysis. According to the Firm, such price differences are modest, and do not meaningfully affect price differences across plans for a given geography area x business unit. 7 These schedules report plan costs assuming no office visits. Given that office visits are priced identically in each panel, the relative pricing of plans by deductible is insensitive to the number of visits. 7

9 price increase actually led to an increased degree of price domination in 2011 such that, without tax adjustment, all 36 low deductible plans were financially dominated. Plan Enrollment. During the open enrollment period in May 2010, eligible employees, excluding new hires, were asked to enroll in a medical plan for Plan Year 2010 extending from June 1 st, 2010 through May 31 st, For simplicity, we refer below to plan years by the year in which the selection was made (e.g., 2010 refers to PY 2010). Eligible new hires were permitted to choose a plan outside the enrollment period, after a three month waiting period, unless the hiring date was proximal to the enrollment period. Given that plan options changed in 2010, employees were encouraged to make an active choice into a new health plan. If an employee with existing coverage did not actively elect a new plan, he or she was defaulted into Plan 48, which had the maximum possible cost-sharing on each dimension and, importantly, was not dominated. Default effects, therefore, weighed against choice of a dominated plan. While we cannot distinguish enrollment into Plan 48 due to default from an active election, given intensive marketing effort prior to open enrollment, the firm reported that active choice of plans was high. Our estimate, based on the plan choice of new hires, is that active choice was 90%. 9 While there was a default option available for existing employees who did not visit the enrollment interface, the interface itself did not feature a default option. The online interface through which employees enrolled in a plan was designed to emphasize the sense that employees could build their own health plan feature by feature. Employees were asked to build candidate plans by sequentially selecting levels within each of four cost-sharing attributes, (e.g., Which annual deductible meets your needs? ), after which plan features and the monthly cost was displayed. Employees were repeatedly urged to consider the tradeoffs between price and coverage (e.g., Remember, a lower deductible means higher annual paycheck costs ). After building a first candidate plan, employees had the option of enrolling in that plan or building subsequent plans iteratively added to a plan comparison matrix. As such, the interface encouraged side-by-side comparisons of plans, but did not facilitate comparisons of marginal differences across plan attributes. The interface offered employees the option of viewing the entire plan menu in a link but it was not prominently displayed Data on Plan Choice, Health Spending, and Employee Characteristics Overview of Data. The data set includes, for each benefit-eligible employee in 2010, the plan choice they made, their medical utilization and spending (subject to restrictions enumerated below), but only their plan choice for Utilization data summarizes employee visits to a primary care physician, 8 Employees could change plan elections outside of open enrollment only in the event of a change in qualified status (e.g., birth of a child, or change in marital status). 9 Fitting a model of plan choice with new hires, we estimate that 5% of the 15% of enrollees who chose Plan 48 would have chosen the plan through active choice, implying that 10% of employees defaulted into Plan 48. 8

10 specialist, and ER and for preventative care. Medical spend data reflects total medical expenses for each employee as well as the decomposition of spending into the share of employee s out-of-pocket expenses and the residual expenses covered by the firm. Importantly, the firm additionally estimated counterfactual medical spend, for both the member and firm, associated with each of the 47 plans not chosen by the employee (assuming fixed employee utilization). These estimates assume prices that are averaged across different locations and, as such, obscure the geographic price variation that likely exists. We obtained additional employee-level demographic and health characteristics including age range, gender, salary band, location (3 digit zip code), start year of employment, position at the firm, length of firm tenure, and the presence of pre-existing chronic medical conditions. Sample Restrictions. Starting with the original set of benefit eligible employees, the firm generated a restricted sample for analysis using three screens. First, in order to simplify the calculation of medical spending, the sample was restricted to employees continuously enrolled for the entirety of the plan year (June 2010 through end of May 2011). Second, for data integrity, employees who changed plans outside of open enrollment due to a life changing event were excluded. Finally, a small number of employees were excluded due to incomplete basic demographic information Summary Statistics After imposing the sample restrictions, the resulting data describe plan choice, utilization, and medical care spending in PY 2010 for 51,192 employees, of whom 23,894 are employees with singleonly coverage. Table 2 reports summary statistics for this latter sample. Overall, the sample is disproportionately female (71%), and only 7% of employees were newly hired in The average premium for employees, $1,205, is in line with the $999 national estimate for the average single-coverage employee premium, while the plans offered by the firm have lower deductibles and cost-sharing than typical firms of its size. 10 The firm covers approximately 45% of total employee medical spending, and the average per capita employee spending of $3,567 is slightly lower than the $4,547 national per capita average for enrollees of employee sponsored plans. 11 SECTION 3. ANALYSIS OF PLAN CHOICE AND SWITCHING In the previous section we introduced the plan menu offered by the firm and described how the majority of plan options with lower deductibles were financially dominated. In this section we document employee choices and the financial consequences of those choices. 10 National averages are reported in the 2013 Kaiser Family Foundation study of Employer Health Benefits. 11 Comparison is based on figures reported in the Health Care Cost Institute s 2011 annual report which is based on an analysis of medical claims data for approximately 40 million employees. The report is available at 9

11 3.1 Plan Choice Patterns Figure 2 presents histograms of plan choice by employees electing single coverage for Despite the financial domination of nearly all low deductible plans prior to tax adjustment, 63% of employees selected a low deductible (Panel A). After tax-adjustment using the inferred marginal tax rate for each employee based on their reported salary range, 55% of employees selected a plan that was financially dominated by another available plan option, and 27% of employees chose $350 or $750 deductible plans that were typically dominated by a large extent. The focus on deductibles alone, however, obscures meaningful patterns in plan choices. Panel B of the figure depicts the distribution of choice across all 48 plan combinations ordered by the degree of plan cost-sharing (by deductible, out-ofpocket maximum, coinsurance, and then copayment). The wide variety of chosen plans every one of the 48 plans has a non-trivial share of enrollees is strong evidence that the online enrollment process did not privilege the choice of any particular plan or plan attribute and further suggests that employees exhibited a range of plan preferences and/or search strategies. The single most popular plan was the default option, Plan 48, which was the least expensive and featured the highest degree of cost-sharing on all dimensions. We cannot unambiguously distinguish between those actively choosing Plan 48 from those defaulting into the plan, but we can estimate the fraction of those actively choosing Plan 48 by examining the plan choice of new hires, who all had to actively select plans. This comparison suggests that of the 15% of employees enrolled in Plan 48 about 5% chose it actively, while 10% chose it simply because it was the default. The choice patterns of Figure 2 reveal what appears to be a number of distinct strategies governing the selection of plan attribute combinations. Among employees opting for the expensive $350 deductibles, most appeared to minimize cost-sharing across all dimensions, and the most conservative, lower MOOP, lower copay and higher coinsurance option was the modal choice. Employees who chose the $500 and $750 deductible levels, in contrast, chose plans consistent with the desire to balance across cost-sharing dimensions. The modal plan for employees selecting both the $500 and $750 deductibles, for example, included the mid-level MOOP ($2,500). Ignoring the default option, such balancing is also evidenced among employees choosing the $1,000 deductible where a significant share of employees chose the high-cost sharing MOOP ($1,500). This coherence in attribute patterns suggests that employees may have had some understanding of the tradeoffs between the level of coverage associated with plan attributes and plan premiums, a possibility which we explore in greater detail later in the paper. 3.2 Savings from Counterfactual Plan Choice While characterizing the degree of dominated plan choice does not require knowledge of an employee s health spending, such spending is useful in assessing the financial consequences of these 10

12 choices. For example, consider that for an employee paying an additional $501 in premiums to lower the deductible from $1,000 to $500, the magnitude of excess spending due to plan domination could be as high as $501 or as low as $1 depending on the employee s use of medical care for the year. Figure 3 presents an analysis of the financial consequences of employee plan choices using data on health spending. Each panel in the figure compares the distribution of actual total employee spending (premium plus out-of-pocket health-care costs) to estimated spending given a distinct counterfactual plan choice. Counterfactual spending is calculated at the individual level for each employee on a tax-adjusted basis and assumes that the utilization of each employee would be unchanged across plans, or equivalently that employees are not subject to moral hazard in their utilization of care. Although health insurance plans with lower deductibles likely result in some degree of moral hazard, it is generally difficult to disentangle moral hazard from adverse selection (Einav and Finkelstein, 2011). If present in this setting, moral hazard would imply that our analysis would underestimate the financial consequences of plan choice. Such underestimation would arise since a share of the spending associated with low cost-sharing plans might be deemed unnecessary in the event of the shift to the high-cost sharing plan and could lead to even greater savings for such individuals. The first panel of Figure 3 depicts potential cost-savings for each employee currently in a low deductible plan, relative to a switch to the otherwise equivalent plan with a $1,000 deductible (i.e., same MOOP, coinsurance, and copayment). We show the empirical cumulative distribution of this net savings separately for each of the three low deductibles. The lines associated with the choice of $350 and $750 deductibles both start above $0, indicating that, consistent with the earlier demonstration of dominance, all employees in such plans would have benefited from the prescribed plan switch. Among employees who chose plans with $350 deductibles, the average savings amounts to $590 with an inter-quartile range of $439 to $843. The top 10% (generally those with little to no health expenditures) would have saved over $1,000. The average potential savings for those selecting plans with the $750 deductible is $343 (IQ range of $239 to $430), and for those choosing $500 deductibles, the average savings is $159 (IQ range of $102 to $502) inclusive of the 2% of employees with negative potential savings reflecting the absence of financial domination for all of these plans. Overall, we find that the individuals who selected plans with deductibles lower than $1,000 could have saved $353 in after-tax dollars had they chosen the $1,000 alternative with virtually no risk of losing money. Considering that over half of these employees have annual salaries below $30,000, the $353 in potential after-tax savings is likely of significant economic value. We calculate that the potential savings for employees selecting dominated plans represents an average of 2% of the employees annual salaries and 42% of the annual premiums paid by the typical employee. 11

13 In Panel B we present a similar analysis but consider potential savings relative to the actuarially best plan associated with the lowest average spending across all employees (Plan 41 with a $1,000 deductible, $2,500 MOOP, 90% Coinsurance, $25 Copay). 12 This exercise permits us to investigate the benefits of moving all employees to a single plan. While Plan 41 does not fully dominate the other options, 84% of all employees, and 97% of those with lower deductibles, would have benefited or been left no worse off, under the contemplated switch. Across employees, average savings would have amounted to $320 including $448 for those in low deductible plans, and $103 for those with the $1,000 deductible. The largest loss for any single employee under the projected switch is less than $1,000 and no more than 5% of employees would lose more than $20. These results suggest that, assuming fixed plan prices, an informed third-party could have made a simple and generic plan recommendation that would have benefited the vast majority of employees. Finally, we replicate the analysis but with Plan 48, the default plan option for employees and the plan with the highest cost-sharing, as the counterfactual plan. We estimate that such a plan switch would have benefited, or left unharmed, 85% of employees, and would produce an average savings of $182 for each of these employees. As with the other counterfactuals, most of these savings would have accrued to those presently in low deductible plans, for whom savings would have averaged $283. Relative to the other counterfactuals, the switch to this highest cost sharing plan would have generated greater risk of excess spending with a maximum increase in spending of about $1,600 and with 5% of employees spending an additional $650 or more. Nonetheless, the large share of employees, and particularly those currently with low deductibles, would have benefitted from simply being placed in the default plan. 3.3 Heterogeneity in Choice and Counterfactual Savings The consequences of poor plan choice vary significantly across employees by employee demographics. Figure 4 displays the share of employees choosing dominated plan options by a primary dimension of interest employee salary (Panel A). While a significant share of employees at every salary level chose dominated plans, employees in the bottom two salary bands (i.e., $0 to $20k, plotted as $10k, and $20 to $30k, plotted as $25k), representing over half of all employees, were disproportionately likely to have chosen dominated plans. Using the actuarial best plan (Plan 41) as a counterfactual, the second panel of the figure displays the average potential plan savings for each employee relative to employee salary (Panel B). For the 19% of employees in the lowest salary band, the plot implies average savings amounting to over 4% of annual salary while for the 33% of employees earning from $20 to $30k such savings represents 1.7% of salary. 12 Only 1% of employees actually selected this plan and 26 plans were chosen more frequently. 12

14 Table 3 reports the heterogeneity in dominated plan choice across a broader set of employee characteristics. Each column represents a separate regression in which the dependent variable in the first column is an indicator for dominated plan choice, and in the final two columns is the magnitude of potential savings from a switch to a counterfactual plan (with premiums adjusted for tax deductibility in all cases). These regressions reinforce the pattern evident in Figure 4 in demonstrating a significant gradient in choice quality by salary -- lower-salary employees were 24 to 30 percentage points more likely to choose a dominated deductible than the highest salary employees -- and also reveal some other interesting patterns. Female employees were 6 percentage points more likely to choose dominated plans, and, conditioning on other characteristics, older, more highly tenured employees, and those with chronic conditions were all more likely to select dominated plans. Because the dominated plans in this setting are those offering the highest coverage (i.e., low cost-sharing), if people choose naively here, the gender and age difference in decision quality may be consistent with prior work documenting the preference of females and older employees for low cost-sharing plans. The second column of the table shows how these characteristics predict the expected counterfactual savings that employees could have achieved by switching to a $1,000 plan deductible, holding other plan features constant. For this regression we include all employees and code the potential savings for those presently with a $1,000 deductible as $0 by construction. These estimates are consistent with earlier patterns with respect to employee income, age, and tenure, but reveal a different pattern for women and those with chronic conditions. Although these groups were more likely to choose plans that were financially dominated, they could expect to save less by switching to a high deductible plan given their higher relative levels of health spending. The final column considers the expected savings from a switch to Plan 41 and yields similar patterns to the choice estimates, and with generally larger marginal effects, which suggests that the same characteristics that predict the choice of a dominated deductible also tend to predict the choice of plans with lower average value on other dimensions as well. 3.4 Employee Plan Switching Do employees improve plan choice over time? In the second year of the build-your-own plan regime, the firm offered an identical set of plans to employees but with plan prices which increased by an average of 31%. The change in plan prices led to a slight increase in plan dominance such that all 36 plans were financially dominated (on a tax-unadjusted basis). Employees, who were insured in 2010, but did not actively choose a plan in 2011 were defaulted into their existing plan. The stability of the plan menu permits us to examine whether employees improved plan choices the year following their original plan choices. 13

15 Figure 5 summarizes switching behavior for employees by deductible choice. Overall, 77% of employees kept their existing plan, consistent with numerous studies documenting consumer inertia in insurance choices (e.g., Strombom et al. 2002; Frank and Lamiraud, 2009; Sydnor, 2010; Handel, 2013; Ericson, forthcoming). Those with low deductible plans were more likely to switch plans relative to those with the $1,000 deductible, particularly when considering plan switches that involved a change in deductible. However, switching rates were not higher for employees in the $350 and $750 deductible plans for whom the benefits of switching was the highest, as compared with those with $500 deductibles. Switching generally resulted in higher deductibles, but not always to the optimal $1,000 deductible. Overall, the switching that occurred was beneficial. Finally, in light of the significant heterogeneity in choice quality by employee income, it is natural to ask whether lower or higher income employees are more likely to switch into efficient plans in the following year. We find that employees in the lowest two salary bands are actually significantly less likely to switch plans, with a switching rate of 18%, relative to higher income employees who switch at a rate of 28% (p <.01). Among those who do switch, low income employees are also significantly less likely to switch into the $1,000 deductible. Indeed, the considerable plan inertia in this setting, if anything, serves to exacerbate the already substantial differences in choice quality across income groups. SECTION 4. MECHANISMS UNDERLYING POOR CHOICE Why did employees make poor plan choices? We test four explanations through a series of experiments in which we ask online participants to make hypothetical health plan choices from stylized plan menus. A first possibility, in light of research on the adverse effects of too much choice (see Botti and Iyengar 2006 for a review), is that the size of the choice set, or the complexity of the enrollment interface in place at the firm, which may have made comparisons across selections difficult, led employees to choose sub-optimally. Beyond assessing the role of search complexity, we additionally explore whether deficits in insurance literacy, low search motivation, and heuristic choice strategies are responsible for the observed choices. The results of these studies point to two main conclusions. First, the severity of poor plan choice, which was only possible due to the high fraction of disadvantageous options in the plan menu, was significantly shaped by a fundamental and widespread deficit in participant ability to understand cost-sharing concepts and to financially compare plans and only modestly driven by search complexities. Second, deductible choices appear consistent with a heuristic choice strategy in which consumers sorted themselves into, often disadvantageous, plans based on their perceived relative health rather than true financial value. 14

16 4.1 Candidate Explanations for Poor Plan Choice Our first experiment tested whether search frictions induced by the complexity of the plan menu and the enrollment interface contributed to poor decisions. We broadly interpret such search complexity to encompass the size of the plan menu, the number of attributes characterizing each plan, and the ease with which employees could compare plans. Search frictions may be particularly relevant in the setting we examine, given that interface may have discouraged appropriate plan comparisons. In our second experiment, drawing on a wide range of prior research, we test two additional mechanisms to explain poor plan choice. First, we consider whether poor plan choice is the result of deficits in health insurance literacy (e.g., Loewenstein et al. 2013; Handel 2013). We interpret literacy to include definitional knowledge of cost-sharing features (e.g., the ability to define and identify a plan s deductible and coinsurance rate), the conceptual ability to apply definitional knowledge to evaluate and compare the financial value of plans (e.g., recognizing that the difference in plan deductibles, fixing other cost-sharing parameters, signals the maximum difference in potential benefit across plans), and the computational ability to carry out required calculations. Second, we examine the possibility that poor choice may result from insufficient motivation on the part of employees to search and compare plans. Such a deficit might result, in turn, from a false belief that the employer would not offer plan options of transparently lower economic value. Finally, a third experiment explores the possibility that consumers may rely on a heuristic choice strategy to navigate the plan choice. The possibility of such heuristics is hinted at by a range of studies that have demonstrated the sensitivity of choices to the configuration and framing of the choice menu (e.g., Tversky and Kahneman 1974; Slovic 1995; Ariely, Loewenstein, and Prelec 2003), research that suggests that, in the absence of fully formed preferences, individuals may rationally infer the appropriate choice from the information contained in the choice menu (Kamenica 2008; Prelec, Wernerfelt, Zettelmeyer 1997), or may be drawn to relatively salient choices in such a menu (Bordalo, Gennaioli, and Shleifer 2012). Finally, we address, although largely dismiss, the possibility that the observed patterns may be the result of preferences that may privilege dollars spent out-of-pocket over dollars deducted from one s payroll. 4.2 Search Complexity (Experiment 1) In our first study, conducted in June 2014, participants were paid to take an approximately 10 minute survey in which they were asked to select an insurance plan from a hypothetical plan menu. The stylized menu featured fewer plans than the actual firm s menu but reflected the same degree of price domination. While our study was not incentive compatible, in similar studies other researchers have detected no differences in choice quality as a function of incentive compatibility (Johnson et al. 2013). 15

17 The size and structure of the plan menu, as well the effort required to compare plans, was randomized between subjects in order to test how transitioning from a fairly complex interface, roughly approximating the firm environment, to a highly simple interface, influenced the quality of decisions. Participants. The first study involved N = 2,379 U.S. participants drawn from the Qualtrics Online Sample. Of 3,895 participants who began the survey, 1,516 participants failed an early attention screen and were not invited to complete the instrument. 13 The final sample, while not strictly representative of the US population, was diverse across gender (57% female; 43% male), age (M=46.5, s.d. = 11.1), education (48% college graduate; 33% some college; 18% high school or equivalent), race (84% white; 9% black; other 8%), and inferred income (M = $67,700; s.d. = 26,900). Much like the employee sample in the main analysis, participants were predominately full-time employees (91% fulltime; 3% part-time; 6% unemployed or student) who had employer-provided insurance (86% employer insurance; 9% insured but not through employer; 5% uninsured). Overall, the experimental sample was older and wealthier than the employees in the main analysis. Research Design. The study, hosted on the Qualtrics platform, required participants to provide background information on their demographics and health, after which they were asked to imagine that they needed to select a (single coverage) health plan from a plan menu presented to them by their employer. The menu featured plans resembling those of the firm in price and in cost-sharing features, but featured fewer plans and were characterized by a smaller number of attributes. Mimicking the actual firm interface, participants were presented with a table that defined each attribute and were instructed to consider their expected health usage when choosing a plan. 14 To test the link between choice quality and complexity, we randomized, in a conjoint design, the choice interface across three dimensions: whether plan premiums were expressed annually or monthly, whether menus featured plans differing across two attributes (i.e., four deductibles and three MOOPs resulting in twelve options), or a single attribute (i.e., four deductibles resulting in four options), and whether options were displayed simultaneously on a single table, permitting easy comparisons, or instead displayed sequentially by attribute. 15 In the latter condition, designed to parallel the experience of firm employees who used the company-provided web decision tool, participants were asked to make each attribute choice separately, after which the resulting plan price was displayed. Participants could then finalize a choice or continue building another plan 13 The screen involved a question with introductory text and 4 response options. The last line of the text asked participants to not click on any response but instead, to simply click on next (unlike other forced-response questions, in this question, participants were permitted to click next without indicating a response option). We pre-committed ourselves to not collecting any data from anyone who failed the attention screen. 14 Participants were told that plans were equivalent apart from the attribute variation displayed in the menu, and that each plan included a modest copay for doctor visits. 15 In the menu featuring plans varying across only deductible, participants were told to assume a $1,500 out-of-pocket maximum. 16
, age (M=46.5, s.d. = 11.")
18 through the same sequential process. 16 Examples of interventions are displayed in the Appendix (Figure A1). Results. An initial outcome of the study, which speaks to the ecological validity of the online setting, is that the overall distribution of participant deductible choice resembled that of employees in the main analysis (Figure 6, Panel A). The second panel of the figure reports decision quality, reflected by the share of $1k deductible choice, across experimental interfaces varying from the complex analogue faced by firm employees (2 attributes, sequential choice, monthly premiums) to a highly simplified menu featuring four plans characterized by a single attribute and annual premiums. The share of non-dominated plan selection across this gradation of complexity suggests significant gains from increasing the ease of plan comparisons through the simultaneous display of plans (p = 0.01). Further simplification through the display of annualized premiums, or the movement from 2 attribute choices (and 12 plans) to a single attribute (4 plans) did not improve choice quality. Strikingly, of participants presented with the simplest menu featuring 4 plans varying by deductible and annualized premium, 66% of participants chose a financially dominated plan option. Much like the employee setting, we observe considerable heterogeneity in the quality of choices by participant income. In a linear model of overall response across conditions, controlling for other observable demographics, we estimate that those reporting annual earnings of less than $50k make inferior choices to those earning greater than $80k (p < 0.05). 17 Simplification also appeared to disproportionately aid participants of low income (Panel C). 4.3 Insurance Literacy and Search Motivation (Experiment 2) While the first study offers modest evidence of the role of menu and interface complexity on choice quality, our second experiment presented participants with relatively simple plan menus, to investigate whether literacy of health insurance concepts and economic motivation to scrutinize plans affects decision quality. The study, therefore, tests the possibility that it may not be the complexity of plan search, but the more fundamental complexity of the structure of insurance that leads to inefficient choices. Participants. The second experiment, conducted in July 2014, involved N = 624 U.S. participants who were recruited from the same panel as the first study and subject to the same attention screen. The final sample again reflects a diversity of gender (56% female; 44% male), age (M=49.8, s.d. = 12.3), education (39% college graduate; 38% some college; 21% high school or equivalent), race (86% 16 We note, however, that while this condition was designed to most clearly mimic the setting at the firm we study, we suspect that introducing sequential choices is especially likely to cause low effort in a hypothetical setting, as there is no compelling reason for a participant to go back and build another plan. 17 We elicited income in five ranges, but we consolidate the highest two income categories ( income greater than $120k, and income between $80k to $120k) for increased power and analytic tractability. 17

19 white; 7% black; other 7%), and inferred income (M = $50,600; s.d. = 30,700). Participants in the second study were more diverse in employment (43% full-time; 13% part-time; 43% unemployed) and insurance status (37% employer insurance; 52% insured not through employer; 12% uninsured) than either the original study or the empirical sample. Research Design and Protocol. The second experiment featured a similar structure and design of the first study but included assessments of literacy and beliefs. The former was implemented by presenting participants with a short narrative scenario of a recent health insurance enrollee in which they were asked to identify various health insurance concepts (i.e., deductible, out-of-pocket maximum, coinsurance and copayment). We assessed participant beliefs regarding the possibility of facing plan options of low financially value by asking: When enrolling in health insurance, typically you would be asked to choose from a set of health plans with very different prices (premium). What would you expect to be true about these plan options? Participants could indicate that the price differences usually reflect differences in quality or coverage ( you get what you pay for ), do not reflect such differences ( many plans are simply a bad deal ), or uncertainty about what to expect. To experimentally test whether improving health literacy and search motivation might affect choice quality, subjects were randomized into one of three conditions in which they were asked to make a choice from a menu with 4 plan options (varying by deductible) and then 12 plan options (varying by deductible and MOOP). All menus featured low deductible options which were dominated by the highest deductible plan. Prices were approximated from the firm menu, but differed nominally across the two menus to avoid presenting participants with identical plans. In the control condition, participants were simply asked to make the two plan choices, while in a second condition, prior to choosing, participants were urged to carefully consider their decision due to the financially consequences of such choices, and were informed that the typical employee decision facing such a menu resulted in about $500 of excess spending. In a final condition, participants were guided, prior to the choice, through a scenario-based tutorial offering instruction as to how to compare the financial value of plans, including a quiz, and a rule-of-thumb to help participants avoid financially dominated plans. 18 Results. A majority of the study participants did not report suspicions that plan menus contain options of low economic value. 19 Moreover, as evident in Figure 7, Panel A participants who believed that offered options might differ in quality (indicated by the bars marked Suspicious ) were only marginally less likely to choose dominated options. The same pattern can be seen in the weak correlation between belief in low value plan menus and choice quality (in the single attribute choice, pair-wise 18 Participants were informed that if other plan features were identical, a dominated plan can be detected by comparing the difference between plan deductibles and plan premiums % expected plans to typically feature such options, 54% believed that price differences typically reflect quality differences, and 18% were unsure. 18

20 comparison not significant; in the two attribute choice, pair-wise comparison, p < 0.10). Lastly, as can be seen in Figure 7, Panel B (bars labeled motivate ) cautioning individuals that the choice they face may be consequential did not improve choice. In sum, while we document widespread ignorance of the possibility of dominated plan options, we find only weak support for the idea that employees beliefs that all options are about equally good is driving poor plan choice. Turning to the impact of literacy, we found that, echoing earlier work, 71% of participants were not able to identify the basic cost-sharing features from a simple health scenario. 20 Moreover, literacy, in contrast to skepticism about the quality of plan choices, was highly predictive of participant ability to detect dominated plan options (both pairwise comparisons, p < 0.01), as can be seen in the right hand graph of Figure 7, Panel A. Providing further support for the importance of literacy, the, admittedly heavy-handed information interventions aimed at improving literacy (see Appendix for experimental materials) significantly improved choice quality relative to the control (both questions, p < 0.01). Moreover, as revealed in Panel C of Figure 7, the education intervention led to larger relative increases in response quality for those of low, as compared to high, baseline literacy. As in the first study, we observe a ceiling in choice quality 30 to 40% of participants persisted in poor choices regardless of intervention however aggressive. 4.4 Price and Health Determinants of Plan Choice (Experiment 3) The first two experiments found that a majority of participants made poor plan choices even from extremely simple menus. While most participants suffer from low plan literacy, given that individuals in these settings do not appear to choose plans randomly but rather sort into plans on the basis of healthcare usage, we conduct a third study in which we systematically vary relative plan prices, between-subjects, to better understand the factors contributing to insurance demand. Participants. The third experiment, a 15 minute online survey, was completed by a sample of N = 734 participants recruited from Amazon Mechanical Turk in December The sample was again diverse across demographic characteristics such as gender (49% female; 51% male), education (49% college graduate; 40% some college; 10% high school), and race (76% white; 7% black; 17% other) but is somewhat younger (M=36.5, s.d. = 12.0), and of lower inferred income ($40,940, s.d. = 19,117). 80% of participants had health insurance, and 59% were employed full time. Research Design and Protocol. The study was similar in structure to earlier experiments in capturing a range of demographic characteristics, but included a number of additional questions designed to assess perceptions of participant healthiness relative to peers ( Extremely Healthy, Fairly Healthy, 20 We counted inverted responses for the coinsurance question as correct, otherwise 82% of participants failed to identify the four cost-sharing principles correctly. 19

21 Somewhat Healthy, Unhealthy ), financial literacy, using two commonly used elicitations as discussed by Lusardi (2008), as well as a series of other questions constructed for a separate research study on risktaking. 21 The survey s main outcome of interest was plan choice from a simple menu featuring four plans characterized by a deductible and an annual premium (and otherwise identical). In a baseline condition, presented in Table 5, we presented a menu featuring four popular plans from the firm s menu (Plans 46, 34, 22, and 10) which spanned the range of available deductibles ($350, $500, $750, $1,000) and shared other cost-sharing features. In the second condition ( expensive ), we fixed the annual price of the $1,000 deductible ($817) but increased the costliness of reduced cost-sharing by pricing the low deductible plans so that the marginal cost of each dollar of reduced deductible, relative to the high-deductible option, was 125% of the original marginal cost. That is, while the original $750 plan cost $1321, or $504 more than the $1,000 plan, in the expensive condition, this plan was priced at $1447 which reflects a $630 differential. In a third condition ( cheap ) we adjusted prices so that the marginal cost of a reduced dollar in deductible was only 75% as costly as the original marginal cost. Notably, across these conditions, all low-deductible plans were financially dominated by the $1,000 plan except for the $500 deductible in the Cheap menu which fell $49 short of being dominated. Results. The third experiment yielded three notable patterns. First, once again the distribution of choice across deductibles was similar to that exhibited by the employees at the firm. Second, leveraging the variation in pricing across conditions, the experiment offers insight into the factors that shape plan choice. To explore the determinants of insurance demand we fit a simple model of insurance demand to data from the study: HighDeduct i = α + φ p Health Rank p i + γliteracy i + πmenu_cheap i + ΔMenu_Exp i + Xλ + ε i where HighDeduct i refers to the choice of a $1,000 plan deductible, X denotes flexible controls for participant gender, age, salary range, employment status, and marital status for each participant, i, financial literacy is coded as 1 for the 54% correctly answering both literacy questions, and 0 otherwise, HealthRank denotes the perceived category of relative healthiness, p, and covariates additionally test for the effect of the experimental variation in menu prices on residual plan choice. The results of the estimation, reported in Table 5, suggest that demand for the high deductible plan, even across menus where nearly all of the low-deductible options were financially dominated, is moderately sensitive to price differences in the costliness of plans, and highly sensitive to one s perception of relative health. Participants are significantly more likely to report that they would purchase 21 The study was a part of a larger survey originally administered for separate on-going research examining risk preferences and driving behavior conducted by Bhargava and other coauthors. Subjects in this survey were screened on ownership of a vehicle and were restricted to those 21 years and older. 20
22 low deductible alternatives when the high deductible is relatively more expensive (pairwise comparison between cheap and expensive plan menus, b = 0.107, p < 0.05), while those believing themselves to be extremely healthy are about 15 to 19% more likely, conditioned on demographic characteristics, to choose the high deductible plan. Finally, the study once again points to the role played by literacy (in this case financial, rather than health) in plan choice. Participants who answered the financial literacy questions correctly, even conditioned on demographics including income, were significantly more likely to choose the $1,000 deductible plan. We additionally find that more literate participants were more highly sensitive to variations in price and perceived health than their lower literacy counterparts. 4.5 Discussion of Mechanisms Overall, the experiments offer a potentially compelling explanation for why employees make costly plan choice mistakes. While there are modest benefits to facilitating plan comparisons (Experiment 1), the studies largely demonstrate that even with highly simplified menus featuring a small number of plans and plan attributes, a majority of participants fail to detect dominated plans. Moreover, the widespread lack of health literacy, financial literacy, and low awareness that plan menus might contain dominated plans point to the likelihood that most employees were unable (or potentially unmotivated) to appropriately compare the financial value of plans. Despite this inability, all of the studies confirm the patterns from the employee sample in establishing that plan choice is not random or based solely on cost. The non-uniform distribution of choice across deductible across the online studies is extremely similar to that of the employees, with demand peaking for $500 and $1,000 deductibles. Moreover, the bundling of cost-sharing attributes by employees, as discussed above, suggests some recognition of the tradeoffs between coverage and price. An explanation for this seeming coherence in choice is provided by the findings of Experiment 3. The estimates from the insurance demand model point to the possibility that, while consumers may not fully be able to compare the financial value of plans, they do seem aware of and responsive to price differences across plans and differences in the relative generosity of plan coverage. Employees, and participants in study 3, seemed to heuristically sort themselves into plans based on affordability and perceived health need under the assumption that the differences in plan coverage are not associated with strong differences in a plan s economic value. The possibility of such heuristic sorting into plans is reflected in the correspondence between perceived health and deductible choice. Of the 23% of participants grading themselves as extremely healthy, over half chose the high-deductible plan, while only 37% chose one of the lower two deductibles. Among all other participants, 33% chose the high deductible plan, and 56% chose one of the lowest two 21
23 deductibles. Despite facing plan menus populated by dominated options, much of the variation in observed choice can be explained by the idea that individuals sort into plans by judging their relative health needs. What is particularly intriguing is that participants with low financial literacy are especially insensitive to plan prices, suggesting that they may be especially prone to rely on a heuristic choice process largely driven by perceived health need. As an alternative or potential complement to the tested mechanisms, it is possible that the observed choice of plans may, at least in part, reflect explicit preferences for avoiding cost-sharing. A strong preference for reduced cost sharing could result from budgeting problems (or high costs to budgeting) or liquidity constraints that increase the value of financing health spending through regular monthly premium payments even at high costs. Models of non-standard risk preferences also predict demand for low-deductibles. For instance, individuals might rely on a different mental account for expected monthly payroll contributions as compared to unanticipated, and more hedonically painful, outof-pocket expenses, (e.g., Prelec and Loewenstein 1998), or be subject to reference dependent preferences such that only unexpected expenses are subject to loss aversion (e.g., Koszegi and Rabin 2007). We can estimate the size of the wedge that would be required between an individual s willingness to pay and expected value for reduced out-of-pocket spending to rationalize the observed pattern of choices. Given that the typical employee who chose a dominated plan paid $631 more relative to the high deductible option, and benefited by an average of $259 in reduced out-of-pocket spending, implies such employees valued an expected out-of-pocket dollar 2.4 times as much as a dollar deducted from payroll. While standard loss-aversion estimates could indeed rationalize the observed choices, assuming out-of-pocket expenses were subject to loss aversion while payroll deductions were not, given the widespread lack of plan literacy, we are skeptical that non-standard preferences are a significant determinant of the high demand for financially dominated low-cost sharing plans. SECTION 5. WHY DID THE FIRM OFFER DOMINATED OPTIONS? We turn our focus now to understanding the origins of the pricing of plan options at this firm. Having seen that the majority of employees select into costly dominated plans, and don t improve plan choice over time, it is natural to ask why the firm offered these dominated options in the first place. 5.1 Actuarial Practice and Average-Cost Pricing While we are not privy to the considerations that shaped the price and structure of the firm s plan menu, informal discussions with firm executives, and the marketing material used to communicate plan options to employees, persuade us that the motive underlying the build-your-own plan paradigm arose 22
24 from a desire to create value for employees by expanding plan choice and flexibility. We do know that the firm partnered with an actuarial/health-insurance consulting firm to help price the plan options. As Handel (2013) notes, the standard actuarial practice for plan pricing is to set such prices according to average-cost pricing, so that, given the enrollees selecting into each plan, different employees pay a similar share of their health-care costs on average across plan options. Average-cost pricing can result in dominated plan options given sufficient heterogeneity in employee health risk, and sorting of employees by risk into different plans. Handel (2013) studied the evolution of plan pricing at a large firm and concluded that the considerable adverse selection in initial employee plan choice caused plan prices to move towards average-cost pricing in subsequent years which led certain plans, which were not initially dominated, to become financially dominated as pricing gradients widened. In this section we assess whether the degree of plan domination exhibited by our firm s menu is consistent with the strategy of average-cost pricing. Table 4 presents a series of regressions to explore the consistency of the firm s menu with an average-cost pricing strategy. In the first column of the table we regress each of the 48 plan premiums on indicators for different cost-sharing features omitting the highest-cost sharing option in each category. The estimates in the first column capture the marginal difference in plan price associated with each cost sharing feature. For example, plans with $500 deductibles cost an average of $625 more than the equivalent plan with a $1,000 deductible which is consistent with the earlier discussion of plan dominance. While the pricing of the firm menu likely reflects meaningful interactions between costsharing provisions, the simple regression, with an R-square of 0.99, explains most of the observed variation in prices across plans. The second column of the table estimates the expected marginal benefit to an employee or equivalently, the marginal increase in costs to the firm associated with each costsharing attribute (again, relative to the omitted high cost-sharing options). The regression relies on estimates of the levels of health spending associated with counterfactual plans as described above, averaged across all employees, and as such assumes that health utilization is not sensitive to plan membership. Comparing Column 2 to Column 1 confirms the large potential savings from avoiding dominated deductibles. The typical employee, for example, would have to pay $625 to lower her deductible from $1,000 to $500, but such a shift would only yield $226 in expected benefits through reductions in out-of-pocket spending. The final column of the table offers evidence that the observed menu could be rationalized by average-cost pricing. The column reports the results of an employee-level regression of health spending covered by the employee s chosen insurance plan. The coefficients from this regression reflect both the average marginal effect of cost-sharing on covered health spending (equivalent to Column 2), as well as the differences in total health spending between typical employees and the employees actually selecting 23
25 into each plan. In this sense, the final column offers strong evidence for non-random sorting of employees into plans by health needs (adverse selection), and, possibly, moral hazard. As an illustration, the employees choosing $500 deductibles incurred an average of $1,100 more in health spending than those choosing high deductibles, which is nearly 5 times the expected marginal increase in covered spending for an average employee sorting between these options given in Column 2. A comparison of the average firm costs from the final column for each cost sharing-feature against the corresponding employee costs reported in the first column suggests that the pricing menu is highly consistent with average-cost pricing. Indeed, these estimates suggest that employees choosing deductibles of $500 or $350 are actually paying a lower share of their total covered spending than employees choosing the $1,000 deductible, while those with the $750 deductible are paying a slightly higher share. In Figure 8 we provide evidence that the final menu of prices for plans came close to equalizing the share of health spending covered by insurance (e.g., total premium if the firm had purchased the coverage from an insurer) that was paid by employee (i.e., employee premium ). On average we calculate that this share is just over 40%. The figure plots the share of covered costs for all plans associated with each cost-sharing provision. Consistent with the analysis in Table 4, except for plans with $750 deductibles, plan prices appear to result in stable cost-sharing across employees. 5.2 Average-Cost Pricing and Dominated Plan Menus We interpret the prior analysis of plan pricing as strongly consistent with the possibility that the dominated prices from the firm menu arose out of a combination of standard actuarial average-cost pricing, largely accurate forecasts about the extent to which employees would sort by health risk into plans, and, at least implicitly, the assumption that employees would fail to recognize or negatively react to dominated plan pricing. 22 Such an interpretation, however, raises the important question of why such dominated plan menus are not more pervasive across insurance settings with significant adverse selection. While prior work has documented the regularity of insurance menus in which low-cost sharing options are highly priced, we are not aware of any evidence suggesting that menus with severely dominated plan options are widespread. A potential explanation for this puzzle may be that the firm s efforts to offer choice to employee was too ambitious. The plan menu generated by the firm permitted employees to choose between plans that differed only in their deductible, while most employer-sponsored plans bundle together multiple costsharing features. The consequence of such plan flexibility is that employees may sort across plans that differ in cost-sharing only on the narrow dimension of a deductible. In the presence of average-cost 22 Given the wealth of information actuarial consulting firms have about health-care use across plans they help to design and administer for different companies, it is not particularly surprising to us that they would have good projections that capture the type of risk sorting we see here. 24
26 pricing, expected differences in health spending across employees by deductible choice would generate large differences in plan prices that can lead to dominated pricing. In traditional settings, where different deductible options are typically bundled with cost-sharing attributes that also differ, the sharp differences in prices generated by expected employee sorting is supported by a wider range in cost-sharing, and, as such, may not generate a dominated plan menu. As a simple illustration of this point, consider what we might observe had our firm offered just the two plans with greatest and lowest cost-sharing (i.e., Plan 48 and Plan 1). Next, suppose, for the purposes of this illustration, that employees presently choosing the $350 or $500 deductible, would sort into Plan 1 ($350 deductible, $1,500 MOOP, 90% Coinsurance, and $15 Copay) under the new regime, and that those presently with $750 or $1,000 deductibles would sort into Plan 48 ($1,000 deductible, $3,000 MOOP, 80% Coinsurance, $25 copay), Based on the counterfactual estimates of plan spending, the firm s share of average health-care spending would be $3,847 for Plan 1 and $1,849 for Plan 48. If the firm required employees to pay premiums that cover 40% of their expected covered spending (consistent with Figure 8), this would suggest a premium difference of $799 between the two plans. For the individuals sorting into Plan 1 in this scenario, the difference in health spending that would be covered between Plan 1 and Plan 48 is on average $622. Despite the excess price of Plan 1 over expected value, Plan 48 would not dominate Plan 1 in this scenario since the maximum potential reduction in out-ofpocket spending for the employee is over $2,500 and 28% of the time these individuals would benefit with Plan 1 over Plan 48. This scenario, while just a hypothetical, helps to illustrate the ingredients required for the emergence of dominated plan menus: a) a set of menu options that include variation on very small costsharing differences, b) meaningful sorting by risk type (and/or moral hazard) across those options, and c) standard actuarial pricing based on an average-cost strategy. Finally, menu designers must presume that consumer demand is not sensitive to the presence of dominated plans. While plan menus with fewer options may feature plans with high relative prices the selection of which may have significant financial consequences for indiscriminating employees such menus are much less likely to have the clearly dominated options evidenced by the menu used by our firm. SECTION 6. IMPLICATIONS FOR WELFARE AND POLICY The previous sections document the pervasive choice of dominated health-plan options and large consequences of these decisions. In this section we explore the welfare implications of eliminating these dominated plan choices and transitioning to a restricted menu, as well as broader implications of our findings for empirical work on insurance choices. 25
27 6.1 Assessing Welfare Implications of Shifting to a Restricted Plan Menu Although there are clear and large losses to the employees who chose dominated options, focusing solely on the expected value of forgone savings could be misleading. Low deductible plans have less variation in out-of-pocket medical spending, which, at least partially, reduces the welfare loss of choosing dominated options for risk-averse enrollees. In this section we assess the potential welfare gains from transitioning to alternative plan menus after accounting for risk preferences. Since the observed choices are inconsistent with informed decisions and standard risk preferences, we cannot make inferences about risk aversion at the individual level. Instead we take a more normative approach and assume individuals have plausible levels of curvature in their underlying utility of wealth function. We use CARA utility for tractability. 23 We set the coefficient of absolute risk aversion to , which is approximately the threshold above which the Rabin-critique (Rabin, 2000) dictates that the implied level of risk aversion over large stakes becomes implausible. 24 The other variable required for welfare analysis is the employee s expected distribution of potential medical spending. For analytic tractability, we suppose that employees in our data can be characterized by one of 48 different risk types, each corresponding to the enrollee s plan choice. 25 That is, we assume that the employees who chose each plan represent one risk type and use the distribution of observed medical spending across the individuals in the plan to proxy for employee expectations. With these assumptions, denote the chosen plan as k [1, 48] and the equivalent plan with a $1,000 deductible as k. 26 Let m k ij denote the out-of-pocket medical spending for individual i from chosen plan k in the scenario where plan j was selected. Finally, denote the premium for a plan as p k. The expected utility for the risk-type who chose plan k and has wealth w is then given by: N k k ) ) EU k (k) = 1 (1 e r(w p k m ik N k i=1. In order to quantify the welfare effect of a switch to non-dominated plans, we can denote a lump-sum transfer payment, T that would equalize the expected utility under the current plan with the expected utility under the equivalent $1k-deductible plan. T is set such that: 23 In particular, the CARA specification allows us to abstract from issues involving the level of wealth across employees and how that interacts with the welfare effects of different plan choices. While this is clearly an important issue, for the purposes of the simple illustration in this section we feel the CARA simplification is helpful. 24 Specifically Rabin (2000) includes the example of an individual who would turn down a 50/50 gain $110 lose $100 gamble as one of his least extreme examples where the implications of small-scale risk aversion for large-scale risk aversion start to get extreme. Within the CARA model, an individual just turns down this gamble for absolute risk aversion at or above While we can generate individual-level estimates of the distribution of possible claims (and doing so does not meaningfully change the results), to keep the analysis simple for this section. 26 For plans with $1,000 deductibles, k = k 26
28 EU k (k, T) = 1 N k N k i=1 (1 e r(w p k k m ik+t) 1 ) = (1 e r(w p k m k N k ik ) ) = N k i=1 EU k (k ). Solving for T for each chosen-plan group k we have: T k = 1 r N k i=1 k ) e rp k (e rm ik e rp k N k i=1 (e rm ik k ). Figure 9 graphs the average value of these transfer payments needed to equate the expected utility of the chosen plan with the $1k-deductible alternative given the original plan menu (Panel A). Each bar gives the weighted average of the 12 transfer payments for the plans with that deductible level. This figure confirms that forgone welfare gains from avoiding dominated contracts we calculated earlier are not meaningful affected by accounting for risk aversion. We calculate average welfare gains of $578, $256, and $324 for employees in the $350, $500 and $750 deductible levels respectively. There is, of course, no welfare change for those already in the $1,000-deductible plans. In practice, were employees to all switch into high deductible plans, either due to a restricted menu or an effective decision-aid, we would expect the firm to react by adjusting premiums. In the second panel of the figure we consider the net welfare effects of a switch to the $1k-deductible options after permitting the firm to adjust premiums so that the employee share of covered health spending remained at the present rate of approximately 40%. This more general-equilibrium approach implies substantial welfare gains to the employees presently in $350 and $750 deductibles, a modest welfare loss to the employees in the $500 deductibles and a large transfer away from the $1,000-deductible employees. The average change in aggregate surplus in this scenario is slightly negative reflecting the fact that, after price adjustments, the switch in plan regimes would result in a transfer from the high-deductible to lowerdeductible employees but increased cost-sharing for most. While this finding that average welfare would fall by eliminating dominated choices is consistent with similar arguments in Handel (2013), here we suspect that because the disproportionate share of low earners in low-deductible plans would actually cause the net welfare effects to be positive for any welfare function which incorporated differences in the marginal value of a dollar across wealth or income Beyond these simple counterfactuals it is challenging meaningfully estimate potential welfare effects of alternative plan regimes. If all employees have the same degree of risk aversion, it will be welfare improving overall for higher-risk individuals to pool with lower-risk individuals, since the increased medical spending for the high-risk individuals means they benefit more from reductions in premiums that come from pooling than the low-risk individuals are hurt by increases in premiums due to pooling. If the employees are going to pool on a single plan, it will generally be best if they can do so on a plan with low costsharing, provided the cost-sharing minimizes moral-hazard effects. In reality, however, once we consider the possibility of heterogeneity in the extent of the diminishing marginal utility of wealth and the fact that individuals can potentially opt out of plans, welfare analysis of plan-option design becomes much more complicated. 27
29 Finally, to the extent that plan choices represent forms of random error in the decision process, more choice may be equivalent to entering naïve employees into a plan choice lottery. Reducing options could produce significantly improve aggregate welfare in some scenarios by reducing the variance in spending introduced by the tendency towards decision-making errors. 6.2 Broader Implications for Policy and the Expansion of Choice Our findings have a number of implications for policy. Given that the vast majority of employees at the firm we studied would have benefited from being assigned to the same, single, plan, our results challenge the logic of seeking to improve individual welfare by offering choices better suited to individuals. In addition, our findings question the likelihood that increased competition across providers will lead to lower premiums and better products. According to recent work, competition will not necessarily yield its usual benefits when firms interact in markets with a large share of unsophisticated consumers (Sandroni and Squintani 2007; Ho, Hogan, and Morton 2014; Gabaix and Laibson 2006; DellaVigna and Malmendier 2004; Heidhues and Koszegi 2014). If individuals cannot sensibly compare plans differing across simple cost-sharing features, as we find, it is unlikely that they will be able efficiently make comparisons across varying plans from different providers in a way that will pressure firms to lower premiums (particularly if providers have incentives to shroud products in a way to inhibit such comparisons). Our findings also have some relevance for understanding the viability of competitive insurance markets in settings with adverse selection. Akerflof (1970) raised the concern that competitive insurance markets can unravel as low risk types leave the market to avoid cross-subsidizing those with higher risk. Rothschild and Stiglitz (1976), and the research that followed, highlighted that competitive insurance markets could exist even in the presence of adverse selection by allowing different risk types to sort into separate contract options. However, this work also highlighted that the equilibria can be quite fragile and that, with too much heterogeneity in the population, it could be possible to offer options that would lead the market to unravel. In our setting we observe a firm that embraced the expansion of choice and offered so many different contract options that, with any meaningful sorting by risk type (as we observe), the market should have unraveled to only the highest cost-sharing plans. A surprising finding of this paper is that the market did not unravel. Individual decision processes deviated so far from the rational economic benchmark that a set of options that should not have been feasible because they were dominated were actually chosen by the majority of individuals. Overall, our findings point to the need for caution in the introduction of options for health insurance. A blind move toward substantial plan choices will likely generate menus of options that theory predicts should lead to unraveling of the market, 28
30 and, to the extent that the market does not unravel it is due to the mistaken decisions of the unsophisticated. 28 Our work also has relevance for related debates about the appropriate extent of cross subsidization in health-insurance markets. We document, in both our archival analysis and experiments, that many individuals are willing to select dominated plans, and that these individuals have higher healthcare spending. Debates around the degree of cross-subsidization in health insurance center on the question of the extent to which lower-risk types should be forced to pool with unhealthier individuals. Standard economic theory suggests that in a competitive market if healthier individuals want to separate from unhealthy individuals, they will have to incur costs in the form of increased cost-sharing or even forgoing insurance altogether to achieve that separation (Akerlof, 1970; Rothschild and Stiglitz, 1976). Unless there is a cost to the healthy types of separating, the unhealthy will follow them and maintain pooling. To the extent that the patterns we observe hold in competitive settings as well, they suggest that the sophisticated and healthy may not have to give up much to avoid cross-subsidizing, because the relatively unsophisticated and unhealthier individuals will, unwittingly, pay for their higher health spending. 6.3 Implications of Findings for Attempts to Infer Risk from Insurance Choice Finally, the stark departure we observe from the basic predictions of traditional models of insurance demand casts doubt on the common practice of inferring risk preferences from observed insurance decisions. Researchers working in this area have at times been faced with small pockets of observations that could not be rationalized within the existing paradigm, and such researchers have typically excluded these seeming anomalies from their analysis.29 Our data imply that violations of the standard model of demand are the norm and not the exception. The online studies we conduct further suggest that consumer choice of deductible is more reflective of health literacy, perceived health need, and financial sophisticated, as opposed to preferences for risk. If individuals do choose plans based on a heuristic understanding of deductibles then observed heterogeneity in risk across consumers, within consumers over time, and across insurance settings may, to some degree and possibly a great degree, actually reflect heterogeneity in literacy and sophistication. The implications of this are substantial for 28 A further important consequence of these dynamics is that apparent stability of health-insurance markets could be highly misleading. In particular, if one were able to introduce an effective decision aid into a situation like the one we observe, we would likely see a massive and rapid change in consumer choices. It may be, then, that markets that appear initially stable may collapse and unravel suddenly if unsophisticated consumers are better informed about available options. 29 See for example Einav et al., 2013 page 189 or the extensive discussion in Barseghyan et al., A notable exception is Handel, 2013, who specifically leverages the fact that employees do not switch out of menus that become dominated in his analysis of the effects of choice inertia. 29
31 attempts to estimate the welfare consequences of policy using risk inferred from complicated settings such as insurance. While it might be tempting to dismiss our setting as anomalous, our observations come from a Fortune 100 company using a menu constructed from accepted actuarial practices. While we suspect that dominated plan menus are not the norm and as such, represent a unique opportunity to cleanly test for the rationality of choice menus featuring expensive low cost-sharing options, that may also lead to highly inefficient employee decisions, are far more popular. As we documented in Section 5, if the company had offered fewer options, we might have seen similar sorting, and, since we would not have observed violations of dominance, might have simply concluded that people were quite risk averse. SECTION 7. CONCLUSION Our principle contribution is to document widespread and costly violations of dominance in the health-insurance decisions of a large and diverse sample of working Americans. Unlike most prior work, our paper is able to transparently assess choice quality without making assumptions about risk preferences or beliefs, by analyzing employee choice from a standardized plan menu with a large share of financially dominated options. For the majority of employees who chose dominated plans a disproportionate share of whom were of low income the financial consequences of poor choice were far larger than many recent developments (e.g., the effect of the exchange on insurance premiums, or the penalty associated with the individual mandate) that have dominated political discourse regarding health reform. An implication of these findings is that what choices individuals should be offered, and how to ensure that choice options don t include disadvantageous but tempting alternatives should merit the same, or greater, attention than these other issues. Our initial results prompted us to address the question of why employees make such disadvantageous decisions. Through a series of online experiments with hypothetical choices modeled on the firm s plan menu, we find evidence for a modest role of search/menu complexity and much larger role of low health literacy. Confirming other research, we find widespread deficits in employee understanding of the insurance choices they face. Even with simple and small menus, we observed significant errors in plan choice, suggesting that plan choice is difficult to improve. The online studies suggest that poor choice may be result from individuals reliance on a heuristic understanding of the valid determinants of plan choice such that they sort into available plans based on relative plan premiums and perceived healthiness, but fail to recognize the low financial value of some plans. 30
32 A policy prescription emerging from these findings is that recent reforms aimed at expanding choice, and increasing provider competition, may be promising benefits on the faulty presumption that enrollees will make sensible plan choices. While efforts to improve choice through simplification, education, and other design improvements may improve choice quality, an alternative policy strategy involves shifting from efforts to improve choices between existing plans to efforts to simplify and standardize the insurance products themselves. (Loewenstein et al. 2013; Liebman, and Zeckhauser 2008). At the extreme, if all firms offered identical products, then competition would likely focus exclusively on price and quality. Beyond implications for policy, our study asserts that traditional attempts to infer risk preferences from health insurance choices may be misguided. Rather than reflecting self-interested deliberations involving cost, need, and risk, many health plan choices likely reflect heuristic choice strategies grounded in a fundamental deficit of health plan literacy. 31
33 REFERENCES Abaluck, J., and J. Gruber. (2011). "Choice Inconsistencies among the Elderly: Evidence from Plan Choice in the Medicare Part D Program." American Economic Review 101 (4): Akerlof, G.(1970). The Market for Lemons : Quality Uncertainty and the Market Mechanism. The Quarterly Journal of Economics, 84 (3): Barseghyan, L., F. Molinari, T. O'Donoghue, and J. Teitelbaum. (2013). The Nature of Risk Preferences: Evidence from Insurance Choices. American Economic Review 103 (6): Barseghyan, L., F. Molinari, and J. Teitelbaum. (2014) Inference under Stability of Risk Preferences. Working paper Bhargava, S., and D. Manoli. (2012) Why are Benefits Left on the Table? Assessing the Role of Information, Complexity, and Stigma on Take-up with an IRS Field Experiment. Working Paper, University of Chicago. Bhargava, S., Benartzi, S., and G. Loewenstein. (2014) The ACA Exchanges and the Behavioral Economics of Choice. mimeo, Carnegie Mellon University. Burke, A., Misra, A., and S. Sheingold. (2014) Premium Affordability, Competition, and Choice in the Health Insurance Marketplace, ASPE Research Brief, Department of Health and Human Services. Bordalo, P., N. Gennaioli, and A. Shleifer. (2012) Salience Theory of Choice Under Risk. Quarterly Journal of Economics, 127 (3): Choi, J., D. Laibson and B. Madrian. (2009). Reducing the complexity costs of 401 (k) participation: the case of quick enrollment. In: Wise, D.A. (Ed.), Developments in the Economics of Aging. University of Chicago Press, Chicago: Congdon, J., Kling., J., and S. Mullainathan (2010). Policy and Choice: Public Finance through the Lens of Behavioral Economics, Washington, DC: Brookings Institution Press. DellaVigna, S., and U. Malmendier. (2004). Contract Design and Self-Control: Theory and Evidence. The Quarterly Journal of Economics 119 (2): DellaVigna, S. (2009). Psychology and Economics: Evidence from the Field. Journal of Economic Literature 47(2): Einav, L. and A. Finkelstein. (2011). Selection in Insurance Markets: Theory and Empirics in Pictures. Journal of Economic Prospects 25(1): Einav, L., Finkelstein, A., and J. Levin. (2010). Beyond Testing: Empirical Models of Insurance Markets. Annual Review of Economics. 2:
34 Einav, L., A. Finkelstein, S. Ryan, P. Schrimpf, and M. Cullen. (2013). Selection on Moral Hazard in Health Insurance. American Economic Review 103(1), Ericson, K. (forthcoming). Consumer Intertia and Firm Pricing in the Medicare Part D Prescription Drug Insurance Exchange. American Economic Journal: Economic Policy. Ericson, K., and A. Starc, (2012). Heuristics and Heterogeneity in Health Insurance Exchanges: Evidence from the Massachusetts Connector. American Economic Review Papers and Proceedings 102(3): Fang, H., Keane, M. and D. Silverman, (2008). Sources of Advantageous Selection: Evidence from the Medigap Insurance Market. Journal of Political Economy, 116(2), Frank, R.G., and K. Lamiraud. (2009). Choice, Price Competition and Complexity in Markets for Health Insurance. Journal of Economic Behavior and Organizaion, 71 (2), Gabaix, X., and D. Laibson. (2006). Shrouded Attributes, Consumer Myopia, and Information Suppression in Competitive Markets. The Quarterly Journal of Economics 121 (2): Handel, B. (2013). Adverse Selection and Inertia in Health Insurance Markets: When Nudging Hurts. American Economic Review 103 (7): Handel, B. and J. Kolstad, (2014). Health Insurance for Humans : Information Frictions, Plan Choice, and Consumer Welfare, NBER Working Paper No Hastings, J., and J. Weinstein. (2008). Information, school choice, and academic achievement: evidence from two experiments. Quarterly Journal of Economics 123(4): Heidhues, P., and B. Kőszegi. (2014). Using Information about Naivete to Price Discriminate. mimeo, ESMT. Heiss, F., D. L. McFadden, and J. K. Winter. (2010). "Mind the Gap! Consumer Perceptions and Choices of Medicare Part D Prescription Drug Plans." David A. Wise (Ed.), Research Findings in the Economics of Aging, The University of Chicago Press, Ho, K., J. Hogan, and F.S. Morton. (2014). The Impact of Consumer Inattention on Insurer Pricing in the Medicare Part D Program. mimeo, Columbia University. Johnson E., R. Hassin, T. Baker, A. Bajger, and G. Treuer. (2013). Can Consumers Make Affordable Care Affordable? The Value of Choice Architecture. PLoS ONE 8(12): e doi: /journal.pone Kamenica, Emir. (2008). Contextual Inference in Markets: On the Informational Content of Product Lines, American Economic Review 98 (5): Ketcham, J., C. Lucarelli, E. Miravete, and C. Roebuck. (2012). Sinking, Swimming, or Learning to Swim in Medicare Part D?." American Economic Review 102 (6):
35 Kling, J., S. Mullainathan, E. Shafir, L. Vermeulen, and M. Wrobel. (2012). Comparison Friction: Experimental Evidence from Medicare Drug Plans. Quarterly Journal of Economics 127 (1): Kolstad, J. and A. Kowalski. (2012). Mandate-Based Health Reform and the Labor Market: Evidence from The Massachusetts Reform," NBER Working Paper No Koszegi, B., and M. Rabin. (2007). Reference-Dependent Risk Attitudes. American Economic Review 97(4): Liebman, J. and R. Zeckhauser (2008). Simple Humans, Complex Insurance, Subtle Subsidies. NBER Working Paper No Loewenstein, G., et al. (2013). Consumers Misunderstanding of Health Insurance. Journal of Health Economics 32(5): Prelec, D. and G. Loewenstein. (1998). The Red and the Black: Mental Accounting of Savings and Debt. Marketing Science 17(1): Rabin, M. (2000). Risk Aversion and Expected-Utility Theory: A Calibration Theorem. Econometrics 68(5): Rothschild, M. and J. Stiglitz. (1976) Equilibrium in Competitive Insurance Markets: An Essay on the Economics of Imperfect Information. Quarterly Journal of Economics 90(4): Sandroni, A., and F. Squintani. (2007). Overconfidence, Insurance, and Paternalism. American Economic Review 97 (5): Schram, A., and J. Sonnemans. (2011.) How individuals choose health insurance: An experimental analysis. European Economic Review 55(6): Spinewijn, J. (2014). Heterogeneity, Demand for Insurance and Adverse Selection. Working paper. Strombom, B., T. Buchmueller, and P. Feldstein. (2002). Switching costs, price sensitive and health plan choice. Journal of Health Economics, 21(1): Sydnor, J. (2010). (Over)insuring Modest Risks. American Economic Journal: Applied Economics 2(4): Thaler, R. and C. Sunstein. (2008). Nudge: Improving Decisions about Health, Wealth, and Happiness. Yale University Press. Winter, J., R. Balza, F. Caro, F. Heiss, B. Jun, R. Matzkin, and D. McFadden. (2006). Medicare prescription drug coverage: consumer information and preference. Proceedings of the National Academy of Sciences 103(20): Zhou, C., and Y. Zhang. (2012). The Vast Majority of Medicare Part D Beneficiaries Still Don t Choose the Cheapest Plans That Meet Their Medication Needs. Health Affairs 31(10):
36 35

37 Figure 2. Employee Plan Choice 36
38 Figure 3. Distribution of Savings Associated with Counterfactual Plan Choice (by current plan deductible) 37
39 38
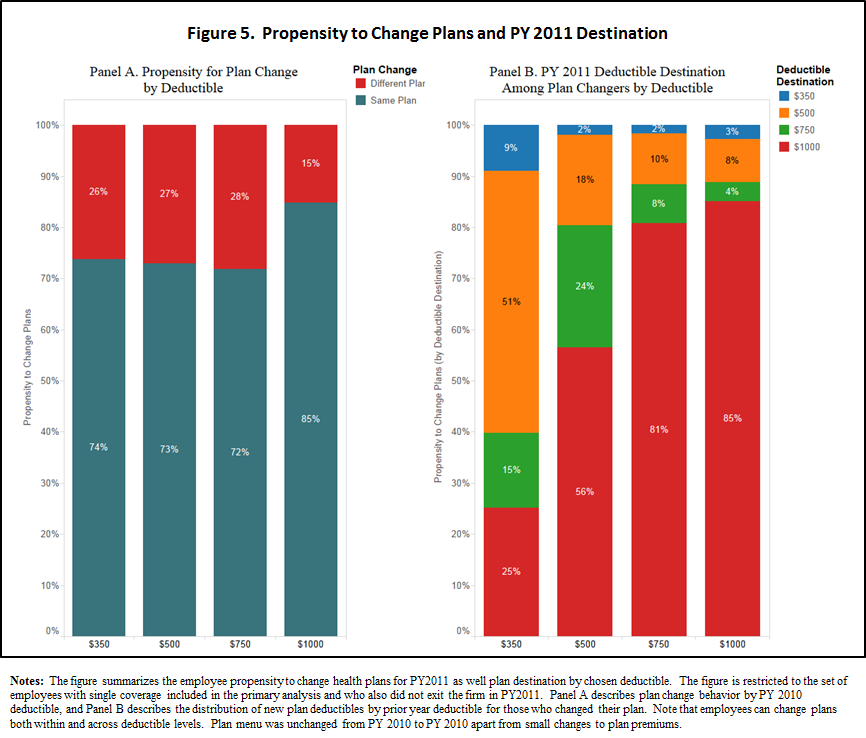
40 39
41 Figure 6. Menu Complexity and Choice Quality (Experiment 1) 40
42 Figure 7. Health Insurance Literacy, Search Motivation and Choice Quality (Experiment 2) 41
43 Figure 8. Employee Premium Relative to Medical Spending across Plan Features 42
44 Figure 9. Welfare Consequences of Switching All Employees to $1,000 Deductible Plans 43
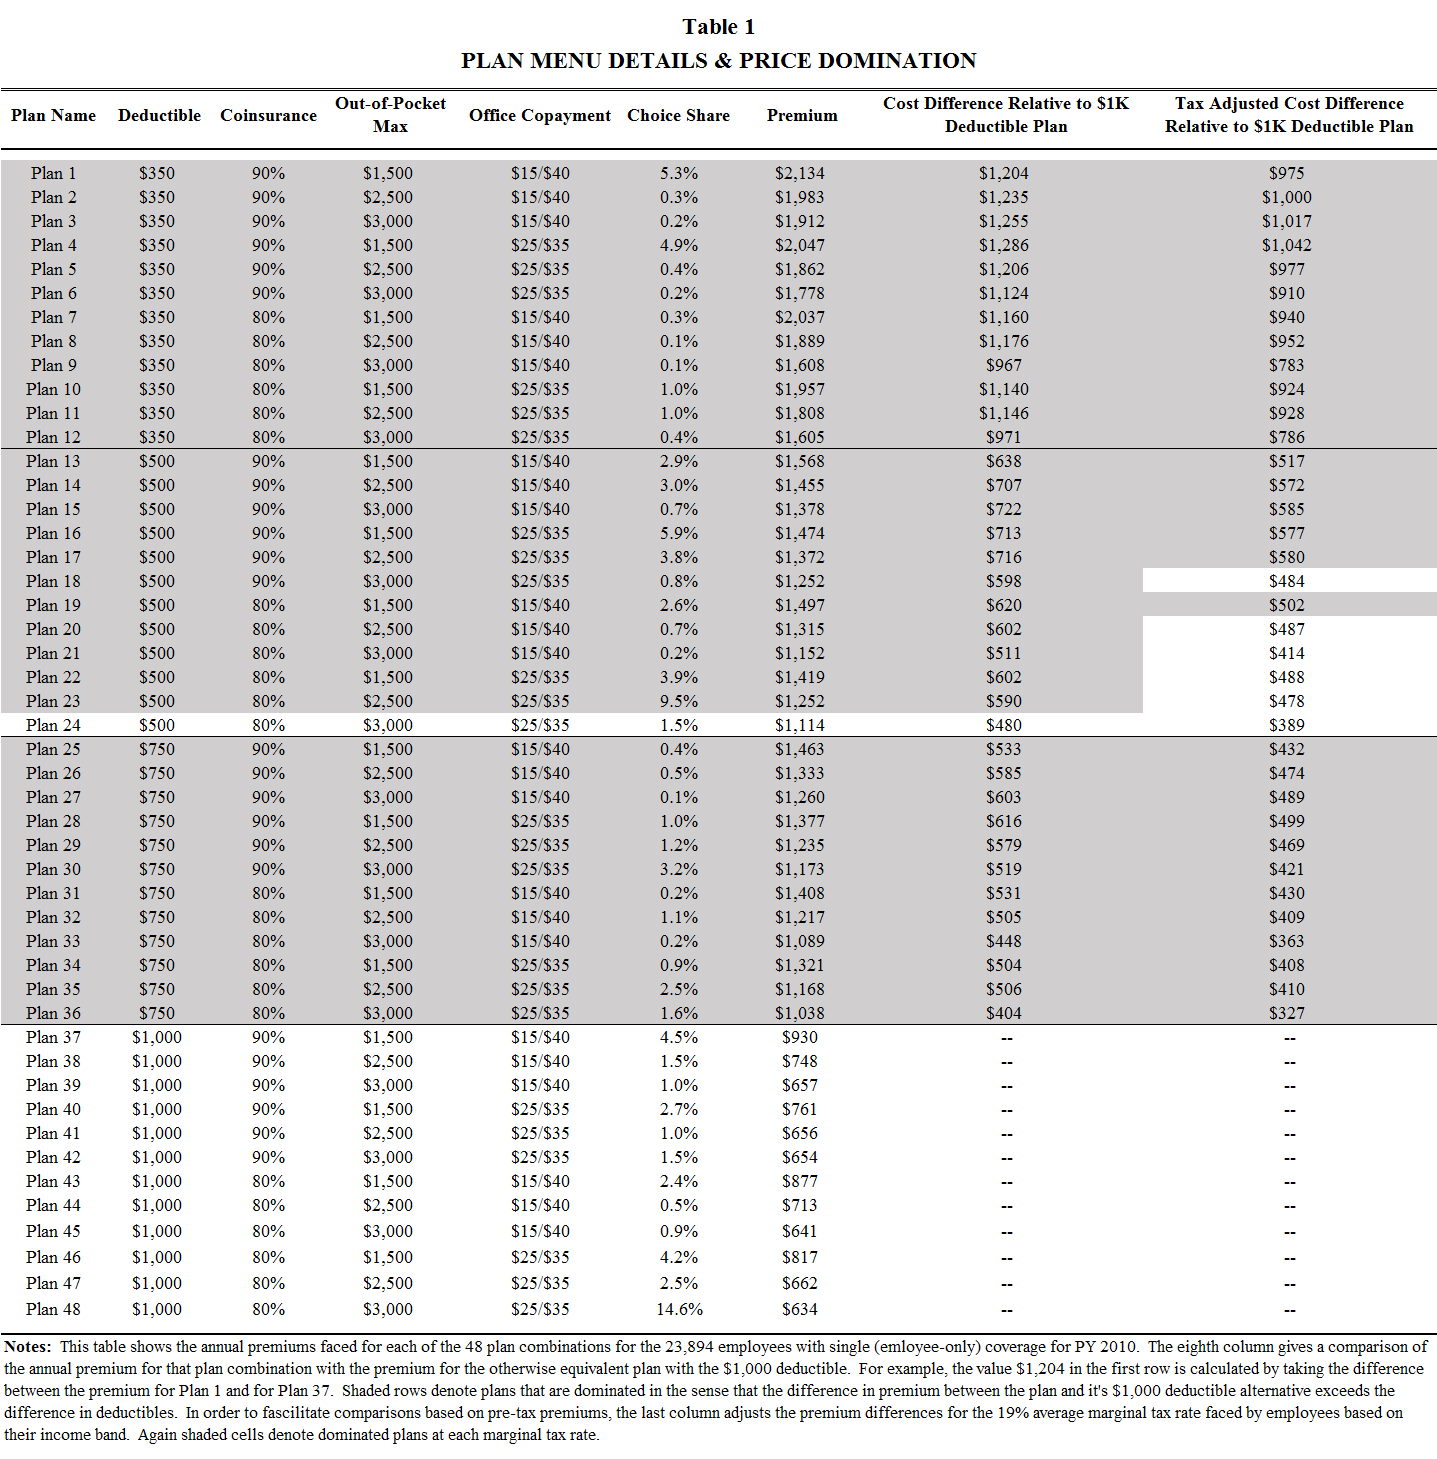
45 44
NBER WORKING PAPER SERIES DO INDIVIDUALS MAKE SENSIBLE HEALTH INSURANCE DECISIONS? EVIDENCE FROM A MENU WITH DOMINATED OPTIONS
 NBER WORKING PAPER SERIES DO INDIVIDUALS MAKE SENSIBLE HEALTH INSURANCE DECISIONS? EVIDENCE FROM A MENU WITH DOMINATED OPTIONS Saurabh Bhargava George Loewenstein Justin Sydnor Working Paper 21160 http://www.nber.org/papers/w21160
Health Insurance and the Affliction of Choice. Saurabh Bhargava, Carnegie Mellon University
 Health Insurance and the Affliction of Choice Saurabh Bhargava, Carnegie Mellon University Brookings Institute Conference on Behavioral Economics September 2015 Recent Explosion in Health Plan Choice Typical
Colorado s Health Insurance Marketplace: A Profile of Likely Consumers
 August 2013 CHAS Issue Brief 2011 DATA SERIES NO. 7 Colorado s Health Insurance Marketplace: A Profile of Likely Consumers Prepared for The Colorado Trust by the Colorado Health Institute Introduction
Insurance Markets Ready or Not: Consumers Face New Health Insurance Choices. Employer-based. Insurance Premium. Contribution.
 Insurance Markets Ready or Not: Consumers Face New Health Insurance Choices Introduction Not long ago, most working Californians, at least those working for large or midsize companies, could expect a standard
Health Insurance Coverage for Direct Care Workers: Key Provisions for Reform
 Health Insurance Coverage for Direct Care Workers: Key Provisions for Reform Introduction As an organization dedicated to our nation s 3 million direct-care workers and the millions of elders and people
How Non-Group Health Coverage Varies with Income
 How Non-Group Health Coverage Varies with Income February 2008 Policy makers at the state and federal levels are considering proposals to subsidize the direct purchase of health insurance as a way to reduce
ACA Premium Impact Variability of Individual Market Premium Rate Changes Robert M. Damler, FSA, MAAA Paul R. Houchens, FSA, MAAA
 ACA Premium Impact Variability of Individual Market Premium Rate Changes Robert M. Damler, FSA, MAAA Paul R. Houchens, FSA, MAAA BACKGROUND The Patient Protection and Affordable Care Act (ACA) introduces
How much would it cost to cover the uninsured in Minnesota? Preliminary Estimates Minnesota Department of Health, Health Economics Program July 2006
 How much would it cost to cover the uninsured in Minnesota? Preliminary Estimates Minnesota Department of Health, Health Economics Program July 2006 Executive Summary This background paper, prepared by
HEALTH CARE SYSTEMS ELECTION 2012 ISSUE PAPER NO. 3 SEPTEMBER 2012. Where Are We Now?
 ELECTION 2012 HEALTH CARE SYSTEMS ISSUE PAPER NO. 3 SEPTEMBER 2012 Vermont League of Cities and Towns 89 Main Street, Suite 4, Montpelier, VT 05602 (802) 229-9111 or (800) 649-7915 info@vlct.org Where
Getting the Most from Marketplaces: Smart Policies on Health Insurance Choice
 DISCUSSION PAPER 2015-08 OCTOBER 2015 Getting the Most from Marketplaces: Smart Policies on Health Insurance Choice Ben Handel and Jonathan Kolstad The Hamilton Project Brookings 1 MISSION STATEMENT The
Preliminary and Incomplete Draft. Doctor Switching Costs in Health Insurance. Gordon B. Dahl (UC San Diego and NBER) and
 and") Preliminary and Incomplete Draft Doctor Switching Costs in Health Insurance Gordon B. Dahl (UC San Diego and NBER) and Silke J. Forbes (Case Western Reserve University) Abstract We exploit a targeted change
Preliminary and Incomplete Draft Doctor Switching Costs in Health Insurance Gordon B. Dahl (UC San Diego and NBER) and Silke J. Forbes (Case Western Reserve University) Abstract We exploit a targeted change
ISSUE BRIEF. A Little Knowledge Is a Risky Thing: Wide Gap in What People Think They Know About Health Insurance and What They Actually Know
 October 214 Amended A Little Knowledge Is a Risky Thing: Wide Gap in What People Think They Know About Health and What They Actually Know BY KATHRYN A. PAEZ AND CORETTA J. MALLERY Under the 2 Affordable
October 26, 2012. Selection Risks for SHOP Exchange Scenarios. Dear Michael:
 4370 La Jolla Village Dr. Suite 700 San Diego, CA 92122 (858) 558-8400 tel (858) 597-0111 fax www.milliman.com Mr. Michael Lujan Director Small Business Health Options Program (SHOP) California Health
Health Insurance. A Small Business Guide. New York State Insurance Department
 Health Insurance A Small Business Guide New York State Insurance Department Health Insurance A Small Business Guide The Key Health insurance is a key benefit of employment. Most organizations with more
STATE CONSIDERATIONS ON ADOPTING HEALTH REFORM S BASIC HEALTH OPTION Federal Guidance Needed for States to Fully Assess Option by January Angeles
 820 First Street NE, Suite 510 Washington, DC 20002 Tel: 202-408-1080 Fax: 202-408-1056 center@cbpp.org www.cbpp.org March 13, 2012 STATE CONSIDERATIONS ON ADOPTING HEALTH REFORM S BASIC HEALTH OPTION
Article from: Health Watch. October 2013 Issue 73
 Article from: Health Watch October 2013 Issue 73 Nontraditional Variables in Health Care Risk Adjustment By Syed M. Mehmud Syed M. Mehmud, ASA, MAAA, FCA, is director and senior consulting actuary at Wakely
Kansas Health Policy Authority Small Business Health Insurance Steering Committee
 How Health Coverage Works: Coverage Delivery, Risk Assessment, and Regulation The following summarizes the document How Private Health Coverage Works: A Primer 2008 Update published by the Kaiser Family
Analysis of National Sales Data of Individual and Family Health Insurance
 Analysis of National Sales Data of Individual and Family Health Insurance Implications for Policymakers and the Effectiveness of Health Insurance Tax Credits Vip Patel, Chairman ehealthinsurance June 2001
Health Care Reform: Major Provisions and Bargaining Strategies for Retirees
 Health Care Reform: Major Provisions and Bargaining Strategies for Retirees MEDICARE Summary of Benefit: Medicare is the federal government s healthcare program for the elderly and certain disabled individuals.
Survey of Non-Group Health Insurance Enrollees
 Survey of Non-Group Health Insurance Enrollees A First Look At People Buying Their Own Health Insurance Following Implementation Of The Affordable Care Act Executive Summary... 1 About The Groups Described
ADP Annual Health Benefits Report
 ADP RESEARCH INSTITUTE ADP Annual Health Benefits Report 2014 Benchmarks and Trends for Large Organizations Table of Contents Executive Summary... 2 About This Study... 4 Section One: Participation in
Rising Premiums, Charity Care, and the Decline in Private Health Insurance. Michael Chernew University of Michigan and NBER
 Rising Premiums, Charity Care, and the Decline in Private Health Insurance Michael Chernew University of Michigan and NBER David Cutler Harvard University and NBER Patricia Seliger Keenan NBER December
Jessica S. Banthin and Thomas M. Selden. Agency for Healthcare Research and Quality Working Paper No. 06005. July 2006
 Income Measurement in the Medical Expenditure Panel Survey Jessica S. Banthin and Thomas M. Selden Agency for Healthcare Research and Quality Working Paper No. 06005 July 2006 Suggested citation: Banthin
Choosing the Best Plan for You: A Tool for Purchasing Coverage in the Health Insurance Exchange
 Choosing the Best Plan for You: A Tool for Purchasing Coverage in the Health Insurance Exchange The Affordable Care Act (ACA) makes health insurance available to nearly all Americans and the law requires
Federal exchange auto-enrollment: Emerging data and new proposals
 Federal exchange auto-enrollment: Emerging data and new proposals Jason A. Clarkson, FSA, MAAA William A. Gibula, ASA, MAAA Paul R. Houchens, FSA, MAAA EXECUTIVE SUMMARY The U.S. Department of Health and
How To Determine The Impact Of The Health Care Law On Insurance In Indiana
 ACA Impact on Premium Rates in the Individual and Small Group Markets Paul R. Houchens, FSA, MAAA BACKGROUND The Patient Protection and Affordable Care Act (ACA) introduces significant changes in covered
A Shot in the Arm for Medicare Part D: Four Ways for the Government to Boost its Customer Communications
 A Shot in the Arm for Medicare Part D: Four Ways for the Government to Boost its Customer Communications By Marian V. Wrobel, Jeffrey R. Kling, Sendhil Mullainathan, Eldar Shafir, and Lee Vermeulen Executive
Cost-sharing Charges in Marketplace Health Insurance Plans - Part II
 September 2013 Cost-sharing Charges in Marketplace Health Insurance Plans - Part II Starting in January 2014, new health insurance marketplaces (also called exchanges) will provide a way for people to
The Large Business Guide to Health Care Law
 The Large Business Guide to Health Care Law How the new changes in health care law will affect you and your employees Table of contents Introduction 3 Part I: A general overview of the health care law
Amount of Savings Needed for Health Expenses for People Eligible for Medicare: More Rare Good News, p. 2
 October 2013 Vol. 34, No. 10 Amount of Savings Needed for Health Expenses for People Eligible for Medicare: More Rare Good News, p. 2 IRA Asset Allocation, 2011, p. 8 A T A G L A N C E Amount of Savings
Health Care Reform and Small Businesses:
 Health Care Reform and Small Businesses: The Heightened Role of PEOs The sweeping changes laid out in the Affordable Care Act (ACA), or health care reform, have left small business owners facing a number
Article from: Health Watch. January 2013 Issue 71
 Article from: Health Watch January 2013 Issue 71 Similarities between Medicare Prescription Drug Plans and Commercial Exchanges By Shelly S. Brandel and Douglas A. Proebsting The Affordable Care Act (ACA)
Lecture 7: Policy Design: Health Insurance & Adverse Selection
 Health Insurance Spending & Health Adverse Selection Lecture 7: Policy Design: Health Insurance & Adverse Selection Johannes Spinnewijn London School of Economics Lecture Notes for Ec426 1 / 25 Health
DRAFT. Final Report. Wisconsin Department of Health Services Division of Health Care Access and Accountability
 Final Report Wisconsin Department of Health Services Division of Health Care Access and Accountability Wisconsin s Small Group Insurance Market March 2009 Table of Contents 1 INTRODUCTION... 3 2 EMPLOYER-BASED
Latest House Republican Budget Threatens Medicare and Shreds the Safety Net
 Latest House Republican Budget Threatens Medicare and Shreds the Safety Net Instead of Reducing Health Care Costs, Blueprint Shifts Costs to Seniors, Providers, Businesses, and States Topher Spiro March
How To Get A Small Business Health Insurance Plan For Free
 Statement of Linda J. Blumberg, Ph.D. Senior Fellow The Urban Institute Committee on Energy and Commerce Subcommittee on Oversight and Investigations United States House of Representatives Hearing: The
Issue Brief. Small Firm Self-Insurance Under the Affordable Care Act. Matthew Buettgens and Linda J. Blumberg OVERVIEW
 November 2012 Issue Brief Small Firm Self-Insurance Under the Affordable Care Act Matthew Buettgens and Linda J. Blumberg The Urban Institute The mission of The Commonwealth Fund is to promote a high performance
Faculty Productivity and Costs at The University of Texas at Austin
 Faculty Productivity and Costs at The University of Texas at Austin A Preliminary Analysis Richard Vedder Christopher Matgouranis Jonathan Robe Center for College Affordability and Productivity A Policy
ASSESSING THE RESULTS
 HEALTH REFORM IN MASSACHUSETTS EXPANDING TO HEALTH INSURANCE ASSESSING THE RESULTS March 2014 Health Reform in Massachusetts, Expanding Access to Health Insurance Coverage: Assessing the Results pulls
MASSACHUSETTS UNDER THE AFFORDABLE CARE ACT: EMPLOYER-RELATED ISSUES AND POLICY OPTIONS
 MASSACHUSETTS UNDER THE AFFORDABLE CARE ACT: EMPLOYER-RELATED ISSUES AND POLICY OPTIONS JULY 2012 Fredric Blavin, Linda J. Blumberg, Matthew Buettgens, and Jeremy Roth of the Urban Institute ABOUT THE
Age Rating Under Comprehensive Health Care Reform: Implications for Coverage, Costs, and Household Financial Burdens
 Age Rating Under Comprehensive Health Care Reform: Implications for Coverage, Costs, and Household Financial Burdens Timely Analysis of Immediate Health Policy Issues October 2009 Linda J. Blumberg, Matthew
HEALTHCARE REFORM SOLUTIONS. Designing a Pharmacy Benefit for the New Public Health Exchange Consumers
 HEALTHCARE REFORM SOLUTIONS Designing a Pharmacy Benefit for the New Public Health Exchange Consumers FEBRUARY 2013 EXECUTIVE SUMMARY Designing a Pharmacy Benefit for the New Public Health Insurance Exchange
Nevada Health Insurance Market Study
 Nevada Health Insurance Market Study Prepared for the State of Nevada March 2012 Gorman Actuarial, LLC 210 Robert Road Marlborough, MA 01752 Bela Gorman, FSA, MAAA Don Gorman Jenn Smagula, FSA, MAAA Gorman
Prescription Drugs as a Starting Point for Medicare Reform Testimony before the Senate Budget Committee
 Prescription Drugs as a Starting Point for Medicare Reform Testimony before the Senate Budget Committee Marilyn Moon The nonpartisan Urban Institute publishes studies, reports, and books on timely topics
Health insurance Marketplace. What to expect in 2014
 Health insurance Marketplace What to expect in 2014 Overview The Affordable Care Act (ACA) includes several provisions geared to extend greater access to health insurance benefits to more people. Beginning
DEPARTMENT OF HEALTH AND HUMAN SERVICES
 Minimum Value Calculator Methodology DEPARTMENT OF HEALTH AND HUMAN SERVICES Patient Protection and Affordable Care Act; Minimum Value Calculator Methodology AGENCY: Department of Health and Human Services
EXPLAINING HEALTH CARE REFORM: Risk Adjustment, Reinsurance, and Risk Corridors
 EXPLAINING HEALTH CARE REFORM: Risk Adjustment, Reinsurance, and Risk Corridors As of January 1, 2014, insurers are no longer able to deny coverage or charge higher premiums based on preexisting conditions
The Economic Benefits of Health Care Reform in New Mexico
 The Economic Benefits of Health Care Reform in New Mexico Introduction June 2011 Updated August 2011 Federal health care reform, known officially as the Patient Protection and Affordable Care Act (PPACA,
Controlling Health Care Costs Through Limited Network Insurance Plans: Evidence from Massachusetts State Employees
 Controlling Health Care Costs Through Limited Network Insurance Plans: Evidence from Massachusetts State Employees Jonathan Gruber, MIT and NBER Robin McKnight, Wellesley and NBER Our Setting Massachusetts
Insights AdvocateCare Health Insurance Exchanges
 Insights AdvocateCare Physician Edition April 16, 2013 Executive Summary (HIX, also called Health Insurance Marketplace) a key provision of The Patient Protection and Affordable Care Act (ACA, Affordable
Coinsurance A percentage of a health care provider's charge for which the patient is financially responsible under the terms of the policy.
 Glossary of Health Insurance Terms On March 23, 2010, President Obama signed the Patient Protection and Affordable Care Act (PPACA) into law. When making decisions about health coverage, consumers should
Summary: Health Care spending in Massachusetts: To: Mass Care. From: Gerald Friedman 1
 To: Mass Care From: Gerald Friedman 1 Re.: Cost and funding of proposed Medicare for All in Massachusetts Bill Summary: This policy memo explores some of possible economic implications of the proposed
Important Effective Dates for Employers and Health Plans
 Brought to you by Krempa Associates, Inc. Important Effective Dates for Employers and Health Plans On March 23, 2010, President Obama signed the health care reform bill, or Affordable Care Act (ACA), into
Health Care Reform without the Individual Mandate
 Health Care Reform without the Individual Mandate Replacing the Individual Mandate would Significantly Erode Coverage Gains and Raise Premiums for Health Care Consumers Jonathan Gruber February 2011 Introduction
Christy Tinnes, Brigen Winters and Christine Keller, Groom Law Group, Chartered
 Preparing for Health Care Reform A Chronological Guide for Employers This Article provides an overview of the major provisions of health care reform legislation affecting employers and explains the requirements
Important Effective Dates for Employers and Health Plans
 Brought to you by Sullivan Benefits Important Effective Dates for Employers and Health Plans On March 23, 2010, President Obama signed the health care reform bill, or Affordable Care Act (ACA), into law.
Messaging and the Mandate: The Impact of Consumer Experience on Health Insurance Enrollment Through Exchanges
 Messaging and the Mandate: The Impact of Consumer Experience on Health Insurance Enrollment Through Exchanges By Natalie Cox, Benjamin Handel, Jonathan Kolstad, and Neale Mahoney At the heart of the Affordable
Non-Group Health Insurance: Many Insured Americans with High Out-of-Pocket Costs Forgo Needed Health Care
 Affordable Care Act Non-Group Health Insurance: Many Insured Americans with High Out-of-Pocket Costs Forgo Needed Health Care SPECIAL REPORT / MAY 2015 WWW.FAMILIESUSA.ORG Executive Summary Since its passage
Basic Health Plan Offers a Chance to Provide Comprehensive Health Care Coverage for Low-Income Minnesotans
 Basic Health Plan Offers a Chance to Provide Comprehensive Health Care Coverage for Low-Income Minnesotans The number of uninsured in Minnesota has been on the rise over the last decade, with one out of
Important Effective Dates for Employers and Health Plans
 Brought to you by Hipskind Seyfarth Risk Solutions Important Effective Dates for Employers and Health Plans On March 23, 2010, President Obama signed the health care reform bill, or Affordable Care Act
The Health Benefit Exchange and the Commercial Insurance Market
 The Health Benefit Exchange and the Commercial Insurance Market Overview The federal health care reform law directs states to set up health insurance marketplaces, called Health Benefit Exchanges, that
Medicare Cost Sharing and Supplemental Coverage
 Medicare Cost Sharing and Supplemental Coverage Topics to be Discussed Medicare costs to beneficiaries Review Medicare premiums and cost sharing Background on Medicare beneficiary income Current role of
Choosing a Health Insurance Plan for 2016
 Choosing a Health Insurance Plan for 2016 Alan Sager BUSPH School Assembly 27 October 2015 This talk rests heavily on a report prepared for the BUSPH Faculty Senate. Alan Sager prepared that report, at
A special analysis of Mercer s National Survey of Employer-Sponsored Health Plans for the Massachusetts Division of Insurance
 A special analysis of Mercer s National Survey of Employer-Sponsored Health Plans for the Massachusetts Division of Insurance June 27, 2008 Mercer Health & Benefits 1 Contents Introduction and survey description
Policy Forum. Understanding the Effects of Medicare Prescription Drug Insurance. About the Authors. By Robert Kaestner and Kelsey McCoy
 Policy Forum Volume 23, Issue 1 October 2010 Understanding the Effects of Medicare Prescription Drug Insurance By Robert Kaestner and Kelsey McCoy The Medicare Modernization The size and potential significance
National Findings on Access to Health Care and Service Use for Non-elderly Adults Enrolled in Medicaid
 National Findings on Access to Health Care and Service Use for Non-elderly Adults Enrolled in Medicaid By Sharon K. Long Karen Stockley Elaine Grimm Christine Coyer Urban Institute MACPAC Contractor Report
Health Insurance Exchange Study
 Health Insurance Exchange Study Minnesota Department of Health February, 2008 Division of Health Policy Health Economics Program PO Box 64882 St. Paul, MN 55164-0882 (651) 201-3550 www.health.state.mn.us
Overview of Policy Options to Sustain Medicare for the Future
 Overview of Policy Options to Sustain Medicare for the Future Juliette Cubanski, Ph.D. Associate Director, Program on Medicare Policy Kaiser Family Foundation jcubanski@kff.org Medicare NewsGroup Journalism
Choosing a Medicare Part D Plan: Are Medicare Beneficiaries Choosing Low-Cost Plans?
 THE MEDICARE DRUG BENEFIT Choosing a Medicare Part D Plan: Are Medicare Beneficiaries Choosing Low-Cost Plans? Prepared By: Jonathan Gruber MIT For: The Henry J. Kaiser Family Foundation March 2009 This
Arizona Health Care Cost Containment System Issue Paper on High-Risk Pools
 Arizona Health Care Cost Containment System Issue Paper on High-Risk Pools Prepared by: T. Scott Bentley, A.S.A. Associate Actuary David F. Ogden, F.S.A. Consulting Actuary August 27, 2001 Arizona Health
How Sensitive are Low Income Families to Health Plan Prices?
 American Economic Review: Papers & Proceedings 100 (May 2010): 292 296 http://www.aeaweb.org/articles.php?doi=10.1257/aer.100.2.292 The Massachusetts Health Insurance Experiment: Early Experiences How
Health Insurance & Behavioral Economics
 Health Insurance & Behavioral Economics Alan C. Monheit, Ph.D. Rutgers University School of Public Health Rutgers National Bureau of Economic Research Standard Model Underlying Consumer Choice In the standard
White Paper. Medicare Part D Improves the Economic Well-Being of Low Income Seniors
 White Paper Medicare Part D Improves the Economic Well-Being of Low Income Seniors Kathleen Foley, PhD Barbara H. Johnson, MA February 2012 Table of Contents Executive Summary....................... 1
Maryland Medicaid Program
 Maryland Medicaid Program Maryland s Pharmacy Discount Waiver Tuesday, November 19, 2002 Debbie I. Chang Deputy Secretary for Health Care Financing Maryland Department of Health and Mental Hygiene Overview
Universal Health Coverage: An Economist s Perspective
 INFORMATION BRIEF Research Department Minnesota House of Representatives 600 State Office Building St. Paul, MN 55155 Donald Hirasuna, Legislative Analyst 651-296-8038 September 2007 Universal Health Coverage:
Plans. Employee Ownership. Using Your 401(k) Plan as an Incentive to Improve Corporate Performance. Section. and
 Plan as an Incentive to Improve Corporate Performance. Section. and") Using Your 401(k) Plan as an Incentive to Improve Corporate Performance Alexander P. Moss Praxis Consulting Group, Inc. Reprinted from Section 401(k) and Plans Employee Ownership Copyright 2000 by the
Using Your 401(k) Plan as an Incentive to Improve Corporate Performance Alexander P. Moss Praxis Consulting Group, Inc. Reprinted from Section 401(k) and Plans Employee Ownership Copyright 2000 by the
INSIGHT on the Issues
 INSIGHT on the Issues AARP Public Policy Institute Medicare Beneficiaries Out-of-Pocket for Health Care Claire Noel-Miller, PhD AARP Public Policy Institute Medicare beneficiaries spent a median of $3,138
The Impact of the Massachusetts Health Care Reform on Health Care Use Among Children
 The Impact of the Massachusetts Health Care Reform on Health Care Use Among Children By SARAH MILLER In 2006 Massachusetts enacted a major health care reform aimed at achieving near-universal coverage
ACTUARIAL VALUE AND EMPLOYER- SPONSORED INSURANCE
 NOVEMBER 2011 ACTUARIAL VALUE AND EMPLOYER- SPONSORED INSURANCE SUMMARY According to preliminary estimates, the overwhelming majority of employer-sponsored insurance (ESI) plans meets and exceeds an actuarial
This glossary provides simple and straightforward definitions of key terms that are part of the health reform law.
 This glossary provides simple and straightforward definitions of key terms that are part of the health reform law. A Affordable Care Act Also known as the ACA. A law that creates new options for people
OVERVIEW OF PRIVATE INSURANCE MARKET REFORMS IN THE PATIENT PROTECTION AND AFFORDABLE CARE ACT AND RESOURCES FOR FREQUENTLY ASKED QUESTIONS
 OVERVIEW OF PRIVATE INSURANCE MARKET REFORMS IN THE PATIENT PROTECTION AND AFFORDABLE CARE ACT AND RESOURCES FOR FREQUENTLY ASKED QUESTIONS Brief Prepared by MATTHEW COKE Senior Research Attorney LEGISLATIVE
THE AFFORDABLE CARE ACT AND YOU. An Overview for Large Groups
 THE AFFORDABLE CARE ACT AND YOU An Overview for Large Groups TABLE OF CONTENTS Find Answers to Your Questions About Employer Mandate... 3 Access to Coverage... 5 Coverage Changes... 7 Health and Wellness
The Effect of the Affordable Care Act on the Labor Supply, Savings, and Social Security of Older Americans
 The Effect of the Affordable Care Act on the Labor Supply, Savings, and Social Security of Older Americans Eric French University College London Hans-Martin von Gaudecker University of Bonn John Bailey
Measuring Inefficiencies from Adverse Selection
 Measuring Inefficiencies from Adverse Selection Jonathan Levin Gaston Eyskens Lectures November 7, 2013 Roadmap Lectures 1. Technology and Asymmetric Information 2. High Risk Consumer Credit Markets 3.
ADVERSE SELECTION ISSUES AND HEALTH INSURANCE EXCHANGES UNDER THE AFFORDABLE CARE ACT
 Draft: 6/22/11 Reflects revisions to the June 17 draft as discussed during the Health Insurance and Managed Care (B) Committee conference call June 22, 2011 Background ADVERSE SELECTION ISSUES AND HEALTH
List of Insurance Terms and Definitions for Uniform Translation
 Term actuarial value Affordable Care Act allowed charge Definition The percentage of total average costs for covered benefits that a plan will cover. For example, if a plan has an actuarial value of 70%,
Session 30 PD, New research in Behavioral Economics in Health Care. Moderator/Presenter: Christopher James Coulter, FSA, MAAA, CERA
 Session 30 PD, New research in Behavioral Economics in Health Care Moderator/Presenter: Christopher James Coulter, FSA, MAAA, CERA Presenters: Keith Ericson, Ph.D. Ben Handel, Ph.D. New Research in Behavioral
Can Markets for Health Insurance Work?
 Can Markets for Health Insurance Work? Jonathan Levin Gaston Eyskens Lectures November 2013 Roadmap Lectures 1. Technology and Asymmetric Information 2. High Risk Consumer Credit Markets 3. Measuring Inefficiencies
75 Washington Ave. Suite 206 Portland, ME 04101. (207) 767-6440 www.marketdecisions.com
 767-6440 www.marketdecisions.com") 75 Washington Ave. Suite 206 Portland, ME 04101 (207) 767-6440 www.marketdecisions.com Comprehensive Report 2014 Vermont Household Health Insurance Survey Vermont Department of Regulation, Insurance Division
75 Washington Ave. Suite 206 Portland, ME 04101 (207) 767-6440 www.marketdecisions.com Comprehensive Report 2014 Vermont Household Health Insurance Survey Vermont Department of Regulation, Insurance Division
Medicare part d, which offers
 Trends The Effects Of The Coverage Gap On Drug Spending: A Closer Look At Medicare Part D Beneficiaries who entered the doughnut hole decreased their monthly prescriptions by about percent per month. by
Submission to the Private Health Insurance
 Submission to the Private Health Insurance Consultations 2015-16 The AMA welcomes the opportunity to provide a submission to the Private Health Insurance Consultations 2015-16. The Review will no doubt
Improving traditional Medicare s benefit design. Rachel Schmidt April 1, 2010
 Improving traditional Medicare s benefit design Rachel Schmidt April 1, 2010 Changes from March presentation Discussion of changing context in which beneficiaries take up supplemental coverage Less discussion
Health care reform at-a-glance. December 2013
 December 2013 Employer mandate Play or pay penalty for failing to offer coverage to at least 95% of all full-time employees (FTE) and children if any FTE gets subsidy in exchange $2,000 (indexed) times
Medicare Supplemental Coverage in Minnesota
 Medicare Supplemental Coverage in Minnesota December 2002 h ealth e conomics p rogram Health Policy and Systems Compliance Division Minnesota Department of Health Medicare Supplemental Coverage in Minnesota
Exchanges go live: Early trends in exchange dynamics
 Exchanges go live: Early trends in exchange dynamics After three and a half years of forecasting, data is now emerging from the individual exchanges that can inform the likely impact of the Affordable
Health care reform at-a-glance. August 2014
 Health care reform at-a-glance August 2014 Employer mandate Shared responsibility payment for failing to offer coverage to at least 95%* of all fulltime employees (FTE) and children if any FTE gets subsidy
Carrier Selection on Private Exchanges. Understanding the Impact of Price and Incumbency in a Multi-carrier Exchange Environment
 Carrier Selection on Private Exchanges Understanding the Impact of Price and Incumbency in a Multi-carrier Exchange Environment October, 2015 Table of Contents: Executive Summary...p. 3 Introduction...p.
BACKGROUNDER. Double Coverage: How It Drives Up Medicare Costs for Patients and Taxpayers. Key Points. Robert E. Moffit, PhD, and Drew Gonshorowski
 BACKGROUNDER No. 2805 Double Coverage: How It Drives Up Medicare Costs for Patients and Taxpayers Robert E. Moffit, PhD, and Drew Gonshorowski Abstract Traditional Medicare s cost-sharing structure has
Case Study: State of Indiana
 May 20, 2010 Consumer-Driven Health Plan Effectiveness Case Study: State of Indiana Cory Gusland, FSA Tyler Harshey, ASA, MAAA Nick Schram, Actuarial Analyst Todd Swim, FSA, MAAA Contents 1. Executive