Disaster Recovery Grant Reporting System (DRGR) Reports Module Draft User Guide
|
|
|
- Louisa Lawson
- 8 years ago
- Views:
Transcription
1 Disaster Recovery Grant Reporting System (DRGR) Reports Module Draft User Guide September 2010 U.S. Department of Housing and Urban Development Office of Community Planning and Development DRGR 7.0 Release Submitted by: CACI 2231 Crystal Drive Arlington, VA 22202

2 This document details DRGR MicroStrategy Reporting instructions.

3 Disaster Recovery Grant Reporting System (DRGR) Reports Module Draft User Guide DRGR Release TABLE OF CONTENTS I. Navigating in the Reports Module... 1 A. Accessing the Reports Module... 1 B. Navigating Across Folders... 2 C. Accessing MS Excel or PDF Versions of Reports... 2 II. Modifying Reports... 5 A. Changing Column Order... 5 B. Changing the Row Sort Order... 5 C. Grouping and Ungrouping Data at the Report Level... 7 D. Grouping Numeric Data in Columns... 9 E. Accessing Other Report Format Options...10 III. Saving and Accessing Reports A. Saving Modified Versions of Reports...13 B. Exporting Modified Reports...14 C. Accessing Archived Reports in the History List...15 IV. Working with Public Reports A. Financial Updates...17 B. Quarterly Expenditure Analyses...20 C. Exporting Public Reports...22


4 I. Navigating in the Reports Module A. Accessing the Reports Module You can access the Reports Module in DRGR from any computer that can run a browser. 1) In DRGR application, click on Reports link. This will open a separate web browser for MicroStrategy Reporting. It displays DRGR project as well as any other projects you have permissions to access. 2) When the new browser opens, select the Disaster Recovery Grant Reporting System FY A folder.

 My Reports: My Reports are specific to your account. Users can save their personal reports in My Reports. 3) There are three main folders under Shared Reports.")
5 B. Navigating Across Folders You can select Shared Reports or My Reports to find a report. 1) Shared Reports: It contains the folders and reports that are available for other users. 2) My Reports: My Reports are specific to your account. Users can save their personal reports in My Reports. 3) There are three main folders under Shared Reports. a) Public Reports: This folder will contain any shared reports for all users. It is currently empty. b) Standard Reports: This folder contains user role specific folder(s) and reports. i.e. A Grantee user will see the Grantee user specific folder and its reports. 4) Folders and reports list can be displayed in the list view or the large icon view. C. Accessing MS Excel or PDF Versions of Reports When you find a report you would like to access in MS Excel to work with or as a PDF to share or publish, double-click the icons on the right side of the rows showing the report name. 1) MS Excel Reports: If you select a MS Excel version of the report, the system will prompt you to choose a MS Excel export version. If you save it as Excel with formatting it will look and feel like the report displayed with merged cells. However, you will not be able 2
 Folders and reports list can be displayed in the list view or the large icon view. C.")

6 to sort this file once it is in Excel. If you save it as a plain text, it will repeat values in the merged cells so it can be sorted but you will lose all formatting. For both types of MS Excel reports, you will have set print areas and page layout settings. Note: Depending on your Internet browser configuration during the exporting process you may get a message asking whether to Save or Open the exported Excel report. 3


7 2) PDF: If you select a PDF version of the report, the system will let quickly set the page layout settings but you will not be able to modify the look and feel of the report further or re-sort the order of the information included in the report. You can force pages to be single width instead of printing across pages and you can select the landscape setting instead of portrait. 4


8 II. Modifying Reports You can modify reports in Microstrategy before you export them to MS Excel or PDF. MicroStrategy also allows you to save these modifications in your own folder for future use. When you find a report, double-click the title of the report to execute. A. Changing Column Order Any data including text or dates (called Attributes ) will display on the left while any data that is numeric (called Metrics ) will display on the right. When the report displays, the data in the left columns will show as merged cells any time data in the columns in each adjacent row repeats. Basically, this means that data columns on the left side will group the data to the right. Users can change the sort using a couple of methods. The first would be to put the mouse cursor in the column header (showing in grey here) and using the left mouse button to drag the column to the left or right. The other method is to put the cursor over this same area, but use the right button. This will display a drop down that includes the Move option. Users can select left or right, but attribute data cannot be moved to the right of metric data and vice versa. B. Changing the Row Sort Order Users can also sort using two different methods. If you only want to change the order of one column, you can use the right mouse button to access the menu that will allow you to select whether the report shown displays in ascending or descending order for that column. 5

 and specify the order for each one selected. When the options show (ID) or (DESC), choose (DESC).")
9 If you would like to specify the sort order based on more columns, there are other options using the DATA-SORT menu displayed below the report title or the A to Z sort icon below that. Users have to pick each column name (up to three) and specify the order for each one selected. When the options show (ID) or (DESC), choose (DESC). DESC is the order that is based on the text displayed. ID is an internal numeric index assigned by DRGR that will not be useful for sorting. Undo / Redo: For any change made in report result, you can undo or redo. 6
 or (DESC), choose (DESC). DESC is the order that is based on the text displayed.")

10 C. Grouping and Ungrouping Data at the Report Level If the report shows information in the PAGE BY section at the top of the report, this will only allow data to show for the record selected. This allows users to create and export reports that show for a smaller set of records than all the records that are in DRGR. Users can add any attribute column headings displayed to this PAGE BY area and even move these groups to the left or the right of each other. This can be done in a few ways also. The first involves placing the cursor over the column header to move and using the left mouse button to drag and drop the column to the report. The second involves using the right mouse button to access the MOVE menu and select TO PAGE BY AXIS. 7


11 . In order to change the data displayed from any of these, users just put their cursors over the down arrow to change the selection. The Page-By can also be turned on View menu. 8


12 D. Grouping Numeric Data in Columns Attribute data in rows can also be used to create columns of metric data for reports. This is more useful for data that only includes a few categories rather than lots of categories. The example shown here is the NSP national objective. This way, the budget data (listed as activity.hud fund here) will only show in the category it fits. If the Microstrategy report or MS Excel export file includes column totals, this is an easy way to highlight information across categories. Like other MOVE options, users can use the right mouse button to select MOVE and then TO COLUMNS or the left mouse button to try to drag the column header over the metric columns. 9


13 E. Accessing Other Report Format Options 1) Autostyles: Autostyles allow users to select a specific report formatting as shown below. Users can choose the Outline function to collapse/expand data level display. 10


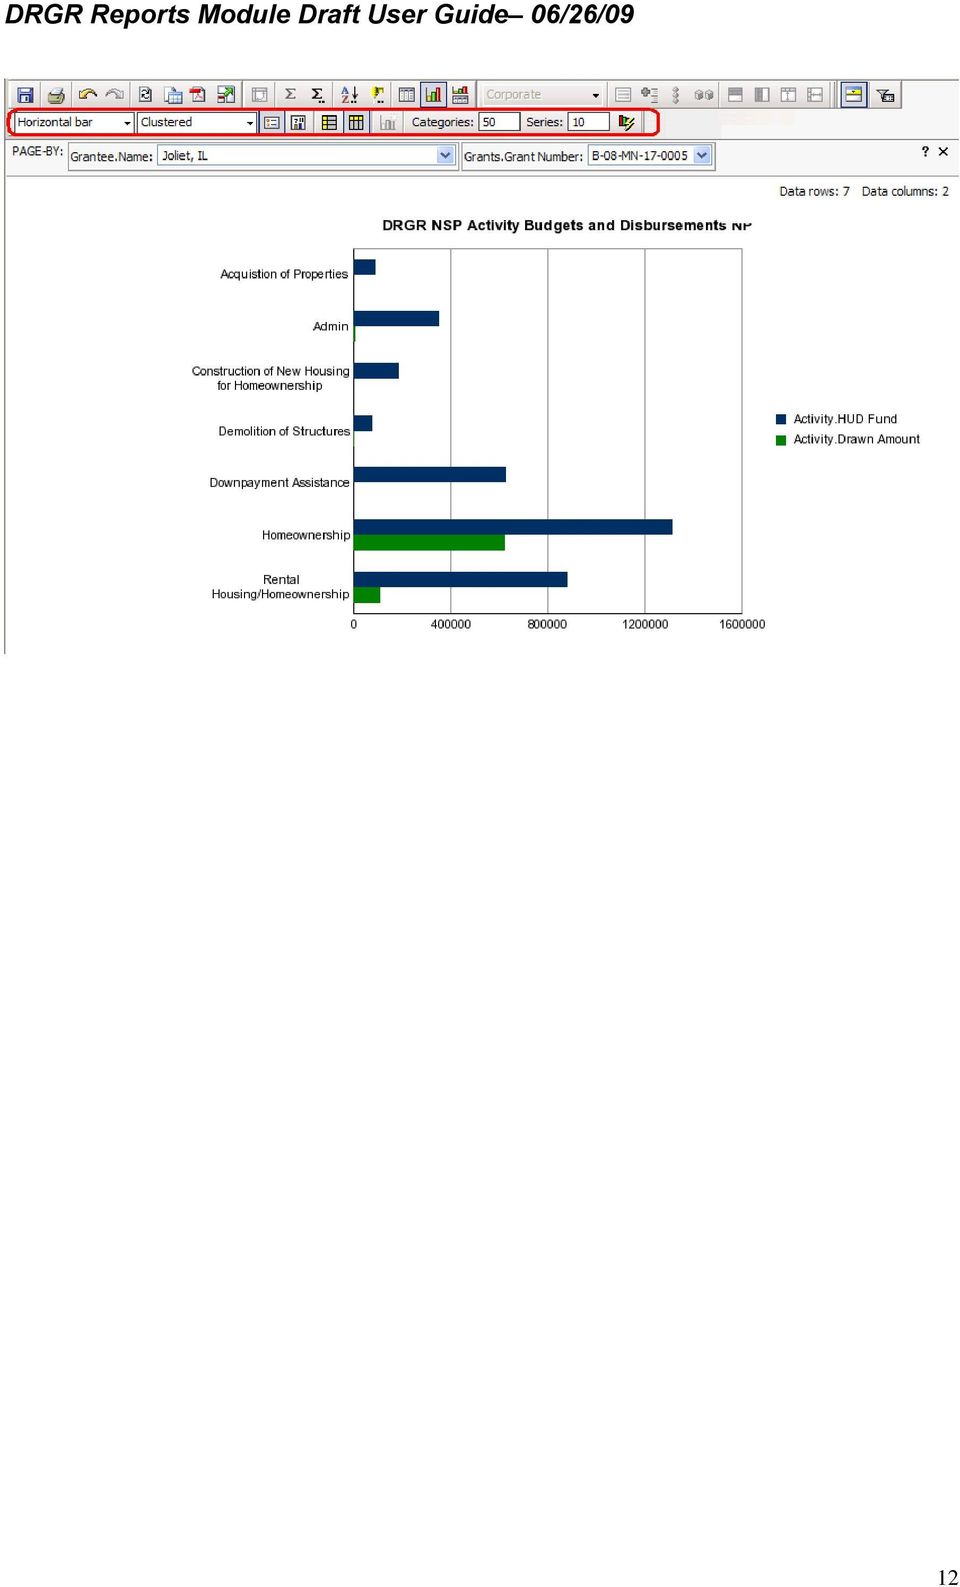
14 Users can also display data as graphs using the VIEW-GRAPH menu selection or use the graph icon to display the information as graphs instead of tables. They can also combine tables with graphs. Once the graph is displayed, another row of graph options will display. Users should consider that the graphs will be easier to read and understand if there are a relatively small number of columns and rows displayed in a table. As the number of columns and rows increase, the graphs will become much more complex and there is less chance that there will be room for all the labels to be displayed. 11

15 12

16 III. Saving and Accessing Reports A. Saving Modified Versions of Reports Any changes in the report format can be saved and accessed in the future using the My Reports folder. 1) In the report result page, click on Save button 2) Save the report in My Reports 13


17 3) Click on My Reports link to navigate to the saved report. B. Exporting Modified Reports Unmodified reports can be exported to Excel and PDF from the main report list. Modified reports can also be exported to Excel or PDF from the toolbar in a report you are editing. An Excel or PDF file will be exported through the Web browser, and you can choose to open or save it. 1) Direct Export without Report execution: A report can be exported without running. 2) Export from report result. 14

18 C. Accessing Archived Reports in the History List You can add the report result to History List, which is the user s inbox to keep the report result for future reference. You can go to History List link and open the saved report result. In History List, you can retrieve the saved report result or export it to Excel or PDF.. 15


19 IV. Working with Public Reports As outlined above, DRGR STANDARD REPORTS function much as data tables that can be grouped and sorted exported into spreadsheets for additional analysis. Starting in DRGR Release 7.0, two types of PUBLIC REPORTS have been added to the SHARED REPORTS folder. As shown below, the Financial Update Dashboards provide tables detailing the amount of funds by grant, project, or activity category that have been disbursed in DRGR. The bar charts below the tables illustrate these disbursements and the amount of funds remaining by each of these groupings. In effect, the bar charts help user see the relative amount of funding across these groupings and how much progress has been made be each individual group. While this report provides a snapshot of progress, the Quarterly Expenditure Analysis reports break these disbursements down across quarters using data from the Quarterly Progress Reports (QPRs). This allows users to examine spending trends by grants, projects, or activity categories across the life of the grants. Each of these reports include another set of folders that allow DRGR users to select the APPROPRATION they would like to select. After the user selects an appropriation, they can further customize these charts and graphs through a series of tabs and checkboxes. The tabs available are: 16


20 Financial Update Quarterly Expenditure Analysis Tab: Comparison across: Tab: Comparison across: Fin. Update Summary Regions Summary Regions Region Detail States within Region Category Detail by Grantee Based on selection of all or individual activity Grant & Project Detail Projects within Grant Grant & Project Detail Grant & Activity Category Activity Category within Grant Grant & Activity Category categories Based on selection of all or individual activity categories Comparison of grant spending within category across grants A. Financial Updates As indicated above, the FINANCIAL UPDATE SUMMARY tab shows spending and balances across regions. This tab cannot be modified further by other levels of tabs or checkboxes. 17


21 The REGION DETAIL tab allows users to select an individual tab. The table and chart will then display the spending and balances for each state in the region. The GRANT AND PROJECT DETAIL provides two levels of tabs. The user would first select the region and then select the individual grant. Once these selections are made, the user will see the spending and balances within each PROJECT grouping that a grantee has indentified for the grant. 18

22 In the last of the four main tabs, there is also a set of checkboxes that allows users to customize the projects displayed. The default selection should be for all categories except TOTAL. Users can modify these as needed to show one or more projects that may be of particular interest to an audience. This is especially helpful if one or more spending categories are much greater than others, making the remaining categories difficult to see on the chart. 19

23 B. Quarterly Expenditure Analyses As indicated above, the SUMMARY tab shows spending trends across regions. Again, there are no tabs or checkboxes to modified this report further. The CATEGORY DETAIL BY GRANTEE tab includes a tab for region and grantee. It also includes checkboxes to select one or more DRGR activity categories. 20

24 The tab CATEGORY DETAIL BY GRANT allows users to navigate down to the grant level with similar checkboxes by activity category. The final tab lets users compare the spending rates of one or more individual activity categories across grants within a region. Users would first select a region and then the activity category above the chart display. 21
25 C. Exporting Public Reports Each report can be exported as PDFs with its chart or graph in a similar way to the STANDARD reports using the FILE menu or PDF icon. Any graph report in MSTR can also be saved just as a jpg by right-clicking and selecting Save Picture As (see screenshot below) NOTE: This only works for regular reports. Dashboards are powered by Adobe Flash and can be exported to PDF or Excel in their entirety. (note: I am researching a creative way we can decouple them so you can save individual graphs out of the dashboards as well) 22
Custom Reporting System User Guide
 Citibank Custom Reporting System User Guide April 2012 Version 8.1.1 Transaction Services Citibank Custom Reporting System User Guide Table of Contents Table of Contents User Guide Overview...2 Subscribe
MicroStrategy Tips and Tricks
 MicroStrategy Tips and Tricks 1. If a prompt is required, it will have a red (Required) note. 2. If a prompt has been answered, it will have a green flag on the left-hand side of the screen. 3. You can
MicroStrategy Desktop
 MicroStrategy Desktop Quick Start Guide MicroStrategy Desktop is designed to enable business professionals like you to explore data, simply and without needing direct support from IT. 1 Import data from
MicroStrategy Analytics Express User Guide
 MicroStrategy Analytics Express User Guide Analyzing Data with MicroStrategy Analytics Express Version: 4.0 Document Number: 09770040 CONTENTS 1. Getting Started with MicroStrategy Analytics Express Introduction...
MicroStrategy Quick Guide: Running the PI Report ITU Data Mart Support Group Go to reporting.gmu.edu and click on Login to Microstrategy
 MicroStrategy Quick Guide: Running the PI Report ITU Data Mart Support Group Go to reporting.gmu.edu and click on Login to Microstrategy ACTION Enter User name and Password. Keep default selection of LDAP
Microsoft Access 2010 handout
 Microsoft Access 2010 handout Access 2010 is a relational database program you can use to create and manage large quantities of data. You can use Access to manage anything from a home inventory to a giant
REUTERS/TIM WIMBORNE SCHOLARONE MANUSCRIPTS COGNOS REPORTS
 REUTERS/TIM WIMBORNE SCHOLARONE MANUSCRIPTS COGNOS REPORTS 28-APRIL-2015 TABLE OF CONTENTS Select an item in the table of contents to go to that topic in the document. USE GET HELP NOW & FAQS... 1 SYSTEM
Introduction to Microsoft Access 2010
 Introduction to Microsoft Access 2010 A database is a collection of information that is related. Access allows you to manage your information in one database file. Within Access there are four major objects:
ReceivablesVision SM Getting Started Guide
 ReceivablesVision SM Getting Started Guide March 2013 Transaction Services ReceivablesVision Quick Start Guide Table of Contents Table of Contents Accessing ReceivablesVision SM...2 The Login Screen...
Introduction to Microsoft Access 2013
 Introduction to Microsoft Access 2013 A database is a collection of information that is related. Access allows you to manage your information in one database file. Within Access there are four major objects:
Using an Access Database
 A Few Terms Using an Access Database These words are used often in Access so you will want to become familiar with them before using the program and this tutorial. A database is a collection of related
Google Docs Basics Website: http://etc.usf.edu/te/
 Website: http://etc.usf.edu/te/ Google Docs is a free web-based office suite that allows you to store documents online so you can access them from any computer with an internet connection. With Google
User Guide. Trade Finance Global. Reports Centre. October 2015. nordea.com/cm OR tradefinance Name of document 8/8 2015/V1
 User Guide Trade Finance Global Reports Centre October 2015 nordea.com/cm OR tradefinance Name of document 2015/V1 8/8 Table of Contents 1 Trade Finance Global (TFG) Reports Centre Overview... 4 1.1 Key
Microsoft Access Rollup Procedure for Microsoft Office 2007. 2. Click on Blank Database and name it something appropriate.
 Microsoft Access Rollup Procedure for Microsoft Office 2007 Note: You will need tax form information in an existing Excel spreadsheet prior to beginning this tutorial. 1. Start Microsoft access 2007. 2.
Business Objects 4.1 Quick User Guide
 Business Objects 4.1 Quick User Guide Log into SCEIS Business Objects (BOBJ) 1. https://sceisreporting.sc.gov 2. Choose Windows AD for Authentication. 3. Enter your SCEIS User Name and Password: Home Screen
ENTERPRISE DATA WAREHOUSE PRODUCT PERFORMANCE REPORTS USER GUIDE EXTERNAL. Version: 1.0
 ENTERPRISE DATA WAREHOUSE PRODUCT PERFORMANCE REPORTS USER GUIDE EXTERNAL Version: 1.0 September 2004 Table of Contents 1.0 OVERVIEW...1 1.1 Product Performance Overview... 1 1.2 Enterprise Data Warehouse
MODIFYING QUICKBOOKS REPORTS
 MODIFYING QUICKBOOKS REPORTS Included with the QuickBooks (QBs) software are standardized reports that have been configured with standard formatting, filters and selections. This procedure is being written
Business Analytics Enhancements June 2013
 Business Analytics Enhancements June 03 Enhancement Summary June 03 Item # Site Location Enhancement Welcome Page New style - Fonts and colors have changed as a result of the enhanced reporting engine
RIFIS Ad Hoc Reports
 RIFIS Ad Hoc Reports To retrieve the entire list of all Ad Hoc Reports, including the Base reports and any additional reports published to your Role, select Ad Hoc for the Type under Filter Report By and
Task Force on Technology / EXCEL
 Task Force on Technology EXCEL Basic terminology Spreadsheet A spreadsheet is an electronic document that stores various types of data. There are vertical columns and horizontal rows. A cell is where the
Crystal Reports Payroll Exercise
 Crystal Reports Payroll Exercise Objective This document provides step-by-step instructions on how to build a basic report on Crystal Reports XI on the MUNIS System supported by MAISD. The exercise will
Basic Pivot Tables. To begin your pivot table, choose Data, Pivot Table and Pivot Chart Report. 1 of 18
 Basic Pivot Tables Pivot tables summarize data in a quick and easy way. In your job, you could use pivot tables to summarize actual expenses by fund type by object or total amounts. Make sure you do not
CONTENTS MANUFACTURERS GUIDE FOR PUBLIC USERS
 OPA DATABASE GUIDE FOR PUBLIC USERS - MARCH 2013 VERSION 5.0 CONTENTS Manufacturers 1 Manufacturers 1 Registering a Manufacturer 2 Search Manufacturers 3 Advanced Search Options 3 Searching for Manufacturers
UDW+ Quick Start Guide to Functionality 2013 Version 1.1
 to Functionality 2013 Version 1.1 Program Services Office & Decision Support Group Table of Contents Accessing UDW+... 2 System Requirements... 2 How to Login to UDW+... 2 Navigating within UDW+... 2 Home
Research Grants Financial Reporting. Presented by: Office of Information Technology
 Research Grants Financial Reporting Presented by: Office of Information Technology Research Grants Reporting Project Background: In response to the # 1 recommendation of the Research Grants Infrastructure
Creating tables in Microsoft Access 2007
 Platform: Windows PC Ref no: USER 164 Date: 25 th October 2007 Version: 1 Authors: D.R.Sheward, C.L.Napier Creating tables in Microsoft Access 2007 The aim of this guide is to provide information on using
SAP Business Intelligence (BI) Reporting Training for MM. General Navigation. Rick Heckman PASSHE 1/31/2012
 Reporting Training for MM. General Navigation. Rick Heckman PASSHE 1/31/2012") 2012 SAP Business Intelligence (BI) Reporting Training for MM General Navigation Rick Heckman PASSHE 1/31/2012 Page 1 Contents Types of MM BI Reports... 4 Portal Access... 5 Variable Entry Screen... 5
2012 SAP Business Intelligence (BI) Reporting Training for MM General Navigation Rick Heckman PASSHE 1/31/2012 Page 1 Contents Types of MM BI Reports... 4 Portal Access... 5 Variable Entry Screen... 5
SAP BusinessObjects Financial Consolidation Web User Guide
 SAP BusinessObjects Financial Consolidation Document Version: 10.0 Support Package 18 2016-02-19 SAP BusinessObjects Financial Consolidation Web User Guide Content 1 General user functions....12 1.1 To
Quality Companion 3 by Minitab
 Quality Companion 3 by Minitab Contents Part 1. Introduction to Quality Companion 3 Part 2. What's New Part 3. Known Problems and Workarounds Important: The Quality Companion Dashboard is no longer available.
for Sage 100 ERP Business Insights Overview Document
 for Sage 100 ERP Business Insights Document 2012 Sage Software, Inc. All rights reserved. Sage Software, Sage Software logos, and the Sage Software product and service names mentioned herein are registered
Decision Support AITS University Administration. Web Intelligence Rich Client 4.1 User Guide
 Decision Support AITS University Administration Web Intelligence Rich Client 4.1 User Guide 2 P age Web Intelligence 4.1 User Guide Web Intelligence 4.1 User Guide Contents Getting Started in Web Intelligence
Tableau Quick Tips Guide November 2015
 Tableau Quick Tips Guide November 2015 Fannie Mae Connect uses Tableau software to enable data display and analysis. This document provides guidance on how to get the most out of Tableau reports. The reference
Excel Unit 4. Data files needed to complete these exercises will be found on the S: drive>410>student>computer Technology>Excel>Unit 4
 Excel Unit 4 Data files needed to complete these exercises will be found on the S: drive>410>student>computer Technology>Excel>Unit 4 Step by Step 4.1 Creating and Positioning Charts GET READY. Before
Infoview XIR3. User Guide. 1 of 20
 Infoview XIR3 User Guide 1 of 20 1. WHAT IS INFOVIEW?...3 2. LOGGING IN TO INFOVIEW...4 3. NAVIGATING THE INFOVIEW ENVIRONMENT...5 3.1. Home Page... 5 3.2. The Header Panel... 5 3.3. Workspace Panel...
Blackbaud StudentInformationSystem. Reports Guide for Admissions Office
 Blackbaud StudentInformationSystem Reports Guide for Admissions Office 102811 2011 Blackbaud, Inc. This publication, or any part thereof, may not be reproduced or transmitted in any form or by any means,
State Analytical Reporting System (STARS)
") User Guide Financials - Accounts Payable Page 0 Financial Analytics Dashboards and Reports Table of Contents Financial Analytics Dashboards and Reports... 1 Accounts Payable Dashboards... 2 Voucher Details...
User Guide Financials - Accounts Payable Page 0 Financial Analytics Dashboards and Reports Table of Contents Financial Analytics Dashboards and Reports... 1 Accounts Payable Dashboards... 2 Voucher Details...
Intro to Excel spreadsheets
 Intro to Excel spreadsheets What are the objectives of this document? The objectives of document are: 1. Familiarize you with what a spreadsheet is, how it works, and what its capabilities are; 2. Using
The LSUHSC N.O. Email Archive
 The LSUHSC N.O. Email Archive Introduction The LSUHSC N.O. email archive permanently retains a copy of all email items sent and received by LSUHSC N.O. Academic email users. Email items will be accessible
SAP Business Intelligence (BI 7) Reporting Training. General Navigation. Created by the Budget Office Bloomsburg University 2/23/2012
 Reporting Training. General Navigation. Created by the Budget Office Bloomsburg University 2/23/2012") 2012 SAP Business Intelligence (BI 7) Reporting Training General Navigation Created by the Budget Office Bloomsburg University 2/23/2012 1 Contents Business Intelligence 7.0 (BI) Reports... 4 BI Logon...
2012 SAP Business Intelligence (BI 7) Reporting Training General Navigation Created by the Budget Office Bloomsburg University 2/23/2012 1 Contents Business Intelligence 7.0 (BI) Reports... 4 BI Logon...
Market Pricing Override
 Market Pricing Override MARKET PRICING OVERRIDE Market Pricing: Copy Override Market price overrides can be copied from one match year to another Market Price Override can be accessed from the Job Matches
Copyright EPiServer AB
 Table of Contents 3 Table of Contents ABOUT THIS DOCUMENTATION 4 HOW TO ACCESS EPISERVER HELP SYSTEM 4 EXPECTED KNOWLEDGE 4 ONLINE COMMUNITY ON EPISERVER WORLD 4 COPYRIGHT NOTICE 4 EPISERVER ONLINECENTER
Elisabetta Zodeiko 2/25/2012
 PRINCETON UNIVERSITY Report Studio Introduction Elisabetta Zodeiko 2/25/2012 Report Studio Introduction pg. 1 Table of Contents 1. Report Studio Overview... 6 Course Overview... 7 Princeton Information
Outlook Email. Moving and deleting email. Moving emails
 Moving and deleting email Email is stored in a series of folders within your email account. To make it easier to find and manage important emails, you may wish to move them between folders. For less important
Participant Guide RP301: Ad Hoc Business Intelligence Reporting
 RP301: Ad Hoc Business Intelligence Reporting State of Kansas As of April 28, 2010 Final TABLE OF CONTENTS Course Overview... 4 Course Objectives... 4 Agenda... 4 Lesson 1: Reviewing the Data Warehouse...
Rational Team Concert. Quick Start Tutorial
 Rational Team Concert Quick Start Tutorial 1 Contents 1. Introduction... 3 2. Terminology... 4 3. Project Area Preparation... 5 3.1 Defining Timelines and Iterations... 5 3.2 Creating Team Areas... 8 3.3
Running, Viewing, and Printing Reports Table of Contents
 Running, Viewing, and Printing Reports Table of Contents Running Reports... 1 Select and Run Report... 1 Process Scheduler Request... 2 Process Scheduler Run Date and Run Time... 3 Report Type and Format...
Business Insight Report Authoring Getting Started Guide
 Business Insight Report Authoring Getting Started Guide Version: 6.6 Written by: Product Documentation, R&D Date: February 2011 ImageNow and CaptureNow are registered trademarks of Perceptive Software,
Ingeniux 8 CMS Web Management System ICIT Technology Training and Advancement (training@uww.edu)
") Ingeniux 8 CMS Web Management System ICIT Technology Training and Advancement (training@uww.edu) Updated on 10/17/2014 Table of Contents About... 4 Who Can Use It... 4 Log into Ingeniux... 4 Using Ingeniux
Ingeniux 8 CMS Web Management System ICIT Technology Training and Advancement (training@uww.edu) Updated on 10/17/2014 Table of Contents About... 4 Who Can Use It... 4 Log into Ingeniux... 4 Using Ingeniux
Module 9 Ad Hoc Queries
 Module 9 Ad Hoc Queries Objectives Familiarize the User with basic steps necessary to create ad hoc queries using the Data Browser. Topics Ad Hoc Queries Create a Data Browser query Filter data Save a
AIM Dashboard-User Documentation
 AIM Dashboard-User Documentation Accessing the Academic Insights Management (AIM) Dashboard Getting Started Navigating the AIM Dashboard Advanced Data Analysis Features Exporting Data Tables into Excel
Kyubit Business Intelligence OLAP analysis - User Manual
 Using OLAP analysis features of Kyubit Business Intelligence www.kyubit.com Kyubit Business Intelligence OLAP analysis - User Manual Using OLAP analysis features of Kyubit Business Intelligence 2016, All
ELOQUA INSIGHT Reporter User Guide
 ELOQUA INSIGHT Reporter User Guide Copyright 2012 Eloqua Corporation. All rights reserved. July 2012 revision. Table of Contents Preface... 5 Introduction toeloqua Insight Business Intelligence... 6 Introduction
EXCEL 2007. Using Excel for Data Query & Management. Information Technology. MS Office Excel 2007 Users Guide. IT Training & Development
 Information Technology MS Office Excel 2007 Users Guide EXCEL 2007 Using Excel for Data Query & Management IT Training & Development (818) 677-1700 Training@csun.edu http://www.csun.edu/training TABLE
ORACLE BUSINESS INTELLIGENCE WORKSHOP
 ORACLE BUSINESS INTELLIGENCE WORKSHOP Creating Interactive Dashboards and Using Oracle Business Intelligence Answers Purpose This tutorial shows you how to build, format, and customize Oracle Business
Excel 2003 Tutorial I
 This tutorial was adapted from a tutorial by see its complete version at http://www.fgcu.edu/support/office2000/excel/index.html Excel 2003 Tutorial I Spreadsheet Basics Screen Layout Title bar Menu bar
6. If you want to enter specific formats, click the Format Tab to auto format the information that is entered into the field.
 Adobe Acrobat Professional X Part 3 - Creating Fillable Forms Preparing the Form Create the form in Word, including underlines, images and any other text you would like showing on the form. Convert the
Hamline University Administrative Computing Page 1
 User Guide Banner Handout: BUSINESS OBJECTS ENTERPRISE (InfoView) Document: boxi31sp3-infoview.docx Created: 5/11/2011 1:24 PM by Chris Berry; Last Modified: 8/31/2011 1:53 PM Purpose:... 2 Introduction:...
Web Intelligence User Guide
 Web Intelligence User Guide Office of Financial Management - Enterprise Reporting Services 4/11/2011 Table of Contents Chapter 1 - Overview... 1 Purpose... 1 Chapter 2 Logon Procedure... 3 Web Intelligence
Mitigation Planning Portal MPP Reporting System
 Mitigation Planning Portal MPP Reporting System Updated: 7/13/2015 Introduction Access the MPP Reporting System by clicking on the Reports tab and clicking the Launch button. Within the system, you can
Using FileMaker Pro with Microsoft Office
 Hands-on Guide Using FileMaker Pro with Microsoft Office Making FileMaker Pro Your Office Companion page 1 Table of Contents Introduction... 3 Before You Get Started... 4 Sharing Data between FileMaker
IRA Pivot Table Review and Using Analyze to Modify Reports. For help, email Financial.Reports@dartmouth.edu
 IRA Pivot Table Review and Using Analyze to Modify Reports 1 What is a Pivot Table? A pivot table takes rows of detailed data (such as the lines in a downloadable table) and summarizes them at a higher
BUSINESS OBJECTS XI WEB INTELLIGENCE
 BUSINESS OBJECTS XI WEB INTELLIGENCE SKW USER GUIDE (Skilled Knowledge Worker) North Carolina Community College Data Warehouse Last Saved: 3/31/10 9:40 AM Page 1 of 78 Contact Information Helpdesk If you
Business Objects Enterprise version 4.1. Report Viewing
 Business Objects Enterprise version 4.1 Note about Java: With earlier versions, the Java run-time was not needed for report viewing; but was needed for report writing. The default behavior in version 4.1
How to Create Your Own Crystal Report
 How to Create Your Own Crystal Report Step 1 Figure out what table you need to use for your report. Click on Resources, then File Layouts and Program Information. Click on File Layouts to see the available
Introduction to Microsoft Access 2003
 Introduction to Microsoft Access 2003 Zhi Liu School of Information Fall/2006 Introduction and Objectives Microsoft Access 2003 is a powerful, yet easy to learn, relational database application for Microsoft
Ad hoc Reports. Climate Registry Information System (CRIS) User Guide. W: https://www.crisreport.org/
 User Guide. W: https://www.crisreport.org/") Ad hoc Reports Climate Registry Information System (CRIS) User Guide W: https://www.crisreport.org/ Contents 1 Introduction... 3 1.1 Target Audience... 3 1.2 Prerequisites... 3 2 CRIS Ad hoc Reports Concepts...
Ad hoc Reports Climate Registry Information System (CRIS) User Guide W: https://www.crisreport.org/ Contents 1 Introduction... 3 1.1 Target Audience... 3 1.2 Prerequisites... 3 2 CRIS Ad hoc Reports Concepts...
BLUECIELO MERIDIAN ASSET MANAGEMENT MODULE 2014
 BLUECIELO MERIDIAN ASSET MANAGEMENT MODULE 2014 User's Guide Manual BlueCielo ECM Solutions bluecieloecm.com December 09 2014 LEGAL NOTICE 2014 BlueCielo ECM Solutions B. V. Polarisavenue 1 2132 JH Hoofddorp
Results CRM 2012 User Manual
 Results CRM 2012 User Manual A Guide to Using Results CRM Standard, Results CRM Plus, & Results CRM Business Suite Table of Contents Installation Instructions... 1 Single User & Evaluation Installation
SUCCESSFACTORS LEARNING USER OVERVIEW REFERENCE GUIDE
 SUCCESSFACTORS LEARNING USER OVERVIEW REFERENCE GUIDE SuccessFactors, Inc. 4401 Wilson Boulevard, Suite 400 Arlington, VA 22203 Tel: (703) 678-0000 www.successfactors.com Confidential and Proprietary For
Web Mail Guide... Error! Bookmark not defined. 1 Introduction to Web Mail... 4. 2 Your Web Mail Home Page... 5. 3 Using the Inbox...
 Powered by Table of Contents Web Mail Guide... Error! Bookmark not defined. 1 Introduction to Web Mail... 4 1.1 Requirements... 4 1.2 Recommendations for using Web Mail... 4 1.3 Accessing your Web Mail...
Creating and Formatting Charts in Microsoft Excel
 Creating and Formatting Charts in Microsoft Excel This document provides instructions for creating and formatting charts in Microsoft Excel, which makes creating professional-looking charts easy. The chart
Module 4: Disaster Recovery Grant Reporting
 Module 4: Disaster Recovery Grant Reporting 1 Module 4 Content Overview of DRGR Open an Account Action Plans Drawdowns Quarterly Reports 2 Overview What is DRGR? How does info flow in DRGR? 3 Overview
ICP Data Validation and Aggregation Module Training document. HHC Data Validation and Aggregation Module Training Document
 HHC Data Validation and Aggregation Module Training Document Contents 1. Introduction... 4 1.1 About this Guide... 4 1.2 Scope... 4 2. Steps for Testing HHC Data Validation and Aggregation Module.. Error!
Excel 2007 - Using Pivot Tables
 Overview A PivotTable report is an interactive table that allows you to quickly group and summarise information from a data source. You can rearrange (or pivot) the table to display different perspectives
Eloqua Insight: Advanced Analyzer User Guide
 Eloqua Insight: Advanced Analyzer User Guide Table of Contents About this User Guide... 5 Introduction to Analyzer User... 6 Beyond Basic Grids and Graphs... 6 The Benefits of Eloqua Insight... 6 Reporting
Adobe Dreamweaver CC 14 Tutorial
 Adobe Dreamweaver CC 14 Tutorial GETTING STARTED This tutorial focuses on the basic steps involved in creating an attractive, functional website. In using this tutorial you will learn to design a site
Connecting to LUA s webmail
 Connecting to LUA s webmail Effective immediately, the Company has enhanced employee remote access to email (Outlook). By utilizing almost any browser you will have access to your Company e-mail as well
BusinessObjects Enterprise InfoView User's Guide
 BusinessObjects Enterprise InfoView User's Guide BusinessObjects Enterprise XI 3.1 Copyright 2009 SAP BusinessObjects. All rights reserved. SAP BusinessObjects and its logos, BusinessObjects, Crystal Reports,
Using Spreadsheets, Selection Sets, and COGO Controls
 Using Spreadsheets, Selection Sets, and COGO Controls Contents About this tutorial... 3 Step 1. Open the project... 3 Step 2. View spreadsheets... 4 Step 3. Create a selection set... 10 Step 4. Work with
User Manual - Sales Lead Tracking Software
 User Manual - Overview The Leads module of MVI SLM allows you to import, create, assign and manage their leads. Leads are early contacts in the sales process. Once they have been evaluated and assessed,
2. Building Cross-Tabs in Your Reports Create a Cross-Tab Create a Specified Group Order Filter Cross-Tab by Group Keep Groups Together
 Crystal Reports Level 2 Computer Training Solutions Course Outline 1. Creating Running Totals Create a Running Total Field Modify a Running Total Field Create a Manual Running Total on Either Detail Data
Treasury and Trade Services Global Payments. Citi Payment Analytics User Guide
 Treasury and Trade Services Global Payments Citi Payment Analytics User Guide Table of Contents 1. Accessing Payment Analytics 2. Dashboard Overview Getting to the Citi Payment Analytics Dashboard Overview
COGNOS Query Studio Ad Hoc Reporting
 COGNOS Query Studio Ad Hoc Reporting Copyright 2008, the California Institute of Technology. All rights reserved. This documentation contains proprietary information of the California Institute of Technology
Sartorius ProControl@Informer
 Operating Instructions Sartorius ProControl@Informer Evaluation Software for SPCfWin (Sartorius ProControl for Windows) 98646-002-87 Intended Use Sartorius ProControl@Informer (SPC@Informer) is a software
University of Rochester
 University of Rochester User s Guide to URGEMS Ad Hoc Reporting Guide Using IBM Cognos Workspace Advanced, Version 10.2.1 Version 1.0 April, 2016 1 P age Table of Contents Table of Contents... Error! Bookmark
Executive Dashboard. User Guide
 Executive Dashboard User Guide 2 Contents Executive Dashboard Overview 3 Naming conventions 3 Getting started 4 Welcome to Socialbakers Executive Dashboard! 4 Comparison View 5 Setting up a comparison
Business Objects Reports Influenza Vaccinations User Guide
 Business Objects Reports Influenza Vaccinations User Guide IT@JH Enterprise Applications Updated: August 2, 2013 Page 1 of 19 Table of Contents Report Viewer:... 4 Business Objects Reporting Website...4
S M A R T D R A W U S E R G U I D E
 2015 S M A R T D R A W U S E R G U I D E Copyright 2015 By SmartDraw, LLC Contents Welcome to SmartDraw... 6 The Resources Section of SmartDraw.com... 7 Tech Support... 7 SmartHelp... 7 Chapter 1: Building
MICROSOFT ACCESS 2007 BOOK 2
 MICROSOFT ACCESS 2007 BOOK 2 4.1 INTRODUCTION TO ACCESS FIRST ENCOUNTER WITH ACCESS 2007 P 205 Access is activated by means of Start, Programs, Microsoft Access or clicking on the icon. The window opened
Data Visualization. Brief Overview of ArcMap
 Data Visualization Prepared by Francisco Olivera, Ph.D., P.E., Srikanth Koka and Lauren Walker Department of Civil Engineering September 13, 2006 Contents: Brief Overview of ArcMap Goals of the Exercise
Ohio University Computer Services Center August, 2002 Crystal Reports Introduction Quick Reference Guide
 Open Crystal Reports From the Windows Start menu choose Programs and then Crystal Reports. Creating a Blank Report Ohio University Computer Services Center August, 2002 Crystal Reports Introduction Quick
Working together with Word, Excel and PowerPoint
 Working together with Word, Excel and PowerPoint Have you ever wanted your Word document to include data from an Excel spreadsheet, or diagrams you ve created in PowerPoint? This note shows you how to
Downloading & Using Data from the STORET Warehouse: An Exercise
 Downloading & Using Data from the STORET Warehouse: An Exercise August 2012 This exercise addresses querying or searching for specific water resource data, and the respective methods used in collecting
Business Objects. Report Writing - CMS Net and CCS Claims
 Business Objects Report Writing - CMS Net and CCS Claims Updated 11/28/2012 1 Introduction/Background... 4 Report Writing (Ad-Hoc)... 4 Requesting Report Writing Access... 4 Java Version... 4 Create A
How To Connect Legrand Crm To Myob Exo
 Legrand CRM MYOB EXO Accounting link and transfer of Data Contents 1. Introduction 2. Adding New Accounts Option 3. Get Latest Financial Data Option 4. Updating Address Details Option 5. Viewing Transaction
Data Entry Training Module
 Data Entry Training Module Estimated Training Time: 1 Hours Data entry training is for users that are planning on entering data into the InsightVision application on scorecards that have already been created.
Creating Reports with Smart View s Ad Hoc Analysis
 with Smart View s Ad Hoc Analysis Dartmouth College February 10, 2009 Table of Contents Overview... 3 Connecting to the Reporting Cube... 3 Setting Ad Hoc Options... 3 The Ad Hoc Grid... 4 Selecting Members
Decision Support AITS University Administration. Web Intelligence 4.1 Reporting Basics
 Decision Support AITS University Administration Web Intelligence 4.1 Reporting Basics 2 Web Intelligence 4.1: Reporting Basics Appropriate Use and Security of Confidential and Sensitive Information Due
MICROSOFT OUTLOOK 2010 WORK WITH CONTACTS
 MICROSOFT OUTLOOK 2010 WORK WITH CONTACTS Last Edited: 2012-07-09 1 Access to Outlook contacts area... 4 Manage Outlook contacts view... 5 Change the view of Contacts area... 5 Business Cards view... 6