InvestmentHighlights For Halliburton Retirement and Savings Plan
|
|
|
- Anabel Knight
- 8 years ago
- Views:
Transcription
1 InvestmentHighlights 2014 For Halliburton Retirement and Savings Plan

2 Contents 2014 Market Update 1 General Information 2 Investment Option Overview 6 Understanding Your Investment Options 10 Retirement Portfolios 12 Single Focus Strategies 24 Disclosure 34 Terms To Know 38 Master Trust Information 39

3 InvestmentHighlights 2014 Market Update Despite Weakening Global Economy, U.S. Economy Strengthens in 2014 After strong returns in 2013, global markets were mixed in 2014 as the U.S. Dollar continued to strengthen, oil prices tumbled, and growth concerns and geopolitical tensions created negative investor sentiment. The initial fourth quarter 2014 GDP estimate came in at 2.6%, showing continued strength. The unemployment rate fell from 5.9% to 5.6%, in line with the long-term average, but the participation rate is still well below the pre-financial crisis high. During the quarter, the yield on 10-year Treasuries declined thirty-five basis points from 2.52% and finished at 2.17%. Domestic large-cap stocks and REITs posted the largest positive returns as investors sought out stability. Conversely, commodities, natural resource stocks and local currency emerging market debt performed poorly due to falling oil prices and the strong performance of the U.S. Dollar. Monetary policy appears to be a key driver behind the domestic results in 2014, and after six straight calendar years of positive performance, the S&P 500 Index is 54% above its pre-financial crisis high. U.S. equities delivered strong returns with the Russell 3000 Index advancing 5.2% in the fourth quarter of 2014 and 12.6% for the year. Returns varied significantly by sector and capitalization over the 12-month period. For the year, largeand mid-cap stocks returned 13.2% each, which outperformed their small-cap counterparts by approximately 8.3%. Mid-cap value was the top-performing style, gaining 14.7%, while small-cap value stocks were the laggard, returning only 4.2%. U.S. corporations have largely exhausted cutting labor costs and refinancing debt as a means to grow earnings, but healthy economic conditions and share repurchases should keep earnings growing at a moderate pace. Lower oil prices may have a negative impact on short-term earnings, but should improve overall profitability through greater consumer spending over time. The strength of the U.S. Dollar is a negative for earnings as S&P 500 corporations generate over 40% of sales abroad. International equities trailed domestic equities as the MSCI ACWI ex-u.s. Index returned -3.9% for both the fourth quarter and one-year period. On a trade-weighted basis, the U.S. Dollar appreciated 5.6% during the quarter and 10.3% in 2014, the strongest calendar year performance since For U.S. investors, the MSCI EAFE Index returned -4.9% and emerging markets returned -2.2% for the year due to currency weakness, tumbling oil prices and economic growth concerns. While the weak economic environment is likely to weigh on earnings, continued currency declines should help profitability, and high operating leverage could lead to an earnings rebound. The drop in energy and other commodity prices has darkened the outlook for emerging market equities and the strengthening U.S. Dollar and risk of higher U.S. interest rates could lead to additional capital outflows. The Federal Reserve terminated the third round of quantitative easing (QE3) and ended its asset purchases at its October meeting, citing an improved economic outlook, contained inflation risks and concerns over the program s effectiveness. Federal Reserve policy rate expectations indicate initial rate increases in mid-2015; however, the bond market is pricing in a much slower pace of rate increase than the Federal Reserve indicates. In 2014, the yield curve flattened as the yield on 2-year Treasuries rose 29 basis points to 0.67% and the yields on 10- and 30-year Treasuries fell 87 and 121 basis points to 2.17% and 2.75%. The Barclays Treasury Index rose 5.0% during the year as investors sought safety. Investment-grade bonds lagged Treasuries for the quarter as spreads widened, but outperformed for the year with a 7.5% return. The Barclays U.S. TIPS Index trailed Treasuries for the fourth quarter and year as inflation breakeven rates declined, while the Barclays U.S. High Yield Index lost 1.0% for the quarter and gained 2.5% for the year as yields increased from 3.8% to 4.8%. Local emerging markets debt tumbled in the second half of the year, dropping 5.7% largely due to currency depreciation against the U.S. Dollar, a weakening global economy and the plunge in oil prices. 1

4 General Information About How the Master Trust Works Features of Investment Highlights Every year Halliburton receives many questions about how the Master Trust works and Investment Highlights attempts to answer these frequently asked questions. There is also a summary of investment options, including performance data, expense ratio and the risk reward profile on pages 6-9. In-depth information about each investment option starts on page 12. See the Terms to Know section on page 38 for definitions used in this brochure. Finally, contact information is located on page 39. Master Trust Why is there a Trust? According to the Employee Retirement Income Security Act of 1974, as amended (ERISA), the assets of U.S. tax-qualified plans, such as the Halliburton Retirement and Savings Plan (the Plan ), must be held in trust and managed by a trustee. What is the Master Trust? The Master Trust is a legal entity that invests the assets of all of the Company s retirement plans. Managing the Plans assets on a consolidated basis provides greater investment flexibility and lower operating costs. Who holds the Master Trust assets? State Street Bank and Trust Company, based in Boston, Massachusetts, serves as both the trustee and custodian for all investment options. State Street is well known as one of the world s largest custodians, with approximately $27.4 trillion in assets under custody and $2.3 trillion under management. What does State Street do? State Street s duty is to act as a fiduciary to the Plan participants. This means that it must act with the care, skill, prudence and diligence under the prevailing circumstances that a prudent person acting in a like capacity and familiar with such matters would use in the conduct of an enterprise of a like character and with like aims. As custodian, in addition to providing accounting and safekeeping, State Street delivers cash management, compliance, foreign exchange and performance measurement services. Who can use Trust assets? By law, Trust assets must be used for the benefit of Plan participants and are not subject to the claims of any Halliburton creditors. These assets cannot be used by the trustee or Halliburton for their own benefit. Are the investment options insured or guaranteed? They are not. Neither Halliburton or any government agency either directly or indirectly insures or guarantees against losses or the performance of the investment options. Who provides recordkeeping services for the Plan? Fidelity Investments provides recordkeeping services for the Plan. As the recordkeeper, Fidelity Investments provides a secure platform for participants to engage in transactions. They are responsible for collecting, processing and posting contributions, transfers and withdrawals into and from participants accounts. Fidelity Investments works with State Street, the custodian of the Plans assets, to value the investment options in your portfolio. 2

5 InvestmentHighlights Go to the Retirement Plan website or call the Halliburton Benefits Center s automated telephone system at any time. See page 39 for more information. Investment Committee Who is responsible for the investment management of the Trust s assets? Halliburton s Chairman of the Board and Chief Executive Officer has appointed an Investment Committee to oversee the investment management of the Trust s assets. The Investment Committee establishes the investment policy and objective for each investment option, selects external professional investment managers and monitors the management of each option. Who are the members of the Investment Committee? Investment Committee members are listed by name and title on page 39 of this booklet. These members have many years of financial experience. The Chairperson of the Investment Committee and her staff are devoted full time to overseeing the day-to-day affairs of the investment options. Investment Options Does the Investment Committee buy and sell the Trust s stocks and bonds? No, the individual securities in the Trust are managed by external professional investment managers selected by the Investment Committee. The Committee furnishes each manager with broad guidelines, specific objectives and certain restrictions. All of the managers are generally well known and respected in the business of managing institutional funds. Many have their own mutual fund families or manage assets for other mutual funds. Due to the significant size of Trust assets, the Investment Committee may be able to employ these managers at a cost below the fees of most other alternatives. The investment managers of each investment option are listed on each option s Fact Sheet in this booklet. Who pays the expenses of maintaining the Trust? Most operating expenses are paid from the Trust assets. The principal expenses include, but are not limited to, external professional investment management, Plan recordkeeping services and trustee/custodial fees. These expenses proportionally lower the return of each investment option. The reduction in the return is expressed as a percentage and dollar amount per $1,000 of investment and that varies for each investment option based on the structure and complexity of the option. The 2014 annual operating expense ratio of each investment option is listed on each option s Fact Sheet in this booklet. A summary of expense ratios of all investment options can be found on pages 6-9. In keeping with industry standards, transaction costs incurred for buying and selling securities are not reflected in these ratios. However, these transaction costs are reflected in the investment performance of the options. Actual future expenses may be higher or lower than those shown. A Note About Operating Expense Ratios An expense ratio is the amount of an investment option s operating expenses compared with the investment option s total asset base, expressed as a percentage. Because expenses are paid from fund assets, a lower expense ratio is desirable. Based on a survey of the Lipper mutual fund database, the following are a few examples of average expense ratios for retail funds compared with some of the institutionally managed investment options offered through the Plan. The expense ratio for each of the investment options can be found on its summary page in this booklet. (a) For 2014 (b) Source: Mercer Investment Mutual Fund Median Halliburton Option Option Type Expense Ratio(a)(b) Expense Ratio(a) U.S. Bonds 0.20% 0.15% (Bond Index Strategy) Large Cap Core Equity 0.20% 0.12% (S&P 500 Index Strategy) Non-U.S. Equity 0.99% 0.58% (Non-U.S. Equity Strategy) Small Cap Equity 1.01% 0.90% (Small Cap Equity Strategy) 3

6 General Information About How the Master Trust Works Why does Halliburton use institutionally managed separate accounts? Most of the Master Trust s investments are structured using institutionally managed separate accounts; this means the accounts are managed only for participants in the Master Trust. Unlike mutual funds, this structure provides the Investment Committee with the flexibility to select managers and establish investment objectives designed specifically for the Master Trust. This arrangement may result in lower expense ratios (fees) for the various investment options. Why do we have different investment option choices? Plan participants have different financial goals, time frames, risk tolerances and return targets. Each investment option has different risk and return characteristics. The Trust s investment options enable Plan participants to structure an investment strategy to fit their individual needs. See pages 6-9 for a summary of each investment options risk and return characteristics. Can I make changes to how my account is invested among the different investment options? There are four ways you can change your account investments: You can change how all future contributions to your account will be invested at any time. You can make a direct option transfer by selecting what options to take money out of and what options will receive that money (subject to the Excessive Trading Policy). A direct option transfer is a one-time-only event and will not change your future option investment allocations. You can make an option reallocation (subject to the Excessive Trading Policy). Reallocation is a way to get the investment mix to what you want without making a lot of individual exchanges. When you reallocate your investments, you can move money among several investment options at one time, resulting in the asset mix you choose. Once you have chosen a target allocation, you can sign up to be alerted if your allocation slips from those target percentages. Fidelity will send you an alert with a link to its site to update your allocation. This will not change your future investment allocation. You can elect to have your investments automatically rebalanced quarterly, semi-annually or annually to your desired allocation to stay consistent with the investment strategy you have chosen. You simply identify an initial investment combination, adjust your account to that mix and let the service do the rest. You can make any of these changes at the Retirement Plan website or by calling the Halliburton Benefits Center s automated telephone system (see page 39), in accordance with our Excessive Trading Policy. Your transfer or reallocation will be effective the same business day if the request is made before the close of the market (typically 3 p.m. Central Time). Changes to future contributions will be effective the next possible pay period. You do not pay any entry or exit fees in connection with making a transfer or reallocation. What is the Excessive Trading Policy? The Excessive Trading Policy focuses on what is known as a round-trip transaction. A round-trip is an exchange into and out of the same investment option, in excess of $1,000, within 30 days. Under the Policy, participants are limited to one round-trip transaction in any investment option within any rolling 90-day period, subject to an overall limit of four roundtrip transactions across all investment options over a rolling 12-month period. The Policy governing the Stable Value Strategy works differently. If money is transferred or reallocated into the Stable Value Strategy, the number of units acquired in the transaction cannot be transferred out of the Stable Value Strategy for 30 calendar days. However, any units already in the Stable Value Strategy prior to the transaction are not subject to the 30-day waiting period. For more details about the Excessive Trading Policy, please refer to the Safe Harbor Notice or Updates to the Summary Plan Description. You can find these documents on the Retirement Plan website; click on Plan Information and Documents. You can also obtain a copy by calling Fidelity 4
 for the various investment options. Why do we have different investment option choices?")
7 InvestmentHighlights Go to the Retirement Plan website or call the Halliburton Benefits Center s automated telephone system at any time. See page 39 for more information. at (866) If you are calling internationally, use your country s AT&T access code, then (866) Or, for toll calls, you can dial (857) and select option 2. Does the Company make contributions in cash or Company stock? All contributions to the Plan are made in cash. That cash is then invested according to your investment choices. How can I track the performance of my investment in the Plan? Go to the Retirement Plan website or call the Benefits Center s automated telephone system (see contact information on page 39) for up-to-date rates of return. For comparative purposes, the Investment Committee has selected a benchmark index (or group of indexes) for each of the investment options. Where can I find more current information about each option and its performance? To access the latest option characteristics or personal account information, you must log in to the Retirement Plan website (see contact information on page 39). To log in, you will need your Social Security number or user name and password. For new users, click on Register Account and follow the instructions. their option values, including with respect to fixedrate investment contracts issued by banks or insurance companies the name of the issuer, the contract term and the rate of return on the contract. Investment Highlights The most recent past and current investment performance of each option, determined net of expenses, on a reasonable and consistent basis. Account Activity Statement A report of your current account balances in each option. Understanding Your Account Activity Information concerning the value of shares or units in the investment options. Materials Provided to the Plan For all investment options, you are entitled to receive the most recent financial statements and reports and similar materials provided to the Plan, including a description of the annual operating expenses of each option that reduce the rate of return to participants and beneficiaries and the aggregate amount of option expenses expressed as a percentage of average net assets of the option. What additional information is available? You or your beneficiary may request the following information through the Retirement Plan website, the automated telephone system or a Halliburton Benefits Center representative. See contact information on page 39. List of Assets A listing of investment option assets and 5

8 Investment Option Overview The table below includes important information to help you compare the investment options under your retirement plan. It shows how the investment options have performed over time and allows you to compare them with an appropriate benchmark for the same time periods. Keep in mind that you cannot invest in the benchmark indices, which are set forth in italics on the chart underneath the name of each investment option. Annualized Net of Fees Returns as of December 31, 2014 Investment Option Name / Benchmark Name TARGET DATE PORTFOLIO (a) (a) The Target Date Portfolios are the qualified default investment alternative (QDIA) under the Plan within the meaning of the applicable U.S. Department of Labor regulations. (b) Where the investment option has been in existence for less than 10 years, performance provided is for the life of the investment option, which is since the inception date. (c) Most investment options use institutionally managed separate accounts; this means the accounts are managed only for participants in the Halliburton Plans. Individual securities are bought and sold by professional investment managers selected by the Investment Committee. Collective Trust Funds are investment vehicles operated by banks or trust companies. Neither collective trust funds nor separate accounts are mutual funds. Unlike mutual funds, separate accounts and collective trust funds are not subject to and are not registered under the Securities Act of 1933 or the Investment Company Act of Trading Restrictions focus on what is known as a round-trip transaction. A round-trip is an exchange into and out of the same investment option, in excess of $1,000, within 30 days. Under the Policy, participants are limited to one round-trip transaction in any investment option within any rolling 90-day period, subject to an overall limit of four round-trip transactions across all investment options over a rolling 12-month period. The Policy governing the Stable Value Strategy (SVS) works differently. If money is transferred or reallocated into the SVS the number of units acquired in the transaction cannot be transferred out of the SVS for 30 calendar days. However, any units already in the SVS prior to the transaction are not subject to the 30-day waiting period. Inception Date Management Style 1-Year 3-Years 5-Years Income Retirement Portfolio (b) 6/18/13 Active 3.3% n/a n/a 3.0% 14.2% MSCI All County World Index/20.4% Barclays Capital US Aggregate Index/37.9% Hueler Stable Value Pooled Fund Comparative Universe/16.3% Barclays Capital US Treasury Inflation Protected Securities (TIPS) Index/3.8% Dow Jones US Select REIT Index/3.8% Dow Jones- UBS Roll Select Commodity Index/1.9% S&P Global LargeMidCap Commodity and Resources Index/1.6% Bank of America Merrill Lynch High Yield Bond Index 10-Years / Life (b) 3.4% 3.8% 4.6% 2.9% 2005 Retirement Portfolio (b) 6/18/13 Active 3.2% n/a n/a 3.9% 20.7% MSCI All County World Index/22.7% Barclays Capital US Aggregate Index/31.0% Hueler Stable Value Pooled Fund Comparative Universe/13.3% Barclays Capital US Treasury Inflation Protected Securities (TIPS) Index/4.0% Dow Jones US Select REIT Index/4.0% Dow Jones- UBS Roll Select Commodity Index/2.0% S&P Global LargeMidCap Commodity and Resources Index/2.3% Bank of America Merrill Lynch High Yield Bond Index 3.8% 5.7% 5.9% 4.3% 2010 Retirement Portfolio (b) 6/18/13 Active 3.8% n/a n/a 5.3% 35.9% MSCI All County World Index/28.1% Barclays Capital US Aggregate Index/15.0% Hueler Stable Value Pooled Fund Comparative Universe/6.4% Barclays Capital US Treasury Inflation Protected Securities (TIPS) Index/4.2% Dow Jones US Select REIT Index/4.2% Dow Jones- UBS Roll Select Commodity Index/2.1% S&P Global LargeMidCap Commodity and Resources Index/4.0% Bank of America Merrill Lynch High Yield Bond Index 4.1% 7.2% 6.7% 5.5% 2015 Retirement Portfolio (b) 6/18/13 Active 3.9% n/a n/a 6.4% 46.6% MSCI All County World Index/31.8% Barclays Capital US Aggregate Index/3.8% Hueler Stable Value Pooled Fund Comparative Universe/1.6% Barclays Capital US Treasury Inflation Protected Securities (TIPS) Index/4.4% Dow Jones US Select REIT Index/4.4% Dow Jones- UBS Select Roll Commodity Index/2.2% S&P Global LargeMidCap Commodity and Resources Index/5.2% Bank of America Merrill Lynch High Yield Bond Index 4.5% 8.7% 7.5% 6.7% 2020 Retirement Portfolio (b) 6/18/13 Active 3.7% n/a n/a 7.4% 56.9% MSCI All County World Index/23.6% Barclays Capital US Aggregate Index/0.3% Hueler Stable Value Pooled Fund Comparative Universe/0.1% Barclays Capital US Treasury Inflation Protected Securities (TIPS) Index/5.1% Dow Jones US Select REIT Index/5.1% Dow Jones- UBS Select Roll Commodity Index/2.56% S&P Global LargeMidCap Commodity and Resources Index)/6.3% Bank of America Merrill Lynch High Yield Bond Index 4.4% 10.0% 8.1% 7.6% 2025 Retirement Portfolio (b) 6/18/13 Active 3.6% n/a n/a 7.9% 64.1% MSCI All County World Index/14.6% Barclays Capital US Aggregate Index/5.7% Dow Jones US Select REIT Index/5.7% Dow Jones-UBS Roll Select Commodity Index/2.8% S&P Global LargeMidCap Commodity and Resources Index/7.1% Bank of America Merrill Lynch High Yield Bond Index 4.1% 10.7% 8.4% 8.0% 2030 Retirement Portfolio (b) 6/18/13 Active 3.6% n/a n/a 8.5% 69.4% MSCI All County World Index/7.5% Barclays Capital US Aggregate Index/6.2% Dow Jones US Select REIT Index/6.2% Dow Jones-UBS Roll Select Commodity Index/3.1% S&P Global LargeMidCap Commodity and Resources Index/7.7% Bank of America Merrill Lynch High Yield Bond Index 4.0% 11.3% 8.6% 8.4% 2035 Retirement Portfolio (b) 6/18/13 Active 3.7% n/a n/a 8.6% 71.4% MSCI All County World Index/4.9% Barclays Capital US Aggregate Index/6.3% Dow Jones US Select REIT Index/6.3% Dow Jones-UBS Roll Select Commodity Index/3.2% S&P Global LargeMidCap Commodity and Resources Index/7.9% Bank of America Merrill Lynch High Yield Bond Index 3.9% 11.4% 8.7% 8.4% 2040 Retirement Portfolio (b) 6/18/13 Active 4.1% n/a n/a 9.0% 71.5% MSCI All County World Index/4.5% Barclays Capital US Aggregate Index/6.4% Dow Jones US Select REIT Index/6.4% Dow Jones-UBS Roll Select Commodity Index/3.2% S&P Global LargeMidCap Commodity and Resources Index/8.0% Bank of America Merrill Lynch High Yield Bond Index 3.8% 11.4% 8.7% 8.4% 2045 Retirement Portfolio (b) 6/18/13 Active 3.8% n/a n/a 8.8% 71.5% MSCI All County World Index/4.5% Barclays Capital US Aggregate Index/6.4% Dow Jones US Select REIT Index/6.4% Dow Jones-UBS Roll Select Commodity Index/3.2% S&P Global LargeMidCap Commodity and Resources Index/8.0% Bank of America Merrill Lynch High Yield Bond Index 3.8% 11.4% 8.7% 8.4% 2050 Retirement Portfolio (b) 6/18/13 Active 4.5% n/a n/a 9.2% 71.5% MSCI All County World Index/4.5% Barclays Capital US Aggregate Index/6.4% Dow Jones US Select REIT Index/6.4% Dow Jones-UBS Roll Select Commodity Index/3.2% S&P Global LargeMidCap Commodity and Resources Index/8.0% Bank of America Merrill Lynch High Yield Bond Index 3.8% 11.4% 8.7% 8.4% 2055 Retirement Portfolio (b) 6/18/13 Active 4.4% n/a n/a 9.3% 71.5% MSCI All County World Index/4.5% Barclays Capital US Aggregate Index/6.4% Dow Jones US Select REIT Index/6.4% Dow Jones-UBS Roll Select Commodity Index/3.2% S&P Global LargeMidCap Commodity and Resources Index/8.0% Bank of America Merrill Lynch High Yield Bond Index 3.8% 11.4% 8.7% 8.4% 6
 (a) The Target Date Portfolios are the qualified default investment")
9 InvestmentHighlights To direct or change your Plan investment options or for current information, including month-end performance, or a free paper copy of available information, please visit (if you are a current employee) or (if you are a former employee). You may also call the Halliburton Benefits Center at (866) (international toll free, use your country s AT&T access code, then (866) ) or for toll call (857) , select option 2. Mailing address is Fidelity Investments, P.O. Box #770003, Cincinnati, OH Expense One Year Ending Annual Net of Fees Return December 31, Annual Turnover Ratio as of December 31, 2014 Investment Structure (c) Market Risk Inflation Risk Potential Return % of Assets Per $1,000 Invested n/a n/a n/a n/a 3.3% 241% Separate Account Low Moderate Low 0.44% $4.40 n/a n/a n/a n/a 3.4% n/a n/a n/a n/a 3.2% 274% Separate Account Low Moderate Moderate 0.46% $4.60 n/a n/a n/a n/a 3.8% n/a n/a n/a n/a 3.8% 235% Separate Account Moderate Moderate Moderate 0.46% $4.60 n/a n/a n/a n/a 4.1% n/a n/a n/a n/a 3.9% 200% Separate Account Moderate Moderate Moderate 0.46% $4.60 n/a n/a n/a n/a 4.5% n/a n/a n/a n/a 3.7% 138% Separate Account Moderate Low Moderate 0.47% $4.70 n/a n/a n/a n/a 4.4% n/a n/a n/a n/a 3.6% 93% Separate Account High Low High 0.48% $4.80 n/a n/a n/a n/a 4.1% n/a n/a n/a n/a 3.6% 59% Separate Account High Low High 0.47% $4.70 n/a n/a n/a n/a 4.0% n/a n/a n/a n/a 3.7% 50% Separate Account High Low High 0.47% $4.70 n/a n/a n/a n/a 3.9% n/a n/a n/a n/a 4.1% 50% Separate Account High Low High 0.47% $4.70 n/a n/a n/a n/a 3.8% n/a n/a n/a n/a 3.8% 49% Separate Account High Low High 0.47% $4.70 n/a n/a n/a n/a 3.8% n/a n/a n/a n/a 4.5% 49% Separate Account High Low High 0.48% $4.80 n/a n/a n/a n/a 3.8% n/a n/a n/a n/a 4.4% 46% Separate Account High Low High 0.48% $4.80 n/a n/a n/a n/a 3.8% Fees and Expenses include all charges to the investment options except for individual services that a participant may select, such as overnight mailing fees of $25 per transaction. Each investment option does not charge fees to contribute, transfer or withdraw from the option. Investment option performance is compared with benchmark index. Indices are unmanaged portfolios of specified securities and the indices do not reflect any initial or ongoing expenses. The investment option s portfolio may differ significantly from the securities in the indices. Investment performance is determined after fees are charged to the options and assumes reinvestment of dividends and capital gains. Transaction costs incurred for buying and selling securities become part of the cost basis of the securities and are not included in the expense ratio. These costs, along with management fees, plan administration fees and other fees are paid out of the investment option s assets, reducing the rate of return realized by participants. The cumulative effect of fees and expenses can substantially reduce the growth of a participant s retirement account. Participants are encouraged to visit the Employee Benefits Security Administration website at: for information and examples demonstrating the long-term effect of fees and expenses. Fees and expenses are only one of several factors that participants and beneficiaries should consider when making investment decisions. Plan Administrator: Halliburton Company Benefits Committee N. Sam Houston Pkwy E., Halliburton Plaza 1, 2311, Houston, TX 77032, telephone number (281)

10 Investment Option Overview The table below includes important information to help you compare the investment options under your retirement plan. It shows how the investment options have performed over time and allows you to compare them with an appropriate benchmark for the same time periods. Keep in mind that you cannot invest in the benchmark indices, which are set forth in italics on the chart underneath the name of each investment option. Annualized Net of Fees Returns as of December 31, 2014 Investment Option Name / Benchmark Name STABLE VALUE Inception Date Management Style 1-Year 3-Years 5-Years Stable Value Strategy 1/2/87 Active 2.3% 2.9% 3.2% 4.1% Hueler Stable Value Pooled Fund Universe 1.7% 1.9% 2.3% 3.3% 90 Day TBills 0.0% 0.1% 0.1% 1.6% BONDS Bond Index Strategy 4/1/99 Passive 5.8% 2.5% 4.3% 4.6% Barclays Capital US Aggregate Bond Index 6.0% 2.7% 4.4% 4.7% Intermediate Bond Strategy (b) 7/31/12 Active 5.0% n/a n/a 1.8% Barclays Capital US Aggregate Bond Index 6.0% 2.7% 4.5% 1.7% STOCKS S&P 500 Index Strategy 4/1/99 Passive 13.5% 20.3% 15.3% 7.6% S&P500 Index 13.7% 20.4% 15.5% 7.7% Large Cap Equity Strategy (b) 6/18/13 Active 9.3% n/a n/a 17.7% Russell 1000 Index 13.2% 20.6% 15.6% 18.4% Non US Equity Index Strategy (b) 7/31/12 Passive -4.4% n/a n/a 9.2% MSCI All Country World ex. U.S. Index -3.9% 9.5% 4.9% 9.4% Non US Equity Strategy 4/1/99 Active -5.2% 9.6% 5.6% 6.6% MSCI All Country World ex. U.S. Index -3.9% 9.0% 4.4% 5.1% Mid Cap Equity Index Strategy (b) 1/3/05 Passive 9.6% 19.8% 16.4% 9.6% S&P MidCap 400 Index 9.8% 20.0% 16.5% 9.7% Small Cap Equity Strategy 4/1/99 Active 5.9% 18.7% 15.2% 7.5% Russell 2000 Index 4.9% 19.2% 15.5% 7.8% OTHERS Inflation Sensitive Strategy 6/18/13 Active 1.4% n/a n/a -1.8% 45% Barclays US Treasury Inflation Protected Serurities (TIPS) Index/ 20% Dow Jones-UBS Commodity Index Total Return/15% JPMorgan Emerging Local Markets Plus (ELMI+)/10% Dow Jones US Select REIT Total Return Index/10% Dow Jones-UBS Gold Subindex Total Return 10-Years / Life (b) -0.3% -0.3% 3.2% -2.8% (a) The Target Date Portfolios are the qualified default investment alternative (QDIA) under the Plan within the meaning of the applicable U.S. Department of Labor regulations. (b) Where the investment option has been in existence for less than 10 years, performance provided is for the life of the investment option, which is since the inception date. (c) Most investment options use institutionally managed separate accounts; this means the accounts are managed only for participants in the Halliburton Plans. Individual securities are bought and sold by professional investment managers selected by the Investment Committee. Collective Trust Funds are investment vehicles operated by banks or trust companies. Neither collective trust funds nor separate accounts are mutual funds. Unlike mutual funds, separate accounts and collective trust funds are not subject to and are not registered under the Securities Act of 1933 or the Investment Company Act of Trading Restrictions focus on what is known as a round-trip transaction. A round-trip is an exchange into and out of the same investment option, in excess of $1,000, within 30 days. Under the Policy, participants are limited to one round-trip transaction in any investment option within any rolling 90-day period, subject to an overall limit of four round-trip transactions across all investment options over a rolling 12-month period. The Policy governing the Stable Value Strategy (SVS) works differently. If money is transferred or reallocated into the SVS the number of units acquired in the transaction cannot be transferred out of the SVS for 30 calendar days. However, any units already in the SVS prior to the transaction are not subject to the 30-day waiting period. 8

11 InvestmentHighlights To direct or change your Plan investment options or for current information, including month-end performance, or a free paper copy of available information, please visit (if you are a current employee) or (if you are a former employee). You may also call the Halliburton Benefits Center at (866) (international toll free, use your country s AT&T access code, then (866) ) or for toll call (857) , select option 2. Mailing address is Fidelity Investments, P.O. Box #770003, Cincinnati, OH Annual Net of Fees Return Expense One Year Ending December 31, Annual Turnover Ratio as of December 31, 2014 Investment Structure (c) Market Risk Inflation Risk Potential Return % of Assets Per $1,000 Invested 4.2% 3.6% 3.6% 3.3% 2.3% 353% Separate Account Low High Low 0.55% $ % 3.1% 2.7% 2.3% 1.7% 0.2% 0.1% 0.1% 0.1% 0.0% 5.9% 6.4% 7.7% 4.0% 5.8% 87% Collective Trust Low High Low 0.15% $ % 6.5% 7.8% 4.2% 6.0% n/a n/a n/a n/a 5.0% 764% Separate Account Low High Low 0.38% $3.80 n/a n/a n/a n/a 6.0% 26.4% 15.0% 2.0% 15.9% 13.5% 3% Collective Trust High Low High 0.12% $ % 15.1% 2.1% 16.0% 13.7% n/a n/a n/a n/a 9.3% 32% Separate Account High Low High 0.56% $5.60 n/a n/a n/a n/a 13.2% n/a n/a n/a n/a -4.4% 1% Collective Trust High Low High 0.18% $1.80 n/a n/a n/a n/a -3.9% 40.5% 13.4% -11.8% 20.2% -5.2% 39% Separate Account High Low High 0.58% $ % 8.4% -16.1% 16.8% -3.9% 37.0% 26.4% -1.9% 17.7% 9.6% 11% Collective Trust High Low High 0.15% $ % 26.6% -1.7% 17.9% 9.8% 41.3% 27.6% -5.1% 10.7% 5.9% 74% Separate Account High Low High 0.90% $ % 26.9% -4.2% 16.3% 4.9% n/a n/a n/a n/a 1.4% 80% Collective Trust Moderate Low Low 1.05% $10.50 n/a n/a n/a n/a -0.3% Fees and Expenses include all charges to the investment options except for individual services that a participant may select, such as overnight mailing fees of $25 per transaction. Each investment option does not charge fees to contribute, transfer or withdraw from the option. Investment option performance is compared with benchmark index. Indices are unmanaged portfolios of specified securities and the indices do not reflect any initial or ongoing expenses. The investment option s portfolio may differ significantly from the securities in the indices. Investment performance is determined after fees are charged to the options and assumes reinvestment of dividends and capital gains. Transaction costs incurred for buying and selling securities become part of the cost basis of the securities and are not included in the expense ratio. These costs, along with management fees, plan administration fees and other fees are paid out of the investment option s assets, reducing the rate of return realized by participants. The cumulative effect of fees and expenses can substantially reduce the growth of a participant s retirement account. Participants are encouraged to visit the Employee Benefits Security Administration website at: for information and examples demonstrating the long-term effect of fees and expenses. Fees and expenses are only one of several factors that participants and beneficiaries should consider when making investment decisions. Plan Administrator: Halliburton Company Benefits Committee N. Sam Houston Pkwy E., Halliburton Plaza 1, 2311, Houston, TX 77032, telephone number (281)

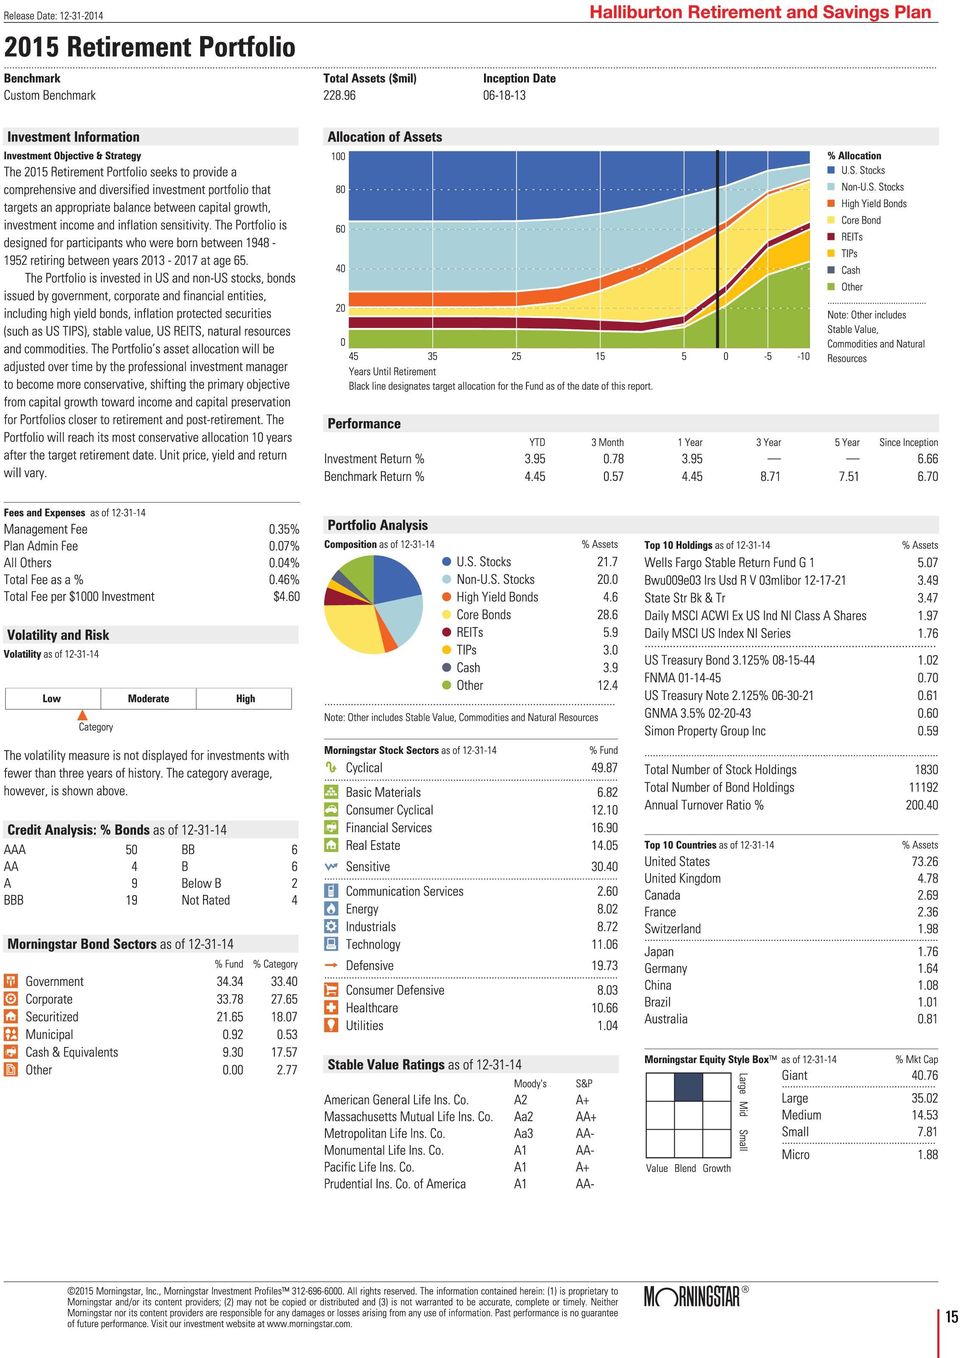
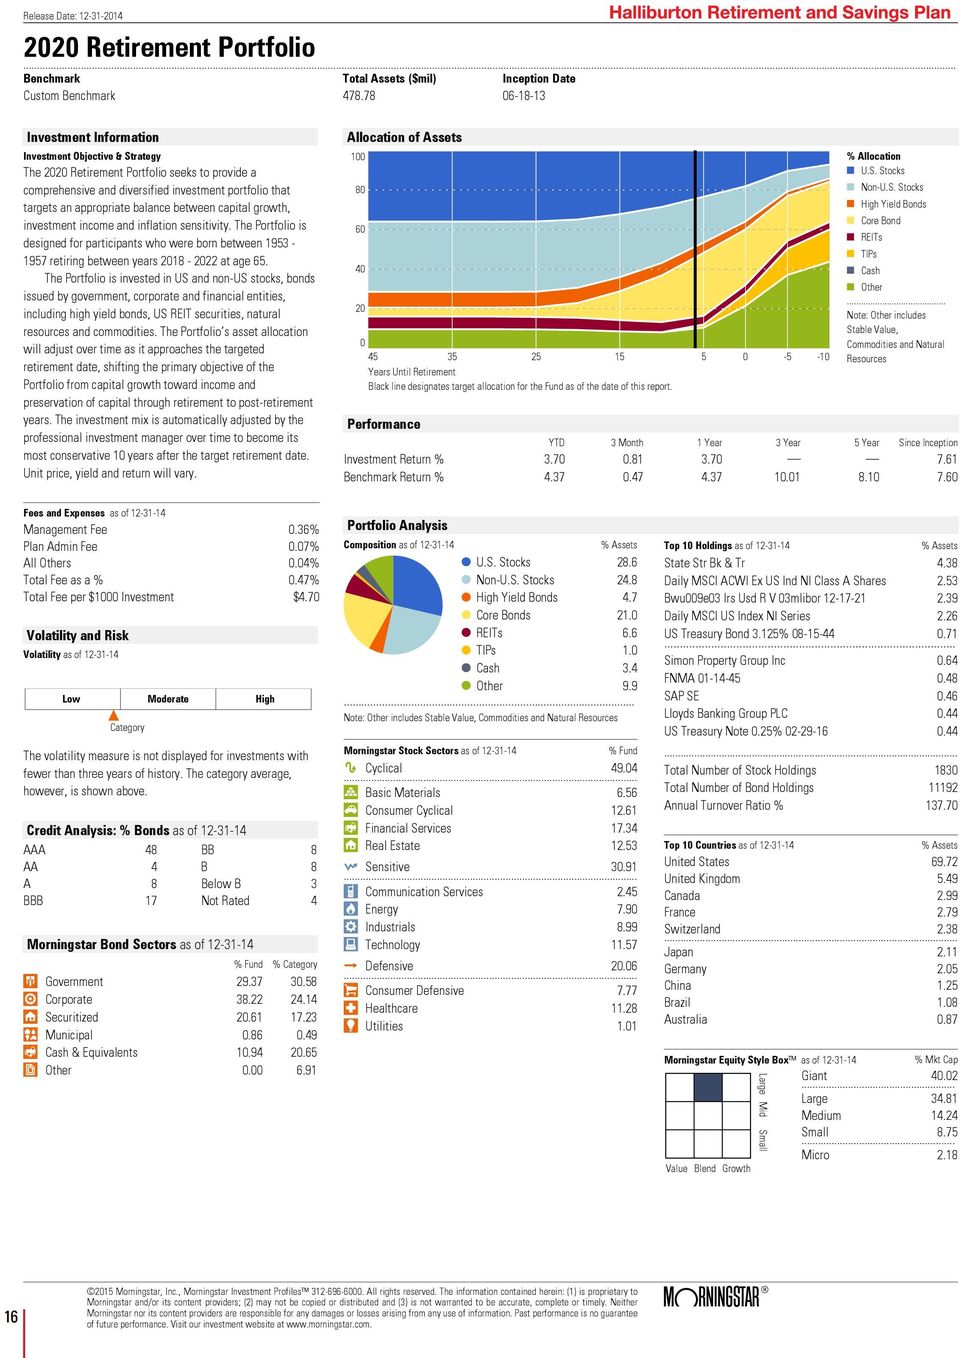
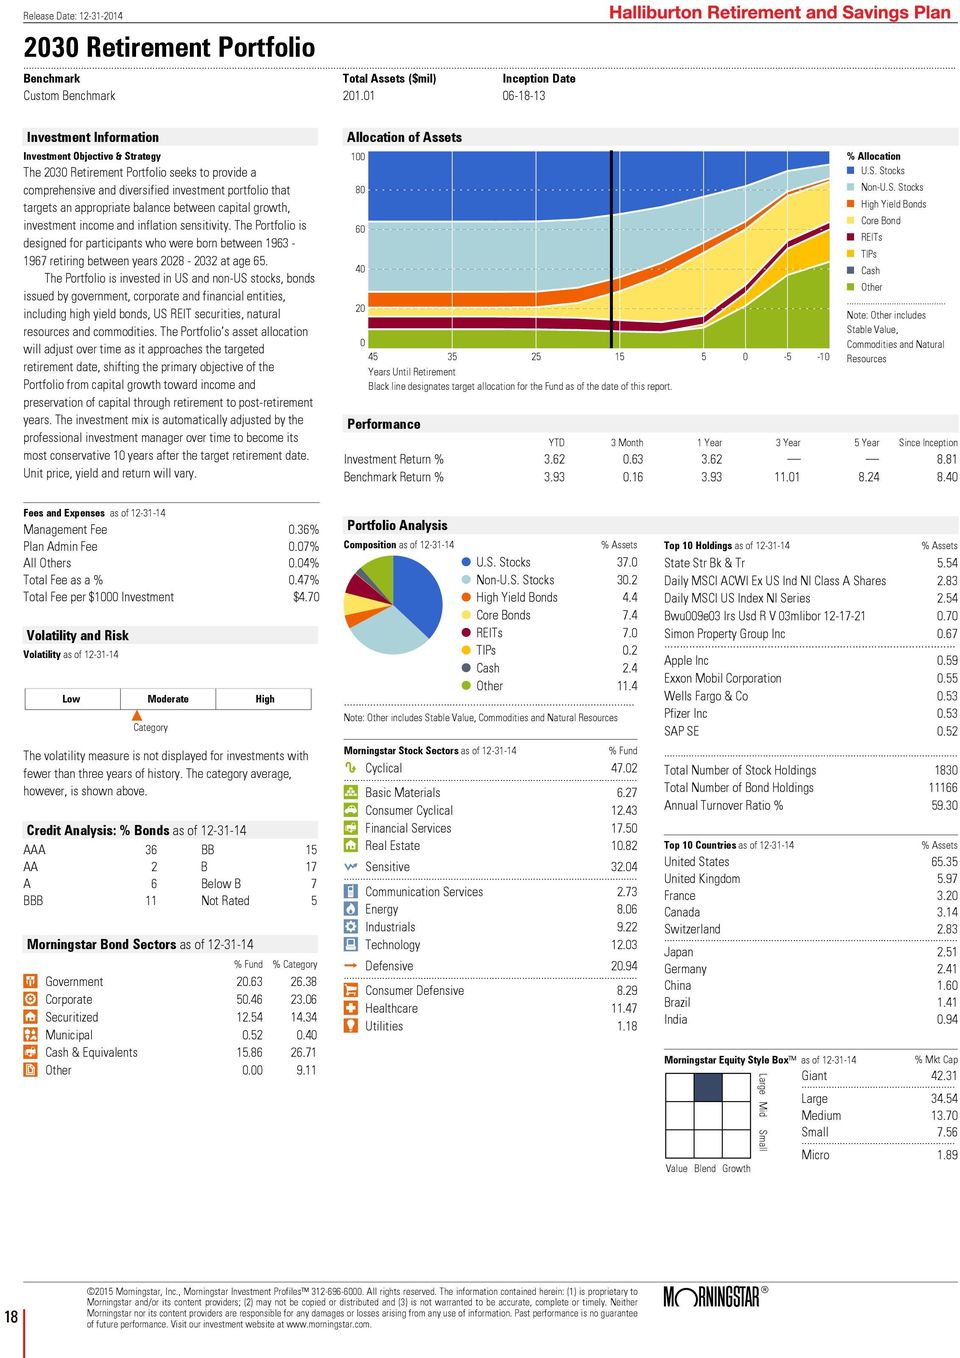
12 Understanding Your Investment Options This section provides you a guide to understanding the information on each of the following Fact Sheets. 1. General Information This section shows the benchmark with which the investment option s performance is compared, the total Plan assets of the option in millions and the inception date of the option. Each investment option has a benchmark listed. The benchmark is intended to represent the standard return for this type of investment and can be used to review longterm performance for the investment and to compare the Halliburton investment option s performance. 2. Investment Objective & Strategy The objective is the goal and purpose of the option and the investment strategy is what the option will invest in to achieve the goal. 3. Fees and Expenses Fees and expenses are presented as a percentage of the option s asset value and in dollars per $1,000 worth of investment. This shows how much your expenses are per $1,000 you have invested in this option. 4. Volatility Analysis This graph illustrates the option s volatility. Options with a wider range of price fluctuations are labeled high, as they are considered riskier than options with a narrower range of price fluctuations. The more volatile an investment the higher the risk it carries of losing capital on your base investment, if you withdraw or transfer your money out of the investment option when the price is low. 5. Credit Analysis The analysis reveals the percentage of fixed-income securities that fall within each credit-quality rating as assigned by Moody s. At the top of the ratings are U.S. government bonds. Bonds issued and backed by the federal government are high quality and thus are rated AAA, which is the highest possible rating a corporate issue can receive. 6. Bond Sectors This section is a snapshot of the bond sectors the investment option is invested in. 7. Performance This section gives you information on how the option has performed over time, as compared to the benchmark, illustrating the change in the value of the option. Remember, past performance is not an indication of future returns. 8. Portfolio Composition A breakdown of the option holdings into eight general investment groups: Cash, U.S. Stocks, Non-U.S. Stocks, High Yield Bonds, Core Bonds, REITs, TIPs and Other. Stable Value, commodities and Natural Resources are reported under Other. 9. Stock Sectors This section is a snapshot of the stock sectors in which the investment option is invested. Stocks are mapped into one of 11 sectors, which in turn roll up to three super sectors. 10. Stable Value Ratings The analysis reveals the credit quality ratings of each stable value wrap provider as assigned by Moody s and S&P. 11. Top Holdings Where applicable, these charts provide the top 10 holdings, country allocation and sectors of the securities held in the option. 12. Top 10 Countries Where applicable, these charts provide the top 10 countries held in the option. 13. Equity Style Box Where applicable, the Equity Style Box is a nine-square grid that provides a graphical representation of the investment style of stocks and mutual funds. For equity funds, it classifies securities according to market capitalization (the vertical axis) and growth and value factors (the horizontal axis). Management Company Firm(s) responsible for managing the underlying portfolio(s) for the option is(are) listed in this section. This is located in the Disclosure section, beginning on page 34, along with other additional information about the investment options. 10

13 InvestmentHighlights SAMPLE

14 12

15 13

16 14

17 15
18 16
19 17

20 18
21 19
22 20
23 21
24 22
25 23
26 24
27 25
28 26
29 27
30 28
31 29
32 30
33 31
34 32
35 33
36 Disclosure The Halliburton Retirement and Savings Plan (Plan) is intended to be a participant-directed plan as described in Section 404(c) of the Employee Retirement Income Security Act of 1974, as amended (ERISA). Therefore, the fiduciaries of this plan are generally relieved of liability for any losses that are the result of any investment instructions given by a participant or a beneficiary of the Plan. The investment s principal value and investment return will fluctuate, so that an investor s unit values may be worth more or less than at the time of the original investment. In accordance with ERISA, the Plan assets are held in trust for the exclusive benefit of participants and beneficiaries. As with all 401(k) plans, assets are not FDIC-insured, may lose value and are not guaranteed by a bank, the Plan sponsor or other financial institution. Reliable sources are utilized to produce these reports but there is no warranty or guarantee that this data is accurate, timely, or complete. Historic performance is not an indication of future results and should not be relied upon to predict future investment returns. The allocation directed to each underlying investment manager under each investment option has been selected by the Halliburton Company Investment Committee in consultation with Mercer Investment Consulting, Inc., the investment advisor to the Plan. The individual investment options will be reviewed periodically and the Investment Committee will modify the allocations and/or underlying investment managers when deemed appropriate. Mercer Investment Consulting, Inc. ( Mercer ) serves as the investment manager for the Retirement Portfolios. The Halliburton Company Investment Committee has delegated its authority to design the asset allocation and manage the Retirement Portfolios to Mercer. The Retirement Portfolios performance will be reviewed and Mercer will modify the allocations and/or underlying investment managers when deemed appropriate. The Retirement Portfolios will pay an annualized management fee to Mercer, which is included in the total expense ratio. As with most Plan fees, the Mercer fee will also be based on the total assets held in the Retirement Portfolio. Contact Information For current information, please visit www. halliburton.com/totalrewards (if you are a current employee) or (if you are a former employee). You may also call the Halliburton Benefits Center at (international toll free, use your country s AT&T access code, then ) or for toll call , select option 2. Principal Risk The Retirement Portfolios are professionally managed and will reach the most conservative allocation 10 years after the target retirement date. The investment risk of each Retirement Portfolio may change as the allocation of the underlying holdings in the Portfolio change to correspond with its objective. The Retirement Portfolios and Single Focus Strategies are subject to the volatility of financial markets, including U.S. and non U.S. equity and fixed income markets. The Portfolio is also subject to risks associated with investing in high-yield bonds, small-cap stocks, commodities and real estate. Principal invested is not guaranteed at any time. There is no guarantee that investment in the Retirement Portfolios will provide adequate retirement income. Stock markets are volatile and can decline significantly in response to adverse issuer, political, regulatory, market or economic developments. The securities of smaller, less well-known companies can be more volatile than those of large companies. Foreign securities and currencies, especially those in emerging markets, involve greater risk and may offer greater potential returns than U.S. investments. This risk includes political and economic uncertainties of foreign countries. In general, the bond market is volatile, and bond securities carry interest rate risk. As interest rates rise, bond prices usually fall and vice versa. This effect is usually more pronounced for longer-term securities. Bonds also carry inflation risk, liquidity risk, call risk, and credit and default risks for both issuers and counterparties. Unlike individual bonds, most bond investment options do not have a maturity date, so avoiding losses caused by price volatility by holding the investment option until maturity is not possible. The principal value of inflation-linked bonds adjusts with inflation but declines in value when real interest rates rise and vice versa. Commodities contain heightened risk including market, political, regulatory and natural conditions. Real estate investment trusts (REITs) are subject to general stock market risk, real estate market declines and adverse changes to REIT tax laws. Stable value assets are generally invested in high quality, diversified bond portfolios that are protected against interest rate volatility by contracts issued by banks and insurance companies. These contracts are backed solely by the financial resources of the bank and insurance companies and by the portfolios of securities. The stable value assets are not insured or guaranteed by the manager(s), the plan sponsor, the trustee, the FDIC, or any other government agency. The contracts are designed to allow participants to transact at contract value (principal plus accrued interest less expenses). Withdrawals prompted by certain events (e.g., layoffs, early retirement windows, spin-offs, sale of a division, facility closings, plan terminations, partial plan terminations, changes in laws or regulations) may be paid at the market value of the bond portfolios. Performance Investment option performance is determined after fees are charged to the investment option and assumes reinvestment of dividends and capital gains. Investment option performance is compared with the blended benchmark index. An index is an unmanaged portfolio of specified securities and does not reflect any initial or ongoing expenses. The investment option s portfolio may differ significantly from the securities in the index. 34
37 InvestmentHighlights Blended Benchmark Retirement Portfolios Income MSCI All County World Index 71.6% 71.6% 71.6% 71.6% 71.3% 69.3% 64.3% 57.0% 46.5% 36.0% 20.6% 14.2% Barclays Capital U.S. Aggregate Index 4.4% 4.4% 4.4% 4.4% 5.0% 7.5% 14.4% 23.5% 31.9% 28.1% 22.8% 20.5% Hueler Stable Value Pooled Fund Comparative Universe Barclays Capital U.S. Treasury Inflation Protected Securities (TIPS) Index 0.0% 0.0% 0.0% 0.0% 0.0% 0.0% 0.0% 0.3% 3.8% 15.0% 31.0% 37.9% 0.0% 0.0% 0.0% 0.0% 0.0% 0.0% 0.0% 0.1% 1.6% 6.4% 13.3% 16.3% Dow Jones U.S. Select REIT Index 6.4% 6.4% 6.4% 6.4% 6.3% 6.2% 5.7% 5.1% 4.4% 4.2% 4.0% 3.8% Bloomberg Commodity Index Total Return 6.4% 6.4% 6.4% 6.4% 6.3% 6.2% 5.7% 5.1% 4.4% 4.2% 4.0% 3.8% S&P Global LargeMidCap Commodity and Resources Index Bank of America Merrill Lynch High Yield Bond Index 3.2% 3.2% 3.2% 3.2% 3.2% 3.1% 2.8% 2.6% 2.2% 2.1% 2.0% 1.9% 8.0% 8.0% 8.0% 8.0% 7.9% 7.7% 7.1% 6.3% 5.2% 4.0% 2.3% 1.6% 100.0% 100.0% 100.0% 100.0% 100.0% 100.0% 100.0% 100.0% 100.0% 100.0% 100.0% 100.0% Stable Value Bond Index Intermediate Bond S&P 500 Index S&P % Single Focus Strategies Large Cap Russell % Non-U.S. Index Non-U.S. Mid Cap Index S&P % Small Cap Russell % MSCI ACWI ex U.S % 100.0% Barclays Capital U.S. Aggregate Index 100.0% 100.0% Hueler Stable Value Pooled Fund Comparative Universe JPMorgan Emerging Local Markets Plus (ELMI+) Barclays Capital U.S. Treasury Inflation Protected Securities (TIPS) Index 100.0% Inflation Sensitive Dow Jones U.S. Select REIT Index 10.0% Bloomberg Commodity Index Total Return 20.0% Dow Jones - UBS Gold Subindex 10.0% 100.0% 100.0% 100.0% 100.0% 100.0% 100.0% 100.0% 100.0% 100.0% 100.0% 15.0% 45.0% 35
38 Management Company Retirement Portfolios Income Aberdeen Asset Management, Inc. x x x x x x x x x x x x Agincourt Capital Management LLC x x x x x x x x x x x x Babson Capital Management, Inc. x x x x x BlackRock Financial Management, Inc. x x x x x Boston Co. Asset Management LLC x x x x x x x x x x x x Delaware Investment Advisers x x x x x x x x x x x x Galliard Capital Management, Inc. x x x x x GAMCO Investors, Inc. x x x x x x x x x x x x Integrity Asset Management LLC x x x x x x x x x x x x Jennison Associates LLC x x x x x x x x x x x x Loomis Sayles & Co. LP x x x x x x x x x x x x Longview Partners (Guernsey) LTD x x x x x x x x x x x x Mercer Investment Consulting, Inc. x x x x x x x x x x x x MetWest Asset Management LLC x x x x x x x x x x x x Northern Cross LLC x x x x x x x x x x x x Pacific Investment Management Co. LLC x x x x x x x x x x x x Pyramis Global Advisors Trust Co x x x x x x x x x x x x Pzena Investment Management, Inc. x x x x x x x x x x x x Sands Capital Management LLC x x x x x x x x x x x x State Street Global Advisors x x x x x x x x x x x x Wells Capital Management, Inc. x x x x x x x x x x x x Aberdeen Asset Management, Inc. Agincourt Capital Management LLC Babson Capital Management BlackRock Financial Management, Inc. Boston Co. Asset Management LLC Delaware Investment Advisers Galliard Capital Management, Inc. GAMCO Investors, Inc. Integrity Asset Management LLC Stable Value x x x Bond Index Intermediate Bond S&P 500 Index Single Focus Strategies Large Cap x x Non-U.S. Index Non-U.S. x Mid Cap Index Jennison Associates LLC x x Loomis Sayles & Co. LP x x Mercer Investment Consulting, Inc. MetWest Asset Management LLC Northern Cross LLC x x Small Cap Pacific Investment Management Co. LLC x x x Pyramis Global Advisors Trust Co. Pzena Investment Management, Inc. Sands Capital Management LLC State Street Global Advisors x x x x x x x x x Wells Capital Management, Inc. x x x x x x Inflation Sensitive 36
39 InvestmentHighlights Collective Trusts and Separate Accounts Most of the Plan s investment options are structured using institutionally managed separate accounts or common and collective trusts; this means the accounts are managed only for participants in the Halliburton Plans. Individual securities are bought and sold by professional investment managers selected by the Investment Committee. Common and Collective Trusts are investment vehicles operated by banks or trust companies. Neither common and collective trust funds nor separate accounts are mutual funds. Unlike mutual funds, separate accounts and collective trust funds are not subject to and are not registered under the Securities Act of 1933 or the Investment Company Act of The Halliburton Company Employee Benefits Master Trust owns the underlying assets in the separate accounts. The Master Trust owns units in the common and collective trusts in which it participates. The issuer (bank or trust company) owns the underlying assets in a common or collective trust. Additional Fee Disclosure The expense ratio is an asset-weighted blend of fees and will fluctuate based on asset values and market conditions; any fees quoted herein are subject to change. Transaction costs incurred by the investment option for buying and selling securities are not included in the expense ratio. These costs, along with management fees, plan administration fees and other fees are paid out of the investment option s assets, reducing the rate of return realized by participants. There are no entry or exit fees charged to participants who invest through the Plan. The cumulative effect of fees and expenses can substantially reduce the growth of a participant s retirement account. Participants are encouraged to visit the Employee Benefits Security Administration website at gov/ebsa for information and examples demonstrating the long-term effect of fees and expenses. Fees and expenses are only one of several factors that participants and beneficiaries should consider when making investment decisions. Stable Value Stable value investment options are invested in high quality, diversified bond portfolios that are protected against interest rate volatility by contracts issued by banks and insurance companies. Stable value investments are designed to preserve capital while providing steady returns and are generally considered a lower risk investment. The market value of bonds is volatile by nature and moves inversely with interest rate changes. As interest rates move up, the market value of bonds declines, and vice-versa. The bank and insurance company contracts are designed to allow participants to transact at book value (principal plus accrued interest less expenses) without reference to the market value fluctuations of the underlying bond portfolios. The risks associated with these contracts are outlined in the Principal Risks section. The Stable Value Strategy, Income, 2005, 2010, 2015, and 2020 Retirement Portfolios invest in synthetic guaranteed investment contracts (GIC), an insurance separate account contract, and a commingled fund that holds traditional, insurance separate account and synthetic GICs. In the synthetic GIC arrangement, the participants of the Plans own the underlying fixed income securities that support the insurance and bank contracts. These fixed income securities are in portfolios that are managed by investment managers solely for the Plan participants. Insurance separate accounts are contracts with an insurance company where investments are entrusted to the insurance companies for the purpose of investing in securities. These securities are kept separate from the insurance company s general investments so credit risk is mitigated in the event that the insurer becomes insolvent. The returns are variable rather than fixed, so the contract holder rather than the insurance company assumes market risk. GICs are typically issued by insurance companies where they guarantee the unit holders of the commingled investment principal repayment and a fixed or floating interest rate for a predetermined period of time. Morningstar Style Box The Morningstar Style Box reveals an investment option s investment strategy. The vertical axis shows the market capitalization of the stocks owned and the horizontal axis shows the investment style (value, blend, or growth). 37
Your Guide to Investment Changes to the Halliburton Retirement and Savings Plan
 Your Guide to Investment Changes to the Halliburton Retirement and Savings Plan Building Smart Investments New Investment Options Coming in June The Halliburton Retirement and Savings Plan (the Plan )
CalPERS 457 Plan Target Retirement Date Funds
 CalPERS 457 Plan Target Retirement Date s September 30, 2015 Overview Target Retirement Date s (the "" or "s") are a series of diversified funds, each of which has a predetermined underlying asset mix
GLOSSARY OF INVESTMENT-RELATED TERMS FOR NATIONAL ELECTRICAL ANNUITY PLAN PARTICIPANTS
 GLOSSARY OF INVESTMENT-RELATED TERMS FOR NATIONAL ELECTRICAL ANNUITY PLAN PARTICIPANTS General Information This Glossary of Investment-Related Terms for National Electrical Annuity Plan Participants (the
With interest rates at historically low levels, and the U.S. economy showing continued strength,
 Managing Interest Rate Risk in Your Bond Holdings THE RIGHT STRATEGY MAY HELP FIXED INCOME PORTFOLIOS DURING PERIODS OF RISING INTEREST RATES. With interest rates at historically low levels, and the U.S.
SCOTT & WHITE RETIREMENT/401(K) PLAN Plan Number 090337 Plan Information as of 05/16/2015
 PLAN Plan Number 090337 Plan Information as of 05/16/2015") SCOTT & WHITE RETIREMENT/401(K) PLAN Plan Number 090337 Plan Information as of 05/16/2015 This legally required notice includes important information to help you compare the investment options under your
SCOTT & WHITE RETIREMENT/401(K) PLAN Plan Number 090337 Plan Information as of 05/16/2015 This legally required notice includes important information to help you compare the investment options under your
INVESTMENT POLICY. Wharton County Junior College Endowment Fund PURPOSE
 Endowment Fund INVESTMENT POLICY PURPOSE This document is the official policy governing the investment practices of the Wharton County Junior College Endowment Fund (the WCJCEF or Endowment ). The policies
Important Information on Your Investment Options, Fees, and Other Expenses for the JPMorgan Chase 401(k) Savings Plan: Fee Disclosure Notice
 Savings Plan: Fee Disclosure Notice") November 2014 Important Information on Your Investment Options, Fees, and Other Expenses for the JPMorgan Chase 401(k) Savings Plan: Fee Disclosure Notice Important: This notice refers to the 401(k) Savings
November 2014 Important Information on Your Investment Options, Fees, and Other Expenses for the JPMorgan Chase 401(k) Savings Plan: Fee Disclosure Notice Important: This notice refers to the 401(k) Savings
I.A.M. National 401(k) Plan. Investment Options Summary
 Plan. Investment Options Summary") I.A.M. National 401(k) Plan Investment Options Summary The I.A.M. National 401(k) Plan offers a diverse investment lineup to meet the varied needs of our participants. The lineup includes 12 Retirement
I.A.M. National 401(k) Plan Investment Options Summary The I.A.M. National 401(k) Plan offers a diverse investment lineup to meet the varied needs of our participants. The lineup includes 12 Retirement
General Investment-Related Terms
 General Investment-Related Terms 12b-1 Fee: A fee assessed on certain mutual funds or share classes permitted under an SEC rule to help cover the costs associated with marketing and selling the fund. 12b-1
State Street Target Retirement Funds - Class K
 The State Street Target Retirement Funds - Class K (the "Funds") represent units of ownership in the State Street Target Retirement Non-Lending Series Funds. The Funds seek to offer complete, low cost
What you will learn today. Different categories of investments Choosing your investment mix Common investor pitfalls Determining your next steps
 Investing 101 What you will learn today Different categories of investments Choosing your investment mix Common investor pitfalls Determining your next steps 2 Asset Allocation One of Your Most Important
Spectrum of Investment Options
 Kentucky Deferred Comp Spectrum of Investment Options Your guide to available investment options. Tier 1 Target Date Funds, Balanced Fund Target Date Funds Vanguard Target Retirement Funds (in five-year
Workplace Education Series. Making the Most of Your New Workplace Savings Plan
 Making the Most of Your New Workplace Savings Plan Making the Most of Your New Workplace Savings Plan Guiding you through exciting plan changes ahead Today s agenda: New plan features Steps to prioritizing
Louisiana Optional Retirement Plan Louisiana Optional Retirement Plan
 TIAA-CREF Quarterly Performance Louisiana Optional Retirement Plan Louisiana Optional Retirement Plan Performance as of 03/31/2016 Before making your investment choices and completing your enrollment form,
Notice to All Employees Eligible to Participate in the Halliburton Retirement and Savings Plan
 Notice to All Employees Eligible to Participate in the Halliburton Retirement and Savings Plan Halliburton Company (the Company ) has made saving for retirement under the Halliburton Retirement and Savings
Wells Fargo Advantage Dow Jones Target Date Funds SM
 Wells Fargo Advantage Dow Jones Target Date Funds SM Annual Report February 28, 2015 Wells Fargo Advantage Dow Jones Target Today Fund SM Wells Fargo Advantage Dow Jones Target 2010 Fund SM Wells Fargo
BlackRock Diversified Income Portfolio. A portfolio from Fidelity Investments designed to seek income while managing risk
 BlackRock Diversified Income Portfolio A portfolio from Fidelity Investments designed to seek income while managing risk Fidelity Investments has formed a strategic alliance with BlackRock Investment Management,
Schwab Target Funds. Go paperless today. Simplify your financial life by viewing these documents online. Sign up at schwab.
 Annual report dated October 31, 2015, enclosed. Schwab Target Funds Schwab Target 2010 Fund Schwab Target 2015 Fund Schwab Target 2020 Fund Schwab Target 2025 Fund Schwab Target 2030 Fund Schwab Target
I.A.M. National 401(k) Plan. Investment Options Summary
 Plan. Investment Options Summary") I.A.M. National 401(k) Plan Investment Options Summary The I.A.M. National 401(k) Plan offers a diverse investment lineup to meet the varied needs of our participants. The lineup includes 12 Retirement
I.A.M. National 401(k) Plan Investment Options Summary The I.A.M. National 401(k) Plan offers a diverse investment lineup to meet the varied needs of our participants. The lineup includes 12 Retirement
Barnes Group Inc. Retirement Savings Plan. Start investing in yourself today, with help from the Retirement Savings Plan and Fidelity.
 Barnes Group Inc. Retirement Savings Plan Start investing in yourself today, with help from the Retirement Savings Plan and Fidelity. Invest some of what you earn today for what you plan to accomplish
Making Sense of Market Volatility: Retirement Planning Strategies for the Everyday Investor. October, 2008
 Making Sense of Market Volatility: Retirement Planning Strategies for the Everyday Investor October, 2008 1 Market Ups and Downs Recent news is full of anxiety-causing developments: Credit crunch Bank
May 1, 2015 as amended June 1, 2015
 INSTITUTIONAL INVESTOR May 1, 2015 as amended June 1, 2015 DATE TARGET FUNDS MyDestination 2005 Fund MyDestination 2015 Fund MyDestination 2025 Fund MyDestination 2035 Fund MyDestination 2045 Fund MyDestination
Start investing in yourself today, with help from the University System of Maryland Supplemental 403(b) Plan and Fidelity.
 Plan and Fidelity.") University System of Maryland Supplemental 403(b) Plan (#65612) Start investing in yourself today, with help from the University System of Maryland Supplemental 403(b) Plan and Fidelity. Invest some of
University System of Maryland Supplemental 403(b) Plan (#65612) Start investing in yourself today, with help from the University System of Maryland Supplemental 403(b) Plan and Fidelity. Invest some of
Sample Glossary Of Investment-Related Terms For Disclosures To Retirement Plan Participants. Version 1.01
 Sample Glossary Of Investment-Related Terms For Disclosures To Retirement Plan Participants Version 1.01 April 26, 2012 General Information SAMPLE GLOSSARY OF INVESTMENT-RELATED TERMS FOR DISCLOSURES TO
Start investing in yourself today, with help from the. Optional Retirement Plan (ORP) and Fidelity.
 and Fidelity.") State of Maryland - Institutions of Higher Education Optional Retirement Plan (ORP) Plan No. 65575 Start investing in yourself today, with help from the State of Maryland - Institutions of Higher Education
State of Maryland - Institutions of Higher Education Optional Retirement Plan (ORP) Plan No. 65575 Start investing in yourself today, with help from the State of Maryland - Institutions of Higher Education
The Bright Start College Savings Program Direct-Sold Plan. Supplement dated January 30, 2015 to Program Disclosure Statement dated November 12, 2012
 The Bright Start College Savings Program Direct-Sold Plan Supplement dated January 30, 2015 to Program Disclosure Statement dated November 12, 2012 This supplement amends the Program Disclosure Statement
New York's 529 Advisor-Guided College Savings Program
 New York's 529 Advisor-Guided College Savings Program yr AVERAGE TOTAL Expense ratio AGE-BASED PORTFOLIOS JPMorgan 529 Aggressive Age-Based Portfolio (Age 0-5) 2,3,4,5,6,7,8,9,37 Class A - 5/4/202, 5705,
Important Information about Closed-End Funds and Unit Investment Trusts
 Robert W. Baird & Co. Incorporated Important Information about Closed-End Funds and Unit Investment Trusts Baird has prepared this document to help you understand the characteristics and risks associated
Your Guide to Getting Started
 PetSmart, Inc. SaveSmart 401(k) Plan Invest in your retirement and yourself today, with help from The SaveSmart 401(k) Plan and Fidelity. Your Guide to Getting Started Invest some of what you earn today
CAPITAL MARKETS REVIEW Q4 2011
 CAPITAL MARKETS REVIEW Q4 2011 Reviewing the quarter ended September 30, 2011 J. Matthew Hager // David S. Dennerll, CFP // Benjamin R. Stacy 255 East Fifth St. Suite 2210 // Cincinnati, OH 45202 513-287-6778
The Master Statement of Investment Policies and Objectives of The Lower Colorado River Authority Retirement Plan and Trust. Amended June 16, 2015
 The Master Statement of Investment Policies and Objectives of The Lower Colorado River Authority Retirement Plan and Trust Amended June 16, 2015 Introduction The Lower Colorado River Authority ( LCRA )
Transamerican Auto Parts 401k plan
 Transamerican Auto Parts 401k plan There are many great benefits to being a participant in the Transamerican Auto Parts 401k plan. Among those benefits is exceptional customer service online, by phone,
Retirement Balanced Fund
 SUMMARY PROSPECTUS TRRIX October 1, 2015 T. Rowe Price Retirement Balanced Fund A fund designed for retired investors seeking capital growth and income through investments in a combination of T. Rowe Price
TD Ameritrade Trust Company Collective Investment Funds for Employee Benefit Plans Inceptus Funds. Financial Reports May 31, 2015
 TD Ameritrade Trust Company Collective Investment s for Employee Benefit Plans s Financial Reports May 31, 2015 Contents Independent Auditor s Report 1-2 Financial Statements Statements of Financial Condition
Sample Glossary Of Investment-Related Terms For Disclosures To Retirement Plan Participants
 Sample Glossary Of Investment-Related Terms For Disclosures To Retirement Plan Participants Version 1.01 April 26, 2012 PART 1 General Investment-Related Terms 12b-1 Fee: A fee assessed on certain mutual
Target Retirement Funds
 Prospectus March 1, 2015 Target Retirement Funds Institutional Class Administrative Class Investor Class Harbor Target Retirement Income Fund HARAX HARBX HARCX Harbor Target Retirement 2015 Fund HARGX
Market Linked Certificates of Deposit
 Market Linked Certificates of Deposit This material was prepared by Wells Fargo Securities, LLC, a registered brokerdealer and separate non-bank affiliate of Wells Fargo & Company. This material is not
Celarity 401(k) Retirement Plan
 Retirement Plan") Celarity 401(k) Retirement Plan There are many great benefits to being a participant in the Celarity 401(k) Retirement Plan. Among those benefits is exceptional customer service online or by phone. In
Celarity 401(k) Retirement Plan There are many great benefits to being a participant in the Celarity 401(k) Retirement Plan. Among those benefits is exceptional customer service online or by phone. In
T. Rowe Price Target Retirement 2030 Fund Advisor Class
 T. Rowe Price Target Retirement 2030 Fund Advisor Class Supplement to Summary Prospectus Dated October 1, 2015 Effective February 1, 2016, the T. Rowe Price Mid-Cap Index Fund and the T. Rowe Price Small-Cap
Annual Disclosure of Plan Investment Information
 Annual Disclosure of Plan Investment Information The Boeing Company Voluntary Investment Plan August 30, 2014* *Revised January 1, 2015 Copyright 2015 Boeing. All rights reserved. 256743 2014-637 Introduction
County of Orange - 98984-01/02 Investment Performance as of 04/29/2016
 County of Orange - 98984-01/02 Investment Performance as of 04/29/2016 Current performance may be lower or higher than performance data shown. Performance data quoted represents past performance and is
Investment Descriptions and Options
 Investment Descriptions and Options National Philanthropic Trust (NPT) provides several investment opportunities to diversify and grow your charitable contributions. To ensure that your contribution to
Elimination of the Fidelity Growth & Income Portfolio NUSCO 401k Plan October, 2008
 Elimination of the Fidelity Growth & Income Portfolio NUSCO 401k Plan October, 2008 Dear Participant: The Northeast Utilities 401k Advisory Committee, which routinely reviews investments offered under
Average Annualized Return as of 11/30/2015 1. YTD 1 Year 3 Years 5 Years
 Investment Options at a glance Current performance may be lower or higher than performance data shown. Performance data quoted represents past performance and is not a guarantee or prediction of future
IU Retirement Plan (57524) Start investing in yourself today, with help from IU Retirement Plan and Fidelity.
 Start investing in yourself today, with help from IU Retirement Plan and Fidelity.") IU Retirement Plan (57524) Start investing in yourself today, with help from IU Retirement Plan and Fidelity. Invest some of what you earn today for what you plan to accomplish tomorrow. Dear Indiana University
IU Retirement Plan (57524) Start investing in yourself today, with help from IU Retirement Plan and Fidelity. Invest some of what you earn today for what you plan to accomplish tomorrow. Dear Indiana University
Why Consider Bank Loan Investing?
 Why Consider Bank Loan Investing? September 2012 Bank loans continue to increase in popularity among a variety of investors in search of higher yield potential than other types of bonds, with lower relative
MOTOROLA SOLUTIONS 401(k) PLAN ANNUAL FEE DISCLOSURE - APRIL 2015
 PLAN ANNUAL FEE DISCLOSURE - APRIL 2015") MOTOROLA SOLUTIONS 401(k) PLAN ANNUAL FEE DISCLOSURE - APRIL 2015 THIS NOTICE INCLUDES IMPORTANT INFORMATION ABOUT OPTIONS, FEES AND OTHER EXPENSES IN THE MOTOROLA SOLUTIONS 401(k) PLAN (THE PLAN ). The
MOTOROLA SOLUTIONS 401(k) PLAN ANNUAL FEE DISCLOSURE - APRIL 2015 THIS NOTICE INCLUDES IMPORTANT INFORMATION ABOUT OPTIONS, FEES AND OTHER EXPENSES IN THE MOTOROLA SOLUTIONS 401(k) PLAN (THE PLAN ). The
Fund commentary. John Hancock Lifestyle Portfolios Q1 2016
 Fund commentary John Hancock Lifestyle Portfolios Seek: Long-term growth of capital or a balance between a high level of current income and growth of capital Use for: Broadly diversified, risk-targeted
SDBA Investment Options
 October 2013 FRS Offers a New Way to Invest: Self-Directed Brokerage Accounts...1 Quarterly Fund Performance Summary...2 Proposed Investment Fund Changes Seek Greater Returns...5 The Investment Plan TIPS
YOUR GUIDE TO GETTING STARTED
 George Mason University Cash Match Plan (#72170) Invest in your retirement and yourself today, with help from The George Mason 401(a) Match Plan and Fidelity. YOUR GUIDE TO GETTING STARTED Invest some
Economic & Market Outlook
 Monthly Portfolio Commentary December 31, 2015 Economic & Market Outlook Stocks rebounded in 2015 s fourth quarter, but provided little reward for the year as a whole. The S&P 500 Index recovered from
SUPPLEMENT SEPTEMBER 2015 TO THE VANGUARD 529 COLLEGE SAVINGS PLAN PROGRAM DESCRIPTION DATED NOVEMBER 2014
 SUPPLEMENT SEPTEMBER 2015 TO THE VANGUARD 529 COLLEGE SAVINGS PLAN PROGRAM DESCRIPTION DATED NOVEMBER 2014 Please keep this Supplement, which describes important changes, with your other Vanguard 529 College
CHG Companies, Inc. Employee 401(k) Plan
 Plan") CHG Companies, Inc. Employee 401(k) Plan There are many great benefits to being part of the CHG Companies, Inc. Employee 401(k) Plan. Among those benefits is exceptional customer service online, by phone,
CHG Companies, Inc. Employee 401(k) Plan There are many great benefits to being part of the CHG Companies, Inc. Employee 401(k) Plan. Among those benefits is exceptional customer service online, by phone,
Rules-Based Investing
 Rules-Based Investing Disciplined Approaches to Providing Income and Capital Appreciation Potential Focused Dividend Strategy International Dividend Strategic Value Portfolio (A: FDSAX) Strategy Fund (A:
INVESTMENT POLICY STATEMENT. For. The Animation Guild 401(k) Plan
 Plan") INVESTMENT POLICY STATEMENT For The Animation Guild 401(k) Plan Effective TABLE OF CONTENTS Investment Policy Statement Page Purpose...1 Statement of Plan Investment Objectives...2 Roles & Responsibilities...3
INVESTMENT POLICY STATEMENT For The Animation Guild 401(k) Plan Effective TABLE OF CONTENTS Investment Policy Statement Page Purpose...1 Statement of Plan Investment Objectives...2 Roles & Responsibilities...3
July 28, 2015. Re: Important information about your retirement plan
 JOHN CARROLL UNIVERSITY One John Carroll Blvd. UNIVERSITY HEIGHTS, OH 441184520 July 28, 2015 SECTION1 Re: Important information about your retirement plan The enclosed information is being provided to
U.S. Bank 401(k) Savings Plan Annual Fee Disclosure Notice
 Savings Plan Annual Fee Disclosure Notice") U.S. Bank 401(k) Savings Plan Annual Fee Disclosure Notice The U.S. Bank 401(k) Savings Plan can assist you in saving on a tax-deferred basis for your future. Through the U.S. Bank 401(k) Savings Plan
U.S. Bank 401(k) Savings Plan Annual Fee Disclosure Notice The U.S. Bank 401(k) Savings Plan can assist you in saving on a tax-deferred basis for your future. Through the U.S. Bank 401(k) Savings Plan
Fund commentary. John Hancock Retirement Living Portfolios Q1 2016
 John Hancock Retirement Living Portfolios Fund commentary Seek: Long-term growth of capital or a balance between a high level of current income and growth of capital Use for: Broadly diversified, risk-targeted
JOHNS HOPKINS UNIVERSITY INVESTMENT OPTIONS
 JOHNS HOPKINS UNIVERSITY INVESTMENT OPTIONS P E R F O R M A N C E U P D A T E AS OF DECEMBER 31, 2009 UNDERSTANDING INVESTMENT PERFORMANCE As you review this update, please remember that the performance
Please read this important information for Yale University Matching Retirement Plan participants
 Please read this important information for Yale University Matching Retirement Plan participants This notice gives you important information about the default investment funds selected for the Matching
Your Guide to Getting Started
 City of Dallas 401(k) Retirement Savings Plan Invest in your retirement and yourself today, with help from the City of Dallas 401(k) Plan and Fidelity. Your Guide to Getting Started Invest some of what
Investment Policy Statement
 Investment Policy Statement Prepared on: February 04, 2013 Prepared for: Sample Individual Client 432 Elm St Chicago IL 60630 Executive Summary Client Name: Sample Individual Client Client Type: Individual
SAVINGS GROWTH PLAN. Looking forward to new horizons. investment options
 SAVINGS GROWTH PLAN SAVINGS GROWTH PLAN SAVINGS GROWTH PLAN Looking forward to new horizons. investment options 4 2020-2060 Portfolios BlackRock Table of Contents 6 Retirement Portfolio BlackRock 8 Short-Term
salesforce.com, Inc. and Salesforce.com Foundation 401(k) Plan
 Plan") salesforce.com, Inc. and Salesforce.com Foundation 401(k) Plan There are many great benefits to being a participant in the salesforce.com, Inc. and Salesforce.com Foundation 401(k) Plan. Among those benefits
salesforce.com, Inc. and Salesforce.com Foundation 401(k) Plan There are many great benefits to being a participant in the salesforce.com, Inc. and Salesforce.com Foundation 401(k) Plan. Among those benefits
August 26, 2015. Re: Important information about your retirement plan
 MANHATTANVILLE COLLEGE 2900 PURCHASE STREET PURCHASE, NY 105772131 August 26, 2015 SECTION1 Re: Important information about your retirement plan The enclosed information is being provided to help you make
LifePath Index 2060 Fund Q
 Release Date: 9-3-215 LifePath Index 26 Fund Q Standard & Poor's 5 Index LifePath Index 26 Custom Target Date 251+... Allocation of Stocks and Bonds 1 8 6 4 2 45 4 35 3 25 2 15 1 5 Years Until Retirement
Workplace Education Series. Building a Portfolio for Any Weather
 Building a Portfolio for Any Weather The Retirement Savings Series Part 1: Getting on the Right Path with Your Workplace Savings Understand the many advantages of saving at the workplace Find money in
Glossary of Investment Terms
 online report consulting group Glossary of Investment Terms glossary of terms actively managed investment Relies on the expertise of a portfolio manager to choose the investment s holdings in an attempt
PERSI Choice 401(k) Plan Investment Policy
 Plan Investment Policy") PERSI Choice 401(k) Plan Investment Policy I. Plan Objective The Public Employee Retirement System of Idaho (PERSI) sponsors the PERSI Choice Plan (the "Choice Plan" or "Plan") for the benefit of its members.
PERSI Choice 401(k) Plan Investment Policy I. Plan Objective The Public Employee Retirement System of Idaho (PERSI) sponsors the PERSI Choice Plan (the "Choice Plan" or "Plan") for the benefit of its members.
INVESTMENT POLICY STATEMENT. Creighton University 403(b) Retirement Plan
 Retirement Plan") INVESTMENT POLICY STATEMENT For Creighton University 403(b) Retirement Plan November 2008 Cornerstone Advisors Asset Management, Inc. 74 West Broad Street, Suite 340 Bethlehem, PA 18018 TABLE OF CONTENTS
INVESTMENT POLICY STATEMENT For Creighton University 403(b) Retirement Plan November 2008 Cornerstone Advisors Asset Management, Inc. 74 West Broad Street, Suite 340 Bethlehem, PA 18018 TABLE OF CONTENTS
Statement of Investment Policy. Alabama College Education Savings Program (ACES) Trust Fund. The CollegeCounts 529 Fund
 Trust Fund. The CollegeCounts 529 Fund") Statement of Investment Policy Alabama College Education Savings Program (ACES) Trust Fund The CollegeCounts 529 Fund Approved by the Board of Directors November 19, 2014 1 Authority and Purpose The Alabama
Statement of Investment Policy Alabama College Education Savings Program (ACES) Trust Fund The CollegeCounts 529 Fund Approved by the Board of Directors November 19, 2014 1 Authority and Purpose The Alabama
Total US Equity Index Fund... Benchmark
 Release Date: 12-31-2013 Total US Equity Index Fund... Benchmark Morningstar Category DJ US Total Stock Market TR Large Blend Index Investment Objective & Strategy This Fund seeks to track the performance
1. Fixed income/cash investments - FDIC insured account option, stable value fund, or money market mutual fund.
 Wisconsin Deferred Compensation Program Deferred Compensation Board Investment Policy Statement Approved by the Deferred Compensation Board November 1998 Revised February 2005 Objective The Wisconsin Deferred
HSBC World Selection Funds April 30, 2016. Monthly Factsheets Class A and C Shares. Investment products: ARE NOT A BANK ARE NOT DEPOSIT OR
 HSBC World Selection Funds April 30, 2016 Monthly Factsheets Class A and C Shares Aggressive Strategy Fund Balanced Strategy Fund Moderate Strategy Fund Conservative Strategy Fund Income Strategy Fund
Investment Plan Asset Allocation by Member Age. 2012 Tax Year Distributions. October 2012. Have You Selected the Right Funds?... 1
 October 2012 Have You Selected the Right Funds?... 1 Quarterly Fund Performance Summary... 2 Where s the Ticker?... 5 $6 Inactive Fee... 6 Lifetime Annuity Quotes... 6 Financial Planning Workshop Webcasts...
An Alternative Way to Diversify an Income Strategy
 Senior Secured Loans An Alternative Way to Diversify an Income Strategy Alternative Thinking Series There is no shortage of uncertainty and risk facing today s investor. From high unemployment and depressed
401(k) Savings Plan Investment Fund Profiles Detailed Information on the JPMorgan Chase 401(k) Savings Plan Investment Funds
 Savings Plan Investment Fund Profiles Detailed Information on the JPMorgan Chase 401(k) Savings Plan Investment Funds") 401(k) Savings Plan Investment Fund Profiles Detailed Information on the JPMorgan Chase 401(k) Savings Plan Investment Funds Effective December 31, 2013 Please Note: Any significant subsequent updates
401(k) Savings Plan Investment Fund Profiles Detailed Information on the JPMorgan Chase 401(k) Savings Plan Investment Funds Effective December 31, 2013 Please Note: Any significant subsequent updates
Attorneys' Title Guaranty Fund, Inc. Savings Plan
 Attorneys' Title Guaranty Fund, Inc. Savings Plan There are many great benefits to being a participant in the Attorneys' Title Guaranty Fund, Inc. Savings Plan. Among those benefits is exceptional customer
FREE MARKET U.S. EQUITY FUND FREE MARKET INTERNATIONAL EQUITY FUND FREE MARKET FIXED INCOME FUND of THE RBB FUND, INC. PROSPECTUS.
 FREE MARKET U.S. EQUITY FUND FREE MARKET INTERNATIONAL EQUITY FUND FREE MARKET FIXED INCOME FUND of THE RBB FUND, INC. PROSPECTUS December 31, 2014 Investment Adviser: MATSON MONEY, INC. 5955 Deerfield
Pioneer Bond Fund. Performance Analysis & Commentary September 2015. Fund Ticker Symbols: PIOBX (Class A); PICYX (Class Y) us.pioneerinvestments.
; PICYX (Class Y) us.pioneerinvestments.") Pioneer Bond Fund COMMENTARY Performance Analysis & Commentary September 2015 Fund Ticker Symbols: PIOBX (Class A); PICYX (Class Y) us.pioneerinvestments.com Third Quarter Review Pioneer Bond Fund s Class
Pioneer Bond Fund COMMENTARY Performance Analysis & Commentary September 2015 Fund Ticker Symbols: PIOBX (Class A); PICYX (Class Y) us.pioneerinvestments.com Third Quarter Review Pioneer Bond Fund s Class
U.S. Department of Labor Employee Benefits Security Administration
 U.S. Department of Labor Employee Benefits Security Administration This publication has been developed by the U.S. Department of Labor, Employee Benefits Security Administration. To view this and other
Non-FDIC Insured May Lose Value No Bank Guarantee. Time-Tested Investment Strategies for the Long Term
 Non-FDIC Insured May Lose Value No Bank Guarantee Time-Tested Investment Strategies for the Long Term Rely on These Four Time-Tested Strategies to Keep You on Course. Buy Right and Sit Tight Keep Your
How To Choose A 401(K) Plan Investment
 Plan Investment") Supplemental Income 401(k) Plan This document contains important information concerning our retirement plan. The first section provides you with information about the plan in general, including any expenses
Supplemental Income 401(k) Plan This document contains important information concerning our retirement plan. The first section provides you with information about the plan in general, including any expenses
YOUR GUIDE TO GETTING STARTED
 Navient 401(k) Savings Plan Invest in your retirement and yourself today, with help from Navient 401(k) Savings Plan and Fidelity. YOUR GUIDE TO GETTING STARTED Invest some of what you earn today for what
Mutual Funds Made Simple. Brighten your future with investments
 Mutual Funds Made Simple Brighten your future with investments About Invesco Aim When it comes to investing, your sights are set on a financial summit a college diploma, new home or secure retirement.
PUGET SOUND BLOOD CENTER AND PROGRAM 403(B) DC RET PLAN
 DC RET PLAN") PUGET SOUND BLOOD CENTER AND PROGRAM 403(B) DC RET PLAN Investment Options Comparative Chart Your plan allows you to direct how your contributions are invested. When making investment decisions, you should
PUGET SOUND BLOOD CENTER AND PROGRAM 403(B) DC RET PLAN Investment Options Comparative Chart Your plan allows you to direct how your contributions are invested. When making investment decisions, you should
How To Transfer To A 529 Plan
 New York s 529 Advisor-Guided College Savings Program Transition Guide INHERIT THE THINKING OF J.P. MORGAN Your college savings plan is changing for the better In May 2012, J.P. Morgan will become the
PIMCO Foreign Bond Fund (U.S. Dollar- Hedged)
") Your Global Investment Authority PIMCO Foreign Bond Fund (U.S. Dollar- Hedged) SUMMARY PROSPECTUS July 31, 2015 (as supplemented December 1, 2015) Share Class: Inst P Admin D A C R Ticker: PFORX PFBPX
Your Global Investment Authority PIMCO Foreign Bond Fund (U.S. Dollar- Hedged) SUMMARY PROSPECTUS July 31, 2015 (as supplemented December 1, 2015) Share Class: Inst P Admin D A C R Ticker: PFORX PFBPX
Balanced Fund RPBAX. T. Rowe Price SUMMARY PROSPECTUS
 SUMMARY PROSPECTUS RPBAX May 1, 2016 T. Rowe Price Balanced Fund A fund seeking capital growth and current income through a portfolio of approximately 65% stocks and 35% fixed income securities. Before
AMERICAN REGISTRY OF INTERNET NUMBERS INVESTMENT POLICY STATEMENT January 2014
 AMERICAN REGISTRY OF INTERNET NUMBERS INVESTMENT POLICY STATEMENT January 2014 Introduction This statement of investment policy has been adopted by the Board of Trustees of the American Registry of Internet
Six Strategies for Volatile Markets When markets get choppy, it pays to have a plan for your investments, and to stick to it.
 Six Strategies for Volatile Markets When markets get choppy, it pays to have a plan for your investments, and to stick to it. Fidelity Viewpoints 8/22/15 The markets have become volatile again, prompted
RISK ASSESSMENT QUESTIONNAIRE
 Time Horizon 6/14 Your current situation and future income needs. 1. What is your current age? 2. When do you expect to start drawing income? A Less than 45 A Not for at least 20 years B 45 to 55 B In
Diversified Managed Allocations
 Diversified Managed Allocations Multi-strategy portfolios with a focus on flexibility Is this program right for you? DMA is designed for investors who: Want experienced, professional money managers to
WHEATON COLLEGE RETIREMENT PLAN QUALIFIED DEFAULT INVESTMENT ALTERNATIVE NOTICE
 WHEATON COLLEGE RETIREMENT PLAN QUALIFIED DEFAULT INVESTMENT ALTERNATIVE NOTICE FY 2016 PLAN YEAR The Wheaton College Retirement Plan (the "Plan") permits each Participant to direct how money in her/his
Fixed Income: The Hidden Risk of Indexing
 MANNING & NAPIER ADVISORS, INC. Fixed Income: The Hidden Risk of Indexing Unless otherwise noted, all figures are based in USD. Fixed income markets in the U.S. are vast. At roughly twice the size of domestic
Investment Policy For the 457(b) and 401(a) Deferred Compensation Plans
 and 401(a) Deferred Compensation Plans") SACRAMENTO COUNTY Investment Policy For the 457(b) and 401(a) Deferred Compensation Plans Approved by the Sacramento County Board of Supervisors September 15, 2015 Resolution No. 2015-0686 Table of Contents
SACRAMENTO COUNTY Investment Policy For the 457(b) and 401(a) Deferred Compensation Plans Approved by the Sacramento County Board of Supervisors September 15, 2015 Resolution No. 2015-0686 Table of Contents
Information on Retirement Savings Plans Available at Carnegie Mellon University
 Information on Retirement Savings Plans Available at Carnegie Mellon University Carnegie Mellon University offers two retirement savings plans based on eligibility and citizenship/residency: Carnegie Mellon
Investment Policy Statement
 Investment Policy Statement Prepared on: January 30, 2013 Prepared for: Sample 401k Client 1300 Liberty Ave Pittsburgh PA 15222 Executive Summary Client Name: Sample 401k Client Client Type: Retirement
The George Washington University Retirement Plans. How to get started
 The George Washington University Retirement Plans How to get started Table of Contents Why Save 3 Plans at a Glance 4 Approved Investment Providers 7 How to Enroll 8 Provider Fact Sheets 9 Investment Education
INVESTMENT POLICY STATEMENT Valued Client
 INVESTMENT POLICY STATEMENT Valued Client August 17, 2010 PREPARED BY: John Ohl Bay Colony Advisors 91 Main St STE 308 Concord, Massachusetts 01742 (978) 369-7200 John@baycolonyadvisors.com www.baycolonyadvisors.com