Power Efficiency Comparison of Enterprise-Class Blade Servers and Enclosures
|
|
|
- Lucy Stewart
- 10 years ago
- Views:
Transcription
1 Power Efficiency Comparison of Enterprise-Class Blade Servers and Enclosures A Dell Technical White Paper John Beckett, Robert Bradfield, and the Dell Server Performance Analysis Team

2 THIS WHITE PAPER IS FOR INFORMATIONAL PURPOSES ONLY, AND MAY CONTAIN TYPOGRAPHICAL ERRORS AND TECHNICAL INACCURACIES. THE CONTENT IS PROVIDED AS IS, WITHOUT EXPRESS OR IMPLIED WARRANTIES OF ANY KIND Dell Inc. All rights reserved. Reproduction of this material in any manner whatsoever without the express written permission of Dell Inc. is strictly forbidden. For more information, contact Dell. Dell, the DELL logo, and the DELL badge, and PowerEdge are trademarks of Dell Inc. Microsoft, Windows, and Windows Server are either trademarks or registered trademarks of Microsoft Corporation in the United States and/or other countries. SPEC and the benchmark name SPECpower are registered trademarks of the Standard Performance Evaluation Corporation. For more information about SPECpower, Benchmark results stated in this white paper reflect results run as of January 10, The comparison presented in this paper is based on the enterprise-class blade servers configured as similarly as possible currently shipping by Dell, HP and IBM. For the latest SPECpower_ssj2008 benchmark results, visit Other trademarks and trade names may be used in this document to refer to either the entities claiming the marks and names or their products. Dell Inc. disclaims any proprietary interest in trademarks and trade names other than its own. Revision 1 April 2011 ii

3 Contents Executive Summary... 5 Update: April Introduction... 5 Key Findings... 6 Power... 6 Performance... 6 Testing Details... 7 Methodology... 7 Results... 7 Power Draw on a Per Blade Basis Workload Overall ssj_ops/watt Appendix A Test Methodology SPECpower_ssj2008 Standard Configuration Chassis Configuration BIOS Settings OS Tuning SPECpower_ssj2008 Configuration Power Meter Configuration Appendix B Enclosure Configuration Information Appendix C Blade System Configuration Information Table 6. Blade Appendix D Blade System Firmware and Drivers Appendix E SPECpower_ssj2008 Results Dell M1000e Blade Enclosure/16 x PowerEdge M HP BladeSystem c7000/16 x ProLiant BL460c G IBM BladeCenter 8852 H-Series/14 x BladeCenter HS Tables Table 1. SPECpower_ssj2008 Results for the 16-Blade Dell Solution Table 2. SPECpower_ssj2008 Results for the 16-Blade HP Solution Table 3. SPECpower_ssj2008 Results for the 14-Blade IBM Solution Table 4. Configuration for Testing Table 5. Enclosure Configuration Information Table 6. Blade System Configuration Information Table 7. Detailed Configuration Information for Blade Server Solutions iii

4 Figures Figure 1. Blade Solution Comparison Chart... 7 Figure 2. Comparison of the Blade Solutions at the Active Idle Power Measurement... 8 Figure 3. Power Usage Comparison of Blade Solutions at 100% Utilization... 9 Figure 4. Average Power Utilization Across Workload Intervals Figure 5. Performance Comparison of Watt Ratios Across Workload Intervals Figure 6. Performance Comparison at 100% Utilization Figure 7. Comparison of the Power Utilization on a per Blade Basis Figure 8. Comparison of the Overall ssj_ops/watt Score Figure 9. Power Measurement Diagram for the Dell Blade Solution Figure 10. Power Measurement Diagram for the HP Blade Solution Figure 11. Power Measurement Diagram for the IBM Blade Solution iv

5 Executive Summary Update: April 2011 In August 2010, Dell published a white paper that compared a mainstream Dell blade solution against comparable HP and IBM blade solutions on performance, power, and performance/watt using industrystandard benchmarking methodology. Since that time, HP and IBM have released new Platinum-level efficiency power supplies and updated fans. These configurations were updated accordingly and have been re-tested to compare with the Dell results collected in The Dell result was not re-tested because the power supplies previously used were already Platinum-level efficiency, and all other components have remained performance and power neutral. At the time of the new test, Dell also measured the HP BL460c G7 blade servers and compared this data with the G6 server data gathered from the previous test. All of the results fell within the same performance and power level as the previous BL460c G6 results. Thus, it was concluded that the new G7-generation BL460c blade servers do not appreciably impact the performance or power characteristics of the HP blade solution as compared to the G6 results. Introduction With rising energy costs continuing to demand larger portions of organizational budgets, Dell Inc. (Dell) commissioned its Server Performance Analysis team to use the industry standard SPECpower_ssj2008 benchmark to compare the power draw and performance per watt of blade solutions from Dell, HP, and IBM. The purpose of the testing was to examine on a level playing field the true power efficiency of the top three global blades server providers and compare and contrast the results. Each blade configuration included an enclosure configured as similarly as possible and was fully populated with each company s best-selling blade servers 1 using identical processor, RAM and hard drive selections and included Platinum Efficiency Power Supplies for all three vendors. The results were clear. In like-for-like comparisons, a Dell M1000e enclosure fully populated with 16 M610 blade servers consistently demonstrated significant advantages over both the IBM BladeCenter H enclosure fully populated with 14 HS22 blade servers and the Hewlett-Packard C7000 enclosure fully populated with 16 BL460C G6 blade servers in both power draw and performance-per-watt, regardless of utilization levels. While the actual monetary impact of these savings may vary for a variety of reasons, such as the regional disparity in cost of electricity and overall data center power and cooling design efficiency, there is no doubt that the performance and power efficiency of Dell M-series blades can result in significant operational cost savings. 1 IDC Worldwide Quarterly Server Tracker Q1 CY2010 results 5

6 Key Findings Key findings from the study for power and performance are summarized below. Power In the CPU utilization midrange (40 60%), the HP C7000 enclosure fully populated with 16 BL460C G6 blade servers used 11 14% more power per chassis than the Dell M1000e enclosure fully populated with 16 M610 blades. 2 See Figure 4. When measured full-chassis to full-chassis, the IBM BladeCenter H enclosure fully populated with 14 HS22 blade servers used 53.2% more power at idle than the Dell M1000e enclosure fully populated with 16 M610 blade servers, despite having two fewer blade servers. 2 See Figure 2. A HP C7000 enclosure fully populated with 16 BL460C G6 blade servers used 27.9% more power than the Dell M1000e enclosure fully populated with 16 M610 blade servers at idle and 9.7% more at 100% CPU utilization. 2 See Figure 2 and Figure 3. The Dell M1000e enclosure fully populated with 16 M610 blade servers used less power per blade across all load levels than the HP C7000 enclosure fully populated with 16 BL460C G6 blade servers. 2 See Figure 7. In head-to-head testing with fully populated chassis, IBM HS22 blades used 74% more power per blade at idle than Dell PowerEdge M610 blade servers. 2 See Figure 7. In head-to-head testing with fully populated chassis, IBM HS22 blades used an average of 10.3% more power per blade at 100% CPU utilization than Dell PowerEdge M610 blade servers. 2 See Figure 7. Performance The Dell M1000e enclosure fully populated with 16 M610 blade servers achieved a higher performance to power ratio across all load levels than the HP C7000 enclosure fully populated with 16 BL460C G6 blade servers or the IBM BladeCenter H enclosure fully populated with 14 HS22 blade servers. 2 See Figure 5. Despite drawing less power, the Dell M1000e enclosure fully populated with 16 M610 blade servers provided 14.2% greater performance than the IBM BladeCenter H enclosure fully populated with 14 HS22 blade servers at 100% utilization. 2 See Figure 6. The Dell M1000e enclosure fully populated with 16 M610 blade servers achieved up to 13.7% performance/watt than the HP C7000 enclosure fully populated with 16 BL460C G6 blade servers and up to 16% higher performance/watt than the IBM BladeCenter H enclosure fully populated with 14 HS22 blade servers. 2 See Figure 8. Test methodology and detailed results are documented in this paper. 2 Source: Based on SPECpower_ssj2008 testing conducted by Dell Labs reported in Power Efficiency Comparison of Enterprise-Class Blade Servers and Enclosures, a Dell Technical White Paper (Revised April 2011). Comparisons based on similarly configured full-rack blade servers (Dell: 16 blades, HP: 16 blades, IBM: 14 blades). Actual performance will vary with configuration, usage, and manufacturing variability. For the full white paper, visit inal.pdf. 6

7 Normalized Values Power Efficiency Comparison of Enterprise-Class Blade Servers and Enclosures Testing Details Methodology SPECpower_ssj2008 is an industry standard benchmark created by the Standard Performance Evaluation Corporation (SPEC) to measure a server s power and performance across multiple utilization levels. Appendix A details the test methodology used by Dell, Appendices B D detail configuration for the tests, and Appendix E provides detailed report data that supports the Results in this paper. Results The Dell blade solution delivered the best SPECpower_ssj2008 result (see Figure 1), coming in at 2,530 overall ssj_ops/watt compared to the HP blade solution, which came in with 2,226 overall ssj_ops/watt (Dell 13.7% higher). The IBM blade solution came in last with 2,181 overall ssj_ops/watt (Dell 16% higher). This result is even more notable due to the fact that IBM is only capable of providing 14 blade servers per chassis, and thus is providing a solution that, despite drawing equivalent power with the Dell system through all utilization levels except idle (where it becomes 53.2% worse than the Dell blade solution), is not capable of the same raw performance per chassis that HP or Dell can provide using identical processor and memory architectures. Normalized Blade Solution Comparison Power Utilization, Performance/Watt and Performance % avg power (lower is better) Active Idle Power (lower is better) SPECpower_ssj2008 overall ssj_ops/watt (higher is better) 100% ssj_ops (higher is better) Dell 16-Blade Solution HP 16-Blade Solution IBM 14-Blade Solution Figure 1. Blade Solution Comparison Chart 7
, coming in at 2,530 overall ssj_ops/watt compared to the HP blade solution, which came in with 2,226 overall")
8 Average active idle Power Efficiency Comparison of Enterprise-Class Blade Servers and Enclosures SPECpower_ssj2008 includes a measurement of power while the blades are idle at the final phase of the benchmark. As Figure 2 shows, the full enclosure of 16 Dell PowerEdge M610 blade servers used 27.9 percent less overall power while idle than the HP blade solution. In addition, the 16 Dell PowerEdge M610 blade servers used 53.2 percent less overall power while idle than the 14 IBM HS22 blade servers. The 16-blade Dell PowerEdge M610 solution used 1,288 watts at idle, while the 16-blade HP ProLiant BL460c solution used 1,647 watts at idle. The 14-blade IBM HS22 solution used 1,973 watts at idle. SPECpower_ssj2008 average active Idle (lower watts are better) 2,500 2,000 1,500 1,000 1,288 1,647 1, Dell 16-Blade Solution HP 16-Blade Solution IBM 14-Blade Solution Figure 2. Comparison of the Blade Solutions at the Active Idle Power Measurement 8

9 Average 100% submeasurement Power Efficiency Comparison of Enterprise-Class Blade Servers and Enclosures SPECpower_ssj2008 includes a measurement of power while the blades are at 100% utilization. As Figure 3 shows, the full enclosure of 16 Dell PowerEdge M610 blade servers used 11.5 percent less overall power at 100% utilization than the HP blade solution but 4% percent more than the IBM BladeCenter H enclosure with 14 HS22 blade servers. It is important to note that even though the IBM blade solution drew less power at 100% utilization than did the Dell blade solution, the IBM solution has two fewer blades to power than either the Dell or HP blade solutions. The 16-blade Dell PowerEdge M610 solution used 4,372 watts at 100% utilization, while the 16-blade HP ProLiant BL460c solution used 4,797 and the 14-blade IBM HS22 solution used 4,219 watts (despite the fact that the IBM blade solution has 2 less blades than the Dell & HP blade solutions). 5,000 SPECpower_ssj2008 average 100% workload (lower watts are better) 4,797 4,500 4,000 4,372 4,219 3,500 3,000 Dell 16-Blade Solution HP 16-Blade Solution IBM 14-Blade Solution Figure 3. Power Usage Comparison of Blade Solutions at 100% Utilization 9

10 Average Power In Watts Power Efficiency Comparison of Enterprise-Class Blade Servers and Enclosures Figure 4 shows the average interval power in watts while running the workload at 100% target load down to 10 percent in stepped 10 percent utilization increments as reported by the SPECpower_ssj2008 benchmark. A full enclosure of 16 Dell PowerEdge M610 blade servers used less power than the 16 HP ProLiant BL460c G6 blade servers and the 14 IBM HS22 blade servers across all of the SPECpower_ssj2008 target load levels. The power deltas were greater between the Dell blade solution and the HP blade solution, where at higher utilization levels (60% 100%) we saw a difference of between 13 and 18.9% in favor of the Dell blade solution. The IBM blade solution was helped greatly with the addition of Platinum-level efficiency power supplies, and almost all workload levels were brought +/- 4% of the Dell blade solution, with the exception of idle which was still 53.2% worse than the Dell solution. However, the IBM blade solution only had 14 blades versus the Dell and HP solutions 16 blades, so it is important to keep this in mind when evaluating total chassis power. 6,000 5,000 4,000 3,000 2,000 1,000 0 SPECpower_ssj2008 Average Power at Each Workload Percentile 100% 90% 80% 70% 60% 50% 40% 30% 20% 10% Active Idle Workload Percentile Dell 16-Blade Solution HP 16-Blade Solution IBM 14-Blade Solution Figure 4. Average Power Utilization Across Workload Intervals 10
 we saw a difference of between 13 and 18.")
11 Performance to Watt Ratio Power Efficiency Comparison of Enterprise-Class Blade Servers and Enclosures Figure 5 shows the performance-to-watt ratio results for the target load percentages. Results are the measured throughput (performance) divided by the average power consumption for each of the workload intervals. The 16 HP ProLiant BL460c G6 blade servers achieved almost identical 100% throughput to the 16 Dell PowerEdge M610 blade servers, but used more power at this and every other workload interval. As a result, the Dell blade solution achieved a higher performance-to-watt ratio than the HP blade solution across all load levels. The 16 Dell PowerEdge M610 blade servers achieved 14% higher throughput than the 14 IBM BladeCenter HS22 Blade servers, and used close to equivalent power across all workload intervals. As a result, the Dell blade solution also achieved a higher performance-to-watt ratio than the IBM blade solution across all load levels. 4,000 3,500 3,000 2,500 2,000 1,500 1, SPECpower_ssj2008 Performance To Watt Ratios (Higher Is Better) 100% 90% 80% 70% 60% 50% 40% 30% 20% 10% Target Load Percentages Dell 16-Blade Solution HP 16-Blade Solution IBM 14-Blade Solution Figure 5. Performance Comparison of Watt Ratios Across Workload Intervals 11

12 100% submeasurement Power Efficiency Comparison of Enterprise-Class Blade Servers and Enclosures SPECpower_ssj2008 includes a measurement of performance at 100% utilization. As Figure 6 shows, the full enclosure of 16 Hewlett-Packard BL460c blades was almost equivalent in performance to the Dell PowerEdge M-Series blade solution. However, the 16 Dell PowerEdge M610 blade servers achieved 14.2% higher performance at 100% utilization than the 14 IBM HS22 blade servers. The 16-blade Dell PowerEdge M610 solution achieved 14,785,342 ssj_ops at 100% utilization, while the 16-blade HP ProLiant BL460c solution achieved 14,731,173 and the 14-blade IBM HS22 solution was able to reach 12,946,642 ssj_ops. 15,000,000 SPECpower_ssj % Workload Higher ssj_ops are better 14,785,342 14,731,173 14,500,000 14,000,000 13,500,000 13,000,000 12,946,642 12,500,000 12,000,000 Dell 16-Blade Solution HP 16-Blade Solution IBM 14-Blade Solution Figure 6. Performance Comparison at 100% Utilization Power Draw on a Per Blade Basis Due to the inequities in the number of blades per chassis between the 14 Blade IBM solution and the 16 Blade Dell and HP solutions, we also looked at the power draw on a per blade basis by dividing the average power for each SPECpower load level by the number of blades in each chassis. We saw that the Dell blade solution was more power efficient on a per blade basis at every load level than either the HP blade solution or the IBM blade solution at every load level. The efficiency differences are especially striking when comparing the Dell blade solution against the IBM blade solution at the active idle workload level, where the IBM solution draws 74% more power at idle on a per blade basis as the Dell blade solution. The Dell blade solution calculated on a per blade basis drew 81W versus 141W for the 12

13 Average Power in Watts Power Efficiency Comparison of Enterprise-Class Blade Servers and Enclosures IBM blade solution. The HP blade solution used 27% more power on a per blade basis at idle than the Dell blade solution, where the per blade power utilization was calculated to be 103W for the HP solution, and 81W for the Dell solution. In addition, when comparing the Dell blade solution against the IBM blade solution at the 100% load level on a per blade basis, the IBM blade solution drew 10% more power than the Dell blade solution. The Dell solution on a per blade basis was calculated to draw 273W versus 301W for the IBM solution. The HP blade solution drew up to 9.8% more power at the 100% load level than the Dell blade solution on a per blade basis, where the per blade power utilization was calculated to be 273W for the Dell blade solution versus 300W for the HP blade solution. See Figure Power Draw per Blade Across All Load Levels Lower watts are better % 90% 80% 70% 60% 50% 40% 30% 20% 10% Active Idle Dell Per Blade HP Per Blade IBM Per Blade Figure 7. Comparison of the Power Utilization on a per Blade Basis 13

14 SPECpower_ssj2008 Overall Score Power Efficiency Comparison of Enterprise-Class Blade Servers and Enclosures Workload During a SPECpower_ssj2008 run, the system under test runs three calibration phases to determine the 100% workload target ssj_ops. Once this value is determined, then the benchmark runs the 100% workload interval, collecting performance and power data, and then scales the workload back in 10% increments until reaching the active idle measurement interval. The active idle interval runs no workload on the server(s) under test, but the power is collected for 5 minutes and averaged. The final SPEcpower_ssj2008 score is the server s performance (in ssj_ops) summed across all workload intervals, divided by the average power summed across all workload intervals. A higher SPECpower_ssj2008 ssj_ops/watt score is better. Overall ssj_ops/watt Figure 8 shows the SPECpower_ssj2008 results for the Dell blade solution, the HP blade solution, and the IBM blade solution in overall ssj_ops/watt. 3,000 2,500 SPECpower_ssj2008 Overall ssj_ops/watt Score Comparison 2,530 2,226 2,181 2,000 1,500 1, Dell 16-Blade Solution HP 16-Blade Solution IBM 14-Blade Solution Figure 8. Comparison of the Overall ssj_ops/watt Score 14
 under test, but the power is collected for 5 minutes and averaged.")
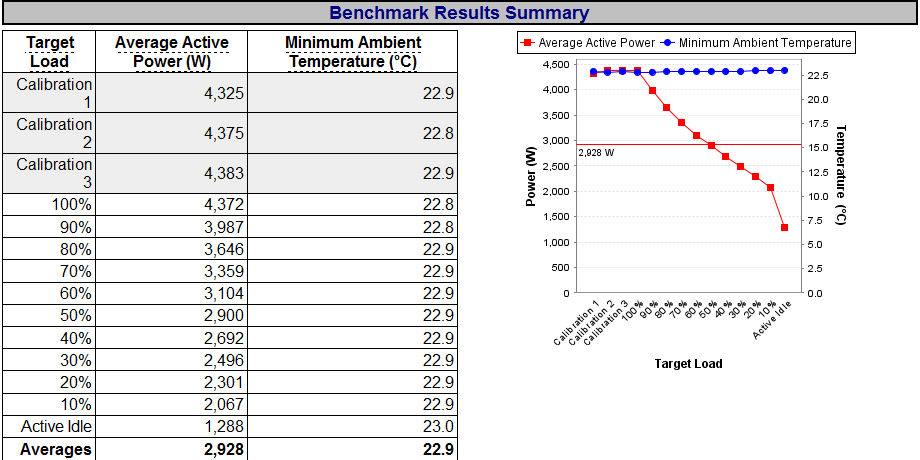
15 Table 1 shows the SPECpower_ssj2008 results for the Dell PowerEdge solution for each target load. Table 1. SPECpower_ssj2008 Results for the 16-Blade Dell Solution Dell PowerEdge M610 (16 total blades) Performance Target Load Power Actual Load ssj_ops Average Active Power (W) 100% 99.70% 14,785,342 4,372 3,382 90% 90.00% 13,344,934 3,987 3,347 80% 79.90% 11,853,404 3,646 3,251 70% 70.00% 10,380,753 3,359 3,090 60% 60.00% 8,903,133 3,104 2,868 50% 50.00% 7,412,879 2,900 2,556 40% 40.00% 5,928,182 2,692 2,203 30% 30.00% 4,444,109 2,496 1,781 20% 20.00% 2,971,405 2,301 1,292 10% 10.00% 1,481,894 2, Active Idle 0 1,288 0 ssj_ops / power = 2,530 Performance to Power Ratio 15

16 Error! Reference source not found. shows the SPECpower_ssj2008 results for the HP blade solution for each target load. (Lower Watts are better. Higher ssj_ops are better.) Table 2. SPECpower_ssj2008 Results for the 16-Blade HP Solution HP Solution (16 total blades) Performance Power Target Load Actual Load ssj_ops Average Active Power (W) 100% 90% 80% 70% 60% 50% 40% 30% 20% 10% Performance to Power Ratio 99.60% 14,731,173 4,797 3, % 13,311,919 4,489 2, % 11,829,340 4,209 2, % 10,355,907 3,908 2, % 8,861,732 3,564 2, % 7,391,761 3,263 2, % 5,929,365 3,002 1, % 4,427,243 2,773 1, % 2,958,463 2,558 1, % 1,480,831 2, Active Idle 0 1,647 0 ssj_ops / power = 2,226 16

17 Table 3 shows the SPECpower_ssj2008 results for the IBM blade solution for each target load. Table 3. SPECpower_ssj2008 Results for the 14-Blade IBM Solution IBM HS22 (14 total blades) Performance Target Load 100% 90% 80% 70% 60% 50% 40% 30% 20% 10% Power Actual Load ssj_ops Average Active Power (W) Performance to Power Ratio 99.60% 12,946,642 4,219 3, % 11,710,021 3,936 2, % 10,404,203 3,668 2, % 9,103,903 3,383 2, % 7,803,387 3,100 2, % 6,501,809 2,859 2, % 5,200,655 2,657 1, % 3,902,419 2,483 1, % 2,598,522 2,323 1, % 1,303,518 2, Active Idle 0 1,973 0 ssj_ops / power = 2,181 17

18 Appendix A Test Methodology SPECpower_ssj2008 Standard SPECpower_ssj2008 is an industry standard benchmark created by the Standard Performance Evaluation Corporation (SPEC) to measure a server s power and performance across multiple utilization levels. SPECpower_ssj2008 consists of a Server Side Java (SSJ) workload along with data collection and control services. SPECpower_ssj2008 results portray the server s performance in ssj_ops (server side Java operations per second) divided by the power used in watts (ssj_ops/watt). SPEC created SPEcpower_ssj2008 for those who want to accurately measure the power consumption of their server in relation to the performance that the server is capable of achieving with ssj2008 workload. SPECpower_ssj2008 consists of three main software components: Server Side Java (SSJ) Workload Java database that stresses the processors, caches and memory of the system, as well as software elements such as OS elements and the Java implementation chosen to run the benchmark. Power and Temperature Daemon (PTDaemon) Program that controls and reports the power analyzer and temperature sensor data. Control and Collect System (CCS) Java program that coordinates the collection of all the data. For more information on how SPECpower_ssj008 works, see All results discussed in this whitepaper are from compliant runs in SPEC terminology, which means that although they have not been submitted to SPEC for review, Dell is allowed to disclose them for the purpose of this study. All configuration details required to reproduce these results are listed in Appendices A, B, and C, and all result files from the runs compared are included in Appendix D. Each blade solution was configured by installing a fresh copy of Microsoft Windows Server 2008 Enterprise R2 on each blade with the operating system installed on a two-hard drive RAID 1 (or RAID in the case of the HP blade solution) choosing the full installation option for each. The latest driver and firmware update packages available to all three blade solutions were installed at the time the data run for that chassis type. Refer to Appendix B for details. The Dell Server Performance Analysis Team ran SPECpower_ssj2008 three times per configuration across all three blade solutions and chose the highest overall ssj_ops/watt score for each configuration to compare for this study. 18

19 Configuration Table 4 details the configuration used for testing. Table 4. Configuration for Testing Configuration Dell Blade Solution HP Blade Solution IBM Blade Solution Blade Chassis PowerEdge M1000e BladeSystem c7000 BladeCenter H-series Blade Type M610 BL460c G6 HS22 # Blades (maximum possible) CPU Type per blade 2 x X GHz 2 x X GHz 2 x X GHz Memory per blade 6 x 4GB 1333MHz DDR3 6 x 4GB 1333MHz DDR3 6 x 4GB 1333MHz DDR3 HDD per blade 2 x 73GB 15K SAS 2 x 73GB 15K SAS 2 x 73GB 15K SAS Operating System Microsoft Windows Server 2008 Enterprise R2 Microsoft Windows Server 2008 Enterprise R2 Microsoft Windows Server 2008 Enterprise R2 Java Version Used IBM J IBM J IBM J Chassis Configuration The team configured the three blade solution chassis for AC Redundancy where applicable, and left any Dynamic Power Supply Engagement options to the default settings. For the Dell PowerEdge M1000e chassis, the Power Redundancy mode defaulted to AC Redundancy, and the Dynamic Power Supply Engagement Mode defaulted to Disabled. For the HP c7000 Blade Enclosure, we selected AC Redundancy, and left the Dynamic Power option at the default of Enabled 3. For the IBM BladeCenter H-Chassis configuration, we changed the Power Management mode from Basic to Redundant Power Management, which best matched our Redundancy choices for the HP and Dell blade solutions. BIOS Settings BIOS settings differed between manufacturers, so we tuned for best-known SPECpower_ssj2008 performance results, following a similar strategy between the three systems. We disabled Turbo Mode on all blades which had it enabled by default and left Turbo off for blades that already had it disabled by default, and disabled all Processor Prefetcher Options exposed in BIOS, which generally improves java-oriented benchmarks such as SPECpower_ssj2008. For the Dell PowerEdge M610, we disabled Turbo Mode, and disabled the following Prefetcher options: Hardware Prefetcher, Adjacent Cache Line Prefetcher, DCU Prefetcher, and Data Reuse. We left the default Power Management mode (Dell Active Power Controller) intact. For the HP ProLiant BL460c G6, we changed the Dynamic Power Regulator speed on the HP blade to Slow (a common HP tuning to enhance performance/watt). We disabled Hardware Prefetcher and Adjacent Cache Line Prefetcher in BIOS. In addition, we disabled DCU Prefetch and Data Reuse in the BIOS as well. 3 From our testing, we determined that the Dynamic Power option in either position offered no real enhancement to SPECpower_ssj2008 results in the configuration as tested, so we left it at the default. 19
 CPU Type per blade 2 x X5670 2.93GHz 2 x X5670 2.")
20 For the IBM BladeCenter HS22, we disabled both exposed Processor Prefetcher options in BIOS: Cache Data Prefetch and Data Reuse. In addition, we enabled Processor C-States (disabled by default) to make the system more comparable to the HP and Dell blade solutions which have this option enabled by default. Enabling C-States enhances SPECpower_ssj2008 competitiveness by allowing the processor to reduce power to the cores to save energy at lower utilization levels, especially at idle. OS Tuning To improve Java performance, large pages were enabled by entering Control Panel->Administrative Tools->Local Security Policy->Local Policies->User Rights Assignment->Lock Pages in Memory. An option was changed to add Administrator. Operating System Power Management mode for all solutions was changed from Balanced (the default) to Power Saver and Power Saver mode was edited to turn off the Hard Drive after 1 minute. Since the IBM BladeCenter HS22 does not have a BIOS Power Management algorithm similar to Dell Active Power Controller or HP Dynamic Power Saver, we changed the minimum processor state of the Power Saver plan from 5% to 0% and the maximum processor state from 75% to 100%. This tuning mimics other Intel Xeon processor 5600 series based IBM SPECpower disclosures. We configured each blade with a separate IP address on the same subnet as our SPECpower_ssj2008 controller system where the Director, CCS, and PTDaemon components were located, and connected each blade to a Dell 24-port Gigabit switch external to the blade enclosure to ensure network connectivity to the controller system. SPECpower_ssj2008 Configuration IBM J9 Java Virtual Machine (JVM) 4 was used for all three blade solutions, as this JVM provided the best performance for SPECpower_ssj2008 of any of the available choices at the time that this study was undertaken. The following JVM options were used on all three blade solutions, as they are the best-known JVM tunings for SPECpower_ssj2008 for the IBM J9 JVM when running with larger memory configurations: -Xmn1400m -Xms1875m -Xmx1875m -Xaggressive -Xcompressedrefs -Xgcpolicy:gencon - XlockReservation -Xnoloa Xlp The following bindings were used to ensure that each of the six JVMs ran on four logical processors: start /affinity [F,F0,F00,F000,F0000,F00000] 4 JVM build 2.4, J2RE IBM J9 2.4 Windows Server 2008 amd64-64 jvmwa64 60sr _

21 Power Meter Configuration We used the Yokogawa WT210 Digital Power Meter for the actual power measurement of the blade enclosures, as this is the most commonly used analyzer for SPECpower_ssj2008 publications at the time that this study was undertaken. For the Dell blade solution, we used two Yokogawa WT210 Power Meters to measure the enclosure power by attaching the first three power supplies to one Power Distribution Unit (PDU) that was connected to a single WT210, and the next three power supplies to a second PDU connected to a second WT210. Each WT210/PDU combination was connected to a separate 208v floor outlet. See Figure 9. Dell M1000E Blade Enclosure P S U 1 P S U 2 P S U 3 P S U 4 P S U 5 P S U 6 WT210 PDU WT V 208V Figure 9. Power Measurement Diagram for the Dell Blade Solution 21
22 For the HP blade solution, we used two Yokogawa WT210 Digital Power Meters to measure the enclosure power by attaching the first three power supplies to one Power Distribution Unit (PDU) that was connected to a single WT210, and the next three power supplies to a second PDU connected to a second WT210. Each WT210/PDU combination was connected to a separate 208v floor outlet. See Figure 10. HP c7000 Blade Enclosure P S U 1 P S U 2 P S U 3 P S U 4 P S U 5 P S U 6 WT210 PDU WT V 208V Figure 10. Power Measurement Diagram for the HP Blade Solution The IBM blade solution presented a challenge. The IBM Blade Enclosure has two sets of three power cables coming from the rear of the unit. Because the power cable connector was different than the Dell and HP Blade Enclosures, we were forced to use a different PDU that would accept the NEMA C20 plug from the IBM enclosure. Each PDU only had two power receptacles to connect power cables, so we used three Yokogawa WT210 Digital Power Meters and three PDUs to measure power from this enclosure. Both of the cable bundles from the rear of the IBM enclosure contained three power cables. The first cable was marked PSU 1,2, the next marked PSU 3,4, and the last marked Blower. We attached the PSU 1,2 from the first cable bundle and PSU 1,2 cable from the second cable bundle to one Yokogawa WT210/PDU combination. The Blower power cables from both bundles were attached to a second Yokogawa WT210/PDU combination. Finally, the PSU 3,4 power cable from the first cable bundle and the PSU 3,4 power cable from the second cable bundle were attached to a third 22

23 Yokogawa WT210/PDU combination. Each WT210/PDU combination was connected to a separate 208v floor outlet. 5 See Figure 11. Figure 11. Power Measurement Diagram for the IBM Blade Solution 5 We also tried connecting power cable 1,2 and 3,4 from the first cable bundle to the first Yokogawa WT210/PDU combination, the blower cables to the second WT210/PDU combination, and power cables 1,2 and 3,4 from the second cable bundle to the third Yokogawa WT210/PDU combination, but got slightly lower SPECpower results using this cabling configuration, so we reverted to the above described cabling methodology (pairing similarly marked cables to PDUs). 23
24 Appendix B Enclosure Configuration Information Table 5. Enclosure Configuration Information Dimensions and Specifications Dell PowerEdge M1000e HP BladeSystem c7000 Height (inches) Width (inches) Depth (inches) U size in server rack Number of blades Chassis Management Firmware CMC (build 32) Power Supplies Onboard Administrator 3.21 Total number Wattage of each IBM BladeCenter H- Chassis 8852 Advanced Module Management bpet54p Power Supply Part Number G803N Y7414 Cooling Fans Total number Blower Modules I/O Modules in Chassis Gigabit Pass Through Modules 2 x Dell 16-port Gigabit Pass-Through 2 x HP 16-port Gigabit Pass-Through 2 x IBM 14-Port Gigabit Pass- Through 24
25 Appendix C Blade System Configuration Information Table 6. Blade System Configuration Information Servers Dell PowerEdge M610 HP ProLiant BL460c G6 IBM HS HU Memory Modules Total RAM in system (GB) Vendor and model number Samsung M393B5170FHD- CH9 Micron MT36JSZF51272PY- 1G4D1AB Type PC R PC R PC R Speed (MHz) Speed in system as tested Timing/latency CAS 9 CAS 9 CAS 9 Number of RAM modules 6 x 4 GB 6 x 4 GB 6 x 4 GB Rank organization Dual Rank Dual Rank Dual Rank Hard Disk Vendor and model number Samsung M392B5170EM1- CH9 Hitachi HUC151473CSS600 Seagate ST973452SS Seagate ST973452SS Number of disks in system Size (GB) Buffer size (MB) RPM 15,000 15,000 15,000 Type SAS 6 Gbps SAS SAS 6 Gbps RAID Type RAID 1 RAID RAID 1 Controller PERC H200 Modular SmartArray P410i LSI SAS StorPort 1064E Operating System Name Microsoft Windows Server 2008 R2 Enterprise Microsoft Windows Server 2008 R2 Enterprise Build number File system NTFS NTFS NTFS Language English English English Network Adapter Vendor and model number Broadcom BCM5709S NetXtreme II Broadcom GbE Microsoft Windows Server 2008 R2 Enterprise Broadcom BCM5709S NetXtreme II Type Integrated Integrated Integrated 25
26 Appendix D Blade System Firmware and Drivers Table 7. Detailed Configuration Information for Blade Server Solutions Servers Dell PowerEdge M610 HP ProLiant BL460c G6 IBM HS HU Driver/Firmware Updates Network Firmware (B) 2.1.5a Network Drivers A d HBA Firmware A HBA Drivers A HDD FW N/A N/A Video Driver A Power Management Controller Firmware N/A 3.4 (D) N/A Management Controller Driver N/A N/A Power Management Driver N/A N/A 26

27 Appendix E SPECpower_ssj2008 Results This appendix provides actual detailed reports and results from Dell testing using tools from the Standard Performance Evaluation Corporation. Benchmark results stated above reflect results run as of July 6, For the latest SPECpower_ssj2008 benchmark results, visit Dell M1000e Blade Enclosure/16 x PowerEdge M610 27

28 28

29 29

30 30
31 31

32 32

33 33
34 HP BladeSystem c7000/16 x ProLiant BL460c G6 34
35 35
36 36
37 37
38 38
39 39
40 40
41 IBM BladeCenter 8852 H-Series/14 x BladeCenter HS
42 42
43 43
44 44
45 45
46 46
47 47
48 48
Power Efficiency Comparison: Cisco UCS 5108 Blade Server Chassis and Dell PowerEdge M1000e Blade Enclosure
 White Paper Power Efficiency Comparison: Cisco UCS 5108 Blade Server Chassis and Dell PowerEdge M1000e Blade Enclosure White Paper March 2014 2014 Cisco and/or its affiliates. All rights reserved. This
Power Efficiency Comparison: Cisco UCS 5108 Blade Server Chassis and IBM FlexSystem Enterprise Chassis
 White Paper Power Efficiency Comparison: Cisco UCS 5108 Blade Server Chassis and IBM FlexSystem Enterprise Chassis White Paper March 2014 2014 Cisco and/or its affiliates. All rights reserved. This document
Summary. Key results at a glance:
 An evaluation of blade server power efficiency for the, Dell PowerEdge M600, and IBM BladeCenter HS21 using the SPECjbb2005 Benchmark The HP Difference The ProLiant BL260c G5 is a new class of server blade
Out-of-box comparison between Dell, HP, and IBM blade servers
 Out-of-box comparison between Dell, HP, and IBM blade servers TEST REPORT DECEMBER 2007 Executive summary Dell Inc. (Dell) commissioned Principled Technologies (PT) to compare the out-of-box experience
Out-of-box comparison between Dell and HP blade servers
 Out-of-box comparison between and blade servers TEST REPORT JUNE 2007 Executive summary Inc. () commissioned Principled Technologies (PT) to compare the out-of-box experience of a PowerEdge 1955 Blade
How To Compare Two Servers For A Test On A Poweredge R710 And Poweredge G5P (Poweredge) (Power Edge) (Dell) Poweredge Poweredge And Powerpowerpoweredge (Powerpower) G5I (
 (Power Edge) (Dell) Poweredge Poweredge And Powerpowerpoweredge (Powerpower) G5I (") TEST REPORT MARCH 2009 Server management solution comparison on Dell PowerEdge R710 and HP Executive summary Dell Inc. (Dell) commissioned Principled Technologies (PT) to compare server management solutions
TEST REPORT MARCH 2009 Server management solution comparison on Dell PowerEdge R710 and HP Executive summary Dell Inc. (Dell) commissioned Principled Technologies (PT) to compare server management solutions
Dell PowerEdge Blades Outperform Cisco UCS in East-West Network Performance
 Dell PowerEdge Blades Outperform Cisco UCS in East-West Network Performance This white paper compares the performance of blade-to-blade network traffic between two enterprise blade solutions: the Dell
Optimizing SQL Server Storage Performance with the PowerEdge R720
 Optimizing SQL Server Storage Performance with the PowerEdge R720 Choosing the best storage solution for optimal database performance Luis Acosta Solutions Performance Analysis Group Joe Noyola Advanced
Figure 1A: Dell server and accessories Figure 1B: HP server and accessories Figure 1C: IBM server and accessories
 TEST REPORT SEPTEMBER 2007 Out-of-box comparison between Dell, HP, and IBM servers Executive summary Dell Inc. (Dell) commissioned Principled Technologies (PT) to compare the out-of-box experience of a
High Performance Tier Implementation Guideline
 High Performance Tier Implementation Guideline A Dell Technical White Paper PowerVault MD32 and MD32i Storage Arrays THIS WHITE PAPER IS FOR INFORMATIONAL PURPOSES ONLY, AND MAY CONTAIN TYPOGRAPHICAL ERRORS
Dell Reference Configuration for Hortonworks Data Platform
 Dell Reference Configuration for Hortonworks Data Platform A Quick Reference Configuration Guide Armando Acosta Hadoop Product Manager Dell Revolutionary Cloud and Big Data Group Kris Applegate Solution
HP ProLiant DL585 G5 earns #1 virtualization performance record on VMmark Benchmark
 HP ProLiant DL585 G5 earns #1 virtualization performance record on VMmark Benchmark HP Leadership»The HP ProLiant DL585 G5 is a highly manageable, rack optimized, four-socket server designed for maximum
HP reference configuration for entry-level SAS Grid Manager solutions
 HP reference configuration for entry-level SAS Grid Manager solutions Up to 864 simultaneous SAS jobs and more than 3 GB/s I/O throughput Technical white paper Table of contents Executive summary... 2
Microsoft SharePoint Server 2010
 Microsoft SharePoint Server 2010 Medium Farm Solution Performance Study Dell SharePoint Solutions Ravikanth Chaganti and Quocdat Nguyen August 2010 THIS WHITE PAPER IS FOR INFORMATIONAL PURPOSES ONLY,
Evaluation Report: HP Blade Server and HP MSA 16GFC Storage Evaluation
 Evaluation Report: HP Blade Server and HP MSA 16GFC Storage Evaluation Evaluation report prepared under contract with HP Executive Summary The computing industry is experiencing an increasing demand for
Power and Cooling Innovations in Dell PowerEdge Servers
 Power and Cooling Innovations in Dell PowerEdge Servers This technical white paper describes the Dell Energy Smart Architecture and the new and enhanced features designed into Dell PowerEdge 12 th generation
Best Practices for Deploying SSDs in a Microsoft SQL Server 2008 OLTP Environment with Dell EqualLogic PS-Series Arrays
 Best Practices for Deploying SSDs in a Microsoft SQL Server 2008 OLTP Environment with Dell EqualLogic PS-Series Arrays Database Solutions Engineering By Murali Krishnan.K Dell Product Group October 2009
SERVER POWER CALCULATOR ANALYSIS: CISCO UCS POWER CALCULATOR AND HP POWER ADVISOR
 SERVER POWER CALCULATOR ANALYSIS: CISCO UCS POWER CALCULATOR AND HP POWER ADVISOR OVERVIEW 20% 15% 10% Power estimation is an important part of data center planning. Historically, data center power circuits
Vendor and Hardware Platform: Fujitsu BX924 S2 Virtualization Platform: VMware ESX 4.0 Update 2 (build 261974)
") Vendor and Hardware Platform: Fujitsu BX924 S2 Virtualization Platform: VMware ESX 4.0 Update 2 (build 261974) Performance Section Performance Tested By: Fujitsu Test Date: 10-05-2010 Configuration Section
Vendor and Hardware Platform: Fujitsu BX924 S2 Virtualization Platform: VMware ESX 4.0 Update 2 (build 261974) Performance Section Performance Tested By: Fujitsu Test Date: 10-05-2010 Configuration Section
Microsoft Exchange 2010 on Dell Systems. Simple Distributed Configurations
 Microsoft Exchange 2010 on Dell Systems Simple Distributed Configurations Global Solutions Engineering Dell Product Group Microsoft Exchange 2010 on Dell Systems Simple Distributed Configurations This
SPC BENCHMARK 2/ENERGY EXECUTIVE SUMMARY ORACLE CORPORATION ORACLE ZFS STORAGE ZS3-2 APPLIANCE (2-NODE CLUSTER) SPC-2/E V1.5
 SPC-2/E V1.5") SPC BENCHMARK 2/ENERGY EXECUTIVE SUMMARY ORACLE CORPORATION ORACLE ZFS STORAGE ZS3-2 APPLIANCE (2-NODE CLUSTER) SPC-2/E V1.5 Submitted for Review: June 25, 2014 EXECUTIVE SUMMARY Page 2 of 12 EXECUTIVE
SPC BENCHMARK 2/ENERGY EXECUTIVE SUMMARY ORACLE CORPORATION ORACLE ZFS STORAGE ZS3-2 APPLIANCE (2-NODE CLUSTER) SPC-2/E V1.5 Submitted for Review: June 25, 2014 EXECUTIVE SUMMARY Page 2 of 12 EXECUTIVE
LSI MegaRAID CacheCade Performance Evaluation in a Web Server Environment
 LSI MegaRAID CacheCade Performance Evaluation in a Web Server Environment Evaluation report prepared under contract with LSI Corporation Introduction Interest in solid-state storage (SSS) is high, and
HP recommended configuration for Microsoft Exchange Server 2010: HP LeftHand P4000 SAN
 HP recommended configuration for Microsoft Exchange Server 2010: HP LeftHand P4000 SAN Table of contents Executive summary... 2 Introduction... 2 Solution criteria... 3 Hyper-V guest machine configurations...
Microsoft SharePoint Server 2010
 Microsoft SharePoint Server 2010 Small Farm Performance Study Dell SharePoint Solutions Ravikanth Chaganti and Quocdat Nguyen November 2010 THIS WHITE PAPER IS FOR INFORMATIONAL PURPOSES ONLY, AND MAY
How To Perform A File Server On A Poweredge R730Xd With Windows Storage Spaces
 FILE SERVER PERFORMANCE ON THE INTEL PROCESSOR-POWERED DELL POWEREDGE R730XD WITH HYBRID STORAGE Storage constraints in your datacenter can put unnecessary limits on workload performance and affect user
RESOLVING SERVER PROBLEMS WITH DELL PROSUPPORT PLUS AND SUPPORTASSIST AUTOMATED MONITORING AND RESPONSE
 RESOLVING SERVER PROBLEMS WITH DELL PROSUPPORT PLUS AND SUPPORTASSIST AUTOMATED MONITORING AND RESPONSE Sometimes, a power fluctuation can damage a memory module, or a hard drive can fail, threatening
HP ProLiant BL660c Gen9 and Microsoft SQL Server 2014 technical brief
 Technical white paper HP ProLiant BL660c Gen9 and Microsoft SQL Server 2014 technical brief Scale-up your Microsoft SQL Server environment to new heights Table of contents Executive summary... 2 Introduction...
COMPLEXITY COMPARISON: CISCO UCS VS. HP VIRTUAL CONNECT
 COMPLEXITY COMPARISON: CISCO UCS VS. HP VIRTUAL CONNECT Not all IT architectures are created equal. Whether you are updating your existing infrastructure or building from the ground up, choosing a solution
Oracle Database Scalability in VMware ESX VMware ESX 3.5
 Performance Study Oracle Database Scalability in VMware ESX VMware ESX 3.5 Database applications running on individual physical servers represent a large consolidation opportunity. However enterprises
Power efficiency and power management in HP ProLiant servers
 Power efficiency and power management in HP ProLiant servers Technology brief Introduction... 2 Built-in power efficiencies in ProLiant servers... 2 Optimizing internal cooling and fan power with Sea of
HP ProLiant BL460c achieves #1 performance spot on Siebel CRM Release 8.0 Benchmark Industry Applications running Microsoft, Oracle
 HP ProLiant BL460c achieves #1 performance spot on Siebel CRM Release 8.0 Benchmark Industry Applications running Microsoft, Oracle HP ProLiant BL685c takes #2 spot HP Leadership» The HP ProLiant BL460c
Adaptec: Snap Server NAS Performance Study
 March 2006 www.veritest.com [email protected] Adaptec: Snap Server NAS Performance Study Test report prepared under contract from Adaptec, Inc. Executive summary Adaptec commissioned VeriTest, a service
Power Comparison of Dell PowerEdge 2950 using Intel X5355 and E5345 Quad Core Xeon Processors
 Power Comparison of Dell PowerEdge 2950 using Intel X5355 and E5345 Quad Core Xeon Processors By Scott Hanson and Todd Muirhead Dell Enterprise Technology Center Dell Enterprise Technology Center dell.com/techcenter
Adaptec: Snap Server NAS Performance Study
 October 2006 www.veritest.com [email protected] Adaptec: Snap Server NAS Performance Study Test report prepared under contract from Adaptec, Inc. Executive summary Adaptec commissioned VeriTest, a service
Performance Characteristics of VMFS and RDM VMware ESX Server 3.0.1
 Performance Study Performance Characteristics of and RDM VMware ESX Server 3.0.1 VMware ESX Server offers three choices for managing disk access in a virtual machine VMware Virtual Machine File System
Evaluation of Dell PowerEdge VRTX Shared PERC8 in Failover Scenario
 Evaluation of Dell PowerEdge VRTX Shared PERC8 in Failover Scenario Evaluation report prepared under contract with Dell Introduction Dell introduced its PowerEdge VRTX integrated IT solution for remote-office
Measuring Processor Power
 White Paper Intel Xeon Processor Processor Architecture Analysis Measuring Processor Power TDP vs. ACP Specifications for the power a microprocessor can consume and dissipate can be complicated and may
HP recommended configurations for Microsoft Exchange Server 2013 and HP ProLiant Gen8 with direct attached storage (DAS)
") HP recommended configurations for Microsoft Exchange Server 2013 and HP ProLiant Gen8 with direct attached storage (DAS) Building blocks at 1000, 3000, and 5000 mailboxes Table of contents Executive summary...
HP recommended configurations for Microsoft Exchange Server 2013 and HP ProLiant Gen8 with direct attached storage (DAS) Building blocks at 1000, 3000, and 5000 mailboxes Table of contents Executive summary...
Achieving a High Performance OLTP Database using SQL Server and Dell PowerEdge R720 with Internal PCIe SSD Storage
 Achieving a High Performance OLTP Database using SQL Server and Dell PowerEdge R720 with This Dell Technical White Paper discusses the OLTP performance benefit achieved on a SQL Server database using a
High Performance SQL Server with Storage Center 6.4 All Flash Array
 High Performance SQL Server with Storage Center 6.4 All Flash Array Dell Storage November 2013 A Dell Compellent Technical White Paper Revisions Date November 2013 Description Initial release THIS WHITE
VIRTUALIZATION-MANAGEMENT COMPARISON: DELL FOGLIGHT FOR VIRTUALIZATION VS. SOLARWINDS VIRTUALIZATION MANAGER
 VIRTUALIZATION-MANAGEMENT COMPARISON: DELL FOGLIGHT FOR VIRTUALIZATION VS. SOLARWINDS VIRTUALIZATION MANAGER Your company uses virtualization to maximize hardware efficiency in your large datacenters.
WHITE PAPER FUJITSU PRIMERGY SERVERS PERFORMANCE REPORT PRIMERGY RX200 S6
 WHITE PAPER PERFORMANCE REPORT PRIMERGY RX200 S6 WHITE PAPER FUJITSU PRIMERGY SERVERS PERFORMANCE REPORT PRIMERGY RX200 S6 This document contains a summary of the benchmarks executed for the PRIMERGY RX200
New!! - Higher performance for Windows and UNIX environments
 New!! - Higher performance for Windows and UNIX environments The IBM TotalStorage Network Attached Storage Gateway 300 (NAS Gateway 300) is designed to act as a gateway between a storage area network (SAN)
Comparing the Carbon Footprints of 11G and 12G Rack Servers from Dell
 Comparing the Carbon Footprints of 11G and 12G Rack Servers from Dell Markus Stutz, Regulatory Principal Engineer, Environmental Affairs August 2013. Contents Comparing two rack server generations... 4
Microsoft Exchange Server 2007 and Hyper-V high availability configuration on HP ProLiant BL680c G5 server blades
 Microsoft Exchange Server 2007 and Hyper-V high availability configuration on HP ProLiant BL680c G5 server blades Executive summary... 2 Introduction... 2 Exchange 2007 Hyper-V high availability configuration...
SUN HARDWARE FROM ORACLE: PRICING FOR EDUCATION
 SUN HARDWARE FROM ORACLE: PRICING FOR EDUCATION AFFORDABLE, RELIABLE, AND GREAT PRICES FOR EDUCATION Optimized Sun systems run Oracle and other leading operating and virtualization platforms with greater
HP ProLiant BL460c takes #1 performance on Siebel CRM Release 8.0 Benchmark Industry Applications running Linux, Oracle
 HP ProLiant BL460c takes #1 performance on Siebel CRM Release 8.0 Benchmark Industry Applications running Linux, Oracle HP first to run benchmark with Oracle Enterprise Linux HP Leadership» The HP ProLiant
Solution Brief: Microsoft SQL Server 2014 Data Warehouse Fast Track on System x3550 M5 with Micron M500DC Enterprise Value SATA SSDs
 Vinay Kulkarni Solution Brief: Microsoft SQL Server 2014 Data Warehouse Fast Track on System x3550 M5 with Micron M500DC Enterprise Value SATA SSDs Solution Reference Number: BDASQLRMS51 The rapid growth
Host Power Management in VMware vsphere 5.5
 in VMware vsphere 5.5 Performance Study TECHNICAL WHITE PAPER Table of Contents Introduction...3 Power Management BIOS Settings...3 Host Power Management in ESXi 5.5... 5 Relationship between HPM and DPM...
DELL. Virtual Desktop Infrastructure Study END-TO-END COMPUTING. Dell Enterprise Solutions Engineering
 DELL Virtual Desktop Infrastructure Study END-TO-END COMPUTING Dell Enterprise Solutions Engineering 1 THIS WHITE PAPER IS FOR INFORMATIONAL PURPOSES ONLY, AND MAY CONTAIN TYPOGRAPHICAL ERRORS AND TECHNICAL
DELL TM PowerEdge TM T610 500 Mailbox Resiliency Exchange 2010 Storage Solution
 DELL TM PowerEdge TM T610 500 Mailbox Resiliency Exchange 2010 Storage Solution Tested with: ESRP Storage Version 3.0 Tested Date: Content DELL TM PowerEdge TM T610... 1 500 Mailbox Resiliency
Microsoft Windows Server 2003 vs. Linux Competitive File Server Performance Comparison
 April 2003 1001 Aviation Parkway, Suite 400 Morrisville, NC 27560 919-380-2800 Fax 919-380-2899 320 B Lakeside Drive Foster City, CA 94404 6-513-8000 Fax 6-513-8099 www.veritest.com [email protected] Microsoft
CUTTING-EDGE SOLUTIONS FOR TODAY AND TOMORROW. Dell PowerEdge M-Series Blade Servers
 CUTTING-EDGE SOLUTIONS FOR TODAY AND TOMORROW Dell PowerEdge M-Series Blade Servers Simplifying IT The Dell PowerEdge M-Series blade servers address the challenges of an evolving IT environment by delivering
Evaluation Report: Accelerating SQL Server Database Performance with the Lenovo Storage S3200 SAN Array
 Evaluation Report: Accelerating SQL Server Database Performance with the Lenovo Storage S3200 SAN Array Evaluation report prepared under contract with Lenovo Executive Summary Even with the price of flash
Dynamic Power Variations in Data Centers and Network Rooms
 Dynamic Power Variations in Data Centers and Network Rooms By Jim Spitaels White Paper #43 Revision 2 Executive Summary The power requirement required by data centers and network rooms varies on a minute
TEST REPORT Dell PERC H700 average percentage win in IOPS over FEBRUARY 2006 Dell PERC 6/i across RAID 5 and RAID 10. Internal HDD tests
 Dell 6Gbps vs. 3Gbps RAID controller performance comparison Test report commissioned by Dell Inc. January 2010 Executive summary We compared the performance of the 6Gbps Dell PowerEdge RAID Controller
Solve your IT energy crisis WITH An energy SMArT SoluTIon FroM Dell
 Solve your IT energy crisis WITH AN ENERGY SMART SOLUTION FROM DELL overcome DATA center energy challenges IT managers share a common and pressing problem: how to reduce energy consumption and cost without
VMware VMmark V1.1.1 Results
 VMware VMmark V1.1.1 Results Vendor and Hardware Platform: Lenovo R525 G2 Virtualization Platform: VMware ESX 4.0(build 164009) Performance Section Performance Tested By: Lenovo Test Date: 06/05/2009 Configuration
Dell Compellent Storage Center SAN & VMware View 1,000 Desktop Reference Architecture. Dell Compellent Product Specialist Team
 Dell Compellent Storage Center SAN & VMware View 1,000 Desktop Reference Architecture Dell Compellent Product Specialist Team THIS WHITE PAPER IS FOR INFORMATIONAL PURPOSES ONLY, AND MAY CONTAIN TYPOGRAPHICAL
How To Write An Article On An Hp Appsystem For Spera Hana
 Technical white paper HP AppSystem for SAP HANA Distributed architecture with 3PAR StoreServ 7400 storage Table of contents Executive summary... 2 Introduction... 2 Appliance components... 3 3PAR StoreServ
Building Microsoft Windows Server 2012 Clusters on the Dell PowerEdge VRTX
 Building Microsoft Windows Server 2012 Clusters on the Dell PowerEdge VRTX Startup Guide Paul Marquardt Contents Introduction... 4 Requirements... 4 Chassis setup... 6 Chassis placement and CMC cabling...
Microsoft Windows Server 2003 with Internet Information Services (IIS) 6.0 vs. Linux Competitive Web Server Performance Comparison
 6.0 vs. Linux Competitive Web Server Performance Comparison") April 23 11 Aviation Parkway, Suite 4 Morrisville, NC 2756 919-38-28 Fax 919-38-2899 32 B Lakeside Drive Foster City, CA 9444 65-513-8 Fax 65-513-899 www.veritest.com [email protected] Microsoft Windows
April 23 11 Aviation Parkway, Suite 4 Morrisville, NC 2756 919-38-28 Fax 919-38-2899 32 B Lakeside Drive Foster City, CA 9444 65-513-8 Fax 65-513-899 www.veritest.com [email protected] Microsoft Windows
Cisco 7816-I5 Media Convergence Server
 Cisco 7816-I5 Media Convergence Server Cisco Unified Communications Solutions unify voice, video, data, and mobile applications on fixed and mobile networks, enabling easy collaboration every time from
SAP CRM Benchmark on Dual-Core Dell Hardware
 SAP CRM Benchmark on Dual-Core Dell Hardware Morten Loderup Dell SAP Competence Center 28 August, 2006 Dell Inc. Contents Executive Summary. 3 SAP CRM Software a brief introduction..4 CRM Project....5
SUN ORACLE EXADATA STORAGE SERVER
 SUN ORACLE EXADATA STORAGE SERVER KEY FEATURES AND BENEFITS FEATURES 12 x 3.5 inch SAS or SATA disks 384 GB of Exadata Smart Flash Cache 2 Intel 2.53 Ghz quad-core processors 24 GB memory Dual InfiniBand
A QUICK AND EASY GUIDE TO SETTING UP THE DELL POWEREDGE C8000
 A QUICK AND EASY GUIDE TO SETTING UP THE DELL POWEREDGE C8000 A Principled Technologies setup guide commissioned by Dell Inc. TABLE OF CONTENTS Table of contents... 2 Introduction... 3 Dell 42U rack...3
Performance Report Modular RAID for PRIMERGY
 Performance Report Modular RAID for PRIMERGY Version 1.1 March 2008 Pages 15 Abstract This technical documentation is designed for persons, who deal with the selection of RAID technologies and RAID controllers
Dynamic Power Variations in Data Centers and Network Rooms
 Dynamic Power Variations in Data Centers and Network Rooms White Paper 43 Revision 3 by James Spitaels > Executive summary The power requirement required by data centers and network rooms varies on a minute
IT@Intel. Comparing Multi-Core Processors for Server Virtualization
 White Paper Intel Information Technology Computer Manufacturing Server Virtualization Comparing Multi-Core Processors for Server Virtualization Intel IT tested servers based on select Intel multi-core
Dell PowerVault MD32xx Deployment Guide for VMware ESX4.1 Server
 Dell PowerVault MD32xx Deployment Guide for VMware ESX4.1 Server A Dell Technical White Paper PowerVault MD32xx Storage Array www.dell.com/md32xx THIS WHITE PAPER IS FOR INFORMATIONAL PURPOSES ONLY, AND
Dell Microsoft SQL Server 2008 Fast Track Data Warehouse Performance Characterization
 Dell Microsoft SQL Server 2008 Fast Track Data Warehouse Performance Characterization A Dell Technical White Paper Database Solutions Engineering Dell Product Group Anthony Fernandez Jisha J Executive
Chapter 5 Cubix XP4 Blade Server
 Chapter 5 Cubix XP4 Blade Server Introduction Cubix designed the XP4 Blade Server to fit inside a BladeStation enclosure. The Blade Server features one or two Intel Pentium 4 Xeon processors, the Intel
VTrak 15200 SATA RAID Storage System
 Page 1 15-Drive Supports over 5 TB of reliable, low-cost, high performance storage 15200 Product Highlights First to deliver a full HW iscsi solution with SATA drives - Lower CPU utilization - Higher data
Arrow ECS sp. z o.o. Oracle Partner Academy training environment with Oracle Virtualization. Oracle Partner HUB
 Oracle Partner Academy training environment with Oracle Virtualization Technology Oracle Partner HUB Overview Description of technology The idea of creating new training centre was to attain light and
MESOS CB220. Cluster-in-a-Box. Network Storage Appliance. A Simple and Smart Way to Converged Storage with QCT MESOS CB220
 MESOS CB220 Cluster-in-a-Box Network Storage Appliance A Simple and Smart Way to Converged Storage with QCT MESOS CB220 MESOS CB220 A Simple and Smart Way to Converged Storage Tailored for SMB storage
Host Power Management in VMware vsphere 5
 in VMware vsphere 5 Performance Study TECHNICAL WHITE PAPER Table of Contents Introduction.... 3 Power Management BIOS Settings.... 3 Host Power Management in ESXi 5.... 4 HPM Power Policy Options in ESXi
PowerVault MD1200/MD1220 Storage Solution Guide for Applications
 PowerVault MD200/MD220 Storage Solution Guide for Applications A Dell Technical White Paper Dell PowerVault Storage Systems Joe Noyola Systems Performance Analysis Group Chuck Colburn Storage Advanced
DATABASE PERFORMANCE WITH ENTERPRISE-CLASS KINGSTON SSDS
 DATABASE PERFORMANCE WITH ENTERPRISE-CLASS KINGSTON SSDS Processing power isn t the only thing that drives database performance. High performing server storage, such as enterprise-class solid-state drives
Data Sheet FUJITSU Server PRIMERGY CX272 S1 Dual socket server node for PRIMERGY CX420 cluster server
 Data Sheet FUJITSU Server PRIMERGY CX272 S1 Dual socket node for PRIMERGY CX420 cluster Data Sheet FUJITSU Server PRIMERGY CX272 S1 Dual socket node for PRIMERGY CX420 cluster Strong Performance and Cluster
The HBAs tested in this report are the Brocade 825 and the Emulex LPe12002 and LPe12000.
 Emulex HBA Product Evaluation Evaluation report prepared under contract with Emulex Corporation Introduction Emulex Corporation commissioned Demartek to evaluate its 8 Gbps Fibre Channel host bus adapters
Dell Virtualization Solution for Microsoft SQL Server 2012 using PowerEdge R820
 Dell Virtualization Solution for Microsoft SQL Server 2012 using PowerEdge R820 This white paper discusses the SQL server workload consolidation capabilities of Dell PowerEdge R820 using Virtualization.
Analysis of VDI Storage Performance During Bootstorm
 Analysis of VDI Storage Performance During Bootstorm Introduction Virtual desktops are gaining popularity as a more cost effective and more easily serviceable solution. The most resource-dependent process
Virtualization with the Intel Xeon Processor 5500 Series: A Proof of Concept
 White Paper Intel Information Technology Computer Manufacturing Server Virtualization Virtualization with the Intel Xeon Processor 5500 Series: A Proof of Concept Intel IT, together with Intel s Digital
Referencia: 814955 Dell PowerEdge SC1430-2GB9L3J Nettó ár: 226.410.- Db: 1 Tag Number: 2GB9L3J
 Referencia: 84955 Dell PowerEdge SC430-2GB9L3J Nettó ár: 226.40.- Tag Number: 2GB9L3J PE SC430 Quad-Core Xeon E5335 2.0GHz 250GB, SATA, 3.5-inch, 7.2K rpm, st HD 250GB, SATA, 3.5-inch, 7.2K rpm, Additional
Part-1: SERVER AND PC
 Part-1: SERVER AND PC Item Item Details Manufacturer Quantity Unit Price Total Dell server or equivalent Intel Xeon E5-2420 1.90GHz, 15M Cache, 7.2GT/s QPI, Turbo, 6C, 95W or equivalent PCIE Riser for
Improve Power saving and efficiency in virtualized environment of datacenter by right choice of memory. Whitepaper
 Whitepaper Save power and improve efficiency in virtualized environment of datacenter by right choice of memory A cooperation of Microsoft Technology Center & Samsung Semiconductor Document Version: 2.1
LSI MegaRAID FastPath Performance Evaluation in a Web Server Environment
 LSI MegaRAID FastPath Performance Evaluation in a Web Server Environment Evaluation report prepared under contract with LSI Corporation Introduction Interest in solid-state storage (SSS) is high, and IT
Hardware & Software Specification i2itracks/popiq
 Hardware & Software Specification i2itracks/popiq 3663 N. Laughlin Rd., Suite 200 Santa Rosa, CA 95403 866-820- 2212 www.i2isys.com 1 I2iSystems Hardware and Software Specifications Revised 04/09/2015
Design Considerations for Increasing VDI Performance and Scalability with Cisco Unified Computing System
 White Paper Design Considerations for Increasing VDI Performance and Scalability with Cisco Unified Computing System White Paper April 2013 2013 Cisco and/or its affiliates. All rights reserved. This document
Performance characterization report for Microsoft Hyper-V R2 on HP StorageWorks P4500 SAN storage
 Performance characterization report for Microsoft Hyper-V R2 on HP StorageWorks P4500 SAN storage Technical white paper Table of contents Executive summary... 2 Introduction... 2 Test methodology... 3
Certification: HP ATA Servers & Storage
 HP ExpertONE Competency Model Certification: HP ATA Servers & Storage Overview Achieving an HP certification provides relevant skills that can lead to a fulfilling career in Information Technology. HP
Cisco-EMC Microsoft SQL Server Fast Track Warehouse 3.0 Enterprise Reference Configurations. Data Sheet
 Cisco-EMC Microsoft SQL Fast Track Warehouse 3.0 Enterprise Reference Configurations Data Sheet May 2011 Raghunath Nambiar Access and Virtualization Business Unit Introduction The Microsoft SQL Fast Track
Dell Virtual Remote Desktop Reference Architecture. Technical White Paper Version 1.0
 Dell Virtual Remote Desktop Reference Architecture Technical White Paper Version 1.0 July 2010 THIS WHITE PAPER IS FOR INFORMATIONAL PURPOSES ONLY, AND MAY CONTAIN TYPOGRAPHICAL ERRORS AND TECHNICAL INACCURACIES.
HP ProLiant Gen8 vs Gen9 Server Blades on Data Warehouse Workloads
 HP ProLiant Gen8 vs Gen9 Server Blades on Data Warehouse Workloads Gen9 Servers give more performance per dollar for your investment. Executive Summary Information Technology (IT) organizations face increasing
SERVER POWER MANAGEMENT COMPARISON: DELL OPENMANAGE
 SERVER POWER MANAGEMENT COMPARISON: DELL OPENMANAGE POWER CENTER AND IBM SYSTEMS DIRECTOR ACTIVE ENERGY MANAGER In your data center, you need both strong and continuous performance to handle the needs
Virtuoso and Database Scalability
 Virtuoso and Database Scalability By Orri Erling Table of Contents Abstract Metrics Results Transaction Throughput Initializing 40 warehouses Serial Read Test Conditions Analysis Working Set Effect of
Optimizing LTO Backup Performance
 Optimizing LTO Backup Performance July 19, 2011 Written by: Ash McCarty Contributors: Cedrick Burton Bob Dawson Vang Nguyen Richard Snook Table of Contents 1.0 Introduction... 3 2.0 Host System Configuration...