A Distributed Blackboard Architecture for Interactive Data Visualization
|
|
|
- Merry Day
- 8 years ago
- Views:
Transcription
1 A Distributed Blackboard Architecture for Interactive Data Visualization Robert van Liere Jan Harkes Wim de Leeuw * Center for Mathematics and Computer Science, CWI Abstract In this paper the motivation, design and application of a distributed blackboard architecture for interactive data visualization is discussed. The main advantages of the architecture is twofold. First, it allows visualization tools to be tightly integrated with simulations. Second, it allows qualitative and quantitative analysis to be combined during the visualization process. 1 Introduction The need for enhanced data modeling and data integration in visualization environments has been widely recognized and has been a topic of interest in recent workshops and conferences [ 10, 161. Although visualization environments provide rich support for graphical modeling and rendering, many visualization researchers feel that integration of the visualization environment with the simulation environment remains a problem to be solved. In this paper a distributed blackboard architecture for interactive data visualization is discussed. The architecture has been used in various projects related to high performance computing [ II] and computational steering [ 121. Motivation tions: This work was motivated by the following observa- 1. State-of-the-art scientific visualization tools are not sufficiently integrated into simulation environments. In computational steering, users can investigate intermediate results and modify of the computation before completion. Feedback during the investigation may be required, for example to steer computation around local minima. Users may interactively steer simulations through adjustment of an application s critical parameters. To support computational steering tight integration between simulation and visualization is required. 2. Large data sets defy inspection by visualization alone. Analysis of simulation output often consists of a combination of visual inspection and numerical or statistical analysis. Scientific visualization environments lack the integration of general purpose analysis tools. Visualization combined with interactive analysis will allow the scientist to explore the data both visually and numerically. Combining the two allows the user to perform qualitative and quantitative analysis simultaneously. In addition, the output of the analysis tools can be combined with the visualization of the simulation data. 3. Efficient support for very large data sets is limited. Very flexible data models have been defined that allow the import/export of data from/to the simulation environment * CWI, Department of Software Engineering, P.O. Box 94097, 1090 GB Amsterdam, Netherlands. {robertl(jaharkeslwimc}@cwi.nl [5,6]. However, in order to effectively embed these data models in the visualization environment, two system related issues have to be addressed; scalability of data, and access to remote computations. Many visualization researchers believe that state-of-the-art visualization environments do not adequately address these problems. For example, Foley and Ribarsky [3] point out that next-generation visualization environments require, amongst others, a means to bind data to geometry and a general analysis model. Blackboard Models Blackboard models have been widely used in the AI community as a particular kind of problem solving model [2, 81. The blackboard model allows multiple independent agents (usually called knowledge sources) to share information in a central store (called the blackboard). The model serves as a schema for organizing reasoning steps and domain knowledge to construct a solution to a particular problem. For example, in a forward reasoning model, problem solving begins by reasoning forwards from initial data towards a goal. In this case each knowledge source will contribute its specific knowledge towards the goal. Knowledge is segmented into modules and a separate inference engine is provided for each module. Communication between modules is realized by reading and writing in the blackboard. The blackboard can be partitioned so that it contains regions with differing, but perhaps related, data structures. In this way applications can organize the solution space into one or more application dependent hierarchies. The blackboard model does not explicitly specify a control component. It merely specifies a general problem solving behavior. The actual locus of control can be in the knowledge modules, in the blackboard itself, in a separate module, or in a combination of these. The difficulty with this description of the blackboard model is that it only outlines the organizational principles. For those who want to build a blackboard system, the model does not specify how it is to be realized as a computational entity. However, given a problem to be solved, the blackboard model provides enough guidelines for sketching a solution. The blackboard model can be used as a framework for implementing visualization environments. This will be substantiated in section 2.6 after we discuss some details of the distributed blackboard architecture. Paper Format The format of the paper is: In the next sections some design details of the distributed blackboard architecture are presented. First we give and overview of the architecture, its ingredients, and its programming abstractions. Then, in section 2.6 we discuss the merits of the architecture and how our original motivations are addressed. In section 3, some related work that resembles Initial proposals considered the blackboard only as a passive memory with external control modules that monitored the changes in the blackboard. Later - efficiency related - refinements integrated the control modules into the blackboard. O x/98/$10.00 Copyright 1998 IEEE 225

2 the blackboard architecture is discussed. Finally, section 4 shows how general analysis tools can be integrated into the visualization process using the blackboard architecture. 2 Distributed Blackboard Architecture 2.1 Overview A simplified overview of f.he architecture is shown in figure 1. The Blackboard 1 Simulation 1 Figure 1: The user view of the blackboard architecture. architecture provides an interface between a user and a simulation. It is centered around a bluckboard and satellite processes that produce and consume data. Satellites implement the simulation, analysis programs, geometry mapping and rendering algorithms. The purpose of the blackboard is twofold. First, it manages a database of variables. Satellites can create, open, close, read, and write variables. Second, it acts as an event notification manager. Satellites can subscribe to events that represent state changes in the blackboard. Whenever such an event occurs, it will publish the event to all subscribing satellites. A large collection of general purpose :satellites have been developed. For example, a data slicing satellite, a calculator, a data logger, a VTK satellite that provides all VTK functionality [ 151, etc. Also, a 3D interactive editor and rendering satellite that binds data to geometry has been developed [ Variables The basic blackboard object is the variable, which encapsulates all information required to access a blackboard object. Variables are defined as a tuple consisting of of four components: a name, a type descriptor, raw data and a list of attributes (see figure 2). Names variable attributes Figure 2: Four components of a variable. uniquely identify the variable. The variable descriptor determines the type, size and layout of the data. The data component is the storage container for the raw data. Attributes are name value pairs that may be used to describe meta-data of the variable. The underlying data model supports two composite data types: regular topology. Data which has been generated from the following grid types; i.e. uniform, rectilinear and curvilinear grids. The regular topology data type is very similar to the data model supported by NetCDF [ 141. In this case, the type descriptor contains all information concerning the shape and dimensionality of the variable. geometry lists A geometry list is a list of geometric elements. Each element can be a simple geometric object, such as polygon, polyline, mesh, light, camera, etc. The the functionality offered by the geometry list is very similar to that offered by the low level interface of P3D [ 171. Future extensions to the data model will include explicit support for data with an irregular topology and scattered data. Note that these extensions do not affect the semantics of the variable, but only the expressiveness of the underlying data model. Operations on variables are very similar to low level file operations: create, open, close, read, write, and getdescriptor. Simple set/get operations are available to manipulate attribute lists. Two scatter/gather techniques are supported to optimize I/O operations on variables. First, many variables can be read/written simultaneously in one atomic I/O operation. Second, a comprehensive data mapping mechanism is provided to allow data to be sliced, subsampled, etc during the I/O operation. This allows satellites to use a different data layout compared to the data structure stored in the blackboard. The identity mapping allows a one-to-one copy between storage in the satellite and data manger. 2.3 Architecture The distributed architecture consists four building blocks: a global name manager (denoted as GNM), one or more local blackboards (LBB), one or more satellites, and typed streams. Global Name Manager: The GNM maintains the bookkeeping information of all LBBs and variables in system. The GNM maintains a list of all variables in the system and in which blackboard these variables exist. Only the variables names, descriptors and attributes are stored in the GNM. Variable data is not stored in the global name manager. Local Blackboard: A local blackboard resides on each host in the distributed environment. Local blackboards accept connections from satellites executing on the same host and other LBBs. Variable data is stored in the LBB, and is shared by all connecting satellites. Each LBB maintains a copy of the variable data. The LBB manages only those variables that are opened by the connected satellites. When a satellite opens a variable, the LBB consults the GNM to check if the same variable exists in other LBBs. If this is the case, the LBB will connect with these LBBs. A LBB-LBB connection is used to maintain variable consistency (variable consistency is addressed in the next paragraph). Satellites: A satellite is a process which communicates with its corresponding LBB. Satellites may create, open, close, and read/write variables, as well as subscribe to variable events. An abstract satellite is shown in figure 3. Basically, it consists of an operator that transforms input data into output data. Control determines when this operation has to be carried out, 226

3 l or, in other words, when a satellite is triggered. Operators can also be controlled by additional parameters manipulated via user interface widgets. control 4-Y datain L operator t parameters dataout Figure 3: Interfaces to an abstract satellite. Data input and output is performed by read/writing variables. Input and output triggering is discussed in section 2.5. Command, event and data streams: A connection between a satellite and the LBB consists of a command, event and data stream. Commands from the satellite to the LBB are sent over the command stream. The LBB sends events to the satellites via the event stream. Data streams are used to transport data between LBBs and satellites. Figure 4 shows a example configuration of the distributed blackboard architecture. This configuration shows two LBBs and four satellites. Both local blackboards are always connected to the GNM. The local blackboards share a variable, hence, are connected. J layers are easier to use, but provide less functionality than the lower layer. The local blackboard API is a low level library interface which provides functionality for LBB communication, variable management and event management. This layer provides all details of the underlying LBB protocols. It requires detailed knowledge and is difficult to use due to the inherent parallelism in the system. The high level data input output layer is built on top of the local blackboard API. Many cumbersome low-level details are shielded from the user. In particular, the data input output layer hides the notion of events and has builtin support for structuring variables into sets, and support for handling efficient set I/O. A design goal of the data input output layer was to keep the required changes to the simulation code minimal. As an example of the data input output layer, consider the following C program: simulation(float *s, float *t, int *size, float *x) { int continue = TRUE; /* Open connection, connect and subscribe variables *I dioopen( borneo.cwi.nl ); dioconnectfloat( s, s, READ); dioconnectint( continue, &continue, READ); dioconnectfloatarray( x, x, 1, size, UPDATE); dioconnectfloat( t, t, WRITE); /* simulation loop and update data */ while (continue) { t=t+ 1.0; calculate-values(t, s, size, x); dioupdate(); 1 dioclose(); Figure 4: Distributed blackboard architecture. Satellites execute in parallel but LBBs are single threaded, so that only one satellite can access the LBB simultaneously. However, access to different LBBs is concurrent. When a satellite writes a variable, the LBB will broadcast a mutate event to all connected satellites and LBBs that share the variable. When a satellite reads a variable, the LBB will first check if the data is up to date and, if so, will service the read request. If the data is not up to date, the LBB will first get the latest copy of the data from another LBB before servicing the read request. The details of this algorithm are very similar to the cache consistency algorithms found on cache based SMP machines. 2.4 Programming Abstractions Satellite programmers can access the LBB using three layered APIs. Each layer provides a higher level of abstraction. Higher The structure of this example, which is typical for continuous simulations, consists of two parts. First, variables are initialized. The required changes to existing source code are limited to opening and closing a connection with the Data Manager and connection of the variables via the dioconnect routines. Second, a main loop is entered where time is incremented and new values are calculated. The required changes to the source code is a single call to exchange data. The locations where to insert these calls are easy to find; typically at the outer level of the simulation program. The first parameters of the dioconnect routines are the name of the variable and its address. For the connection of arrays the number of dimensions,and their sizes must also be specified. The last parameter is used by the dioupdate routine to determine the direction of the data flow. In dioupdate first the event stream from the LBB is checked if variables to be read or updated have changed. If SO, these variables are read from the LBB. Next the values of all unread variables are written to the LBB. The net result of dioupdate is that all connected variables have the same value in the simulation and LBB. With these few calls the user can interact with parameters (s) of the simulation, to stop 227

4 the simulation (continue), change state variables (x). monitor its progress (t, x) or To deal with more hierarchical situations, variables may be grouped into sets. In the main loop the satellite can read and write specific sets, and wait until a particular set mutates..4 extensible and embedded scripting language built on top of the data input output. Scripting can be used for simple operations on variables, such as slicing and logging. The advantage of scripting is its ease of use in developing satellites. Satellite Control and Synchronization Satellites cooperate via the basic input/output mechanisms that are provided for variables. Writing to a variable will cause an event to be sent to all satellites subscribed to that variable. This mechanism is used to mediate the execution of satellites. The user can specify that if a particular variable - the input trigger variable -is mutated, the operator has to be evaluated. The action of operator evaluation is called triggering. Furthermore, the user can also specify an output trigger variable, which is to be written to each time the operator has been evaluated. Input and out;put triggers variables can be linked together to mediate the execution of satellites. In general, linking two trigger variables defines a data dependency between these two variables. Linking a number of variables results in an directed graph, which we call the trigger graph. A high level trigger scripting language and script interpreter satellite have been developed to simplify the definition of trigger variables. The task of the trigger script interpreter satellite is to manage the trigger graph. As an example, consider the trigger graph shown in figure 5: A slicing and dicing satellite operate on simu- Figure 5: Control loop of four satellites defined by a trigger script lation output, which in turn is the input for the rendering satellite. The simulation may only compute the next step after the rendering satellite has drawn the previous frame. The rendering satellite depends on variable computed by the simulation and dicer. The script to realize this configuration is: simulation > slicer slicer > dicer simulation & dicer > renderer renderer > simulation A trigger script is defined as a sequence of trigger rules. The syntax of each rule is : rule := expr > name expr := expr & expr 1 expr 1 expr 1 expr ; expr 1 ( expr ) ) name name := satellitename The trigger script interpreter satellite has been integrated in the data input output layer. Whenever the trigger script satellite interprets a trigger rule, it sets the attributes of the trigger input variable with a representation of this rule. The data input output layer uses this information to determine when a satellite is to be triggered. Note that attributes of the trigger input variable are set by the trigger script interpreter satellite and can be reset during the lifetime of the satellite. 2.6 Discussion The distributed blackboard extends the centralized blackboard in many ways; it provides support for efficient data movement among heterogeneous hosts, scales for large data sets, and offers a richer data model. Although the architecture is distributed, it is important to note that the programming model is not affected; i.e. the user and programmer view of a blackboard is still a centralized data store. The architecture has been implemented on a number of heterogeneous UNIX and NT machines. TCP/IP is used for communication between LBB s and, when possible, shared memory is used for satellite to LBB communication. Rendering satellites are available for many display types, ranging from low-end laptop displays to sophisticated VR displays, such as the CAVE. In retrospect, we believe that the architecture provides support to fulfill our original requirements: integration. The variable naming mechanism is used to bind data structures in the blackboard to data structures in the satellite. The event mechanism is used to maintain the consistency of these data structures. The net effect is that a two way binding exists between data in the blackboard and data in the satellite. For example, a rendering satellite can utilize this by binding geometry to variables in the blackboard. A simulation can also bind the same variables. Hence, computational steering is supported. qualitative vs. quantitative analysis. Integration of data structures is not restricted to simulation and rendering satellites alone, but can be used by any satellite. General purpose analysis tools can be packaged as satellites. numerical or statistical analysis Hence, the analysis of simulation output can be a combination of visual inspection and numerical/statistical analysis. efficiency of data transport. Distributed blackboards maintain local copies of a data structure. A single event will be broadcasted when a satellite mutates the data structure. The data structure will be transported to another blackboard only when it is needed. This mechanism - called transport by demand - saves bandwidth if data structures are written frequently but read only occasionally. ease of use. Using the low level libraries require knowledge about event driven and parallel programming abstractions. However, higher level libraries shield all these details and allow a programmer to easily bind Fortran data structures to variables in the blackboard. In this way existing simulation code can rapidly be integrated into the environment. Also, programmers need not know that the blackboard is distributed. Abstractions for opening and manipulation variables are very similar to the familiar file handling abstractions. 228

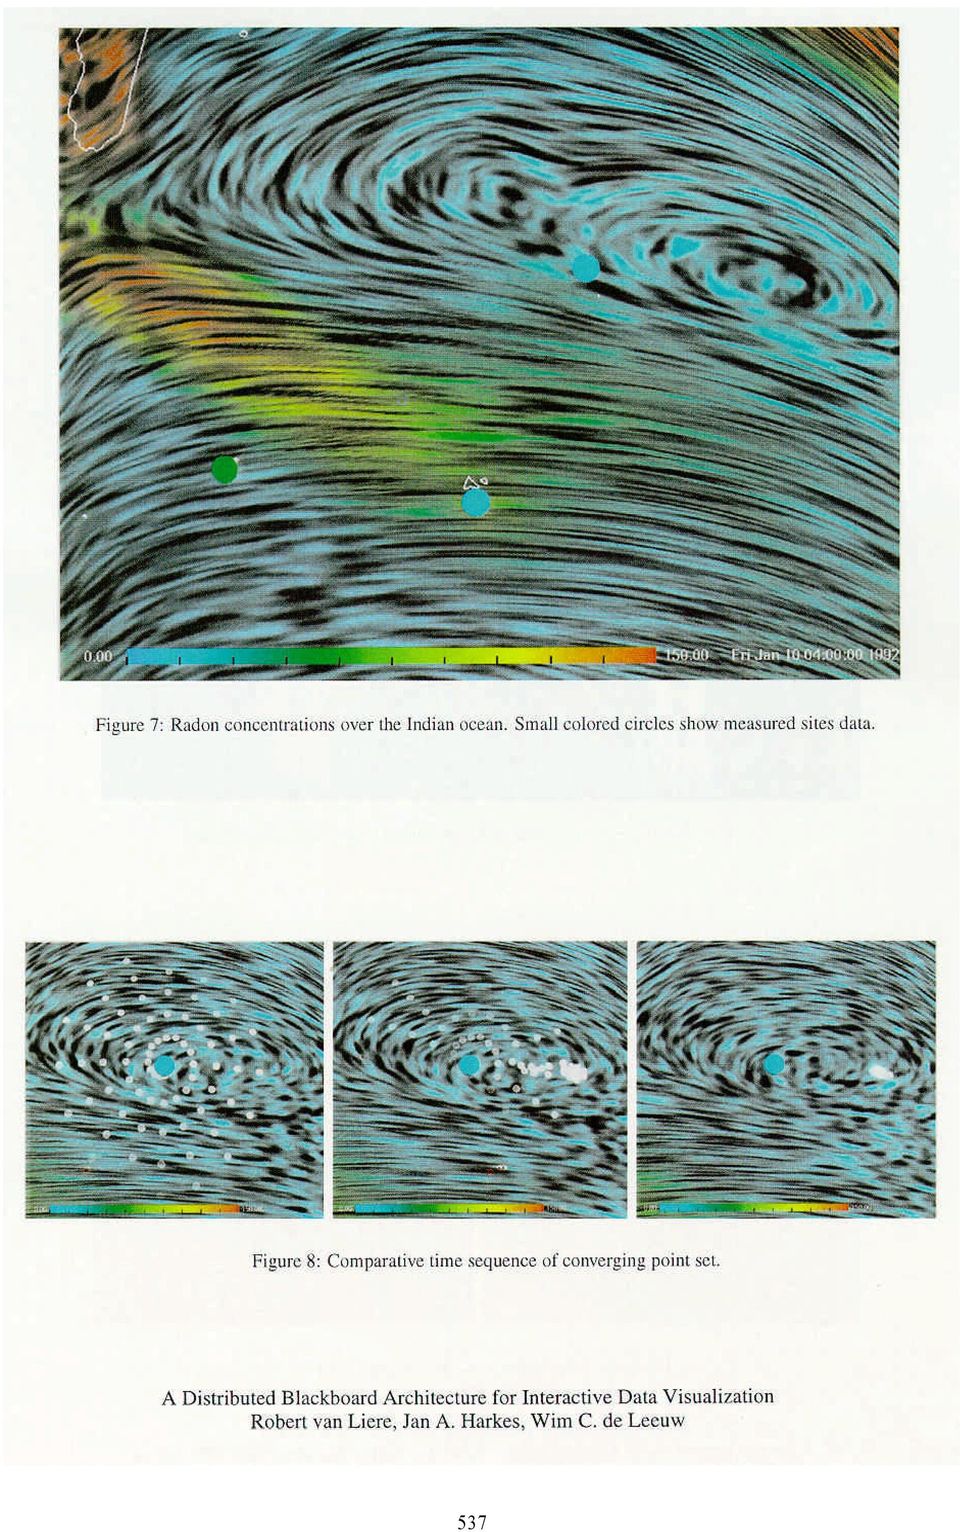
5 3 Related work Many research and development teams have designed and implemented interactive visualization environments. Giving an in depth analysis of other visualization environments is outside the scope of this paper - see [4] for a elaborate annotated bibliography on various aspects of interactive data visualization, including interactive program monitoring and steering. Instead of a extensive overview of related work, we discuss work dealing with issues that relate to our blackboard architecture. Williams, Rasure and Hanson [18] provide a framework to understand design tradeoffs when developing data flow based visualization systems. Data flow systems are attractive because of the similarities with the visualization pipeline: users can easily organize their simulation, filter, mapping and render modules in an intuitive way. However, data flow environments do not provide support to deal directly with the underlying data, except for importing/export data from a file or simulation. Hence, the integration with the underlying data is limited. CAVEvis [9] is a distributed real-time visualization system for streaming large scalar and vector fields into the CAVE. The governing idea is to render the geometry as fast as possible in order to maintain the highest level of interactivity. It uses separately running modules to asynchronously generate the geometry data, such as modules to generate isosurfaces or particle paths. Sequence names and time-stamps are used to gather data related to a frame, regardless of the order in which the data is received. Our blackboard architecture does not explicitly support any form of sequencing and control. Rather, the synchronization is used to provide similar functionality. SuperGlue [7] is a programming environment for scientific visualization whose main goal is extensibility and ease of use. The approach used is to offer a very generic set of primitive data structures and a inter-language interface, which programmers use to integrate data into SuperGlue system. The distributed blackboard architecture has been applied to an atmospheric transport application. In the hope that systematic simulation errors can be found, researchers are interested in comparing simulated concentrations with actual measurements. Simulation errors can arise from modeling errors, numerical errors, visualization errors, and input errors. Using our system we want to discover systematic errors that occur due to a combination of: spatial errors: geographical locations of the simulated data differ from the measured data. temporal errors: the simulated data differ from the measured data in time. scaling errors: the simulated data is systematically higher or lower than the measured data; eg. due to an inaccurate emission sources. Various automated data analysis techniques have been developed that search for regions in the simulated data that fit the measured data. Details of these techniques, which are are based on statistical comparison and fitting methods, are outside the scope of this paper. The goal of this particular case is the accurate forecasting of radioactive noble gas Radon ( Rn) concentrations based on measured wind and emission fields. The simulated Radon concentrations were compared with measured concentrations on three islands in the Indian ocean. Visualization Figure 6 gives an overview of the ongoing Radon transport simulation over the Indian ocean. Spot noise was used to display the wind fields. A rainbow color mapping was used to display the Radon concentrations and small colored circles showing the measured concentrations are drawn on the three sites where measured data is available. The three sites are located at: 4 Radon Forecasting

6 Figure 7 shows a sequence of snapshots of the automated point fitting process. Semi-transparent circles are drawn at points calculated by the data analysis techniques. The opacity of the circles is mapped to the fit of the data. Transparent circles indicate points of poor fit; opaque circles indicate points of better fit. The left image of figure 7 depicts the points in an initial configuration around Amsterdam Island. A new configuration is derived by deleting a poor fitting point and taking for a new point at a random position close to the best fit point. In this way the process converges to a minimum, the area which best fits the data. The middle image shows the configuration after a number of steps. Finally the points may converge to a stable configuration, as indicated on the right image. A plotting satellite was used to show time series of a scalar value. The output of the plotting satellite is shown on the bottom of figure 8. The three plots show: the measured data at Amsterdam Island (top plot), the simulated data at the point of measurement (middle plot), and the best fit found by the analysis satellite (bottom plot). Blackboard Figure 9: Blackboard configuration of Radon application. the visualization) with quantitative analysis tools (computations of numerical algorithmsj. Several levels of information can be differentiated: on the lowest level computed data and measured data is available, analysis satellites consume this data to produce information of a higher level. The user, in turn, can interact with the simulation or analysis satellites as a reaction to this information. The distributed blackboard architecture is a natural framework for solving such problems. Whenever information at a certain level is mutated, the appropriate satellite recalculates its output using the new information and mutates the next level of information. Due to the blackboard architecture, data can be shared among all satellites. 1 Figure 8: Measured data at Amsterdam Island (top) simulated data (middle) and best fit (bottom) The user may at any time also edit the set of points by dragging any point to a different location. This is useful if the user suspects other local minima in the data which may be missed by the analysis software. Blackboard Figure 9 is a diagram of the blackboard and the satellites around it. The Radon simulation satellite creates a set of three variables containing the wind fields and the simulated scalar Radon field. After each time step this set will be dumped into the LBB. A reader satellite reads the measured site data from a data base and writes this data onto the blackboard. The analysis satellite creates the variable containing the candidate points. It continuously dumps a new candidate points into the LBB until a stop criterion is reached. In addition, the analysis satellite opens the variables created by the simulation. Whenever a new data set is produced it will read it, and if any of the candidate points have been mutated, it will read the new candidate points. The visualization satellite will read and display the data sets and candidate points. Upon any variable mutation, the corresponding satellite will be triggered. After each time step the simulation will dump data into the LBB. Alternatively, the user may drag a point to a new position, resulting in a new set of candidate points which are written to the LBB. Discussion The governing idea of this example is to show how the blackboard model is used in a non-trivial setting. The application combines qualitative user actions (direct manipulation of 5 Conclusion In this paper we presented a distributed blackboard architecture for scientific visualization. The blackboard architecture allowed us to address two important issues concerning interactive visualization environments. These issues are: First, tight integration between simulation and visualization. This is realized through the name concept of a variable which tightly binds data stored in in the blackboard with data in the satellite. Second, to combine qualitative and quantitative data analysis. This is realized by allowing general analysis satellites to operate in close cooperation with the visualization satellites. The Radon application is very simple and should be seen as an elementary case study. In the future we plan to apply the distributed architecture to a 3D ozone simulation over the Netherlands. Here, the fitting criteria will be a volume, the chemical reactions involved in computing ozone are much more complicated, and the measured ozone data is less reliable. Nevertheless, there are signs that this type of visualization based analysis will provide added value to the atmospheric researcher [I]. Acknowledgments During the coarse of this work, we have benefited from helpful discussions with Frank Dentener of the Institute for Marine and Atmospheric Research in Utrecht and Jan Verwer of the Department of Modelling, Analysis and Simulation at the CWI. We are grateful to the reviewers who provided valuable ideas for improvements of the paper. This work is partially funded by the Dutch foundation High Performance Computing and Networking (High Performance Visualization project). 230

7 References [I ] F. Dentener. Personal Communication, Institute for Marine and Atmospheric Research (IMAU), Febuary, [2] R. Engelmore and T. Morgan, editors. Blackboard Systems. Adison-Wesley, [3] J. Foley and W. Ribarsky. Next-generation data visualization tools. In L. Rosenblum, R.A. Earnshaw, J. Encarnacao, H. Hagen, A. Kaufman, S. Klimenko, G. Nielson, F. Post, and D. Thalmann, editors, Scientific Visualization : Advances and Challenges, pages Academic Press, [17] J. Welling, C. Nuuja, and P. Andrews. P3D: A lisp-based format for representing general 3d models. In Proceedings Supercompting 90, pages ACM, [I81 C. Williams, J. Rasure, and C. Hansen. The State of the Art of Visual Languages for Visualization. In A.E. Kaufman and G.M. Nielson, editors, Proceedings Visualization 92, pages , [4] W. Gu, J. Vetter, and K. Schwan. An annotated bibliography of interactive program steering. SKPLAN Notices, 29(9): , [5] R. Haber, B. Lucas, and N. Collins. A data model for scientific visualizaiton with provisions for regular and irregular grids. In G.M. Nielson and L. Rosenblum, editors, Proceedings Visualization 91, pages , I99 I. [6] W.L. Hibbard, C.R. Dyer, and B.E. Paul. A lattice model for data display. In R.D. Bergeron and A.E. Kaufman, editors, Proceedings Visualization 94, pages 3 IO-3 17, [7] J. Hultquist and E. Raible. SuperGlue: A programming environment for scientific visualization. In A.E. Kaufman and G.M. Nielson, editors, Proceedings Visualization 92, pages , [S] V. Jagannathan, R. Dodhiawala, and L. Baum, editors. Blackboard Architectures and Applications. Academic-Press, [9] V. Jaswal. CAVEvis: Distributed real-time visualization of time-varying scalar and vector fields using the CAVE virtual reality theater. In R. Yagel and H. Hagen, editors, Proceedings Visualization 97, pages , [IO] J.P. Lee and G.G. Grinstein, editors. Database Visualization. Springer Verlag, Issues for Data [I I] WC. de Leeuw and R. van Liere. Divide and conquer spot noise. In Proceedings Supercompting 97 (http : // scxy.tc.cornell.edu / ~97 / program / TECH/DELEEUW / INDEX.HTM). ACM, [ 121 R. van Liere and J.J. van Wijk. Steering smog prediction. In B. Hertzberger and P. Sloot, editors, Proceedings HPCN- Europe 97, pages Springer Verlag, April [ 131 J.D. Mulder and J.J. van Wijk. 3D computational steering with parametrized geometric objects. In G.M. Nielson and D. Silver, editors, Proceedings Visuulization 95, pages I, [ 141 R.K. Rew and G.P. Davis. The UNIDATA netcdf: Software for scientific data access. In 6th Interutional Conference on lnteructive Information and Processing Systems for Meteorology, Oceanography and Hydology, pages 33-40, Anaheim, CA, [I51 W.J. Schroeder, K.M. Martin, and W.E. Lorensen. The design and implementation of an object-oriented toolkit for 3D graphics and visualization. In R. Yagel and G.M. Nielson, editors, Proceedings Visualization 96, pages 93-l 00, [I61 L.A. Treinish. Workshop report: data structure and access software for scientific visualization. In SIGGRAPH 90 workshop report, volume 25(2), pages 104-l 18. ACM, 199 I. 231
![Post, and D. Thalmann, editors, Scientific Visualization : Advances and Challenges, pages 103-126. Academic Press, 1994. [17] J. Welling, C. Nuuja, and P. Andrews.](/docs-images/43/8840207/images/page_7.jpg "P3D: A lisp-based format for representing general 3d models. In Proceedings Supercompting 90, pages 766-774. ACM, 1990. [I81 C. Williams, J. Rasure, and C. Hansen.")
8 537
A Distributed Blackboard Architecture for Interactive Data Visualization
 A Distributed Blackboard Architecture for Interactive Data Visualization Robert van Liere Jan Harkes Wim de Leeuw Abstract In this paper we present a distributed blackboard architecture for scientific
Wim de Leeuw and Robert van Liere Center for Mathematics and Computer Science CWI, P.O. Box 94097, 1090 GB Amsterdam, Netherlands
 ! #"$%& '% ()*!,+-.0/ 213' 54 67* 89 Wim de Leeuw and Robert van Liere Center for Mathematics and Computer Science CWI, P.O. Box 94097, 1090 GB Amsterdam, Netherlands ABSTRACT Modern computational fluid
FDVis: the Interactive Visualization and Steering Environment for the Computational Processes Using the Finite-Difference Method
 Nonlinear Analysis: Modelling and Control, 2003, Vol. 8, No. 2, 71 82 FDVis: the Interactive Visualization and Steering Environment for the Computational Processes Using the Finite-Difference Method A.
The Data Grid: Towards an Architecture for Distributed Management and Analysis of Large Scientific Datasets
 The Data Grid: Towards an Architecture for Distributed Management and Analysis of Large Scientific Datasets!! Large data collections appear in many scientific domains like climate studies.!! Users and
A Survey of Computational Steering Environments
 A Survey of Computational Steering Environments Jurriaan D. Mulder, Jarke J. van Wijk, Robert van Liere Center for Mathematics and Computer Science CWI, P.O. Box 94079, 1090 GB Amsterdam, the Netherlands
MEng, BSc Applied Computer Science
 School of Computing FACULTY OF ENGINEERING MEng, BSc Applied Computer Science Year 1 COMP1212 Computer Processor Effective programming depends on understanding not only how to give a machine instructions
Comparing Microsoft SQL Server 2005 Replication and DataXtend Remote Edition for Mobile and Distributed Applications
 Comparing Microsoft SQL Server 2005 Replication and DataXtend Remote Edition for Mobile and Distributed Applications White Paper Table of Contents Overview...3 Replication Types Supported...3 Set-up &
Workload Characterization and Analysis of Storage and Bandwidth Needs of LEAD Workspace
 Workload Characterization and Analysis of Storage and Bandwidth Needs of LEAD Workspace Beth Plale Indiana University plale@cs.indiana.edu LEAD TR 001, V3.0 V3.0 dated January 24, 2007 V2.0 dated August
MayaVi: A free tool for CFD data visualization
 MayaVi: A free tool for CFD data visualization Prabhu Ramachandran Graduate Student, Dept. Aerospace Engg. IIT Madras, Chennai, 600 036. e mail: prabhu@aero.iitm.ernet.in Keywords: Visualization, CFD data,
EBERSPÄCHER ELECTRONICS automotive bus systems. solutions for network analysis
 EBERSPÄCHER ELECTRONICS automotive bus systems solutions for network analysis DRIVING THE MOBILITY OF TOMORROW 2 AUTOmotive bus systems System Overview Analyzing Networks in all Development Phases Control
VisIt Visualization Tool
 The Center for Astrophysical Thermonuclear Flashes VisIt Visualization Tool Randy Hudson hudson@mcs.anl.gov Argonne National Laboratory Flash Center, University of Chicago An Advanced Simulation and Computing
A Multi-layered Domain-specific Language for Stencil Computations
 A Multi-layered Domain-specific Language for Stencil Computations Christian Schmitt, Frank Hannig, Jürgen Teich Hardware/Software Co-Design, University of Erlangen-Nuremberg Workshop ExaStencils 2014,
Bachelor of Games and Virtual Worlds (Programming) Subject and Course Summaries
 Subject and Course Summaries") First Semester Development 1A On completion of this subject students will be able to apply basic programming and problem solving skills in a 3 rd generation object-oriented programming language (such as
First Semester Development 1A On completion of this subject students will be able to apply basic programming and problem solving skills in a 3 rd generation object-oriented programming language (such as
THE CERN/SL XDATAVIEWER: AN INTERACTIVE GRAPHICAL TOOL FOR DATA VISUALIZATION AND EDITING
 THE CERN/SL XDATAVIEWER: AN INTERACTIVE GRAPHICAL TOOL FOR DATA VISUALIZATION AND EDITING Abstract G. Morpurgo, CERN As a result of many years of successive refinements, the CERN/SL Xdataviewer tool has
Visualization Techniques in Data Mining
 Tecniche di Apprendimento Automatico per Applicazioni di Data Mining Visualization Techniques in Data Mining Prof. Pier Luca Lanzi Laurea in Ingegneria Informatica Politecnico di Milano Polo di Milano
MEng, BSc Computer Science with Artificial Intelligence
 School of Computing FACULTY OF ENGINEERING MEng, BSc Computer Science with Artificial Intelligence Year 1 COMP1212 Computer Processor Effective programming depends on understanding not only how to give
IDL. Get the answers you need from your data. IDL
 Get the answers you need from your data. IDL is the preferred computing environment for understanding complex data through interactive visualization and analysis. IDL Powerful visualization. Interactive
Zhenping Liu *, Yao Liang * Virginia Polytechnic Institute and State University. Xu Liang ** University of California, Berkeley
 P1.1 AN INTEGRATED DATA MANAGEMENT, RETRIEVAL AND VISUALIZATION SYSTEM FOR EARTH SCIENCE DATASETS Zhenping Liu *, Yao Liang * Virginia Polytechnic Institute and State University Xu Liang ** University
A Survey Study on Monitoring Service for Grid
 A Survey Study on Monitoring Service for Grid Erkang You erkyou@indiana.edu ABSTRACT Grid is a distributed system that integrates heterogeneous systems into a single transparent computer, aiming to provide
Lightweight Data Integration using the WebComposition Data Grid Service
 Lightweight Data Integration using the WebComposition Data Grid Service Ralph Sommermeier 1, Andreas Heil 2, Martin Gaedke 1 1 Chemnitz University of Technology, Faculty of Computer Science, Distributed
HPC Wales Skills Academy Course Catalogue 2015
 HPC Wales Skills Academy Course Catalogue 2015 Overview The HPC Wales Skills Academy provides a variety of courses and workshops aimed at building skills in High Performance Computing (HPC). Our courses
2 Associating Facts with Time
 TEMPORAL DATABASES Richard Thomas Snodgrass A temporal database (see Temporal Database) contains time-varying data. Time is an important aspect of all real-world phenomena. Events occur at specific points
CHAPTER 2 MODELLING FOR DISTRIBUTED NETWORK SYSTEMS: THE CLIENT- SERVER MODEL
 CHAPTER 2 MODELLING FOR DISTRIBUTED NETWORK SYSTEMS: THE CLIENT- SERVER MODEL This chapter is to introduce the client-server model and its role in the development of distributed network systems. The chapter
CE 504 Computational Hydrology Computational Environments and Tools Fritz R. Fiedler
 CE 504 Computational Hydrology Computational Environments and Tools Fritz R. Fiedler 1) Operating systems a) Windows b) Unix and Linux c) Macintosh 2) Data manipulation tools a) Text Editors b) Spreadsheets
Visualisatie BMT. Introduction, visualization, visualization pipeline. Arjan Kok Huub van de Wetering (h.v.d.wetering@tue.nl)
") Visualisatie BMT Introduction, visualization, visualization pipeline Arjan Kok Huub van de Wetering (h.v.d.wetering@tue.nl) 1 Lecture overview Goal Summary Study material What is visualization Examples
Visualisatie BMT Introduction, visualization, visualization pipeline Arjan Kok Huub van de Wetering (h.v.d.wetering@tue.nl) 1 Lecture overview Goal Summary Study material What is visualization Examples
OpenMI 'in a nutshell'
 OpenMI Association, Technical Committee January 2010 1. Introduction... 1 2. Standard... 2 2.1. Definitions... 4 2.1.1. Model... 4 2.1.2. Value... 4 2.1.3. Spatial... 5 2.2. Composition building... 5 2.3.
Visualization with ParaView. Greg Johnson
 Visualization with Greg Johnson Before we begin Make sure you have 3.8.0 installed so you can follow along in the lab section http://paraview.org/paraview/resources/software.html http://www.paraview.org/
An Integrated Simulation and Visualization Framework for Tracking Cyclone Aila
 An Integrated Simulation and Visualization Framework for Tracking Cyclone Aila Preeti Malakar 1, Vijay Natarajan, Sathish S. Vadhiyar, Ravi S. Nanjundiah Department of Computer Science and Automation Supercomputer
NVIDIA IndeX. Whitepaper. Document version 1.0 3 June 2013
 NVIDIA IndeX Whitepaper Document version 1.0 3 June 2013 NVIDIA Advanced Rendering Center Fasanenstraße 81 10623 Berlin phone +49.30.315.99.70 fax +49.30.315.99.733 arc-office@nvidia.com Copyright Information
DEGREE PLAN INSTRUCTIONS FOR COMPUTER ENGINEERING
 DEGREE PLAN INSTRUCTIONS FOR COMPUTER ENGINEERING Fall 2000 The instructions contained in this packet are to be used as a guide in preparing the Departmental Computer Science Degree Plan Form for the Bachelor's
PETASCALE DATA STORAGE INSTITUTE. SciDAC @ Petascale storage issues. 3 universities, 5 labs, G. Gibson, CMU, PI
 PETASCALE DATA STORAGE INSTITUTE 3 universities, 5 labs, G. Gibson, CMU, PI SciDAC @ Petascale storage issues www.pdsi-scidac.org Community building: ie. PDSW-SC07 (Sun 11th) APIs & standards: ie., Parallel
1 File Processing Systems
 COMP 378 Database Systems Notes for Chapter 1 of Database System Concepts Introduction A database management system (DBMS) is a collection of data and an integrated set of programs that access that data.
Introduction to Visualization with VTK and ParaView
 Introduction to Visualization with VTK and ParaView R. Sungkorn and J. Derksen Department of Chemical and Materials Engineering University of Alberta Canada August 24, 2011 / LBM Workshop 1 Introduction
Visualization with ParaView
 Visualization with ParaView Before we begin Make sure you have ParaView 4.1.0 installed so you can follow along in the lab section http://paraview.org/paraview/resources/software.php Background http://www.paraview.org/
Visualizing Data: Scalable Interactivity
 Visualizing Data: Scalable Interactivity The best data visualizations illustrate hidden information and structure contained in a data set. As access to large data sets has grown, so has the need for interactive
An interactive 3D visualization system for displaying fieldmonitoring
 icccbe 2010 Nottingham University Press Proceedings of the International Conference on Computing in Civil and Building Engineering W Tizani (Editor) An interactive 3D visualization system for displaying
Visualization of Adaptive Mesh Refinement Data with VisIt
 Visualization of Adaptive Mesh Refinement Data with VisIt Gunther H. Weber Lawrence Berkeley National Laboratory VisIt Richly featured visualization and analysis tool for large data sets Built for five
OPNET Network Simulator
 Simulations and Tools for Telecommunications 521365S: OPNET Network Simulator Jarmo Prokkola Research team leader, M. Sc. (Tech.) VTT Technical Research Centre of Finland Kaitoväylä 1, Oulu P.O. Box 1100,
Interactive Data Mining and Visualization
 Interactive Data Mining and Visualization Zhitao Qiu Abstract: Interactive analysis introduces dynamic changes in Visualization. On another hand, advanced visualization can provide different perspectives
AVS/Express - an object-oriented visual development tool
 AVS/Express - an object-oriented visual development tool Bruno Proix Advanced Visual Systems, Clichy, France Abstract This paper describes a new generation of software dedicated to the development of applications
Data Management in an International Data Grid Project. Timur Chabuk 04/09/2007
 Data Management in an International Data Grid Project Timur Chabuk 04/09/2007 Intro LHC opened in 2005 several Petabytes of data per year data created at CERN distributed to Regional Centers all over the
Parallel Analysis and Visualization on Cray Compute Node Linux
 Parallel Analysis and Visualization on Cray Compute Node Linux David Pugmire, Oak Ridge National Laboratory and Hank Childs, Lawrence Livermore National Laboratory and Sean Ahern, Oak Ridge National Laboratory
Cluster, Grid, Cloud Concepts
 Cluster, Grid, Cloud Concepts Kalaiselvan.K Contents Section 1: Cluster Section 2: Grid Section 3: Cloud Cluster An Overview Need for a Cluster Cluster categorizations A computer cluster is a group of
NVIDIA IndeX Enabling Interactive and Scalable Visualization for Large Data Marc Nienhaus, NVIDIA IndeX Engineering Manager and Chief Architect
 SIGGRAPH 2013 Shaping the Future of Visual Computing NVIDIA IndeX Enabling Interactive and Scalable Visualization for Large Data Marc Nienhaus, NVIDIA IndeX Engineering Manager and Chief Architect NVIDIA
INFORMATION TECHNOLOGY PROGRAM
 INFORMATION TECHNOLOGY PROGRAM The School of Information Technology offers a two-year bachelor degree program in Information Technology for students having acquired an advanced vocational certificate.
Sentaurus Workbench Comprehensive Framework Environment
 Data Sheet Comprehensive Framework Environment Overview is a complete graphical environment for creating, managing, executing, and analyzing TCAD simulations. Its intuitive graphical user interface allows
Architectural Patterns. Layers: Pattern. Architectural Pattern Examples. Layer 3. Component 3.1. Layer 2. Component 2.1 Component 2.2.
 Architectural Patterns Architectural Patterns Dr. James A. Bednar jbednar@inf.ed.ac.uk http://homepages.inf.ed.ac.uk/jbednar Dr. David Robertson dr@inf.ed.ac.uk http://www.inf.ed.ac.uk/ssp/members/dave.htm
BSC vision on Big Data and extreme scale computing
 BSC vision on Big Data and extreme scale computing Jesus Labarta, Eduard Ayguade,, Fabrizio Gagliardi, Rosa M. Badia, Toni Cortes, Jordi Torres, Adrian Cristal, Osman Unsal, David Carrera, Yolanda Becerra,
JMulTi/JStatCom - A Data Analysis Toolkit for End-users and Developers
 JMulTi/JStatCom - A Data Analysis Toolkit for End-users and Developers Technology White Paper JStatCom Engineering, www.jstatcom.com by Markus Krätzig, June 4, 2007 Abstract JStatCom is a software framework
Finger Paint: Cross-platform Augmented Reality
 Finger Paint: Cross-platform Augmented Reality Samuel Grant Dawson Williams October 15, 2010 Abstract Finger Paint is a cross-platform augmented reality application built using Dream+ARToolKit. A set of
White Paper. How Streaming Data Analytics Enables Real-Time Decisions
 White Paper How Streaming Data Analytics Enables Real-Time Decisions Contents Introduction... 1 What Is Streaming Analytics?... 1 How Does SAS Event Stream Processing Work?... 2 Overview...2 Event Stream
REGULATIONS FOR THE DEGREE OF MASTER OF SCIENCE IN COMPUTER SCIENCE (MSc[CompSc])
![REGULATIONS FOR THE DEGREE OF MASTER OF SCIENCE IN COMPUTER SCIENCE (MSc[CompSc])](/thumbs/33/16674036.jpg "REGULATIONS FOR THE DEGREE OF MASTER OF SCIENCE IN COMPUTER SCIENCE (MSc[CompSc])") 305 REGULATIONS FOR THE DEGREE OF MASTER OF SCIENCE IN COMPUTER SCIENCE (MSc[CompSc]) (See also General Regulations) Any publication based on work approved for a higher degree should contain a reference
305 REGULATIONS FOR THE DEGREE OF MASTER OF SCIENCE IN COMPUTER SCIENCE (MSc[CompSc]) (See also General Regulations) Any publication based on work approved for a higher degree should contain a reference
RS MDM. Integration Guide. Riversand
 RS MDM 2009 Integration Guide This document provides the details about RS MDMCenter integration module and provides details about the overall architecture and principles of integration with the system.
The STC for Event Analysis: Scalability Issues
 The STC for Event Analysis: Scalability Issues Georg Fuchs Gennady Andrienko http://geoanalytics.net Events Something [significant] happened somewhere, sometime Analysis goal and domain dependent, e.g.
Visualization à la Unix TM
 Visualization à la Unix TM Hans-Peter Bischof (hpb [at] cs.rit.edu) Department of Computer Science Golisano College of Computing and Information Sciences Rochester Institute of Technology One Lomb Memorial
Data Visualization Study at Earth Simulator Center
 Chapter 4 Visualization Data Visualization Study at Earth Simulator Center Project Representative Akira Kageyama The Earth Simulator Center, Japan Agency for Marine-Earth Science and Technology Authors
White Paper: 5GL RAD Development
 White Paper: 5GL RAD Development After 2.5 hours of training, subjects reduced their development time by 60-90% A Study By: 326 Market Street Harrisburg, PA 17101 Luis Paris, Ph.D. Associate Professor
McIDAS-V - A powerful data analysis and visualization tool for multi and hyperspectral environmental satellite data
 McIDAS-V - A powerful data analysis and visualization tool for multi and hyperspectral environmental satellite data Thomas Achtor, Thomas Rink, Thomas Whittaker, David Parker and David Santek Space Science
VisCMD: Visualizing Cloud Modeling Data
 CPSC-533C Information Visualization Project Report VisCMD: Visualizing Cloud Modeling Data Quanzhen Geng (#63546014) and Jing Li (#90814013) Email: gengqz@hotmail.com larrybcca@yahoo.ca (Master of Software
Computer Network. Interconnected collection of autonomous computers that are able to exchange information
 Introduction Computer Network. Interconnected collection of autonomous computers that are able to exchange information No master/slave relationship between the computers in the network Data Communications.
MIDDLEWARE 1. Figure 1: Middleware Layer in Context
 MIDDLEWARE 1 David E. Bakken 2 Washington State University Middleware is a class of software technologies designed to help manage the complexity and heterogeneity inherent in distributed systems. It is
Taboret Management Application Builder
 Taboret Management Application Builder INTRODUCTION Management Application Builders allow network-knowledgeable people to build their own solutions to management problems. More important, these new tools
The Visualization Pipeline
 The Visualization Pipeline Conceptual perspective Implementation considerations Algorithms used in the visualization Structure of the visualization applications Contents The focus is on presenting the
NakeDB: Database Schema Visualization
 NAKEDB: DATABASE SCHEMA VISUALIZATION, APRIL 2008 1 NakeDB: Database Schema Visualization Luis Miguel Cortés-Peña, Yi Han, Neil Pradhan, Romain Rigaux Abstract Current database schema visualization tools
OpenText Information Hub (ihub) 3.1 and 3.1.1
 3.1 and 3.1.1") OpenText Information Hub (ihub) 3.1 and 3.1.1 OpenText Information Hub (ihub) 3.1.1 meets the growing demand for analytics-powered applications that deliver data and empower employees and customers to
OpenText Information Hub (ihub) 3.1 and 3.1.1 OpenText Information Hub (ihub) 3.1.1 meets the growing demand for analytics-powered applications that deliver data and empower employees and customers to
Outline. Fundamentals. Rendering (of 3D data) Data mappings. Evaluation Interaction
 Data mappings. Evaluation Interaction") Outline Fundamentals What is vis? Some history Design principles The visualization process Data sources and data structures Basic visual mapping approaches Rendering (of 3D data) Scalar fields (isosurfaces
Outline Fundamentals What is vis? Some history Design principles The visualization process Data sources and data structures Basic visual mapping approaches Rendering (of 3D data) Scalar fields (isosurfaces
OVERVIEW HIGHLIGHTS. Exsys Corvid Datasheet 1
 Easy to build and implement knowledge automation systems bring interactive decision-making expertise to Web sites. Here s proven technology that provides customized, specific recommendations to prospects,
ZooKeeper. Table of contents
 by Table of contents 1 ZooKeeper: A Distributed Coordination Service for Distributed Applications... 2 1.1 Design Goals...2 1.2 Data model and the hierarchical namespace...3 1.3 Nodes and ephemeral nodes...
Software Engineering Reference Framework
 Software Engineering Reference Framework Michel Chaudron, Jan Friso Groote, Kees van Hee, Kees Hemerik, Lou Somers, Tom Verhoeff. Department of Mathematics and Computer Science Eindhoven University of
Parallel Large-Scale Visualization
 Parallel Large-Scale Visualization Aaron Birkland Cornell Center for Advanced Computing Data Analysis on Ranger January 2012 Parallel Visualization Why? Performance Processing may be too slow on one CPU
13.2 THE INTEGRATED DATA VIEWER A WEB-ENABLED APPLICATION FOR SCIENTIFIC ANALYSIS AND VISUALIZATION
 13.2 THE INTEGRATED DATA VIEWER A WEB-ENABLED APPLICATION FOR SCIENTIFIC ANALYSIS AND VISUALIZATION Don Murray*, Jeff McWhirter, Stuart Wier, Steve Emmerson Unidata Program Center, Boulder, Colorado 1.
Monitoring Infrastructure (MIS) Software Architecture Document. Version 1.1
 Software Architecture Document. Version 1.1") Monitoring Infrastructure (MIS) Software Architecture Document Version 1.1 Revision History Date Version Description Author 28-9-2004 1.0 Created Peter Fennema 8-10-2004 1.1 Processed review comments Peter
Monitoring Infrastructure (MIS) Software Architecture Document Version 1.1 Revision History Date Version Description Author 28-9-2004 1.0 Created Peter Fennema 8-10-2004 1.1 Processed review comments Peter
Availability Digest. www.availabilitydigest.com. Raima s High-Availability Embedded Database December 2011
 the Availability Digest Raima s High-Availability Embedded Database December 2011 Embedded processing systems are everywhere. You probably cannot go a day without interacting with dozens of these powerful
GETTING STARTED WITH LABVIEW POINT-BY-POINT VIS
 USER GUIDE GETTING STARTED WITH LABVIEW POINT-BY-POINT VIS Contents Using the LabVIEW Point-By-Point VI Libraries... 2 Initializing Point-By-Point VIs... 3 Frequently Asked Questions... 5 What Are the
Operating Systems 4 th Class
 Operating Systems 4 th Class Lecture 1 Operating Systems Operating systems are essential part of any computer system. Therefore, a course in operating systems is an essential part of any computer science
The Scientific Data Mining Process
 Chapter 4 The Scientific Data Mining Process When I use a word, Humpty Dumpty said, in rather a scornful tone, it means just what I choose it to mean neither more nor less. Lewis Carroll [87, p. 214] In
Stream Processing on GPUs Using Distributed Multimedia Middleware
 Stream Processing on GPUs Using Distributed Multimedia Middleware Michael Repplinger 1,2, and Philipp Slusallek 1,2 1 Computer Graphics Lab, Saarland University, Saarbrücken, Germany 2 German Research
Chapter 11 I/O Management and Disk Scheduling
 Operating Systems: Internals and Design Principles, 6/E William Stallings Chapter 11 I/O Management and Disk Scheduling Dave Bremer Otago Polytechnic, NZ 2008, Prentice Hall I/O Devices Roadmap Organization
Utility Communications FOXMAN-UN Network Management System for ABB Communication Equipment
 Utility Communications FOXMAN-UN Network Management System for ABB Communication Equipment A reliable & flexible communication network lies at the heart of successful electrical grid operations. A comprehensive
A standards-based approach to application integration
 A standards-based approach to application integration An introduction to IBM s WebSphere ESB product Jim MacNair Senior Consulting IT Specialist Macnair@us.ibm.com Copyright IBM Corporation 2005. All rights
Patterns of Information Management
 PATTERNS OF MANAGEMENT Patterns of Information Management Making the right choices for your organization s information Summary of Patterns Mandy Chessell and Harald Smith Copyright 2011, 2012 by Mandy
Java (12 Weeks) Introduction to Java Programming Language
 Introduction to Java Programming Language") Java (12 Weeks) Topic Lecture No. Introduction to Java Programming Language 1 An Introduction to Java o Java as a Programming Platform, The Java "White Paper" Buzzwords, Java and the Internet, A Short
Java (12 Weeks) Topic Lecture No. Introduction to Java Programming Language 1 An Introduction to Java o Java as a Programming Platform, The Java "White Paper" Buzzwords, Java and the Internet, A Short
Digital libraries of the future and the role of libraries
 Digital libraries of the future and the role of libraries Donatella Castelli ISTI-CNR, Pisa, Italy Abstract Purpose: To introduce the digital libraries of the future, their enabling technologies and their
REAL-TIME STREAMING ANALYTICS DATA IN, ACTION OUT
 REAL-TIME STREAMING ANALYTICS DATA IN, ACTION OUT SPOT THE ODD ONE BEFORE IT IS OUT flexaware.net Streaming analytics: from data to action Do you need actionable insights from various data streams fast?
WebSphere Business Monitor
 WebSphere Business Monitor Dashboards 2010 IBM Corporation This presentation should provide an overview of the dashboard widgets for use with WebSphere Business Monitor. WBPM_Monitor_Dashboards.ppt Page
Security and privacy for multimedia database management systems
 Multimed Tools Appl (2007) 33:13 29 DOI 10.1007/s11042-006-0096-1 Security and privacy for multimedia database management systems Bhavani Thuraisingham Published online: 1 March 2007 # Springer Science
Diagram 1: Islands of storage across a digital broadcast workflow
 XOR MEDIA CLOUD AQUA Big Data and Traditional Storage The era of big data imposes new challenges on the storage technology industry. As companies accumulate massive amounts of data from video, sound, database,
Backbase Accessibility
 Whitepaper Learn about: Section 508 Accessibility requirements Backbase compliance Introduction This paper discusses the growing importance of Rich Internet Applications (RIA s) and their support for Accessibility.
QF01/0407-1.0 الخطة الدراسية كلية العلوم وتكنولوجيا المعلومات- برنامج الماجستير/ الوصف المختصر
 Algorithms analysis and design(0102721). The course introduces students to a variety of computer problems and methods of their solutions. It enables students to assess the complexity of problems and algorithms.
Software design (Cont.)
") Package diagrams Architectural styles Software design (Cont.) Design modelling technique: Package Diagrams Package: A module containing any number of classes Packages can be nested arbitrarily E.g.: Java
Package diagrams Architectural styles Software design (Cont.) Design modelling technique: Package Diagrams Package: A module containing any number of classes Packages can be nested arbitrarily E.g.: Java
Firewall Builder Architecture Overview
 Firewall Builder Architecture Overview Vadim Zaliva Vadim Kurland Abstract This document gives brief, high level overview of existing Firewall Builder architecture.
A Cognitive Approach to Vision for a Mobile Robot
 A Cognitive Approach to Vision for a Mobile Robot D. Paul Benjamin Christopher Funk Pace University, 1 Pace Plaza, New York, New York 10038, 212-346-1012 benjamin@pace.edu Damian Lyons Fordham University,
SCADE System 17.0. Technical Data Sheet. System Requirements Analysis. Technical Data Sheet SCADE System 17.0 1
 SCADE System 17.0 SCADE System is the product line of the ANSYS Embedded software family of products and solutions that empowers users with a systems design environment for use on systems with high dependability
2. Distributed Handwriting Recognition. Abstract. 1. Introduction
 XPEN: An XML Based Format for Distributed Online Handwriting Recognition A.P.Lenaghan, R.R.Malyan, School of Computing and Information Systems, Kingston University, UK {a.lenaghan,r.malyan}@kingston.ac.uk
Achieving Nanosecond Latency Between Applications with IPC Shared Memory Messaging
 Achieving Nanosecond Latency Between Applications with IPC Shared Memory Messaging In some markets and scenarios where competitive advantage is all about speed, speed is measured in micro- and even nano-seconds.
A Visualization is Worth a Thousand Tables: How IBM Business Analytics Lets Users See Big Data
 White Paper A Visualization is Worth a Thousand Tables: How IBM Business Analytics Lets Users See Big Data Contents Executive Summary....2 Introduction....3 Too much data, not enough information....3 Only
Robot Task-Level Programming Language and Simulation
 Robot Task-Level Programming Language and Simulation M. Samaka Abstract This paper presents the development of a software application for Off-line robot task programming and simulation. Such application
Progress: a Toolkit for Interactive Program Steering 1
 Progress: a Toolkit for Interactive Program Steering 1 Jeffrey Vetter 2 Karsten Schwan Technical Report GIT-CC-95-16, August 1995 College of Computing Georgia Institute of Technology Atlanta, GA 30332-0280
A Visualization System and Monitoring Tool to Measure Concurrency in MPICH Programs
 A Visualization System and Monitoring Tool to Measure Concurrency in MPICH Programs Michael Scherger Department of Computer Science Texas Christian University Email: m.scherger@tcu.edu Zakir Hussain Syed
OPC COMMUNICATION IN REAL TIME
 OPC COMMUNICATION IN REAL TIME M. Mrosko, L. Mrafko Slovak University of Technology, Faculty of Electrical Engineering and Information Technology Ilkovičova 3, 812 19 Bratislava, Slovak Republic Abstract