How To Use Java On An Ipa (Jspa) With A Microsoft Powerbook (Jempa) With An Ipad And A Microos 2.5 (Microos)
|
|
|
- Anna Donna Horn
- 5 years ago
- Views:
Transcription
1 Java Monitoring and Diagnostic Tooling Iris Baron IBM Java JIT on System Z [email protected] Session ID: Insert Custom Session QR if Desired.

2 Java Road Map Java 7.0 Language Updates Java 6.0 SE platforms WAS 6.1 EE 6.x WAS 7.0 Language improvements Closures for simplified fork/join 7.0 WAS 6.0 EE Performance Improvements Client WebServices Support SE platforms New Language features: Autoboxing Enumerated types Generics Metadata Support for dynamic languages Improve ease of use for SWING New IO APIs (NIO2) Java persistence API JMX 2.x and WS connection for JMX agents Language Changes SE601/ 7.x >= 20 platforms Java 5.0 Java 8.0** 2012 IBM Java 6.0 (J9 R24) WAS 8.5 IBM Java 6.0.1/Java7.0 Improved performance Improvements in (J9 R26) Generational Garbage Collector Performance Improvements in Shared classes support Serviceability tooling Performance New J9 Virtual Machine Class Sharing GC Technology New Testarossa JIT technology XML parser improvements z196 Exploitation First Failure Data Capture z10 Exploitation OOO Pipeline Full Speed Debug DFP exploitation for BigDecimal 70+ New Instructions Large Pages JZOS/Security Enhancements Hot Code Replace New ISA features Common runtime technology ME, SE, EE 2 **Timelines and deliveries are subject to change IBM Java7R1 IBM Java Runtimes IBM Java 5.0 (J9 R23) 2013 Improvements in Performance RAS Monitoring zec12 Exploitation zedc for zip acceleration SMC-R integration Transactional Execution Runtime instrumentation Hints/traps Data Access Accelerator IBM Java7.0SR3 Improvements in Performance zec12 Exploitation Transactional Execution Flash 1Meg pageable LPs 2G large pages Hints/traps
 WAS 8.5 IBM Java 6.0.1/Java7.")
3 Linux on System z and Java7SR3 on zec12 Linux on System z - Multi-Threaded 64 bit Java Workload 16-Way ~12x Improvement in Hardware and Software Normalized Throughput 160 zec12 SDK 7 SR3 Aggressive + LP Code Cache 140 zec12 SDK 7 SR z196 SDK 7 SR1 80 z196 SDK 6 SR z10 SDK 6 SR4 20 z9 SDK 5 SR4 NO (CR or Heap LP) Threads (Controlled measurement environment, results may vary) ~12x aggregate hardware and software improvement comparing Java5SR4 on z9 to Java7SR3 on zec12 3 LP=Large Pages for Java heap CR=Java compressed references Java7SR3 using -Xaggressive + 1Meg large pages

 on zec12 J9R27 J9R27 (Controlled measurement environment, results may vary) 4x aggregate hardware and software improvement")
4 WAS on zlinux Aggregate HW, SDK and WAS Improvement: WAS 6.1 (Java 5) on z9 to WAS 8.5 (Java 7) on zec12 J9R27 J9R27 (Controlled measurement environment, results may vary) 4x aggregate hardware and software improvement comparing WAS 6.1 Java5 on z9 to WAS 8.5 Java7 on zec12 4
 4x aggregate hardware and software improvement")
5 IBM Operational Decision Manager IBM Operational Decision Management zec12 16-way (Normalized to IBM Java 7 SR4) Throughput IBM Java 7 IBM Java 7R1 (Controlled measurement environment, results may vary) 19% improvement to ODM with IBM Java 7R1 compared to IBM Java 7 5

6 Agenda IBM Monitoring and Diagnostic Tools for Java Why use the tools? Where to get the tools? IBM Recommended Java Troubleshooting Tools Health Center Garbage Collector and Memory Visualizer Memory Analyzer Summary 6

7 Why use the IBM Tools? Tools simplify troubleshooting problems : IBM provides a free unified suite of tools to understand different aspects of Java applications Possible problems: Application coding errors Environment variables Performance tuning Configuration problems Fully IBM supported Tools provide visualizations, analysis and recommendations Fixing problems is much easier with the right tool for the job! 7

8 Where to get the IBM Tools? IBM Support Assistant A free application available at: Eclipse Market Place Tools available to install directly into Eclipse 8

9 What is IBM Support Assistant? IBM Support Assistant (ISA) is a free application that : Provides the toolbox in which analysis and diagnostic tools reside Over one hundred add-ons available for various IBM products Provides Serviceability Tools across product families Simplifies software support Provides Search feature to query IBM and non-ibm knowledge banks Not a monitoring tool 9


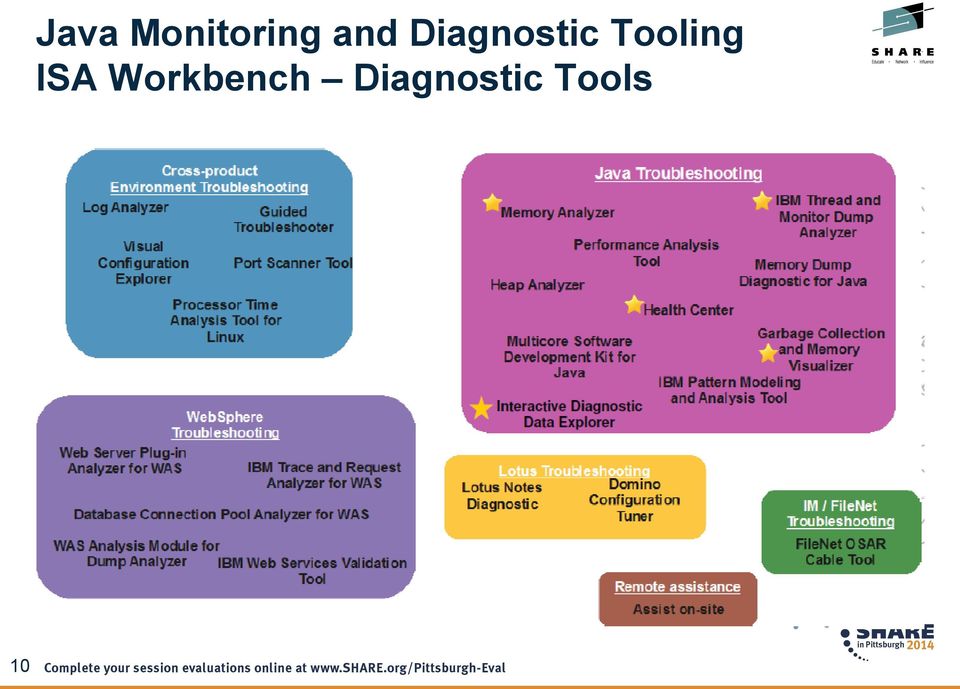
10 ISA Workbench Diagnostic Tools 10
11 What is IBM Support Assistant? ISA Workbench 4.1 Eclipse-based client Workbench is installed on each desktop (single user) Collect and organize diagnostic data (logs, traces, etc.) Find and use Problem Determination tools Search and browse support-related information about IBM products 11
 Find and use Problem Determination tools Search and browse")
12 What is IBM Support Assistant? ISA 5.0 Team Server Server-based model Install once - shared by many team members via browser Web 2.0 browser interface Remote execution of PD tools Off-load analysis processing Collaboration on PD Case Management Tool Management Single-user option available 12

13 Agenda IBM Monitoring and Diagnostic Tools for Java Why use the tools? Where to get the tools? IBM Recommended Java Troubleshooting Tools Health Center Garbage Collector and Memory Visualizer Memory Analyzer Summary 13

14 Health Center Motivating questions: What is my JVM doing? Is everything ok? Why is my application running slowly? Why is it not scaling? Am I using the right options? 14

15 Health Center Live monitoring tool with very low overhead (< 1%) Suitable for all Java applications running on IBM s JVM Provides insight into your application behaviour with visualization Diagnoses potential problems with recommendations Powerful API allowing embedding of Health Center into other applications 15

16 Health Center Health Center provides visualization and monitoring in the following application areas: Method profiling Lock analysis Garbage Collection Threading Memory Usage System environment Java class loading Object Allocations File I/O 16


17 Health Center - Installation The tool is provided in two parts: An Agent that collects data from a running application An Eclipse-based client that connects to the agent The Agent ships with the following vm s: Java 5sr9 and upwards Java 6sr3 and upwards The latest version of the agent is always available from within the Health Center Client Recommended to always update to the latest version of the agent Agent package unzips over the jre directory of the JVM you are using 17

18 Health Center - Enable for Monitoring Full instructions are provided within the help shipped with the Health Center Client but in most cases as simple as: For Java 5 SR10 and later or Java 6 SR5 and later, including Java 7 (can be used in production) java Xhealthcenter HelloWorld For Java 5 SR9 and earlier, or Java 6 SR4 and earlier (not recommended for use in a production environment) java agentlib:healthcenter Xtrace:output=healthcenter.out HelloWorld 18
 java agentlib:healthcenter Xtrace:output=healthcenter.")
19 Health Center Advanced Options Headless mode for data collection without connecting the GUI Useful for scenarios where firewall blocks connection Configurable to limit disk space used Timed collections Interval based collections Started with -Xhealthcenter:level=headless Late attach enabled Automated javacore creation 19

20 Health Center API The 2.2 release of Health Center contains a powerful API that allows Java developers to embed Health Center in their applications and harness its monitoring power to troubleshoot problems Example: // Create the connection object: ConnectionProperties conn1 = new ConnectionProperties("localhost", 1973); // Connect to the Health Center agent, using the previous connection settings: HealthCenter hcobject = HealthCenterFactory.connect(conn1, true); // Get garbage collection data and print: GCData gcdata = hcobject.getgcdata(); System.out.println("GC Mode is " + gcdata.getgcmode().tostring()); 20

21 Health Center DEMO 21

22 Health Center Environment reporting Detects invalid Java options Detects options which may hurt performance or serviceability Useful for remote diagnosis of configuration-related problems Garbage Collection visualization Visualizes heap usage and gc pause times over time Identifies memory leaks Suggests command-line and tuning parameters Same recommendation logic as GCMV 22

23 Health Center Class loading visualization Shows all loaded classes Shows load time Identifies shared classes Live class histogram information CPU usage Visualizes overall system CPU use as well as application process use 23

24 Health Center I/O Monitor application file open/close events as they occur Lists currently open files Native Memory Detect native memory leaks in application Determine if external forces are using more memory Memory counters showing which parts of the JVM are using the most native memory 24

25 Health Center Method Profiling Always-on profiling offers insight into application activity Identifies the hottest methods in an application Full call stacks to identify where methods are being called from and what methods they call No byte code instrumentation, no recompiling Java Lock analysis Always-on lock monitoring Quickly allows the usage of all locks to be profiled Helps to identify points of contention in the application that are preventing scaling 25

26 Health Center Threads view List of current threads and states Deadlock detection and analysis Number of threads over time See contended monitors Live control of application Trigger dumps Enable verbosegc collection 26
27 Agenda IBM Monitoring and Diagnostic Tools for Java Why use the tools? Where to get the tools? IBM Recommended Java Troubleshooting Tools Health Center Garbage Collector and Memory Visualizer (GCMV) Memory Analyzer Summary 27
28 Garbage Collector and Memory Visualizer (GCMV) Motivating questions: How is the GC behaving? Can I do better? How much time is GC taking? How much free memory does my JVM have? Overview 28 Analyze Java verbose GC logs, providing insight into application behaviour Uses ps -p $PID -o pid,vsz,rss output to plot native footprint Visualize a wide range of GC data and Java heap statistics over time Provides the ability to detect memory leaks and optimized GC Recommendations use heuristics to guide you towards GC performance tuning
 Views of GCMV")
29 Garbage Collector and Memory Visualizer (GCMV) Views of GCMV 29
30 Garbage Collector and Memory Visualizer (GCMV) Graphical Display of Data Allows graphing of all available data: pause times, heap size etc Allows zoom, cropping and change of axes value and units Allows comparison of multiple files Analysis and Recommendations Provides tuning recommendations based on data and flags errors. Analysis can be limited using cropping. Values and units used in analysis can be changed by changing axes values and units 30
31 Agenda IBM Monitoring and Diagnostic Tools for Java Why use the tools? Where to get the tools? IBM Recommended Java Troubleshooting Tools Health Center Garbage Collector and Memory Visualizer Memory Analyzer Summary 31
32 Java Monitring and Diagnostic Tooling Memory Analyzer Motivating questions: Why did I run out of Java memory? What s in my Java heap? How can I explore it and get new insights? Overview Tool for analyzing heap dumps and identifying memory leaks from JVMs Works with IBM system dumps, heapdumps and Sun HPROF binary dumps Provides memory leak detection, footprint analysis: Objects by Class, Dominator Tree Analysis, Path to GC Roots, Dominator Tree by Class Loader Shows areas of memory wastage: Collections, duplicate strings, substring/char arrays, constant value primitives Displays Stack trace with object references Provides SQL like object query language (OQL) Provides extension points to write analysis plugins 32

33 Memory Analyzer Overview: Overview of the heapdump including size and total number of objects. Provides links to continued analysis Path to GC Roots: Provides the reference chain that prevents an object being garbage collected Dominator Tree grouped by Class Loader: Lists the biggest objects using a keep alive tree Grouping by Class Loader limits the analysis to a single application in a JEE environment 33
34 Agenda IBM Monitoring and Diagnostic Tools for Java Why use the tools? Where to get the tools? IBM Recommended Java Troubleshooting Tools Health Center Garbage Collector and Memory Visualizer Memory Analyzer Summary 34

35 Problem Scenarios and Tools 35
36 Iris Baron 36

37 Copyright IBM Corporation All rights reserved. The information contained in these materials is provided for informational purposes only, and is provided AS IS without warranty of any kind, express or implied. IBM shall not be responsible for any damages arising out of the use of, or otherwise related to, these materials. Nothing contained in these materials is intended to, nor shall have the effect of, creating any warranties or representations from IBM or its suppliers or licensors, or altering the terms and conditions of the applicable license agreement governing the use of IBM software. References in these materials to IBM products, programs, or services do not imply that they will be available in all countries in which IBM operates. Product release dates and/or capabilities referenced in these materials may change at any time at IBM s sole discretion based on market opportunities or other factors, and are not intended to be a commitment to future product or feature availability in any way. IBM, the IBM logo, Rational, the Rational logo, Telelogic, the Telelogic logo, and other IBM products and services are trademarks of the International Business Machines Corporation, in the United States, other countries or both. Other company, product, or service names may be trademarks or service marks of others. 37
38 Where to find more information Documentation zos SDK System z Linux SDK Java Tuning documentation search_by=java+technology+ibm+style: IBM Support Assistant IBM Monitoring and Diagnostic Tools for JavaTM Health Center API articles Monitor a Java application with the Health Center API parts 1 and
Java VM monitoring and the Health Center API. William Smith [email protected]
 Java VM monitoring and the Health Center API William Smith [email protected] Health Center overview What problem am I solving? What is my JVM doing? Is everything OK? Why is my application running
Debug 101-Using ISA Tools for Apps in WebSphere Application Server z/os
 Debug 101-Using ISA Tools for Apps in WebSphere Application Server z/os Session 16509 Mike Stephen - [email protected] Joran Siu [email protected] IBM Insert Custom Session QR if Desired. Disclaimer
THE BUSY DEVELOPER'S GUIDE TO JVM TROUBLESHOOTING
 THE BUSY DEVELOPER'S GUIDE TO JVM TROUBLESHOOTING November 5, 2010 Rohit Kelapure HTTP://WWW.LINKEDIN.COM/IN/ROHITKELAPURE HTTP://TWITTER.COM/RKELA Agenda 2 Application Server component overview Support
Tool - 1: Health Center
 Tool - 1: Health Center Joseph Amrith Raj http://facebook.com/webspherelibrary 2 Tool - 1: Health Center Table of Contents WebSphere Application Server Troubleshooting... Error! Bookmark not defined. About
Practical Performance Understanding the Performance of Your Application
 Neil Masson IBM Java Service Technical Lead 25 th September 2012 Practical Performance Understanding the Performance of Your Application 1 WebSphere User Group: Practical Performance Understand the Performance
How To Improve Performance On An Asa 9.4 Web Application Server (For Advanced Users)
") Paper SAS315-2014 SAS 9.4 Web Application Performance: Monitoring, Tuning, Scaling, and Troubleshooting Rob Sioss, SAS Institute Inc., Cary, NC ABSTRACT SAS 9.4 introduces several new software products
Paper SAS315-2014 SAS 9.4 Web Application Performance: Monitoring, Tuning, Scaling, and Troubleshooting Rob Sioss, SAS Institute Inc., Cary, NC ABSTRACT SAS 9.4 introduces several new software products
Tuning WebSphere Application Server ND 7.0. Royal Cyber Inc.
 Tuning WebSphere Application Server ND 7.0 Royal Cyber Inc. JVM related problems Application server stops responding Server crash Hung process Out of memory condition Performance degradation Check if the
Oracle JRockit Mission Control Overview
 Oracle JRockit Mission Control Overview An Oracle White Paper June 2008 JROCKIT Oracle JRockit Mission Control Overview Oracle JRockit Mission Control Overview...3 Introduction...3 Non-intrusive profiling
Holly Cummins IBM Hursley Labs. Java performance not so scary after all
 Holly Cummins IBM Hursley Labs Java performance not so scary after all So... You have a performance problem. What next? Goals After this talk you will: Not feel abject terror when confronted with a performance
What s Cool in the SAP JVM (CON3243)
") What s Cool in the SAP JVM (CON3243) Volker Simonis, SAP SE September, 2014 Public Agenda SAP JVM Supportability SAP JVM Profiler SAP JVM Debugger 2014 SAP SE. All rights reserved. Public 2 SAP JVM SAP
What s Cool in the SAP JVM (CON3243) Volker Simonis, SAP SE September, 2014 Public Agenda SAP JVM Supportability SAP JVM Profiler SAP JVM Debugger 2014 SAP SE. All rights reserved. Public 2 SAP JVM SAP
An Oracle White Paper September 2013. Advanced Java Diagnostics and Monitoring Without Performance Overhead
 An Oracle White Paper September 2013 Advanced Java Diagnostics and Monitoring Without Performance Overhead Introduction... 1 Non-Intrusive Profiling and Diagnostics... 2 JMX Console... 2 Java Flight Recorder...
IBM Software Group. SW5706 JVM Tools. 2007 IBM Corporation 4.0. This presentation will act as an introduction to JVM tools.
 SW5706 JVM Tools This presentation will act as an introduction to. 4.0 Page 1 of 15 for tuning and problem detection After completing this topic, you should be able to: Describe the main tools used for
A Practical Method to Diagnose Memory Leaks in Java Application Alan Yu
 A Practical Method to Diagnose Memory Leaks in Java Application Alan Yu 1. Introduction The Java virtual machine s heap stores all objects created by a running Java application. Objects are created by
IBM Support Assistant v5. Review and hands-on by Joseph
 IBM Support Assistant v5 Review and hands-on by Joseph What's new in v5 This new version is built on top of WebSphere application server community edition. It gives more flexible configurations Intuitive
BEAJRockit Mission Control. Using JRockit Mission Control in the Eclipse IDE
 BEAJRockit Mission Control Using JRockit Mission Control in the Eclipse IDE Mission Control 3.0.2 Document Revised: June, 2008 Contents 1. Introduction Benefits of the Integration................................................
IBM Tivoli Composite Application Manager for WebSphere
 Meet the challenges of managing composite applications IBM Tivoli Composite Application Manager for WebSphere Highlights Simplify management throughout the life cycle of complex IBM WebSphere-based J2EE
WebSphere Architect (Performance and Monitoring) 2011 IBM Corporation
 2011 IBM Corporation") Track Name: Application Infrastructure Topic : WebSphere Application Server Top 10 Performance Tuning Recommendations. Presenter Name : Vishal A Charegaonkar WebSphere Architect (Performance and Monitoring)
Track Name: Application Infrastructure Topic : WebSphere Application Server Top 10 Performance Tuning Recommendations. Presenter Name : Vishal A Charegaonkar WebSphere Architect (Performance and Monitoring)
Using jvmstat and visualgc to Solve Memory Management Problems
 Using jvmstat and visualgc to Solve Memory Management Problems java.sun.com/javaone/sf 1 Wally Wedel Sun Software Services Brian Doherty Sun Microsystems, Inc. Analyze JVM Machine Memory Management Problems
HeapStats: Your Dependable Helper for Java Applications, from Development to Operation
 : Technologies for Promoting Use of Open Source Software that Contribute to Reducing TCO of IT Platform HeapStats: Your Dependable Helper for Java Applications, from Development to Operation Shinji Takao,
IBM SDK, Java Technology Edition Version 1. IBM JVM messages IBM
 IBM SDK, Java Technology Edition Version 1 IBM JVM messages IBM IBM SDK, Java Technology Edition Version 1 IBM JVM messages IBM Note Before you use this information and the product it supports, read the
How to use IBM HeapAnalyzer to diagnose Java heap issues
 IBM Software Group How to use IBM HeapAnalyzer to diagnose Java heap issues Jinwoo Hwang ([email protected]) IBM HeapAnalyzer Architect/Developer WebSphere Support Technical Exchange Introduction Java
Outline: ISA Tools for WebSphere Comments: on z/os
 Introducing the IBM Support Assistant (ISA) for WebSphere on z/os John Hutchinson IBM Washington Systems Center Share 115 Boston, August, 2010 1 Outline: ISA Tools for WebSphere Comments: on z/os Many
Instrumentation Software Profiling
 Instrumentation Software Profiling Software Profiling Instrumentation of a program so that data related to runtime performance (e.g execution time, memory usage) is gathered for one or more pieces of the
THE BUSY JAVA DEVELOPER'S GUIDE TO WEBSPHERE DEBUGGING & TROUBLESHOOTING
 THE BUSY JAVA DEVELOPER'S GUIDE TO WEBSPHERE DEBUGGING & TROUBLESHOOTING ROHIT KELAPURE IBM ADVISORY SOFTWARE ENGINEER HTTP://WWW.LINKEDIN.COM/IN/ROHITKELAPURE HTTP://TWITTER.COM/RKELA HTTP://WASDYNACACHE.BLOGSPOT.COM/
Java Garbage Collection Basics
 Java Garbage Collection Basics Overview Purpose This tutorial covers the basics of how Garbage Collection works with the Hotspot JVM. Once you have learned how the garbage collector functions, learn how
Development Environment and Tools for Java. Brian Hughes IBM
 Development Environment and Tools for Java Brian Hughes IBM 1 Acknowledgements and Disclaimers Availability. References in this presentation to IBM products, programs, or services do not imply that they
Production time profiling On-Demand with Java Flight Recorder
 Production time profiling On-Demand with Java Flight Recorder Using Java Mission Control & Java Flight Recorder Klara Ward Principal Software Developer Java Platform Group, Oracle Copyright 2015, Oracle
Java Troubleshooting and Performance
 Java Troubleshooting and Performance Margus Pala Java Fundamentals 08.12.2014 Agenda Debugger Thread dumps Memory dumps Crash dumps Tools/profilers Rules of (performance) optimization 1. Don't optimize
Trace-Based and Sample-Based Profiling in Rational Application Developer
 Trace-Based and Sample-Based Profiling in Rational Application Developer This document is aimed at highlighting the importance of profiling in software development and talks about the profiling tools offered
TDA - Thread Dump Analyzer
 TDA - Thread Dump Analyzer TDA - Thread Dump Analyzer Published September, 2008 Copyright 2006-2008 Ingo Rockel Table of Contents 1.... 1 1.1. Request Thread Dumps... 2 1.2. Thread
Effective Java Programming. measurement as the basis
 Effective Java Programming measurement as the basis Structure measurement as the basis benchmarking micro macro profiling why you should do this? profiling tools Motto "We should forget about small efficiencies,
Advanced Performance Forensics
 Advanced Performance Forensics Uncovering the Mysteries of Performance and Scalability Incidents through Forensic Engineering Stephen Feldman Senior Director Performance Engineering and Architecture [email protected]
WAS Performance on i5/os. Lisa Wellman [email protected] May 2010
 WAS Performance on i5/os Lisa Wellman [email protected] May 2010 A simplified view: major WAS functions widely used Administered Java runtime environment HTTP request routing Web container Web thread pool
IBM Tivoli Composite Application Manager for WebSphere
 Meet the challenges of managing composite applications IBM Tivoli Composite Application Manager for WebSphere Highlights Simplify management throughout the Create reports that deliver insight into life
Enterprise Manager Performance Tips
 Enterprise Manager Performance Tips + The tips below are related to common situations customers experience when their Enterprise Manager(s) are not performing consistent with performance goals. If you
Jonathan Worthington Scarborough Linux User Group
 Jonathan Worthington Scarborough Linux User Group Introduction What does a Virtual Machine do? Hides away the details of the hardware platform and operating system. Defines a common set of instructions.
IBM RATIONAL PERFORMANCE TESTER
 IBM RATIONAL PERFORMANCE TESTER Today, a major portion of newly developed enterprise applications is based on Internet connectivity of a geographically distributed work force that all need on-line access
Monitoring applications in multitier environment. Uroš Majcen [email protected]. A New View on Application Management. www.quest.
 A New View on Application Management www.quest.com/newview Monitoring applications in multitier environment Uroš Majcen [email protected] 2008 Quest Software, Inc. ALL RIGHTS RESERVED. Management Challenges
IBM WebSphere Server Administration
 IBM WebSphere Server Administration This course teaches the administration and deployment of web applications in the IBM WebSphere Application Server. Duration 24 hours Course Objectives Upon completion
Performance Best Practices Guide for SAP NetWeaver Portal 7.3
 SAP NetWeaver Best Practices Guide Performance Best Practices Guide for SAP NetWeaver Portal 7.3 Applicable Releases: SAP NetWeaver 7.3 Document Version 1.0 June 2012 Copyright 2012 SAP AG. All rights
2 2011 Oracle Corporation Proprietary and Confidential
 The following is intended to outline our general product direction. It is intended for information purposes only, and may not be incorporated into any contract. It is not a commitment to deliver any material,
How To Manage An Sap Solution
 ... Foreword... 17... Acknowledgments... 19... Introduction... 21 1... Performance Management of an SAP Solution... 33 1.1... SAP Solution Architecture... 34 1.1.1... SAP Solutions and SAP Components...
Profiling and Testing with Test and Performance Tools Platform (TPTP)
") Profiling and Testing with Test and Performance Tools Platform (TPTP) 2009 IBM Corporation and Intel Corporation; made available under the EPL v1.0 March, 2009 Speakers Eugene Chan IBM Canada [email protected]
Profiling and Testing with Test and Performance Tools Platform (TPTP) 2009 IBM Corporation and Intel Corporation; made available under the EPL v1.0 March, 2009 Speakers Eugene Chan IBM Canada [email protected]
Course Description. Course Audience. Course Outline. Course Page - Page 1 of 5
 Course Page - Page 1 of 5 WebSphere Application Server 7.0 Administration on Windows BSP-1700 Length: 5 days Price: $ 2,895.00 Course Description This course teaches the basics of the administration and
<Insert Picture Here> Java, the language for the future
 1 Java, the language for the future Adam Messinger Vice President of Development The following is intended to outline our general product direction. It is intended for information
Mobile Performance Management Tools Prasanna Gawade, Infosys April 2014
 Mobile Performance Management Tools Prasanna Gawade, Infosys April 2014 Computer Measurement Group, India 1 Contents Introduction Mobile Performance Optimization Developer Tools Purpose and Overview Mobile
Performance Improvement In Java Application
 Performance Improvement In Java Application Megha Fulfagar Accenture Delivery Center for Technology in India Accenture, its logo, and High Performance Delivered are trademarks of Accenture. Agenda Performance
WebSphere Server Administration Course
 WebSphere Server Administration Course Chapter 1. Java EE and WebSphere Overview Goals of Enterprise Applications What is Java? What is Java EE? The Java EE Specifications Role of Application Server What
Lunch and Learn: BlueMix to Mainframe making development accessible in the
 Lunch and Learn: BlueMix to Mainframe making development accessible in the Cloud Rosalind Radcliffe IBM Distinguished Engineer, IBM Academy of Technology [email protected] @RosalindRad Insert Custom
Monitoring, Tracing, Debugging (Under Construction)
") Monitoring, Tracing, Debugging (Under Construction) I was already tempted to drop this topic from my lecture on operating systems when I found Stephan Siemen's article "Top Speed" in Linux World 10/2003.
Monitoring, Tracing, Debugging (Under Construction) I was already tempted to drop this topic from my lecture on operating systems when I found Stephan Siemen's article "Top Speed" in Linux World 10/2003.
11.1 inspectit. 11.1. inspectit
 11.1. inspectit Figure 11.1. Overview on the inspectit components [Siegl and Bouillet 2011] 11.1 inspectit The inspectit monitoring tool (website: http://www.inspectit.eu/) has been developed by NovaTec.
A technical guide for monitoring Adobe LiveCycle ES deployments
 Technical Guide A technical guide for monitoring Adobe LiveCycle ES deployments Table of contents 1 Section 1: LiveCycle ES system monitoring 4 Section 2: Internal LiveCycle ES monitoring 5 Section 3:
WebSphere Application Server V6: Diagnostic Data. It includes information about the following: JVM logs (SystemOut and SystemErr)
") Redbooks Paper WebSphere Application Server V6: Diagnostic Data Carla Sadtler David Titzler This paper contains information about the diagnostic data that is available in WebSphere Application Server V6.
Redbooks Paper WebSphere Application Server V6: Diagnostic Data Carla Sadtler David Titzler This paper contains information about the diagnostic data that is available in WebSphere Application Server V6.
MDM Multidomain Edition (Version 9.6.0) For Microsoft SQL Server Performance Tuning
 For Microsoft SQL Server Performance Tuning") MDM Multidomain Edition (Version 9.6.0) For Microsoft SQL Server Performance Tuning 2014 Informatica Corporation. No part of this document may be reproduced or transmitted in any form, by any means (electronic,
MDM Multidomain Edition (Version 9.6.0) For Microsoft SQL Server Performance Tuning 2014 Informatica Corporation. No part of this document may be reproduced or transmitted in any form, by any means (electronic,
Troubleshoot the JVM like never before. JVM Troubleshooting Guide. Pierre-Hugues Charbonneau Ilias Tsagklis
 Troubleshoot the JVM like never before JVM Troubleshooting Guide Pierre-Hugues Charbonneau Ilias Tsagklis Table of Contents Oracle HotSpot JVM Memory...3 Java HotSpot VM Heap space...3 Java HotSpot VM
Manage your IT Resources with IBM Capacity Management Analytics (CMA)
") Manage your IT Resources with IBM Capacity Management Analytics (CMA) New England Users Group (NEDB2UG) Meeting Sturbridge, Massachusetts, USA, http://www.nedb2ug.org November 19, 2015 Milan Babiak Technical
Manage your IT Resources with IBM Capacity Management Analytics (CMA) New England Users Group (NEDB2UG) Meeting Sturbridge, Massachusetts, USA, http://www.nedb2ug.org November 19, 2015 Milan Babiak Technical
Java Mission Control
 Java Mission Control Harald Bräuning Resources Main Resource: Java Mission Control Tutorial by Marcus Hirt http://hirt.se/downloads/oracle/jmc_tutorial.zip includes sample projects! Local copy: /common/fesa/jmcexamples/jmc_tutorial.zip
JBoss Cookbook: Secret Recipes. David Chia Senior TAM, JBoss May 5 th 2011
 JBoss Cookbook: Secret Recipes David Chia Senior TAM, JBoss May 5 th 2011 Secret Recipes Byteman Cluster and Load Balancing Configuration Generator Troubleshooting High CPU Mocking a JBoss Hang State Byte
JVM Performance Study Comparing Oracle HotSpot and Azul Zing Using Apache Cassandra
 JVM Performance Study Comparing Oracle HotSpot and Azul Zing Using Apache Cassandra January 2014 Legal Notices Apache Cassandra, Spark and Solr and their respective logos are trademarks or registered trademarks
IBM Software Services for Lotus Consulting Education Accelerated Value Program. Log Files. 2009 IBM Corporation
 Log Files 2009 IBM Corporation Goals Understand where to find log files Understand the purpose of various log files Components and log files Look at logs, starting with the most likely component Review
Fachbereich Informatik und Elektrotechnik SunSPOT. Ubiquitous Computing. Ubiquitous Computing, Helmut Dispert
 Ubiquitous Computing Ubiquitous Computing The Sensor Network System Sun SPOT: The Sun Small Programmable Object Technology Technology-Based Wireless Sensor Networks a Java Platform for Developing Applications
Rational Asset Manager 7.2 Editions and Licensing
 Rational Asset Manager 7.2 Editions and Licensing Derek D. Baron, [email protected] Product Manager, Rational Asset Manager 2009 IBM Corporation IBM Corporation 200 The information contained in this presentation
Java Debugging Ľuboš Koščo
 Java Debugging Ľuboš Koščo Solaris RPE Prague Agenda Debugging - the core of solving problems with your application Methodologies and useful processes, best practices Introduction to debugging tools >
<Insert Picture Here> Java Application Diagnostic Expert
 Java Application Diagnostic Expert Agenda 1. Enterprise Manager 2. Challenges 3. Java Application Diagnostics Expert (JADE) 4. Feature-Benefit Summary 5. Features Overview Diagnostic
Java Monitoring. Stuff You Can Get For Free (And Stuff You Can t) Paul Jasek Sales Engineer
 Paul Jasek Sales Engineer") Java Monitoring Stuff You Can Get For Free (And Stuff You Can t) Paul Jasek Sales Engineer A Bit About Me Current: Past: Pre-Sales Engineer (1997 present) WaveMaker Wily Persistence GemStone Application
Java Monitoring Stuff You Can Get For Free (And Stuff You Can t) Paul Jasek Sales Engineer A Bit About Me Current: Past: Pre-Sales Engineer (1997 present) WaveMaker Wily Persistence GemStone Application
JBoss Data Grid Performance Study Comparing Java HotSpot to Azul Zing
 JBoss Data Grid Performance Study Comparing Java HotSpot to Azul Zing January 2014 Legal Notices JBoss, Red Hat and their respective logos are trademarks or registered trademarks of Red Hat, Inc. Azul
Chapter 3 Operating-System Structures
 Contents 1. Introduction 2. Computer-System Structures 3. Operating-System Structures 4. Processes 5. Threads 6. CPU Scheduling 7. Process Synchronization 8. Deadlocks 9. Memory Management 10. Virtual
A closer look at HP LoadRunner software
 Technical white paper A closer look at HP LoadRunner software Table of contents Sizing up the system 2 The limits of manual testing 2 A new take on testing: the HP LoadRunner solution 3 The HP LoadRunner
OpenProdoc. Benchmarking the ECM OpenProdoc v 0.8. Managing more than 200.000 documents/hour in a SOHO installation. February 2013
 OpenProdoc Benchmarking the ECM OpenProdoc v 0.8. Managing more than 200.000 documents/hour in a SOHO installation. February 2013 1 Index Introduction Objectives Description of OpenProdoc Test Criteria
Java on z/os. Agenda. Java runtime environments on z/os. Java SDK 5 and 6. Java System Resource Integration. Java Backend Integration
 Martina Schmidt [email protected] Agenda Java runtime environments on z/os Java SDK 5 and 6 Java System Resource Integration Java Backend Integration Java development for z/os 4 1 Java runtime
IBM Rational Asset Manager
 Providing business intelligence for your software assets IBM Rational Asset Manager Highlights A collaborative software development asset management solution, IBM Enabling effective asset management Rational
ARM-BASED PERFORMANCE MONITORING FOR THE ECLIPSE PLATFORM
 ARM-BASED PERFORMANCE MONITORING FOR THE ECLIPSE PLATFORM Ashish Patel, Lead Eclipse Committer for ARM, IBM Corporation Oliver E. Cole, President, OC Systems, Inc. The Eclipse Test and Performance Tools
Using and Extending the Test and Performance Tools Platform (TPTP)
") Tutorial #2 Using and Extending the Test and Performance Tools Platform (TPTP) Eugene Chan IBM Rational Software Paul Slauenwhite IBM Rational Software 2005 IBM Corp; made available under the EPL v1.0
Tutorial #2 Using and Extending the Test and Performance Tools Platform (TPTP) Eugene Chan IBM Rational Software Paul Slauenwhite IBM Rational Software 2005 IBM Corp; made available under the EPL v1.0
Garbage Collection in the Java HotSpot Virtual Machine
 http://www.devx.com Printed from http://www.devx.com/java/article/21977/1954 Garbage Collection in the Java HotSpot Virtual Machine Gain a better understanding of how garbage collection in the Java HotSpot
Converting Java EE Applications into OSGi Applications
 Converting Java EE Applications into OSGi Applications Author: Nichole Stewart Date: Jan 27, 2011 2010 IBM Corporation THE INFORMATION CONTAINED IN THIS REPORT IS PROVIDED FOR INFORMATIONAL PURPOSES ONLY.
IBM Support Assistant Simplified Problem Determination
 IBM Support Assistant Simplified Problem Determination Michael Stephen IBM August 13,2013 Session Number 13640 Insert Custom Session QR if Desired. Trademarks The following are trademarks of the International
Using computing resources with IBM ILOG CPLEX CO@W2015
 CPLEX Optimization IBM Germany 2015-10-06 Using computing resources with IBM ILOG CPLEX CO@W2015 Hardware resources Multiple cores/threads Multiple machines No machines Software resources Interfacing with
WebSphere Performance Monitoring & Tuning For Webtop Version 5.3 on WebSphere 5.1.x
 Frequently Asked Questions WebSphere Performance Monitoring & Tuning For Webtop Version 5.3 on WebSphere 5.1.x FAQ Version 1.0 External FAQ1. Q. How do I monitor Webtop performance in WebSphere? 1 Enabling
Virtualization and the U2 Databases
 Virtualization and the U2 Databases Brian Kupzyk Senior Technical Support Engineer for Rocket U2 Nik Kesic Lead Technical Support for Rocket U2 Opening Procedure Orange arrow allows you to manipulate the
Online Transaction Processing in SQL Server 2008
 Online Transaction Processing in SQL Server 2008 White Paper Published: August 2007 Updated: July 2008 Summary: Microsoft SQL Server 2008 provides a database platform that is optimized for today s applications,
Version 14.0. Overview. Business value
 PRODUCT SHEET CA Datacom Server CA Datacom Server Version 14.0 CA Datacom Server provides web applications and other distributed applications with open access to CA Datacom /DB Version 14.0 data by providing
Performance Monitoring and Tuning. Liferay Chicago User Group (LCHIUG) James Lefeu 29AUG2013
 James Lefeu 29AUG2013") Performance Monitoring and Tuning Liferay Chicago User Group (LCHIUG) James Lefeu 29AUG2013 Outline I. Definitions II. Architecture III.Requirements and Design IV.JDK Tuning V. Liferay Tuning VI.Profiling
Performance Monitoring and Tuning Liferay Chicago User Group (LCHIUG) James Lefeu 29AUG2013 Outline I. Definitions II. Architecture III.Requirements and Design IV.JDK Tuning V. Liferay Tuning VI.Profiling
Data Sheet VISUAL COBOL 2.2.1 WHAT S NEW? COBOL JVM. Java Application Servers. Web Tools Platform PERFORMANCE. Web Services and JSP Tutorials
 Visual COBOL is the industry leading solution for COBOL application development and deployment on Windows, Unix and Linux systems. It combines best in class development tooling within Eclipse and Visual
Developing in the Cloud Environment. Rosalind Radcliffe IBM Distinguished Engineer, IBM Academy of Technology [email protected].
 Developing in the Cloud Environment Rosalind Radcliffe IBM Distinguished Engineer, IBM Academy of Technology [email protected] @RosalindRad Organizations are combining on-premise, off-premise and public
Justin Bruns, Performance Test Lead, Fireman's Fund Insurance Robert May, Enterprise Software Tools Administrator Fireman's Fund Insurance
 Justin Bruns, Performance Test Lead, Fireman's Fund Insurance Robert May, Enterprise Software Tools Administrator Fireman's Fund Insurance Copyright 2012 Hewlett-Packard Development Company, L.P. The information
SQL Server 2008 Performance and Scale
 SQL Server 2008 Performance and Scale White Paper Published: February 2008 Updated: July 2008 Summary: Microsoft SQL Server 2008 incorporates the tools and technologies that are necessary to implement
2015 ej-technologies GmbH. All rights reserved. JProfiler Manual
 2015 ej-technologies GmbH. All rights reserved. JProfiler Manual Index JProfiler help... 8 How to order... 9 A Help topics... 10 A.1 Profiling... 10 A.1.1 Profiling modes... 10 A.1.2 Remote profiling...
Zing Vision. Answering your toughest production Java performance questions
 Zing Vision Answering your toughest production Java performance questions Outline What is Zing Vision? Where does Zing Vision fit in your Java environment? Key features How it works Using ZVRobot Q & A
z/vm and Linux on zseries Performance Monitoring An Update on How and With What Products
 Tivoli Software z/vm and Linux on zseries Performance Monitoring An Update on How and With What Products Laura Knapp [email protected] August 2006 2006 IBM Corporation Agenda Opportunity New work loads
TIBCO ActiveMatrix BusinessWorks Plug-in for TIBCO Managed File Transfer Software Installation
 TIBCO ActiveMatrix BusinessWorks Plug-in for TIBCO Managed File Transfer Software Installation Software Release 6.0 November 2015 Two-Second Advantage 2 Important Information SOME TIBCO SOFTWARE EMBEDS
Tuning Your GlassFish Performance Tips. Deep Singh Enterprise Java Performance Team Sun Microsystems, Inc.
 Tuning Your GlassFish Performance Tips Deep Singh Enterprise Java Performance Team Sun Microsystems, Inc. 1 Presentation Goal Learn tips and techniques on how to improve performance of GlassFish Application
Monitoring and Managing a JVM
 Monitoring and Managing a JVM Erik Brakkee & Peter van den Berkmortel Overview About Axxerion Challenges and example Troubleshooting Memory management Tooling Best practices Conclusion About Axxerion Axxerion
Need a Support Assistant? Check Out IBMs - ISA
 Need a Support Assistant? Check Out IBMs - ISA Michael Stephen IBM Thursday, March 13, 2014 Session # 14709 WebSphere Application Server on System Z Session Title Time Room Speaker 14618 Getting Started
NetBeans Profiler is an
 NetBeans Profiler Exploring the NetBeans Profiler From Installation to a Practical Profiling Example* Gregg Sporar* NetBeans Profiler is an optional feature of the NetBeans IDE. It is a powerful tool that
Monitoring HP OO 10. Overview. Available Tools. HP OO Community Guides
 HP OO Community Guides Monitoring HP OO 10 This document describes the specifications of components we want to monitor, and the means to monitor them, in order to achieve effective monitoring of HP Operations
Eclipse Visualization and Performance Monitoring
 Eclipse Visualization and Performance Monitoring Chris Laffra IBM Ottawa Labs http://eclipsefaq.org/chris Chris Laffra Eclipse Visualization and Performance Monitoring Page 1 Roadmap Introduction Introspection
IBM Rational Web Developer for WebSphere Software Version 6.0
 Rapidly build, test and deploy Web, Web services and Java applications with an IDE that is easy to learn and use IBM Rational Web Developer for WebSphere Software Version 6.0 Highlights Accelerate Web,
Enhanced Diagnostics Improve Performance, Configurability, and Usability
 Application Note Enhanced Diagnostics Improve Performance, Configurability, and Usability Improved Capabilities Available for Dialogic System Release Software Application Note Enhanced Diagnostics Improve