How To Test For Toxicant Effects On A Pps Brine
|
|
|
- Duane McDowell
- 3 years ago
- Views:
Transcription
1 Bay Area Regional Desalination Pilot Plant Pilot Plant Report APPENDIX G Concentrate Toxicity Testing Prepared by MWH G-1 June 2010
2 Bay Area Regional Desalination Project Pilot Study Subject: Prepared by: Brine Toxicity Testing Results BEB/JAJ/DDH; Applied Marine Sciences, Inc. Reference: Reviewed by: JAJ-AMS; COB-MWH Date: November 2009 The Bay Area s four largest water agencies, the Contra Costa Water District (CCWD), the East Bay Municipal Utility District (EBMUD), the San Francisco Public Utilities Commission (SFPUC), and the Santa Clara Valley Water District (SCVWD), are jointly exploring a regional desalination project that could provide the region an additional water source, diversify the area s water supply, and foster long-term regional sustainability. The Bay Area Regional Desalination project (RDP) could consist of one or more desalination facilities, with an ultimate total capacity of up to 65 million gallons per day. The RDP tested the operation and maintenance of a joint desalination facility on a pilot scale. The Pilot Plant Study (PPS) was located at CCWD s Mallard Slough Pumping Plant site near Pittsburg, CA, adjacent to the San Francisco Bay Estuary in Suisun Bay. The PPS operated between October 2008 and March 2009, in order to capture both wet and dry season conditions. Water from Mallard Slough underwent microfiltration pretreatment and then reverse osmosis (RO) treatment to produce potable water at the PPS. The PPS then blended the permeate with the backwash and brine/reject streams for subsequent discharge into the CCWD water treatment facility. One of the major potential issues associated with RO operations in the Delta is the discharge of the RO brine, backwash, and reject streams back into the Delta. The potential toxic effects of brine on local organisms involve both increased concentrations of ions (e.g., salinity or total dissolved solids) as well as more concentrated contaminants from the source water (e.g., pesticides or heavy metals). Identifying whether any toxicity effects of the brine are due to salinity or contaminants is necessary to determine the operational solutions needed to minimize them. This Technical Memorandum describes the results of tests that were conducted to: (1) assess the potential toxicity of brine produced by the PPS desalination plant, and (2) differentiate toxicity sources (i.e., salinity or contaminants). 1.0 Brine Toxicity Testing Approach The desalination process concentrates both salts and contaminants in the brine effluent, which are potentially toxic to aquatic organisms living in the Delta. Thus, brine toxicity at the PPS location is susceptible to two potential influences that affect the source water: (1) seawater 1
3 Bay Area Regional Desalination Project Brine Toxicity Testing Results Pilot Study November 2009 salinity, due to the PPS s proximity to Suisun Bay, and (2) the concentration of contaminants washed off the surrounding land by storm runoff and transported via Delta outflow. Testing the PPS brine focused on evaluating its potential toxicity to several test organisms during extremes in salinity and contaminant input for the source water, which typically occur during the dry and wet seasons of the year. Dry season conditions represent the period of highest ambient salinities, whereas wet season conditions represent highest contaminant concentrations associated with storm runoff. Assessing the toxicity of brine produced during both extremes was intended to differentiate the separate effects. As a QA measure, a positive control test (i.e., reference toxicant test) was conducted concurrently with the salinity and brine toxicity testing to assess the sensitivity of each test organism to toxic stress. 2.0 Objectives The objectives of the brine toxicity testing were to: Sample brine from the PPS during a dry period (high salinity, low contaminant concentration) and a wet period (low salinity, high contaminant concentration). Assess algal growth toxicity with the diatom Thalassiosira pseudonana Assess survival and growth toxicity with the crustacean Americamysis bahia Assess survival and growth toxicity with the fish Menidia beryllina 3.0 Methods 3.1 Sampling Methods Samples of brine were collected from the PPS facility on November 14, 2008 and February 25, The November sample was expected to be representative of dry conditions, with elevated salinity and reduced contaminants. It was collected during the high tide (estimated +4.8 ft at Mallard Island Ferry Wharf, Suisun Bay), when saltwater incursion within the Estuary, and salinity at the intake for the site, was expected to be maximized. The February sample was expected to be representative of wet conditions, with reduced salinity and elevated contaminants from freshwater runoff during recent storms. This sample was collected during the low tide (estimated +1.0 ft), when salinity at the intake for the site was expected to be minimized. Brine water was collected from the PPS in plastic cubitainers and transported in coolers on ice to Pacific EcoRisk for toxicity testing. Samples were homogenized at the laboratory before analysis. 3.2 Analytical Methods Pacific EcoRisk performed toxicity evaluations of the samples (Appendix A, B). These evaluations consisted of the following USEPA short-term chronic toxicity tests: Chronic growth test with the diatom Thalassiosira pseudonana Chronic survival and growth test with the crustacean Americamysis bahia 2
4 Bay Area Regional Desalination Project Brine Toxicity Testing Results Pilot Study November 2009 Chronic survival and growth test with larvae of the fish Menidia beryllina. These specific test organisms were selected because they represented a best fit of standard effluent test organisms approved by EPA for testing under 40 CFR Part 136, are representative of taxa that inhabit the San Francisco Bay-Delta region, and are known to be less tolerant of high salinity concentrations than other potential test organisms. All tests involving concentration treatments involved diluting brine or a reference toxicant (KCl or K 2 Cr 2 O 7 ) in a Lab Control water (reverse-osmosis, deionized water). During dilutions, the brine and reference toxicant were adjusted to a test salinity of 25 ppt Growth Toxicity Testing with Thalassiosira pseudonana The diatom Thalassiosira pseudonana was exposed to varied treatment concentrations of brine for 96 hours (2.5%, 5%, 10%, 25%, 50%, and 100%), and then the effects on cell growth (i.e., cell density) were assessed to identify any toxicity caused by the brine (Pacific EcoRisk, 2008, 2009). A reference toxicity test was performed to determine the sensitivity of the diatoms to toxic stress, by exposing Thalassiosira to varied concentrations of KCl (0.625, 1.25, 2.5, 5, and 10 g/l) for 96 hours. The data were analyzed to determine key dose-response point estimates, including No Effect Concentration (NOEC) and Inhibition Concentration 50% (IC 50 ) and 25% (IC 25 ) Survival and Growth Toxicity Testing with Americamysis bahia The crustacean Americamysis bahia was exposed to a series of brine dilutions for seven days, and fed brine shrimp nauplii twice daily. After the test, the effects on survival (number of live mysids) and growth ( biomass value = dry weight of live mysids divided by initial number) were assessed to determine any impairments caused by the brine (Pacific EcoRisk, 2008, 2009). A reference toxicity test was performed to determine the sensitivity of the mysids to toxic stress, by exposing Americamysis to serial dilutions of a toxicant for seven days. The data were analyzed to determine key dose-response point estimates, including NOEC, IC 50, and IC 25, as well as Effect Concentration 50% (EC 50 ) and 25% (EC 25 ). Between the two sample collections, the testing laboratory transitioned from using chromium to KCl as the toxicant in these tests, for safety reasons (Pacific EcoRisk, 2008, 2009). For the dry sample, Lab Control water was spiked with chromium (as K 2 Cr 2 O 7 ) at concentrations of 0.88, 1.75, 3.5, 7, and 14 mg/l. For the wet sample, KCl was used at concentrations of 0.125, 0.25, 0.5, 1, and 2 g/l. Using different toxicants in the reference tests has no effect on sample tests Survival and Growth Toxicity Testing with Menidia beryllina Larvae of the fish Menidia beryllina were exposed to a series of brine dilutions for seven days, and fed brine shrimp nauplii twice daily. After the test, the effects on survival (number of live fish) and growth ( biomass value = dry weight of live fish divided by initial number) were evaluated (Pacific EcoRisk, 2008, 2009). A reference toxicity test was performed to determine the sensitivity of the fish to toxic stress, by exposing Menidia to serial dilutions of KCl at concentrations of 0.5, 1.0, 1.25, 1.5, and 2 mg/l for seven days. The test response data were 3
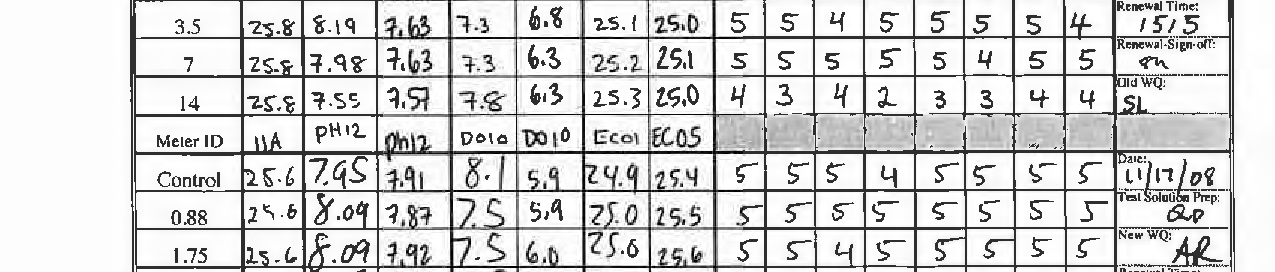
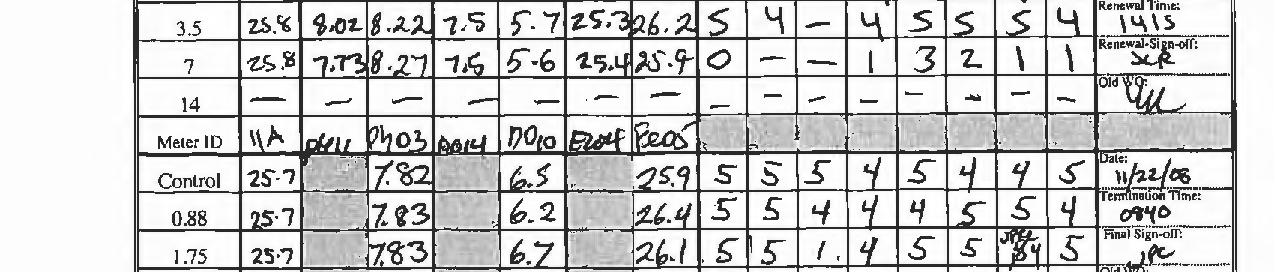
5 Bay Area Regional Desalination Project Brine Toxicity Testing Results Pilot Study November 2009 analyzed to determine key dose-response point estimates, including NOEC, IC 50, IC 25, EC 50, and EC Results 4.1 Water Quality Characteristics of Brine Samples The brine samples differed between seasons in several water quality characteristics (Table 4-1). Brine collected from the PPS during the dry season (November 2008) at high tide had a salinity of 17.7 ppt and conductivity of ms/cm, whereas the sample collected during the wet season (February 2009) at low tide had lower values of 7.0 ppt and ms/cm, respectively (Pacific EcoRisk, 2008, 2009). Although not directly relevant to this study, the dry season sample had a higher dissolved oxygen content (7.3 mg/l) than the wet season sample (5.5 mg/l). ph and total ammonia concentrations in both samples were the same (i.e., <1.0 mg/l N). Table 4-1. Collection information and water quality characteristics for brine samples collected during dry (11/14/08) and wet (2/25/09) periods from the PPS desalination plant (Pacific EcoRisk, 2008, 2009). Season 1 Target Salinity Target Contam. Date Time Dry High Low 11/14/ Wet Low High 2/25/ Tidal Height 2 High (+4.8 ft) Low (+1.0 ft) ph DO (mg/l) Salinity (ppt) Cond. (ms/cm) Total Ammonia (mg/l N) < <1.0 1 Representative, based on precipitation and river discharge 2 Estimated at Mallard Island Ferry Wharf, Suisun Bay ( N, W) 4.2 Toxicity Test Results Copies of the bioassay test result reports are contained in Appendices A and B for the November 2008 and February 2009 PPS brine discharge sample events, respectively Growth Toxicity on Thalassiosira pseudonana There were no significant reductions in algal growth in the desalination brine for either the dry or wet sample (Table 4-2) (Pacific EcoRisk, 2008, 2009). NOEC estimates were 100% brine, and IC 50 and IC 25 estimates were >100% brine. 4
6 Bay Area Regional Desalination Project Brine Toxicity Testing Results Pilot Study November Survival and Growth Toxicity on Americamysis bahia There were no significant reductions in invertebrate survival or growth in the desalination brine for either the dry or wet sample (Table 4-2) (Pacific EcoRisk, 2008, 2009). NOEC, IC 50, IC 25, EC 50, and EC 25 estimates were all >100% brine Survival and Growth Toxicity on Menidia beryllina There were no significant reductions in fish survival or growth in the desalination brine for either the dry or wet sample (Table 4-2) (Pacific EcoRisk, 2008, 2009). NOEC, IC 50, IC 25, EC 50, and EC 25 estimates were all >100% brine. 5.0 Discussion 5.1 Toxicity Test Results No significant growth toxicity of the desalination brine was found for the algae, and no significant survival or growth toxicity was found for the invertebrate or fish test organisms for either the dry sample (salinity-dominant scenario) or the wet sample (contaminant-dominant scenario) (Table 4-2). Because neither salinity- nor contaminant-related toxicity was found, it was not possible to distinguish the relative effects of each. The toxicity results suggest that, if the source water used at the PPS desalination plant and the brine samples tested are representative of those at an operational desalination plant at the Mallard Slough location, then there would be no expected toxic effects of the effluent on biota. 5.2 Representative Source Water Extremes One concern with these results is whether the brine samples were collected during the extremes in salinity and contaminant input at Mallard Slough, as intended. As discussed previously, the dry season sample was collected during expected conditions of low freshwater flow through the Delta and high tidal seawater incursion, when salinity would be maximized and contaminant input from precipitation-driven surface runoff would be minimal (Table 4-1). The wet season sample was collected during expected conditions of high freshwater flow and low seawater influence, when salinity would be minimized and contaminant concentrations from surface runoff maximized. Measurements of the collected brine confirm the expected higher brine salinity and conductivity during dry conditions and lower values during wet conditions (Table 4-1). Hydrographic conditions and water quality data measured near the PPS desalination plant from January 2008 to March 2009 also substantiate that the samples were collected during extremes in source water composition during the study period. Freshwater input to the region varied significantly throughout 2008 and early 2009, when the PPS was operating. Precipitation data for Concord Airport show that the 2008 dry season extended from March through mid October (Figure 5-1a). In early November, a storm delivered two inches of rain to the region, but for nearly two weeks before the dry sampling event on November 14, 2008, and during the sampling event itself, conditions were dry (National Weather Service, 2009). A series of storms in late November of 2008 through February of 2009 delivered 8.3 inches of rain, with nearly 6 5
7 Bay Area Regional Desalination Project Brine Toxicity Testing Results Pilot Study November 2009 inches of that falling during the three weeks immediately before the wet sampling event on February 25, The effects of precipitation runoff during the PPS operation can be seen in records related to contaminant input near Mallard Island. Sacramento River discharge at Rio Vista (USGS water quality station SRV ) (California Data Exchange Center, 2009) varied sinusoidally around a 6
8 Bay Area Regional Desalination Project Brine Toxicity Testing Results Pilot Study November 2009 Table 4-2. Summary of toxicity testing results for brine samples collected from the PPS desalination plant during dry (11/14/08) and wet (2/25/09) periods, as well as results for reference toxicant tests (Pacific EcoRisk, 2008, 2009). Algae Invertebrate Fish Test Test Test (Thalassiosira pseudonana) (Americamysis bahia) (Menidia beryllina) Parameter Treatment Statistic Dry Wet Dry Wet Dry Wet Survival Brine NOEC - - >100% brine >100% brine >100% brine >100% brine Survival Brine EC >100% brine >100% brine >100% brine >100% brine Survival Brine EC >100% brine >100% brine >100% brine >100% brine Survival Ref Tox EC mg/l Cr 0.60 g/l KCl 1.2 g/l KCl 1.2 g/l KCl Growth Brine NOEC 100% brine 100% brine >100% brine >100% brine >100% brine >100% brine Growth Brine IC 25 >100% brine >100% brine >100% brine >100% brine >100% brine >100% brine Growth Brine IC 50 >100% brine >100% brine >100% brine >100% brine >100% brine >100% brine Growth Ref Tox IC g/l KCl 4.25 g/l KCl 4.6 mg/l Cr 0.64 g/l KCl 1.2 g/l KCl 1.3 g/l KCl [BrineToxTestResults.doc] 7
9 Bay Area Regional Desalination Project Brine Toxicity Testing Results Pilot Study November 2009 median value of approximately 11,800 cfs from March through October of 2008 (Figure 5-1b). Discharge during the dry sample collection was on the lower end of this variation, at 440 cfs. In contrast, discharge peaked at over 91,000 cfs on the day the wet sample was collected, which indicates a significant increase in the fresh water flow (and presumably, contaminant input) from the Delta to Mallard Slough. Water turbidity in the Sacramento River at Mallard Island (California Department of Water Resources station MAL ) (California Data Exchange Center, 2009), which we use here as a proxy for suspended sediment and contaminant input to the Sacramento River, also increased between the dry and wet sample collections, from 14.8 to 38.1 ntu (Figure 5-1c). The effect of freshwater runoff on source water salinity is also apparent in electrical conductivity records from Sacramento River at Mallard Island (California Data Exchange Center, 2009). Conductivity increased throughout the 2008 dry season, but decreased between the dry and wet events, from 11.6 to 0.5 ms/cm (Figure 5-1d). Conductivity of the feed water tank for the PPS desalination plant closely tracked that of the nearby MAL station (Figure 5-1d). The conductivity of the feed water on 11/14/08 is unknown, due to an instrument error (Stefani Harrison, Pers. Comm., 2009), but based on values immediately before and after that date, the value was probably about 12 ms/cm. This value dropped to 4.2 ms/cm on the 2/25/09 event. The logistics of collecting a field sample under target weather and hydrographic conditions is difficult, and much more so when coordinating with a complex operation such as the PPS desalination plant. Yet, the brine samples appear to have been collected during conditions that represent the seasonal extremes of source water quality for Mallard Slough reasonably well. Although the dry brine sample ideally would have been collected several weeks earlier (i.e., before the first significant storm in early November of 2008), unexpected start-up delays prevented sampling earlier in the year. However, the wet sample was collected during peak freshwater runoff of the winter storm season. 5.3 Representative Water Year Another concern with the results of the toxicity tests is that they may not be representative of conditions during other years. California is in its third year of drought. The samples were collected when the Sacramento River was in a Moderate to Severe Drought, based on 8 Station Index (8SI) percentiles for the current water year (October 1, 2008 to September 30, 2009) (California Department of Water Resources, 2009). It is possible that if the source water for the desalination plant had higher salinity and/or contaminant concentration than those tested, then the desalination process could potentially concentrate the salts and contaminants enough to produce brine with toxic effects on biota. However, because the survival and growth NOEC values for all tests were 100% brine, it is unclear how much the salinity or contaminant concentration would need to increase in the brine to see a toxic effect on the test organisms. 6.0 Conclusions Toxicity tests of desalination brine samples collected during the dry season (salinity-dominant scenario) and wet season (contaminant-dominant scenario) from the PPS in Mallard Slough 8
10 Bay Area Regional Desalination Project Brine Toxicity Testing Results Pilot Study November 2009 showed no significant effects on the survival or growth of algal (Thalassiosira pseudonana), invertebrate (Americamysis bahia), or fish (Menidia beryllina) test organisms. Assuming that brine samples tested in this study are representative of those produced by an operational desalination plant at Mallard Slough, there would be no expected toxic effects of the brine on biota were the brine to be discharged into the Delta. 7.0 References California Data Exchange Center, California Department of Water Resources, April 6, Sacramento River Drought Status. National Weather Service, Observed Weather Reports. Pacific EcoRisk, December, A Toxicity Evaluation of the Bay Area Regional Desalination Project Effluent, Sample Collected November 14, pp. Pacific EcoRisk, March, Supplemental Report: A Toxicity Evaluation of the Bay Area Regional Desalination Project Effluent, Sample Collected February 25, Stefani Harrison, Pers. Comm., Electrical conductivity data from raw water tank at PPS desalination plant. 9
11 Bay Area Regional Desalination Project Brine Toxicity Testing Results Pilot Study November 2009 Precipitation at Concord Airport (in) River Discharge at SRV (cfs) Turbidity at MAL (ntu) a Jan 08Feb 08Mar 08Apr 08May 08Jun 08Jul 08Aug 08Sep 08Oct 08Nov 08Dec 08Jan 09Feb 09Mar 09Apr ,034 b Jan c Feb 08 Mar 08 Apr 08 May 08 Jun 08 Jul 08 Aug 08 Sep 08 Oct 08 Nov Dec 08 Jan 09 Feb 09 Mar Apr 09 Conductivity at MAL and PPS (ms/cm) 0 20Jan 08Feb 08Mar 08Apr 08May 08Jun 08Jul 08Aug 08Sep 08Oct 08Nov 08Dec 08Jan 09Feb 09Mar 09Apr 09 d PPS 15? MAL Jan Feb Mar Apr May Jun Jul Aug Sep Oct Nov Dec Jan Feb Mar Apr Figure 5-1. Measured precipitation (a), hydrographic (b), and water quality (c, d) parameters near the Pilot Plant Study (PPS) site. River discharge, water turbidity, and water electrical conductivity are plotted as median daily values. SRV = Sacramento River at Rio Vista station (USGS); MAL = Sacramento River at Mallard Slough station (California DWR). Symbols with labels indicate parameter values during brine sampling events on 11/14/08 ( dry ) and 2/25/09 ( wet ). The dashed line in plot d indicates measurements within the feed water tank of the desalination plant. The? label for 11/14/08 feed water at PPS denotes an instrument error (symbol position interpolated from surrounding values)
12 Bay Area Regional Desalination Project Brine Toxicity Testing Results Pilot Study November Appendix A See separate attachment for detailed toxicity testing results for the dry season brine sample, collected on November 14, 2008 (AppendixA_111408Results.pdf) (Pacific EcoRisk, December, 2008). 11
13
14
15
16
17
18
19
20
21
22
23
24
25
26
27
28
29
30
31
32
33
34
35
36
37
38
39
40


41
42
43
44
45
46
47
48
49
50
51
52
53
54
55
56
57
58


59
60
61
62
63
64
65
66
67
68
69
70
71
72

73
74
75
76 Bay Area Regional Desalination Project Brine Toxicity Testing Results Pilot Study November Appendix B See separate attachment for detailed toxicity testing results for the wet season brine sample, collected on February 25, 2009 (AppendixB_022509Results.pdf) (Pacific EcoRisk, March, 2009). 12
77 Jay Johnson March 30, 2009 Applied Marine Sciences 4749 Bennett Dr., Suite L Livermore, CA Dear Jay: I have enclosed two copies of our Supplemental report A Toxicity Evaluation of the Bay Area Regional Desalination Project Effluent for the sample collected February 25, This report was revised to reflect the correction of the sample collection date. The results of this testing are summarized below: Chronic Effects of the Desalination Effluent on Thalassiosira pseudonana There were no significant reductions in Thalassiosira pseudonana growth. Chronic Effects of the Desalination Effluent on Americamysis bahia There were no significant reductions in Americamysis bahia survival or growth. Chronic Effects of the Desalination Effluent on Menidia beryllina There were no significant reductions in Menidia beryllina survival or growth. If you have any questions regarding the performance and interpretation of these tests, feel free to call me at (707) Sincerely, R. Scott Ogle, Ph.D. Principal & Special Projects Director This testing was performed under Lab Order The test results reported herein conform to the most current NELAC standards, where applicable, unless otherwise narrated in the body of the report, and only relate to the sample(s) tested. This report shall not be reproduced, except in full, without the written consent of Pacific EcoRisk. 1/62
78 Supplemental Report A Toxicity Evaluation of the Bay Area Regional Desalination Project Effluent Sample collected February 25, 2009 Prepared For: Applied Marine Sciences 4749 Bennett Dr., Suite L Livermore, CA Prepared By: Pacific EcoRisk, Inc Cordelia Rd. Fairfield, CA March 2009 Report Revised March /62
79 Supplemental Report A Toxicity Evaluation of the Bay Area Regional Desalination Project Effluent Sample collected February 25, 2009 Prepared For: Applied Marine Sciences 4749 Bennett Dr., Suite L Livermore, CA Prepared By: Pacific EcoRisk, Inc Cordelia Rd. Fairfield, CA March 2009 Report Revised March /62
80 Pacific EcoRisk Environmental Consulting and Testing A Toxicity Evaluation of the Bay Area Regional Desalination Project Effluent Sample collected February 25, 2009 Table of Contents Page 1. INTRODUCTION COLLECTION AND DELIVERY OF THE EFFLUENT SAMPLE CHRONIC TOXICITY TEST PROCEDURES Algal Growth Toxicity Testing with Thalassiosira pseudonana Reference Toxicant Testing of the Thalassiosira pseudonana Survival and Growth Toxicity Testing with Americamysis bahia Reference Toxicant Testing of the Americamysis bahia Survival and Growth Toxicity Testing with Menidia beryllina Reference Toxicant Testing of the Menidia beryllina RESULTS Effects of the Desalination Effluent on Thalassiosira pseudonana Reference Toxicant Toxicity to Thalassiosira pseudonana Effects of the Desalination Effluent on Americamysis bahia Reference Toxicant Toxicity to Americamysis bahia Effects of the Desalination Effluent on Menidia beryllina Reference Toxicant Toxicity to Menidia beryllina SUMMARY AND CONCLUSIONS AQUATIC TOXICITY DATA QUALITY CONTROL...12 i 4/62
81 Pacific EcoRisk Environmental Consulting and Testing Appendices Appendix A Appendix B Appendix C Appendix D Appendix E Appendix F Appendix G Chain-of-Custody Record for the Collection and Delivery of the Bay Area Regional Desalination Project Effluent sample Test Data and Summary of Statistics for the Evaluation of the Chronic Toxicity of the Bay Area Regional Desalination Project Effluent to Thalassiosira pseudonana Test Data and Summary of Statistics for the Reference Toxicant Evaluation of the Thalassiosira pseudonana Test Data and Summary of Statistics for the Evaluation of the Chronic Toxicity of the Bay Area Regional Desalination Project Effluent to Americamysis bahia Test Data and Summary of Statistics for the Reference Toxicant Evaluation of the Americamysis bahia Test Data and Summary of Statistics for the Evaluation of the Chronic Toxicity of the Bay Area Regional Desalination Project Effluent to Menidia beryllina Test Data and Summary of Statistics for the Reference Toxicant Evaluation of the Menidia beryllina ii 5/62
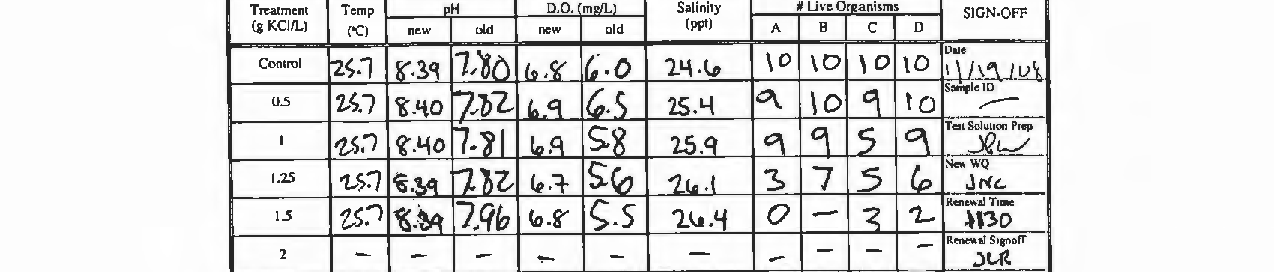
82 Pacific EcoRisk Environmental Consulting and Testing 1. INTRODUCTION Under contract to the Applied Marine Sciences, Pacific EcoRisk (PER) performed chronic toxicity evaluations of effluent sample collected as part of the Bay Area Regional Desalination Project. The toxicity evaluations consist of performing the following chronic toxicity tests: chronic (96-hr) growth test with the diatom Thalassiosira pseudonana; chronic survival and growth test with the crustacean Americamysis bahia; and chronic survival and growth test with larval Menidia beryllina. These toxicity tests were performed on water the sample collected on February 25, This report describes the performance and results of these tests. 2. COLLECTION AND DELIVERY OF THE EFFLUENT SAMPLE On February 25, an effluent sample was collected from the Bay Area Regional Desalination plant. The sample was transported, on ice and under chain-of-custody, to the PER laboratory facility in Fairfield. Upon receipt at the testing laboratory, aliquots of sample were collected for analysis of initial water quality characteristics (Table 1). The remainder of the water sample was stored at 0-6 C except when being used to prepare test solutions. The chain-of-custody record for the collection and delivery of this sample is provided in Appendix A. Table 1. Initial water quality characteristics of the Bay Area Regional Desalination Project effluent. Date Sample Collected Date Sample Received Sample ID Temp ( C) ph D.O (mg/l) Salinity Conductivity (µs/cm) Total Ammonia (mg/l N) 02/25/09 02/25/09 Brine 13.7* <1.0 * Sample was delivered on the day of collection, and was transported at <6.0 C. 3. CHRONIC TOXICITY TEST PROCEDURES The Bay Area Desalination Project effluent sample was tested for toxicity using the following US EPA short-term chronic toxicity tests: chronic (96-hr) growth test with the diatom Thalassiosira pseudonana; chronic survival and growth test with the crustacean Americamysis bahia; and chronic survival and growth test with larval Menidia beryllina. The methods used in conducting these toxicity tests followed the guidelines established by the following manuals: Page 1 6/62
83 Pacific EcoRisk Environmental Consulting and Testing "Standard Guide for Conducting Static 96-h Toxicity Tests with Microalgae" (ASTM E a); and "Short-Term Methods for Estimating the Chronic Toxicity of Effluents and Receiving Waters to Marine and Estuarine Organisms, Third Edition" (EPA-821-R ). 3.1 Algal Growth Toxicity Testing with Thalassiosira pseudonana The short-term chronic diatom toxicity test consists of exposing Thalassiosira pseudonana to the effluent for ~96-hrs, after which the effects on cell growth are evaluated. The specific procedures used in these tests are described below. The Lab Control water for this test consisted of reverse osmosis, de-ionized (RO/DI) water adjusted up to the test salinity of 25 ppt using an artificial sea salt (Crystal Seas -bioassay grade). For use in this test, an aliquot of the effluent was similarly adjusted to 25 ppt using the same sea salt. The Lab Control water and ambient waters were filtered (0.45 µm) and then spiked with nutrients, as per ASTM guidelines. The salinity-adjusted Lab Control water and effluent were used to prepare test solutions at test treatment concentrations of 2.5%, 5%, 10%, 25%, 50% and 100% effluent. Water quality characteristics were measured on these test solutions prior to use in this test. There were 4 replicates at each test treatment, each replicate consisting of a 250-mL glass Erlenmeyer flask containing 100 ml of test solution; an additional replicate was established at each test treatment for the measurement of test solution water quality characteristics during the test and at test termination. Each treatment was inoculated to an initial diatom cell density of 20,000 cells/ml from a from a laboratory culture of Thalassiosira that is maintained in log growth phase. These flasks were loosely capped and randomly positioned within a temperaturecontrolled room at 20 C, under continuous illumination from cool-white fluorescent bulbs. Each day, the temperature and ph were determined for the designated water quality replicate at each treatment; each replicate flask was gently shaken in the morning and randomly repositioned within the temperature-controlled room. After 96 (+2) hrs exposure, the cell density in each replicate flask was determined by microscopic analysis. The resulting cell density data were analyzed to determine any growth impairment, or toxicity, caused by the ambient water; all statistical analyses were performed using CETIS statistical software (Tidepool Scientific, McKinleyville, CA) Reference Toxicant Testing of the Thalassiosira pseudonana In order to assess the sensitivity of the Thalassiosira to toxic stress, a reference toxicant test was performed. The reference toxicant test was performed similarly to the effluent test except that test solutions consisted of Lab Control water spiked with KCl at concentrations of 0.625, 1.25, 2.5, 5, and 10 gm/l. The resulting test response data were statistically analyzed to determine key Page 2 7/62
84 Pacific EcoRisk Environmental Consulting and Testing dose-response point estimates (e.g., IC50); all statistical analyses were performed using the CETIS software. These response endpoints were then compared to the typical response range established by the mean ± 2 SD of the point estimates generated by the most recent previous reference toxicant tests performed by this lab. 3.2 Survival and Growth Toxicity Testing with Americamysis bahia The short-term chronic Americamysis bahia test consists of exposing the organisms to a series of effluent dilutions for 7 days, after which effects on survival and growth are evaluated. The specific procedures used in this test are described below. The Americamysis bahia used in this test were obtained from Aquatic BioSystems (Ft. Collins, CO); upon receipt at the lab, the mysids were transferred into aerated tanks containing saltwater at 25 ppt, and were fed brine shrimp nauplii during the pre-test holding period. The Lab Control/dilution water for this test was prepared by salting up reverse-osmosis, deionized water to a salinity of 25 ppt using a commercial artificial sea salt (Crystal Sea Salt - bioassay grade). Each day, an aliquot of the final effluent sample was similarly adjusted to a salinity of 25 ppt using the same artificial sea salt. The salinity-adjusted Lab Control/dilution water and effluent sample were used to prepare daily test solutions at concentrations of 2.5%, 5%, 10%, 25%, 50% and 100% effluent. New water quality characteristics (ph, D.O., and salinity) were measured on these test solutions prior to use in the test. There were 8 replicates at each test treatment, each replicate consisting of 200 ml of test solution in a 400-mL glass beaker. The test was initiated by randomly allocating five 7-day old mysids into each replicate beaker. The beakers were randomly positioned in a temperaturecontrolled room at 26 C (with temperature being monitored daily) under a 16L:8D photoperiod. The mysids were fed freshly-hatched brine shrimp nauplii twice daily. Each day of the test, fresh test solutions were prepared and characterized as before. The test replicate beakers were examined, with any dead animals, uneaten food, wastes, and other detritus being removed. The number of live mysids in each replicate was determined and ~80% of the test media in each beaker was carefully poured out and replaced with fresh test solution. Old water quality characteristics (ph, D.O., and salinity) were measured on the old test water that had been discarded from one randomly-selected replicate at each treatment. After 7 days exposure, the test was terminated and the number of live mysids in each replicate beaker was recorded. The mysids from each replicate were then carefully euthanized in methanol, rinsed in de-ionized water, and transferred to a pre-dried and pre-tared weighing pan. The mysids were then dried at 100 C for >24 hrs and re-weighed to determine the total weight of mysids in each replicate; the total weight was divided by the initial number of mysids per replicate (n=5) to determine the biomass value. The resulting survival and growth (biomass Page 3 8/62
85 Pacific EcoRisk Environmental Consulting and Testing value) data were analyzed to evaluate any impairment(s) caused by the effluent; all statistical analyses were performed using CETIS statistical software Reference Toxicant Testing of the Americamysis bahia In order to assess the sensitivity of the mysid test organisms to toxic stress, a reference toxicant test was performed. The reference toxicant test was performed similarly to the effluent test except that test solutions consisted of Lab Control media spiked with KCl at concentrations of 0.125, 0.25, 0.5, 1, and 2 gm/l. The resulting test response data were analyzed to determine key dose-response point estimates (e.g., EC50); all statistical analyses were made using the CETIS software. These response endpoints were then compared to the typical response range established by the mean ± 2 SD of the point estimates generated by the 20 most recent previous reference toxicant tests performed by this lab. 3.3 Survival and Growth Toxicity Testing with Menidia beryllina The short-term chronic Menidia beryllina test consists of exposing larval fish to a series of effluent dilutions for 7 days, after which effects on survival and growth are evaluated. The specific procedures used in this test are described below. The larval fish used in this bioassay were obtained from a commercial supplier (Aquatic Biosystems, Fort Collins, CO). These fish were maintained at 25 C in aerated aquaria containing Lab Control water (described below) prior to their use in this test. During this pre-test period, the fish were fed brine shrimp nauplii ad libitum. The Lab Control/dilution water for this bioassay was prepared by salting up reverse-osmosis, deionized water to a salinity of 25 ppt using a commercial artificial sea salt (Crystal Sea -bioassay grade). Each day, an aliquot of the final effluent sample was similarly adjusted to a salinity of 25 ppt using the same artificial sea salt. The salinity-adjusted Lab Control/dilution water and effluent sample were used to prepare daily test solutions at concentrations of 2.5%, 5%, 10%, 25%, 50% and 100% effluent. New water quality characteristics (ph, D.O., and salinity) were measured on these test solutions prior to use in the test. There were 4 replicates for the Lab Control and each effluent treatment, each replicate consisting of 400 ml of test media in a 600-mL glass beaker. This test was initiated by randomly allocating ten 11-day old Menidia beryllina into each replicate. These replicate beakers were placed in a temperature-controlled room at 25 C, under cool-white fluorescent lighting on a 16L:8D photoperiod. The test fish were fed brine shrimp nauplii twice daily. Each day of the test, fresh test solutions were prepared and characterized as before. The replicate beakers containing the larval fish were examined, with any dead animals, uneaten food, wastes, and other detritus being removed. The number of live fish in each replicate was determined and then approximately 80% of the test media in each beaker was carefully poured out and replaced Page 4 9/62
86 Pacific EcoRisk Environmental Consulting and Testing with fresh media. Old water quality characteristics (ph, D.O., and conductivity) were measured on the old test water collected from one randomly selected replicate at each treatment. After 7 days exposure, the number of live fish in each replicate beaker was recorded. Then, the fish from each replicate were carefully euthanized in methanol, rinsed in de-ionized water, and transferred to a pre-dried and pre-tared weighing pan. These were then dried at 100 C for >24 hrs and re-weighed to determine the total weight of fish in each replicate. The total weight was then divided by the initial number of fish per replicate (n=10) to determine the biomass value. The resulting survival and biomass value data were analyzed to determine key dose-response point estimates (e.g., EC50); all statistical analyses were performed using the CETIS statistical software Reference Toxicant Testing of the Menidia beryllina In order to assess the sensitivity of the fish test organisms to toxic stress, a reference toxicant test was performed concurrently with the effluent test. This reference toxicant test was performed similarly to the effluent toxicity test, except that test solutions consisted of Lab Control (25 ppt water) spiked with KCl at concentrations of 0.5, 1.0, 1.25, 1.5, and 2 gm/l. After 7 days exposure, the survival and weight data were evaluated as in the effluent test. The resulting test response data were analyzed to determine key dose-response point estimates (e.g., EC50); all statistical analyses were made using the CETIS software. These response endpoints were then compared to the typical response range established by the mean ± 2 SD of the point estimates generated by the 20 most recent previous reference toxicant tests performed by this lab. Page 5 10/62
87 Pacific EcoRisk Environmental Consulting and Testing 4. RESULTS 4.1 Effects of the Desalination Effluent on Thalassiosira pseudonana The results of this test are summarized below in Table 2. There were no significant reductions in algal growth in the Desalination effluent; the growth NOEC was 100% effluent. The IC25 and IC50 were both >100% effluent, resulting in <1.0 survival TUc (where survival TUc = 100/IC25 or 100/IC50) for both test endpoints.. The test data and the summary of statistical analyses for these tests are presented in Appendix B. Table 2. Effect of the Desalination effluent on Thalassiosira pseudonana. Effluent Treatment Mean Diatom Cell Density (cells/ml x 10 6 ) Lab Water Control % % % % % % 5.58 Summary of Key Statistics Growth NOEC = 100% effluent TUc (TUc = 100/NOEC) = 1.0 Growth IC25 = >100% effluent TUc (TUc = 100/IC25) = <1.0 Growth IC50 = >100% effluent TUc (TUc = 100/IC50) = <1.0 Page 6 11/62
88 Pacific EcoRisk Environmental Consulting and Testing Reference Toxicant Toxicity to Thalassiosira pseudonana The results of this test are presented in Table 3. There was a mean of 1,990,000 cells/ml at the Lab Control treatment. The growth IC50 was 4.25 gm/l KCl. The results of the concurrent reference toxicant test were consistent with the reference toxicant test database, indicating that these test organisms were responding to toxic stress in a typical fashion. The test data and the summary of statistical analyses for these tests are presented in Appendix C. Table 3. Reference toxicant testing: effects of KCl on Thalassiosira pseudonana. KCl Treatment (gm/l) Mean Diatom Cell Density (cells/ml x 10 6 ) Lab Water Control * * Summary of Key Statistic IC50 = 4.25 gm/l KCl * Significantly less than the Lab Control treatment response at p<0.05. Page 7 12/62
89 Pacific EcoRisk Environmental Consulting and Testing 4.2 Effects of the Desalination Effluent on Americamysis bahia The results of this test are presented in Table 4. There was a mean of 92.5% survival at the Lab Control treatment. There were no significant reductions in survival in the Desalination effluent; the survival NOEC was 100% effluent. Due to the absence of significant mortalities, the EC25 and EC50 could not be calculated, but can both be assumed >100% effluent, resulting in <1.0 survival TUc (where TUc = 100/EC25 or 100/EC50) for both test endpoints. The mean biomass value was 0.26 mg at the Lab Control treatment. There were no significant reductions in growth in the Desalination effluent; the growth NOEC was 100% effluent. The IC25 and IC50 were both >100% effluent, resulting in <1.0 growth TUc (where TUc = 100/IC25 or 100/IC50) for both test endpoints. The test data and summary of statistical analyses for this test are attached as Appendix D. Table 4. Effects of the Desalination effluent on Americamysis bahia. Effluent Treatment Mean % Survival Mean Biomass Value (mg) Lab Control % % % % % % Summary of Key Statistics NOEC >100% effluent >100% effluent TUc (TUc = 100/NOEC) = <1.0 <1.0 Survival EC25 or Growth IC25 >100% effluent >100% effluent TUc (TUc = 100/EC25 or 100/IC25) = <1.0 <1.0 Survival EC50 or Growth IC50 >100% effluent >100% effluent TUc (TUc = 100/EC50 or 100/IC50) = <1.0 <1.0 Page 8 13/62
90 Pacific EcoRisk Environmental Consulting and Testing Reference Toxicant Toxicity to Americamysis bahia The results of this test are presented in Table 5. There was a mean of 97.5% survival and a mean mysid biomass of 0.28 mg at the Lab Control treatment. The survival EC50 was 0.60 gm/l, and the growth IC50 was 0.64 gm/l. The results of the concurrent reference toxicant test were consistent with the reference toxicant test database, indicating that these test organisms were responding to toxic stress in a typical fashion. The test data and the summary of statistical analyses for this test are attached as Appendix E. Table 5. Reference toxicant testing: effects of potassium chloride on Americamysis bahia. KCl Treatment (gm/l) Mean % Survival Mean Biomass Value (mg) Lab Control * 1 0* 0* 2 0* 0* Summary of Key Statistics Survival EC50 or Growth IC50 = 0.60 gm/l KCl 0.64 gm/l KCl * Significantly less than the Lab Control treatment response at p<0.05. Page 9 14/62
91 Pacific EcoRisk Environmental Consulting and Testing 4.3 Effects of the Desalination Effluent on Menidia beryllina The results of this test are presented in Table 6. There was 100% survival at the Lab Control treatment. There were no significant reductions in survival in the Desalination effluent; the survival NOEC was 100% effluent. Due to the absence of significant mortalities, the EC25 and EC50 could not be calculated, but can both be assumed >100% effluent, resulting in <1.0 survival TUc (where TUc = 100/EC25 or 100/EC50) for both test endpoints. The mean fish biomass value was 0.94 mg at the Lab Control treatment. There were no toxicologically significant reductions in growth in the Desalination effluent; the growth NOEC was 100% effluent. The IC25 and IC50 were both >100% effluent, resulting in <1.0 growth TUc (where TUc = 100/IC25 or 100/IC50) for both test endpoints. The test data and the summary of statistical analyses for this test are attached as Appendix F. Table 6. Effects the Desalination effluent on Menidia beryllina. Effluent Treatment Mean % Survival Mean Biomass Value (mg) Lab Control % % % % * 50% % Summary of Key Statistics NOEC >100% effluent >100% effluent TUc (TUc = 100/NOEC) = <1.0 <1.0 Survival EC25 or Growth IC25 >100% effluent >100% effluent TUc (TUc = 100/EC25 or 100/IC25) = <1.0 <1.0 Survival EC50 or Growth IC50 >100% effluent >100% effluent TUc (TUc = 100/EC50 or 100/IC50) = <1.0 <1.0 * There was an interrupted dose-response with a biomass of 0.82 mg at the 25% effluent treatment, which was indicated as being statistically less than the Lab Control treatment. However, the biomass values at the remaining 50% and 100% effluent treatments were not significantly less than the Lab Control, indicating that the apparent reduction in biomass in the 25% effluent was not toxicologically significant. Page 10 15/62
92 Pacific EcoRisk Environmental Consulting and Testing Reference Toxicant Toxicity to Menidia beryllina The results of this test are summarized below in Table 7. There was a mean of 100% survival and a mean fish biomass value of 1.03 mg at the Lab Control treatment; the survival EC50 value was 1.2 gm/l KCl, and the growth IC50 was 1.3 gm/l KCl. These reference toxicant test responses were consistent with previous performance of this test in our lab, indicating that these organisms were responding to toxic stress in a typical fashion. The test data and summary of statistical analyses for this test are attached as Appendix G. Table 7. Reference toxicant testing: effects of KCl on Menidia beryllina. KCl Treatment (gm/l) Mean % Survival Mean Biomass Value (mg) Lab Control * 0.54* * 0.13* 2 0* 0* Summary of Key Statistics Survival EC50 or Growth IC50 = 1.2 gm/l KCl 1.3 gm/l KCl * Significantly less than the Lab Control treatment response (p < 0.05). Page 11 16/62
93 Pacific EcoRisk Environmental Consulting and Testing 5. SUMMARY AND CONCLUSIONS Chronic Effects of the Desalination Effluent on Thalassiosira pseudonana There were no significant reductions in algal growth in the effluent. Chronic Effects of the Desalination Effluent on Americamysis bahia There were no significant reductions in invertebrate survival or growth in the effluent. Chronic Effects of the Desalination Effluent on Menidia beryllina There were no significant reductions in fish survival or growth in the effluent. 6. AQUATIC TOXICITY DATA QUALITY CONTROL Test Conditions Test conditions (ph, D.O., temperature, etc.) were within acceptable limits for these tests. All such analyses were performed according to laboratory Standard Operating Procedures. Negative Control The test organism responses at the Lab Control treatments were within acceptable limits. Positive Control The results for the Americamysis bahia, Menidia beryllina, and Thalassiosira pseudonana reference toxicant tests were consistent with the reference toxicant test databases, indicating that these test organisms were responding to toxic stress in a typical fashion. Concentration Response Relationships There was an interrupted dose-response in the Menidia beryllina growth response, with an indication of a statistically significant reduction at the 25% effluent concentration. However, the biomass value at the remaining 50% and 100% effluent treatments were not significantly less than the Lab Control, indicating that the apparent reduction in biomass in the 25% effluent was not toxicologically significant. There were valid concentration-response relationships for the remaining effluent and reference toxicant tests (EPA821-B ), which were determined to be acceptable for this testing. Page 12 17/62
94 Pacific EcoRisk Environmental Consulting and Testing Appendix A Chain-of-Custody Record for the Collection and Delivery of the Bay Area Regional Desalination Project Effluent Sample 18/62
95 19/62
96 Pacific EcoRisk Environmental Consulting and Testing Appendix B Test Data and Summary of Statistics for the Evaluation of the Chronic Toxicity of the Bay Area Regional Desalination Project Effluent to Thalassiosira pseudonana 20/62
97 21/62
98 22/62
99 23/62
100 24/62
101 25/62
102 26/62
103 27/62
104 Pacific EcoRisk Environmental Consulting and Testing Appendix C Test Data and Summary of Statistics for the Reference Toxicant Evaluation of the Thalassiosira pseudonana 28/62
Long-term Marine Monitoring in Willapa Bay. WA State Department of Ecology Marine Monitoring Program
 Long-term Marine Monitoring in Willapa Bay WA State Department of Ecology Marine Monitoring Program Ecology s Marine Waters Monitoring Program Goal: establish and maintain baseline environmental data Characterize
CENTRAL ARIZONA SALINITY STUDY ---- Phase I. Technical Appendix O. Municipal TDS Research
 CENTRAL ARIZONA SALINITY STUDY ---- Phase I Technical Appendix O Municipal TDS Research Introduction Water availability and quality are among the world s most important environmental issues. Demand for
DRAFT FINAL MITIGATED NEGATIVE DECLARATION Pursuant to Section 21080(c) Public Resources Code
 Public Resources Code") DRAFT FINAL MITIGATED NEGATIVE DECLARATION Pursuant to Section 21080(c) Public Resources Code To: Office of Planning & Research State Clearinghouse 1400 Tenth Street Sacramento, CA 95814 From: State Water
DRAFT FINAL MITIGATED NEGATIVE DECLARATION Pursuant to Section 21080(c) Public Resources Code To: Office of Planning & Research State Clearinghouse 1400 Tenth Street Sacramento, CA 95814 From: State Water
Recycled Water Program, Phase II CLWA- 1
 Recycled Water Program, Phase II CLWA- 1 Description: This project includes the planning, designing, and construction of a new recycled water storage tank, pump station modifications, and new recycled
Edgefield Regional Stormwater Treatment (RST) Facility Tri-County Agricultural Area St. Johns River Water Management District
 Facility Tri-County Agricultural Area St. Johns River Water Management District") Edgefield Regional Stormwater Treatment (RST) Facility Tri-County Agricultural Area St. Johns River Water Management District Water Quality Draft Summary, December 2009 Alicia Steinmetz and Pam Livingston-Way,
Edgefield Regional Stormwater Treatment (RST) Facility Tri-County Agricultural Area St. Johns River Water Management District Water Quality Draft Summary, December 2009 Alicia Steinmetz and Pam Livingston-Way,
Climate Change. Lauma M. Jurkevics - DWR, Southern Region Senior Environmental Scientist
 Climate Change A n o t h e r F a c t o r i n M a n a g i n g S o u t h e r n C a l i f o r n i a s W a t e r R e s o u r c e s Lauma M. Jurkevics - DWR, Southern Region Senior Environmental Scientist USEPA-Region
SUMMARY SITE RECORD FORM AND COMMENTARY DATE: 4/9/10
 SUMMARY SITE RECORD FORM AND COMMENTARY Where are you? DATE: 4/9/10 What is the weather like? Air temperature Wind direction and speed Cloud cover What is the time, and what stage is the tide? What is
AT&T Global Network Client for Windows Product Support Matrix January 29, 2015
 AT&T Global Network Client for Windows Product Support Matrix January 29, 2015 Product Support Matrix Following is the Product Support Matrix for the AT&T Global Network Client. See the AT&T Global Network
INTERSTAGE ENERGY RECOVERY TURBINE APPLICATION MARCO ISLAND, FLORIDA
 IWC-00-15 INTERSTAGE ENERGY RECOVERY TURBINE APPLICATION MARCO ISLAND, FLORIDA JULIA NEMETH, PE Harn R/O Systems, Incorporated Venice, Florida STEVEN DURANCEAU, PHD, PE Boyle Engineering Corporation Orlando,
Lesson 5: Water Conductivity and Total Dissolved Solids Water Quality Sampling
 Lesson 5: Water Conductivity and Total Dissolved Solids Water Quality Sampling Time Frame: Two 45-50 minute class periods Grade Level: 8 th 12 th Grade Overview: There are a wide variety of inorganic substances
U.S. Environmental Protection Agency, Region IX Response to Comments on the Goleta Sanitary District Draft NPDES Permit and 301(h) TDD
 TDD") U.S. Environmental Protection Agency, Region IX Response to Comments on the Goleta Sanitary District Draft NPDES Permit and 301(h) TDD A. Kamil S. Azoury of Goleta Sanitary District provided comments on
U.S. Environmental Protection Agency, Region IX Response to Comments on the Goleta Sanitary District Draft NPDES Permit and 301(h) TDD A. Kamil S. Azoury of Goleta Sanitary District provided comments on
Environmental Water Testing: Surface Water, Groundwater, Hard Water, Wastewater, & Seawater
 Document: AND Sol Env 08 2013 Environmental Water Testing: Surface Water, Groundwater, Hard Water, Wastewater, & Seawater Matrix specific sample preparation and testing methods for environmental waters
Organophosphate Pesticides as Pollutants of Urban Lakes and Streams
 Organophosphate Pesticides as Pollutants of Urban Lakes and Streams Anne Jones-Lee, PhD & G. Fred Lee, PhD, PE, DEE G. Fred Lee & Associates, El Macero, California Presented at North American Lake Management
Sandia National Laboratories New Mexico Wind Resource Assessment Lee Ranch
 Sandia National Laboratories New Mexico Wind Resource Assessment Lee Ranch Data Summary and Transmittal for September December 2002 & Annual Analysis for January December 2002 Prepared for: Sandia National
FACT SHEET STATEMENT OF BASIS HARLEY DOME 1 PRODUCED WATER TREATMENT FACILITY UPDES PERMIT NUMBER: UT0025917 NEW PERMIT MINOR INDUSTRIAL
 FACT SHEET STATEMENT OF BASIS HARLEY DOME 1 PRODUCED WATER TREATMENT FACILITY UPDES PERMIT NUMBER: NEW PERMIT MINOR INDUSTRIAL FACILITY CONTACTS Mitch Burroughs, Operator Mailing Address 1716 E. Lincoln
Maine Department of Environmental Protection Program Guidance On Combined Sewer Overflow Facility Plans
 Maine Department of Environmental Protection Program Guidance On Combined Sewer Overflow Facility Plans OVERVIEW The objective of a Combined Sewer Overflow (CSO) Facility Plan is to abate CSO discharges
WATER QUALITY CRITERIA
 ORNAMENTAL AQUATIC TRADE ASSOCIATION (OATA) WATER QUALITY CRITERIA Version 2.0 A Company Limited by Guarantee and Registered in England No 2738119 Registered Office Wessex House, 40 Station Road, Westbury,
A NOVEL ION-EXCHANGE/ELECTROCHEMICAL TECHNOLOGY FOR THE TREATMENT OF AMMONIA IN WASTEWATER
 A NOVEL ION-EXCHANGE/ELECTROCHEMICAL TECHNOLOGY FOR THE TREATMENT OF AMMONIA IN WASTEWATER ABSTRACT Leonard P. Seed, M.Sc., P.Eng., Enpar Technologies Inc. * Daren D. Yetman, A.Sc.T., Enpar Technologies
RETICULATED RECYCLED WATER SCHEMES OPERATIONAL CONSIDERATIONS. Duncan Wallis. RM Consulting Group
 RETICULATED RECYCLED WATER SCHEMES OPERATIONAL CONSIDERATIONS Paper Presented by: Duncan Wallis Author: Duncan Wallis, Senior Consultant, RM Consulting Group 72 nd Annual Water Industry Engineers and Operators
Tampa Bay Seawater Desalination Plant
 Tampa Bay Seawater Desalination Plant Project History How The Plant Works Desal Fun Facts 2575 Enterprise Road, Clearwater, FL 33763-1102 Phone: 727.796.2355 / Fax: 727.791.2388 www.tampabaywater.org Tampa
New River Cleanup. Progress & Emerging Threats
 C R W Q New River Cleanup Progress & Emerging Threats C B California Regional Water Quality Control Board- Colorado River Basin Jose L. Angel, Principal Engineer, Assistant Executive Officer 1 New River
Climate, Drought, and Change Michael Anderson State Climatologist. Managing Drought Public Policy Institute of California January 12, 2015
 Climate, Drought, and Change Michael Anderson State Climatologist Managing Drought Public Policy Institute of California January 12, 2015 Oroville Reservoir January 2009 Presentation Overview The Rules
COMPARISON OF FIXED & VARIABLE RATES (25 YEARS) CHARTERED BANK ADMINISTERED INTEREST RATES - PRIME BUSINESS*
 CHARTERED BANK ADMINISTERED INTEREST RATES - PRIME BUSINESS*") COMPARISON OF FIXED & VARIABLE RATES (25 YEARS) 2 Fixed Rates Variable Rates FIXED RATES OF THE PAST 25 YEARS AVERAGE RESIDENTIAL MORTGAGE LENDING RATE - 5 YEAR* (Per cent) Year Jan Feb Mar Apr May Jun
COMPARISON OF FIXED & VARIABLE RATES (25 YEARS) 2 Fixed Rates Variable Rates FIXED RATES OF THE PAST 25 YEARS AVERAGE RESIDENTIAL MORTGAGE LENDING RATE - 5 YEAR* (Per cent) Year Jan Feb Mar Apr May Jun
Chassahowitzka Headspring Restoration Project ERP Appendix 1 (Dredge Plan) Revisions
 Revisions") Chassahowitzka Headspring Restoration Project ERP Appendix 1 (Dredge Plan) Revisions Prepared for: Southwest Florida Water Management District 2379 Broad Street Brooksville, FL 34604-6899 Prepared by:
Chassahowitzka Headspring Restoration Project ERP Appendix 1 (Dredge Plan) Revisions Prepared for: Southwest Florida Water Management District 2379 Broad Street Brooksville, FL 34604-6899 Prepared by:
Active Treatment Systems
 Categories EC Erosion Control SE Sediment Control TC Tracking Control WE Wind Erosion Control Non-Stormwater NS Management Control Waste Management and WM Materials Pollution Control Legend: Primary Category
Differentiation Summary. Revolutionizing Water Clean-Up Opportunities
 Differentiation Summary Revolutionizing Water Clean-Up Opportunities NanoClear is a water clean-up process that affordably and efficiently converts salt, brackish or waste water into pure, usable water.
Natural and Advanced Treatment Systems for Wastewater Management at Municipal Solid Waste Disposal Site in Developing Countries
 Natural and Advanced Treatment Systems for Wastewater Management at Municipal Solid Waste Disposal Site in Developing Countries C. Chiemchaisri Department of Environmental Engineering, Kasetsart University
Calibration of Volumetric Glassware
 CHEM 311L Quantitative Analysis Laboratory Revision 2.3 Calibration of Volumetric Glassware In this laboratory exercise, we will calibrate the three types of glassware typically used by an analytical chemist;
MEPC 56/23 ANNEX 2 Page 1 ANNEX 2 RESOLUTION MEPC.162(56) Adopted on 13 July 2007
 Adopted on 13 July 2007") Page 1 RESOLUTION MEPC.162(56) Adopted on 13 July 2007 GUIDELINES FOR RISK ASSESSMENT UNDER REGULATION A-4 OF THE BWM CONVENTION (G7) THE MARINE ENVIRONMENT PROTECTION COMMITTEE, RECALLING Article 38(a)
Page 1 RESOLUTION MEPC.162(56) Adopted on 13 July 2007 GUIDELINES FOR RISK ASSESSMENT UNDER REGULATION A-4 OF THE BWM CONVENTION (G7) THE MARINE ENVIRONMENT PROTECTION COMMITTEE, RECALLING Article 38(a)
TREATMENT OF PHOSPHATE FERTILIZER PLANT WASTE WATER IN FLORIDA FOR DISCHARGE AND RE USE PURPOSES
 TREATMENT OF PHOSPHATE FERTILIZER PLANT WASTE WATER IN FLORIDA FOR DISCHARGE AND RE USE PURPOSES JOHN F. BOSSLER, SIEMENS Water Technologies Corp., Hoffman Estates, IL RONALD TRAVIS, SIEMENS Water Technologies
Sources to Seafood: Mercury Pollution in the Marine Environment Background on Presenting Scientists
 Celia Y. Chen, Ph.D Dartmouth College Research Professor Department of Biological Sciences Class of '78 Life Sciences Center HB 6044 Hanover, NH 03755 (603)646 2376 Celia.chen@dartmouth.edu Dr. Celia Chen
1 Quality Assurance and Quality Control Project Plan
 1 Quality Assurance and Quality Control Project Plan The purpose of this section is to describe the quality assurance/quality control program that will be used during the system specific field testing
ART Vulnerability and Risk Assessment Report September 2012 Appendix C. ART GIS Exposure Analysis
 Adapting to Rising Tides GIS Exposure Analysis The aim of this appendix is to familiarize the reader with the data and methodology that was used to conduct an analysis of shoreline and community asset
A User s Guide for the Ambient Water Quality Guidelines for Cadmium
 A User s Guide for the Ambient Water Quality Guidelines for Cadmium What is a Water Quality Guideline? The British Columbia Ministry of Environment develops ambient water quality guidelines (WQGs) to assess
This example of a completed sampling plan worksheet has been included to illustrate the information
 APPENDIX B EXAMPLE OF A COMPLETED SAMPLING PLAN WORKSHEET This example of a completed sampling plan worksheet has been included to illustrate the information necessary to document a sampling program for
Climatography of the United States No. 20 1971-2000
 Climate Division: CA 6 NWS Call Sign: SAN Month (1) Min (2) Month(1) Extremes Lowest (2) Temperature ( F) Lowest Month(1) Degree s (1) Base Temp 65 Heating Cooling 100 Number of s (3) Jan 65.8 49.7 57.8
Analysis of Total Suspended Solids and Dissolved Oxygen Concentrations of the Algal- Bacterial Selenium Removal (ABSR) system.
 system.") Analysis of Total Suspended Solids and Dissolved Oxygen Concentrations of the Algal- Bacterial Selenium Removal (ABSR) system Veasna Hang Abstract The Algal-Bacterial Selenium Removal (ABSR) system has
Analysis of Total Suspended Solids and Dissolved Oxygen Concentrations of the Algal- Bacterial Selenium Removal (ABSR) system Veasna Hang Abstract The Algal-Bacterial Selenium Removal (ABSR) system has
Addressing Declining Elevations in Lake Mead
 Integrated Resource Planning Advisory Committee July 23, 2014 Addressing Declining Elevations in Lake Mead 1 Meeting Topics Drought update Attribute finalization Interbasin Cooperation Intake Pumping Station
CONSTRUCTION GENERAL PERMIT RISK ASSESSMENT R-FACTOR CALCULATION NOTIFICATION
 CONSTRUCTION GENERAL PERMIT RISK ASSESSMENT R-FACTOR CALCULATION NOTIFICATION NATIONAL POLLUTANT DISCHARGE ELIMINATION SYSTEM (NPDES) GENERAL PERMIT FOR STORM WATER DISCHARGES ASSOCIATED WITH CONSTRUCTION
Surviving the Storm Economic impacts of an acute flooding event in the Bay Area. Downtown San Anselmo. 2006 New Years Flood
 Surviving the Storm Economic impacts of an acute flooding event in the Bay Area. Downtown San Anselmo. 2006 New Years Flood Bay Area Council Water Committee: ABAG, BCDC, BART, SFO, Port of SF, Port of
4.0 EXPERIMENT ON DETERMINATION OF CHLORIDES
 4.0 EXPERIMENT ON DETERMINATION OF CHLORIDES Sl. No. Contents Preamble 4.1 Aim 4.2 Introduction 4.2.1 Environmental Significance 4.3 Principle 4.4 Materials Required 4.4.1 Apparatus Required 4.4.2 Chemicals
Chloride and Salinity
 INTRODUCTION Chloride Chloride and Chloride, in the form of the Cl ion, is one of the major inorganic anions, or negative ions, in saltwater and freshwater. It originates from the dissociation of salts,
Presented below are water quality standards that are in effect for Clean Water Act purposes.
 Presented below are water quality standards that are in effect for Clean Water Act purposes. EPA is posting these standards as a convenience to users and has made a reasonable effort to assure their accuracy.
Enhanced Vessel Traffic Management System Booking Slots Available and Vessels Booked per Day From 12-JAN-2016 To 30-JUN-2017
 From -JAN- To -JUN- -JAN- VIRP Page Period Period Period -JAN- 8 -JAN- 8 9 -JAN- 8 8 -JAN- -JAN- -JAN- 8-JAN- 9-JAN- -JAN- -JAN- -JAN- -JAN- -JAN- -JAN- -JAN- -JAN- 8-JAN- 9-JAN- -JAN- -JAN- -FEB- : days
Membrane Filtration Technology: Meeting Today s Water Treatment Challenges
 Membrane Filtration Technology: Meeting Today s Water Treatment Challenges Growing global demand for clean water and increasing environmental concerns make membrane filtration the technology of choice
4.2 Option 1 Expand Existing Lagoon System
 4. WASTEWATER TREATMENT SYSTEM 4.1 of Existing Lagoons The of existing lagoon system is evaluated for future demand based on the following requirements. Existing Lagoons Anaerobic cells - Four Cells, of
OPTIMIZING BIOLOGICAL PHOSPHORUS REMOVAL FROM AN SBR SYSTEM MIDDLEBURY, VT. Paul Klebs, Senior Applications Engineer Aqua-Aerobic Systems, Inc.
 OPTIMIZING BIOLOGICAL PHOSPHORUS REMOVAL FROM AN SBR SYSTEM ABSTRACT MIDDLEBURY, VT Paul Klebs, Senior Applications Engineer Aqua-Aerobic Systems, Inc. The Middlebury Wastwater Treatment Plant, located
Facing The Challenges In Houston s Water System: Past, Present, and Future
 Facing The Challenges In Houston s Water System: Past, Present, and Future Jun Chang, P.E. D.WRE Deputy Director Department of Public Works and Engineering Presented to HCEC February 17, 2012 Past Regulatory
Cyanobacteria, Toxins and Indicators. Field Monitoring Treatment Facility Monitoring Treatment Studies
 U.S. Environmental Projection Agency, Office of Research and Development Cyanobacteria, Toxins and Indicators Field Monitoring Treatment Facility Monitoring Treatment Studies Nicholas Dugan, Toby Sanan,
Sewerage Management System for Reduction of River Pollution
 Sewerage Management System for Reduction of River Pollution Peter Hartwig Germany Content page: 1 Introduction 1 2 Total emissions 3 3 Discharge from the wastewater treatment plants 4 4 Discharge from
The concepts developed in this standard include the following: Oceans cover about 70% of the surface of the Earth.
 Name Date Grade 5 SOL 5.6 Review Oceans Made by SOLpass - www.solpass.org solpass100@comcast.net Reproduction is permitted for SOLpass subscribers only. The concepts developed in this standard include
Cadmium Reduction Method Method 8039 0.3 to 30.0 mg/l NO 3 N (HR) Powder Pillows or AccuVac Ampuls
 Powder Pillows or AccuVac Ampuls") Nitrate DOC316.53.01066 Cadmium Reduction Method Method 8039 0.3 to 30.0 mg/l NO 3 N (HR) Powder Pillows or AccuVac Ampuls Scope and application: For water, wastewater and seawater. Test preparation Instrument-specific
Nitrate DOC316.53.01066 Cadmium Reduction Method Method 8039 0.3 to 30.0 mg/l NO 3 N (HR) Powder Pillows or AccuVac Ampuls Scope and application: For water, wastewater and seawater. Test preparation Instrument-specific
DATA EVALUATION REPORT. STUDY TYPE: Acute Toxicity Study- Earthworm (OECD Guideline 207)
") Reviewer: Gail Tomimatsu, Ph.D. Date: Microbial Pesticides Branch Secondary Reviewer: Zigfridas Vaituzis, Ph.D. Microbial Pesticides Branch Date: Biopesticides and Pollution Prevention Division Phil Hutton,
Reviewer: Gail Tomimatsu, Ph.D. Date: Microbial Pesticides Branch Secondary Reviewer: Zigfridas Vaituzis, Ph.D. Microbial Pesticides Branch Date: Biopesticides and Pollution Prevention Division Phil Hutton,
NJWMC Continuous Monitoring Inventory & DEP s Continuous Monitoring
 NJWMC Continuous Monitoring Inventory & DEP s Continuous Monitoring Leslie McGeorge NJ Department of Environmental Protection Water Monitoring and Standards Presented at: NJ Water Monitoring Council Meeting
ICON Analyzer. Dedicated online photometer for water and wastewater analysis
 ICON Analyzer Dedicated online photometer for water and wastewater analysis Straightforward online water monitoring 02 If there is one thing that everybody depends on, it is water. We drink it every day.
Climatography of the United States No. 20 1971-2000
 Climate Division: CA 4 NWS Call Sign: Month (1) Min (2) Month(1) Extremes Lowest (2) Temperature ( F) Lowest Month(1) Degree s (1) Base Temp 65 Heating Cooling 1 Number of s (3) Jan 59.3 41.7 5.5 79 1962
The Climate of Oregon Climate Zone 2 Willamette Valley
 /05 E-55 No. ci oi Unbound issue e2_, Does not circulate Special Report 914 May 1993 The Climate of Oregon Climate Zone 2 Property of OREGON STATE UNIVERSITY Library Serials Corvallis, OR 97331-4503 Agricultural
Swamp Area Passive Treatment System Kettle Creek Watershed, Clinton County, PA
 Swamp AMD Chemistry Swamp Area Passive Treatment System Kettle Creek Watershed, Clinton County, PA A Technical Report for Trout Unlimited and the Kettle Creek Watershed Association Prepared by Hedin Environmental
Regulatory Options for Membrane Treatment and Residuals Management
 Regulatory Options for Membrane Treatment and Residuals Management Background Over a period of several years, Colorado s Water Quality Control Division (Division) received requests for discharge permits
Dissolved and precipitated oxalate
 Accepted 2005 Process liquors from bleach plants Dissolved and precipitated oxalate Using Ion Chromatography 0 Introduction In bleach plants of pulp mills with a high degree of system closure, there is
Color, True and Apparent
 Color, True and Apparent DOC316.53.01037 Platinum-Cobalt Standard Method 1, 2, 3 Method 8025 15 to 500 color units Scope and application: For water, wastewater and seawater; equivalent to NCASI method
RESTORATION AND ENHANCEMENT OF SOUTHERN CALIFORNIA LAGOONS
 RESTORATION AND ENHANCEMENT OF SOUTHERN CALIFORNIA LAGOONS by Hany Elwany, Ph.D. Scripps Institution of Oceanography Headwaters to Oceans Conference 25 October 2003 CE Ref #03-22 San Diego County Lagoons
Welcome to the Understanding Dissolved Oxygen learning module. This section provides information on the following topics:
 Introduction Welcome to the learning module. This section provides information on the following topics: How dissolved oxygen is defined and measured in numbers Why dissolved oxygen is important Natural
Water and Wastewater. Sample Collection and Analysis
 Water and Wastewater Sample Collection and Analysis December 2011 Introduction Accurate testing of drinking water is crucial to maintaining the health and safety of Islanders who rely on this resource.
MONITORING THE RECOVERY OF STREAMS IN THE SAN GABRIEL MOUNTAINS (CA) FOLLOWING THE LARGEST WILDFIRE IN LOS ANGELES COUNTY HISTORY: STATION FIRE - 2009
 FOLLOWING THE LARGEST WILDFIRE IN LOS ANGELES COUNTY HISTORY: STATION FIRE - 2009") MONITORING THE RECOVERY OF STREAMS IN THE SAN GABRIEL MOUNTAINS (CA) FOLLOWING THE LARGEST WILDFIRE IN LOS ANGELES COUNTY HISTORY: STATION FIRE - 2009 Karin Patrick, Aquatic Bioassay & Consulting, Inc.
MONITORING THE RECOVERY OF STREAMS IN THE SAN GABRIEL MOUNTAINS (CA) FOLLOWING THE LARGEST WILDFIRE IN LOS ANGELES COUNTY HISTORY: STATION FIRE - 2009 Karin Patrick, Aquatic Bioassay & Consulting, Inc.
Environmental Benefits of Pervious Concrete
 Environmental Benefits of Pervious Concrete Concrete Can Be Recycled When the time comes to demolish a concrete structure or pavement, the material need not be wasted. It can be crushed and used as aggregate,
Sea Water Heat Pump Project
 Sea Water Heat Pump Project Alaska SeaLife Center, Seward, AK Presenter: Andy Baker, PE, YourCleanEnergy LLC Also Present is ASLC Operations Manager: Darryl Schaefermeyer ACEP Rural Energy Conference Forum
Generating Water Quality and Climate Data at DSM2 Boundaries for Temperature and Dissolved Oxygen Studies of the Delta. Hari Rajbhandari, Ph.D., P.E.
 Generating Water Quality and Climate Data at DSM2 Boundaries for Temperature and Dissolved Oxygen Studies of the Delta California Water and Environmental Modeling Forum Asilomar March 1-3, 2005 Hari Rajbhandari,
Color, True and Apparent
 Color, True and Apparent DOC316.53.01037 Platinum-Cobalt Standard Method 1, 2, 3 Method 8025 15 to 500 color units 5 to 500 color units (low range technique) Scope and application: For water, wastewater
Analysis One Code Desc. Transaction Amount. Fiscal Period
 Analysis One Code Desc Transaction Amount Fiscal Period 57.63 Oct-12 12.13 Oct-12-38.90 Oct-12-773.00 Oct-12-800.00 Oct-12-187.00 Oct-12-82.00 Oct-12-82.00 Oct-12-110.00 Oct-12-1115.25 Oct-12-71.00 Oct-12-41.00
SECTION 3.2 CLIMATE AND PRECIPITATION
 SECTION 3.2 CLIMATE AND PRECIPITATION Ulster County Climate Data A preliminary analysis of the Preserve s weather data shows that the average temperature has risen about two degrees over the past 114 years.
Nitrate and Nitrite Removal from Municipal Drinking Water Supplies with Electrodialysis Reversal
 Technical Paper Nitrate and Nitrite Removal from Municipal Drinking Water Supplies with Electrodialysis Reversal Authors: Ted Prato and Richard G. Parent, Ionics Reprinted from Proceedings of 1993 AWWA
Troubleshooting Your RO
 Troubleshooting Your RO Summary: There can be many reasons why a RO system suffers a loss in performance, and is unable to produce the proper quantity and/or quality of permeate water. Similar to a doctor
DMR-QA Planning Guide 2015 DMR-QA 35: Plan for Success
 DMR-QA Planning Guide 2015 DMR-QA 35: Plan for Success [ THE INDUSTRY STANDARD ] Your Partner In Defensible Data We understand that the art of our superior service is just as important as the science of
Facility Classification Standards
 Facility Classification Standards Approval Date: April 3, 2009 Effective Date: April 3, 2009 Approved By: Nancy Vanstone, Deputy Minister Version Control: Replaces Facility Classification Standards dated
Comparison of the Effects of Increased CO 2 in the Air to Seawater and Distilled Water
 http://www.carboschools.org Comparison of the Effects of Increased CO 2 in the Air to Seawater and Distilled Water The majority of the earth s surface is covered with water (70%) and only 3% of this is
5.0 EXPERIMENT ON DETERMINATION OF TOTAL HARDNESS
 5.0 EXPERIMENT ON DETERMINATION OF TOTAL HARDNESS Sl. No. Contents Preamble 5.1 Aim 5.2 Introduction 5.2.1 Environmental Significance 5.3 Principle 5.4 Materials Required 5.4.1 Apparatus Required 5.4.2
Part B Integrated Monitoring Design for Comprehensive Assessment and Identification of Impaired Waters Contents
 Part B Integrated Monitoring Design for Comprehensive Assessment and Identification of Impaired Waters Contents Chapter 10. Selecting Metrics or Indicators of WQS Attainment... 10-2 Chapter 11. Monitoring
The Influence of Carbon Dioxide on Algae Growth
 The Influence of Carbon Dioxide on Algae Growth The first objective of this experiment is to show that increased atmospheric concentrations of carbon dioxide, CO 2, can stimulate algae growth. The second
GROUND WATER CONTAMINATION INFORMATION
 Ohio Department of Natural Resources Division of Oil and Gas Resources Management GROUND WATER CONTAMINATION INFORMATION Presence of Salty Water The salt that is normally found in contaminated water wells
Case 2:08-cv-02463-ABC-E Document 1-4 Filed 04/15/2008 Page 1 of 138. Exhibit 8
 Case 2:08-cv-02463-ABC-E Document 1-4 Filed 04/15/2008 Page 1 of 138 Exhibit 8 Case 2:08-cv-02463-ABC-E Document 1-4 Filed 04/15/2008 Page 2 of 138 Domain Name: CELLULARVERISON.COM Updated Date: 12-dec-2007
Water Year 2001 in Northern California: Have the Good Years Ended?
 Water Year 21 in Northern California: Have the Good Years Ended? Maurice Roos Abstract For the second water season in a row, precipitation and snowpack accumulation from October through December were far
Well Water Iron Removal Using Quantum DMI-65 Granular Filter Media
 Well Water Iron Removal Using Quantum DMI-65 Granular Filter Media ASME Research Committee Power Plant and Environmental Chemistry Overland Park, Kansas April 2-4, 2007 Prepared by: W. H. Stroman Primary
Coating and Extraction of Honeycomb Denuders
 QSM Approval: Coating and Extraction of Honeycomb Denuders 1 INTRODUCTION 1.1 The following procedures are used for the coating of honeycomb denuders with citric acid and sodium carbonate solutions, and
STATE OF CALIFORNIA CALIFORNIA REGIONAL WATER QUALITY CONTROL BOARD LOS ANGELES REGION
 STATE OF CALIFORNIA CALIFORNIA REGIONAL WATER QUALITY CONTROL BOARD LOS ANGELES REGION ORDER NO. R4-2003-0142 WASTE DISCHARGE REQUIREMENTS FOR WESTERN LOS ANGELES COUNTY COUNCIL, INC. BOY SCOUTS OF AMERICA
Dissolved Mineral Radioactivity in Drinking Water
 WD-WSEB-3-11 2004 Dissolved Mineral Radioactivity in Drinking Water General New Hampshire's bedrock contains naturally occurring radioactivity. A few examples with health importance include radon, radium
Total Suspended Solids Total Dissolved Solids Hardness
 Total Suspended Solids (TSS) are solids in water that can be trapped by a filter. TSS can include a wide variety of material, such as silt, decaying plant and animal matter, industrial wastes, and sewage.
VALLEY WATER MANAGEMENT COMPANY 7500 MEANY AVE. BAKERSFIELD, CALIFORNIA 93308
 TELEPHONE (661) 410-7500 FAX [661) 410-7506 VALLEY WATER MANAGEMENT COMPANY 7500 MEANY AVE. BAKERSFIELD, CALIFORNIA 93308 April 18,2014 Ms. Betty Yee Central Valley Regional Water Quality Control Board
Pajaro River Watershed Integrated Regional Water Management Plan Update Project Solicitation Form
 Pajaro River Watershed Integrated Regional Water Management Plan Update PROJECT OVERVIEW General Project Information Project Title: Corralitos Creek Water Supply and Fisheries Enhancement Project Project
INFORMATION SHEET ORDER NO. R5-2011-XXXX TRIANGLE ROCK PRODUCTS, INC. FLORIN ROAD AGGREGATE PLANT SACRAMENTO COUNTY
 ORDER NO. R5-2011-XXXX INFORMATION SHEET Background Triangle Rock, Inc. (Discharger) submitted a Report of Waste Discharge (RWD) on 23 August 2010. The Discharger is expanding the mining operations at
Wastewater Reuse. Typical treated wastewater is:
 Wastewater Reuse Most metal finishing industries have in-house wastewater treatment to economically dispose of the acids, alkali, oils, and dissolved metals in the rinse water and occasional tank solution
WASTEWATER TREATMENT OBJECTIVES
 WASTEWATER TREATMENT OBJECTIVES The student will do the following: 1. Define wastewater and list components of wastewater. 2. Describe the function of a wastewater treatment plant. 3. Create a wastewater
Bay Park Sewage Treatment Plant Super Storm Sandy Recovery
 County of Nassau Department of Public Works Bay Park Sewage Treatment Plant Super Storm Sandy Recovery Edward P. Mangano County Executive Shila Shah-Gavnoudias, P.E. Commissioner of Public Works Bay Park
Notification Requirements for CMSA NPDES Permit Exceedances and Collection System Sanitary Sewer Overflows Date: April 2, 2008 (Revised July 10, 2012)
") Requirements for CMSA NPDES Permit Exceedances and Collection System Sanitary Sewer Overflows Date: April 2, 2008 (Revised July 10, 2012) 1. Purpose To outline the Agency s notification and reporting requirements
Requirements for CMSA NPDES Permit Exceedances and Collection System Sanitary Sewer Overflows Date: April 2, 2008 (Revised July 10, 2012) 1. Purpose To outline the Agency s notification and reporting requirements
AQUATIC ECOSYSTEMS & BIOMES
 AQUATIC ECOSYSTEMS & BIOMES A) Name three general types of aquatic ecosystems and describe the salinity for each. Give an example for each. 1) 2) 3) B) MATCHING In the space provided, write the letter
Lecture Slides Handout
 Distance Learning Program - Environmental Management http://courses.dce.harvard.edu/~environment/e101 Environmental Management ENVR E-101 - CRN 11925 Environmental Management course materials adapted for
Purpose of the water security outlook
 Water Security Outlook December 2015 Purpose of the water security outlook The Water Security Outlook (WSO) is an annual update to Barwon Water s Water Supply Demand Strategy (WSDS), published in 2012.
Water Quality in College Creek, Annapolis, MD, 2003-2009 Dr. Peter Bergstrom, NOAA Chesapeake Bay Office, FINAL 10/22/09
 Methods Water Quality in College Creek, Annapolis, MD, 2003-2009 Dr. Peter Bergstrom, NOAA Chesapeake Bay Office, FINAL 10/22/09 A State Highway Administration contractor, ESA, sampled water quality once
Science to Support Nutrient Management in San Francisco Bay. David Senn San Francisco Estuary Institute davids@sfei.org
 Science to Support Nutrient Management in San Francisco Bay David Senn San Francisco Estuary Institute davids@sfei.org Outline - Background - 2012 Activities Develop Nutrient Science Strategy High priority