Item Analysis for Key Validation Using MULTILOG. American Board of Internal Medicine Item Response Theory Course
|
|
|
- Robert Taylor
- 8 years ago
- Views:
Transcription
1 Item Analysis for Key Validation Using MULTILOG American Board of Internal Medicine Item Response Theory Course

2 Overview Analysis of multiple choice item responses using the Nominal Response Model (Bock, 1972). The NRM can be estimated using Multilog.
.")
3 Multilog The Multilog gprogram estimates the parameters of several IRT models for polytomous data: Graded Response Model Nominal Response Model Multiple Choice Model (Thissen and Steinberg, 1984) Like BILOG-MG and PARSCALE, Multilog was written specifically for IRT analyses, so estimation is very fast and efficient. Much of the syntax for Multilog is similar in syntax to that of BILOG-MG and PARSCALE.

4 Fitting the Nominal Response Model in Multilog

5 Multilog Example To demonstrate how to use Multilog to produce estimates of the NRM, we will use data from: A 20-item test (simulated for demonstration purposes). Each item had four score categories. Analysis of each item s distracter options will happen. 1,000 examinees took the test.

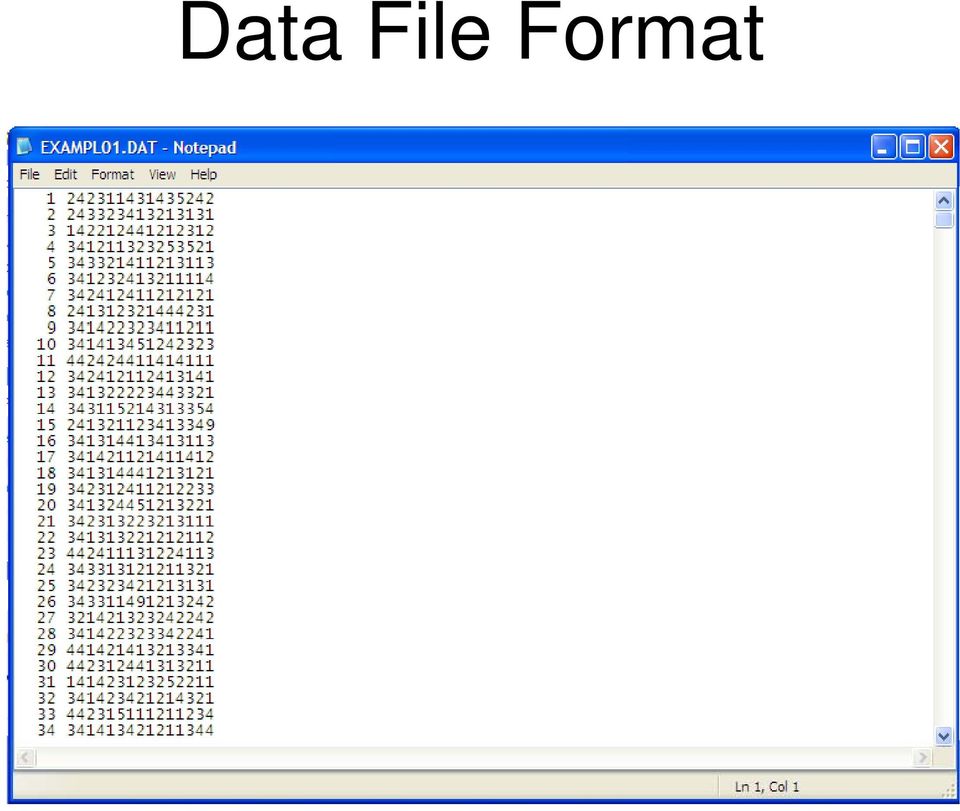
6 First Step: Data File Formats Prior to using Multilog we must set our data into a useable form for the program. For our example data, we will the same file used in our BILOG-MG example. The file had the response option selected by each examinee. In BILOG-MG, we needed a key file to score each examinee s repsonse profile. Unlike BILOG-MG, an answer key is not needed. Just the option each examinee selected for each item.

7 Data File Format
8 Running Multilog Multilog is a script-based program that features a graphical system to help set up the script files. To get started, open Multilog. Start All Programs Multilog 7.03 Multilog 7.03

9 Creating Multilog Script To begin, we will run the NRM on the example data. Click on File New. This will create a new *.mlg file containing the script that will run the analysis. Be sure to place the script in a folder that has fewer than 80 characters total (perhaps on the root drive directly).

10 Multilog Script NRM example...distractor analysis. >PROBLEM RANDOM, INDIVIDUAL, NITEMS=15, NGROUPS=1, NEXAMINEES=1000, NCHAR=5,DATA='EXAMPL01.DAT'; >TEST ALL, NOMINAL, NC=(6(0)15), HIGH=(5,5,5,5,5,5,5,5,5,5,5,5,5,5,5); >SAVE FORMAT; >ESTIMATE NC=2500; >TGROUPS NU=10 QP=(-4.5(1.00)4.5); >END; (5A1,15A1)
4.")
11 Multilog Script, Annotated The initial portion of the script contains the name of the analysis NRM example...distractor analysis. Unlike BILOG and PARSCALE, a comment section cannot be included. All other command sections must start with a > and be terminated by a ;

12 PROBLEM Command Line >PROBLEM RANDOM, INDIVIDUAL, NITEMS=15, NGROUPS=1, NEXAMINEES=1000, NCHAR=5,DATA='EXAMPL01.DAT'; DAT' The PROBLEM command supplies the general information used by the Multilog program (like the GLOBAL line in BILOG-MG). RANDOM specifies that both item and examinee parameters are to be estimated. INDIVIDUAL specifies that the data are in the form of individual response vectors (can have aggregated data, too). NITEMS specifies the number of items. NGROUPS specifies the number of groups. NEXAMINEES specifies the number of examinees. NCHAR specifies the number of characters in the ID string. DATA provides the name of the data file for the analysis.
. NITEMS specifies the number of items.")
13 SAVE Command Line >SAVE FORMAT; The SAVE command instructs Multilog to save estimated parameters to files. FORMAT will write the file in a useable format.

14 ESTIMATE Command Line >ESTIMATE NC=2500; The ESTIMATE command supplies the estimation specifics for the program. NC specifies the maximum of EM algorithm iteration cycles.

15 TGROUPS Command Line >TGROUPS NU=10 QP=(-4.5(1.00)4.5); The TGROUPS command supplies the number and location of the theta quadrature points. NU specifies the number of quadrature points. QP gives the location of the points.

16 END Command Line >END; The END command tells Multilog that the command part of the syntax has terminated. More syntax is needed still: The mapping of category codes to response parameters. The variable format statement.

17 Response Mapping Syntax The response mapping provides the key for Multilog to map the character responses in the data file to those which will be modeled by the NRM. The 6 gives the number of response options. The gives the actual options. Each line after that codes each of the 15 items into a response for each.

18 Variable Format Statement (4A1,1X,15A1) The variable format statement is a required statement that lists the way the data are stored in the data file. This statement uses FORTRAN-like syntax for reading data from files. The first statement, 4A1, lets BILOG know there is a column of data for the examinee id files. 4A1 gives the information that the column has a width of four characters. The 1X states that there is an empty column between the examinee id and the data. The 15A1 states the data are contained in the next 15 columns, each with zero breaks in between.

19 Running Multilog Now that the syntax has been created, the Multilog program must be run. Multilog runs in single phase. To run the analysis: Save the input script file first. Click on Run Run What should happen after you run the Multilog analysis. After a few minutes, you will hopefully see a set of text files pop-up in the Multilog window saying things completed successfully. Other times a pop-up p p box will appear that indicates an error within the program. Debugging can be difficult in Multilog.

20 Multilog Output To view the output from the Multilog session click on View and select the only option (named after your syntax file name, but ending with.out). An example from one item s output is shown on the next slide.

21 Multilog Item Output ITEM 12: 6 NOMINAL CATEGORIES, 5 HIGH CATEGORY(K): A(K) C(K) Item Parameter Estimates CONTRAST-COEFFICIENTS (STANDARD ERRORS) FOR: A C CONTRAST P(#) COEFF.[ DEV.] P(#) COEFF.[ DEV.] (0.15) (0.13) (0.18) (0.15) (0.18) (0.15) (0.61) (0.52) (0.20) INFORMATION: (Theta values increase in steps of 0.2) OBSERVED AND EXPECTED COUNTS/PROPORTIONS IN CATEGORY(K): OBS. FREQ OBS. PROP OBS. PROP EXP. PROP
22 Viewing Item Parameters Multilog makes viewing the item parameters a bit easier with the inclusion of IRT Graphics, a package for plotting the estimated IRFs. To view some of the item results: Close the output window (the lower x at the top right). Go to Run Plot. The IRT Graphics program should open.
23 IRT Graphics To view the item parameter results, click on the ICC button (at the top right). For each item, the ICC is plotted.
24 IRT Graphics Example Item Characteristic Curve: 5 Nominal Response Model Probability Ability Category legends Item: 5 Solid Lines: 1= Black 2= Blue 3= Magenta 4= Green 5= Red Dotted Lines: 6= Black (High Category: 5)
25 IRT Graphics Interpretation Consider Item 5 Here, the correct option was Category #4. Category # 4 is the most likely response option when theta values are high. Category #2 is more often selected when theta values are low. Probab bility Item Characteristic Curve: 5 Nominal Response Model Ability Category legends Item: 5 Solid Lines: 1= Black 2= Blue 3= Magenta 4= Green 5= Red Dotted Lines: 6= Black (High Category: 5)
26 Conclusion This afternoon s introduction to Multilog scratched the surface of the things the program can accomplish. The NRM can be fit using Multilog. Distracter analyses are one outcome of the NRM.
27 Next Transforming Cutscores into Theta Values. Standard setting. Score reporting.
Keith A. Boughton, Don A. Klinger, and Mark J. Gierl. Center for Research in Applied Measurement and Evaluation University of Alberta
 Effects of Random Rater Error on Parameter Recovery of the Generalized Partial Credit Model and Graded Response Model Keith A. Boughton, Don A. Klinger, and Mark J. Gierl Center for Research in Applied
Petrel TIPS&TRICKS from SCM
 Petrel TIPS&TRICKS from SCM Maps: Knowledge Worth Sharing Map Annotation A map is a graphic representation of some part of the earth. In our industry, it may represent either the surface or sub surface;
Introduction to SPSS 16.0
 Introduction to SPSS 16.0 Edited by Emily Blumenthal Center for Social Science Computation and Research 110 Savery Hall University of Washington Seattle, WA 98195 USA (206) 543-8110 November 2010 http://julius.csscr.washington.edu/pdf/spss.pdf
Package EstCRM. July 13, 2015
 Version 1.4 Date 2015-7-11 Package EstCRM July 13, 2015 Title Calibrating Parameters for the Samejima's Continuous IRT Model Author Cengiz Zopluoglu Maintainer Cengiz Zopluoglu
HOW TO SET UP SINGLE SIGN ON FOR PARENT PORTAL IN POWERSCHOOL
 HOW TO SET UP SINGLE SIGN ON FOR PARENT PORTAL IN POWERSCHOOL Before you can access your student(s) information, you MUST create your account which ties you to your student(s). Even if you have your user
UPS System Capacity Management Configuration Utility
 StruxureWare Power Monitoring 7.0 UPS System Capacity Management Configuration Utility User Guide UPS System Capacity Management Configuration Utility This document provides an overview of the StruxureWare
Importing and Exporting With SPSS for Windows 17 TUT 117
 Information Systems Services Importing and Exporting With TUT 117 Version 2.0 (Nov 2009) Contents 1. Introduction... 3 1.1 Aim of this Document... 3 2. Importing Data from Other Sources... 3 2.1 Reading
Beginner s Matlab Tutorial
 Christopher Lum lum@u.washington.edu Introduction Beginner s Matlab Tutorial This document is designed to act as a tutorial for an individual who has had no prior experience with Matlab. For any questions
Microsoft Windows PowerShell v2 For Administrators
 Course 50414B: Microsoft Windows PowerShell v2 For Administrators Course Details Course Outline Module 1: Introduction to PowerShell the Basics This module explains how to install and configure PowerShell.
Working With Animation: Introduction to Flash
 Working With Animation: Introduction to Flash With Adobe Flash, you can create artwork and animations that add motion and visual interest to your Web pages. Flash movies can be interactive users can click
Engineering Problem Solving and Excel. EGN 1006 Introduction to Engineering
 Engineering Problem Solving and Excel EGN 1006 Introduction to Engineering Mathematical Solution Procedures Commonly Used in Engineering Analysis Data Analysis Techniques (Statistics) Curve Fitting techniques
Programming with the Dev C++ IDE
 Programming with the Dev C++ IDE 1 Introduction to the IDE Dev-C++ is a full-featured Integrated Development Environment (IDE) for the C/C++ programming language. As similar IDEs, it offers to the programmer
Video Scripts for View Account Summary and Balances. Slide 1. Audio: No Audio. Page 1 of 13
 Slide 1 Page 1 of 13 Slide 2 Your home page for Online Banking displays automatically when you log into Online Banking, providing you with quick and easy access to your most common online banking tasks.
InfiniteInsight 6.5 sp4
 End User Documentation Document Version: 1.0 2013-11-19 CUSTOMER InfiniteInsight 6.5 sp4 Toolkit User Guide Table of Contents Table of Contents About this Document 3 Common Steps 4 Selecting a Data Set...
SPSS Workbook 1 Data Entry : Questionnaire Data
 TEESSIDE UNIVERSITY SCHOOL OF HEALTH & SOCIAL CARE SPSS Workbook 1 Data Entry : Questionnaire Data Prepared by: Sylvia Storey s.storey@tees.ac.uk SPSS data entry 1 This workbook is designed to introduce
Your Personal Trading Journal
 Your Personal Trading Journal This guide provides instructions for the setup and helps you getting started with your Edgewonk trading journal. It is recommended that you read it thoroughly to fully leverage
The following is an overview of lessons included in the tutorial.
 Chapter 2 Tutorial Tutorial Introduction This tutorial is designed to introduce you to some of Surfer's basic features. After you have completed the tutorial, you should be able to begin creating your
Learning Objective. Purpose The purpose of this activity is to give you the opportunity to learn how to set up a database and upload data.
 Creating a Simple Database: Now with PostgreSQL 8 We are going to do the simple exercise of creating a database, then uploading the TriMet files from Activity 6. In the next activity, you will use SQL
IBM SPSS Statistics 20 Part 4: Chi-Square and ANOVA
 CALIFORNIA STATE UNIVERSITY, LOS ANGELES INFORMATION TECHNOLOGY SERVICES IBM SPSS Statistics 20 Part 4: Chi-Square and ANOVA Summer 2013, Version 2.0 Table of Contents Introduction...2 Downloading the
Getting Started with R and RStudio 1
 Getting Started with R and RStudio 1 1 What is R? R is a system for statistical computation and graphics. It is the statistical system that is used in Mathematics 241, Engineering Statistics, for the following
Creating a Project with PSoC Designer
 Creating a Project with PSoC Designer PSoC Designer is two tools in one. It combines a full featured integrated development environment (IDE) with a powerful visual programming interface. The two tools
How to set up a scoring algorithm and automatic email triggers for Qualtrics measures
 How to set up a scoring algorithm and automatic email triggers for Qualtrics measures Purpose: This is a useful tool for prescreening participants for Sona. In Sona you can direct the participants to the
4 Other useful features on the course web page. 5 Accessing SAS
 1 Using SAS outside of ITCs Statistical Methods and Computing, 22S:30/105 Instructor: Cowles Lab 1 Jan 31, 2014 You can access SAS from off campus by using the ITC Virtual Desktop Go to https://virtualdesktopuiowaedu
4. You must link at least one student before you can create a user profile for yourself.
 PowerSchool Parent and Student Access Website 1. Sign into the Peace Wapiti PowerSchool Public Access Website at https://sis.pwsd76.ab.ca/public 2. Click Create Account 3. Fill in the information on the
IRA Pivot Table Review and Using Analyze to Modify Reports. For help, email Financial.Reports@dartmouth.edu
 IRA Pivot Table Review and Using Analyze to Modify Reports 1 What is a Pivot Table? A pivot table takes rows of detailed data (such as the lines in a downloadable table) and summarizes them at a higher
DS-0321 FFT Analysis Software Operation manual Basic operation procedure for Configuration Setting
 DS-0321 FFT Analysis Software Operation manual Basic operation procedure for Configuration Setting ONO SOKKI CO., LTD. The Configuration window is used to make various settings and operations of the DS-0321
CARD CUTTER MACHINE STUDENT.MANUAL
 CARD CUTTER MACHINE STUDENT.MANUAL Digital Fabrication Laboratory Hours 10am - 3pm (Monday-Friday) Email abp-fablab@unimelb.edu.au Contact 9035 8663 105A, First Floor, 757 Swanston st Faculty of Architecture
Otis Photo Lab Inkjet Printing Demo
 Otis Photo Lab Inkjet Printing Demo Otis Photography Lab Adam Ferriss Lab Manager aferriss@otis.edu 310.665.6971 Soft Proofing and Pre press Before you begin printing, it is a good idea to set the proof
MATLAB Workshop 14 - Plotting Data in MATLAB
 MATLAB: Workshop 14 - Plotting Data in MATLAB page 1 MATLAB Workshop 14 - Plotting Data in MATLAB Objectives: Learn the basics of displaying a data plot in MATLAB. MATLAB Features: graphics commands Command
MAS 500 Intelligence Tips and Tricks Booklet Vol. 1
 MAS 500 Intelligence Tips and Tricks Booklet Vol. 1 1 Contents Accessing the Sage MAS Intelligence Reports... 3 Copying, Pasting and Renaming Reports... 4 To create a new report from an existing report...
Using SQL Server Management Studio
 Using SQL Server Management Studio Microsoft SQL Server Management Studio 2005 is a graphical tool for database designer or programmer. With SQL Server Management Studio 2005 you can: Create databases
CPSrf Student User Manual
 Classroom Response System Pilot Project TUFTS COMPUTING & COMMUNICATIONS SERVICES TRAINING & DOCUMENTATION DEPARTMENT CPSrf Student User Manual Tufts Computing & Communications Services Training & Documentation
3. Programming the STM32F4-Discovery
 1 3. Programming the STM32F4-Discovery The programming environment including the settings for compiling and programming are described. 3.1. Hardware - The programming interface A program for a microcontroller
SPOC Instruction Guide
 SPOC Instruction Guide The following information should guide you through navigating NC AWWA-WEA s self-paced online course (SPOC) program. If you have additional questions please contact Nicole Banks
Exercise 1: Python Language Basics
 Exercise 1: Python Language Basics In this exercise we will cover the basic principles of the Python language. All languages have a standard set of functionality including the ability to comment code,
KaleidaGraph Quick Start Guide
 KaleidaGraph Quick Start Guide This document is a hands-on guide that walks you through the use of KaleidaGraph. You will probably want to print this guide and then start your exploration of the product.
Appendix 2.1 Tabular and Graphical Methods Using Excel
 Appendix 2.1 Tabular and Graphical Methods Using Excel 1 Appendix 2.1 Tabular and Graphical Methods Using Excel The instructions in this section begin by describing the entry of data into an Excel spreadsheet.
Manual to conduct a media visibility analysis with LexisNexis/SPSS (count number of articles)
") Manual to conduct a media visibility analysis with LexisNexis/SPSS (count number of articles) Rens Vliegenthart (May 16, 2012) Beta version please send comments to r.vliegenthart@uva.nl This manual is
Manual to conduct a media visibility analysis with LexisNexis/SPSS (count number of articles) Rens Vliegenthart (May 16, 2012) Beta version please send comments to r.vliegenthart@uva.nl This manual is
Online Test Monitor Certification Course 2014-2015 Transcript
 Online Test Monitor Certification Course 2014-2015 Transcript Slide # Slide 1 Slide 2 Slide 3 Slide 4 Slide 5 Slide 6 Slide 7 Minnesota Assessments Test Security Training for Districts and Schools Welcome
2+2 Just type and press enter and the answer comes up ans = 4
 Demonstration Red text = commands entered in the command window Black text = Matlab responses Blue text = comments 2+2 Just type and press enter and the answer comes up 4 sin(4)^2.5728 The elementary functions
2013 DCIPS. Compensation Workbench And Payout Analysis Tool. DCO Link: https://connect.dco.dod.mil/dcipscwb2013
 2013 DCIPS Compensation Workbench And Payout Analysis Tool DCO Link: https://connect.dco.dod.mil/dcipscwb2013 Conference Information: Phone number: 877-885-1087 Participant Code: 797 725 2316 1 What s
Tutorial 3 - Map Symbology in ArcGIS
 Tutorial 3 - Map Symbology in ArcGIS Introduction ArcGIS provides many ways to display and analyze map features. Although not specifically a map-making or cartographic program, ArcGIS does feature a wide
Main Effects and Interactions
 Main Effects & Interactions page 1 Main Effects and Interactions So far, we ve talked about studies in which there is just one independent variable, such as violence of television program. You might randomly
Perceived Performance Test Toolkit
 Perceived Performance Test Toolkit for Citrix Servers TMurgent Technologies Perceived Performance Test Toolkit Version 1.5 December 2005 Table of Contents Table of Contents... 2 Introduction... 3 Contents...
o Text-to-Speech and Text-to-Speech Tracking Enhanced Accessibility Mode) o Toolbar Buttons
 o Toolbar Buttons") Ohio s State Tests English Language Arts and Mathematics Sample Items Science and Social Studies Practice Tests and Released Items Guidance Document Updated Dec. 28, 2015 This document covers the following
Ohio s State Tests English Language Arts and Mathematics Sample Items Science and Social Studies Practice Tests and Released Items Guidance Document Updated Dec. 28, 2015 This document covers the following
Green = 0,255,0 (Target Color for E.L. Gray Construction) CIELAB RGB Simulation Result for E.L. Gray Match (43,215,35) Equal Luminance Gray for Green
 CIELAB RGB Simulation Result for E.L. Gray Match (43,215,35) Equal Luminance Gray for Green") Red = 255,0,0 (Target Color for E.L. Gray Construction) CIELAB RGB Simulation Result for E.L. Gray Match (184,27,26) Equal Luminance Gray for Red = 255,0,0 (147,147,147) Mean of Observer Matches to Red=255
Red = 255,0,0 (Target Color for E.L. Gray Construction) CIELAB RGB Simulation Result for E.L. Gray Match (184,27,26) Equal Luminance Gray for Red = 255,0,0 (147,147,147) Mean of Observer Matches to Red=255
Introduction to RStudio
 Introduction to RStudio (v 1.3) Oscar Torres-Reyna otorres@princeton.edu August 2013 http://dss.princeton.edu/training/ Introduction RStudio allows the user to run R in a more user-friendly environment.
Plotting: Customizing the Graph
 Plotting: Customizing the Graph Data Plots: General Tips Making a Data Plot Active Within a graph layer, only one data plot can be active. A data plot must be set active before you can use the Data Selector
First Bytes Programming Lab 2
 First Bytes Programming Lab 2 This lab is available online at www.cs.utexas.edu/users/scottm/firstbytes. Introduction: In this lab you will investigate the properties of colors and how they are displayed
Euler s Method and Functions
 Chapter 3 Euler s Method and Functions The simplest method for approximately solving a differential equation is Euler s method. One starts with a particular initial value problem of the form dx dt = f(t,
0 Introduction to Data Analysis Using an Excel Spreadsheet
 Experiment 0 Introduction to Data Analysis Using an Excel Spreadsheet I. Purpose The purpose of this introductory lab is to teach you a few basic things about how to use an EXCEL 2010 spreadsheet to do
Simply Accounting Intelligence Tips and Tricks Booklet Vol. 1
 Simply Accounting Intelligence Tips and Tricks Booklet Vol. 1 1 Contents Accessing the SAI reports... 3 Running, Copying and Pasting reports... 4 Creating and linking a report... 5 Auto e-mailing reports...
MATLAB. Input and Output
 MATLAB Input and Output Dipl.-Ing. Ulrich Wohlfarth Input with user inputs Strings: Row vector of character (char): text = [ This is,, a text! ] String functions: help strfun Input of: Data: variable =
Assignment 2: Option Pricing and the Black-Scholes formula The University of British Columbia Science One CS 2015-2016 Instructor: Michael Gelbart
 Assignment 2: Option Pricing and the Black-Scholes formula The University of British Columbia Science One CS 2015-2016 Instructor: Michael Gelbart Overview Due Thursday, November 12th at 11:59pm Last updated
1 FTire/editor s Main Menu 1
 FTire/editor FTire Data File Editor and Analyzer Documentation and User s Guide Contents 1 FTire/editor s Main Menu 1 2 FTire/editor s Data Entry Menus 2 2.1 The Tire Size and Specification Data Menu........................
Scicos is a Scilab toolbox included in the Scilab package. The Scicos editor can be opened by the scicos command
 7 Getting Started 7.1 Construction of a Simple Diagram Scicos contains a graphical editor that can be used to construct block diagram models of dynamical systems. The blocks can come from various palettes
Central Commissioning Facility Research Management Systems (RMS): User Guidance
: User Guidance") Central Commissioning Facility Research Management Systems (RMS): User Guidance Contents 1. How to login and register a new account... 2 2. How to accept an invitation to review... 8 3. How to submit a
Central Commissioning Facility Research Management Systems (RMS): User Guidance Contents 1. How to login and register a new account... 2 2. How to accept an invitation to review... 8 3. How to submit a
The goal with this tutorial is to show how to implement and use the Selenium testing framework.
 APPENDIX B: SELENIUM FRAMEWORK TUTORIAL This appendix is a tutorial about implementing the Selenium framework for black-box testing at user level. It also contains code examples on how to use Selenium.
WESSL-2 Script Builder Reference Guide
 WESSL-2 Script Builder Reference Guide The scripting capability for WES-2 Bridge replaces the old text-driven scripting language for WES-1. There is a graphical editor for making new scripts and editing
Creating A Drip Campaign
 Downloading and Uploading the ecards 1. Login to Elevated Network at elevatednetwork.com 2. Click on the My Rancon from Dashboard Creating A Drip Campaign 3. Login to My Rancon and click on Marketing ->
H-ITT CRS V2 Quick Start Guide. Install the software and test the hardware
 H-ITT CRS V2 Quick Start Guide Revision E Congratulations on acquiring what may come to be one of the most important technology tools in your classroom! The H-ITT Classroom Response System is quite easy
Interactive Voting System. www.ivsystem.nl. IVS-Basic IVS-Professional 4.4
 Interactive Voting System www.ivsystem.nl IVS-Basic IVS-Professional 4.4 Manual IVS-Basic 4.4 IVS-Professional 4.4 1213 Interactive Voting System The Interactive Voting System (IVS ) is an interactive
MOVES Batch Mode: Setting up and running groups of related MOVES run specifications. EPA Office of Transportation and Air Quality 11/3/2010
 MOVES Batch Mode: Setting up and running groups of related MOVES run specifications EPA Office of Transportation and Air Quality 11/3/2010 Webinar Logistics Please use question box to send any questions
Flash Tutorial Part I
 Flash Tutorial Part I This tutorial is intended to give you a basic overview of how you can use Flash for web-based projects; it doesn t contain extensive step-by-step instructions and is therefore not
LabVIEW Day 1 Basics. Vern Lindberg. 1 The Look of LabVIEW
 LabVIEW Day 1 Basics Vern Lindberg LabVIEW first shipped in 1986, with very basic objects in place. As it has grown (currently to Version 10.0) higher level objects such as Express VIs have entered, additional
Game Programming & Game Design
 Unit 11: Game Programming & Game Design BRIDGES TO COMPUTING http://bridges.brooklyn.cuny.edu College Now, Bridges to Computing Page 1 Topic Descriptions and Objectives Unit 7: Game Programming & Game
Chapter 6: The Information Function 129. CHAPTER 7 Test Calibration
 Chapter 6: The Information Function 129 CHAPTER 7 Test Calibration 130 Chapter 7: Test Calibration CHAPTER 7 Test Calibration For didactic purposes, all of the preceding chapters have assumed that the
TakeMySelfie ios App Documentation
 TakeMySelfie ios App Documentation What is TakeMySelfie ios App? TakeMySelfie App allows a user to take his own picture from front camera. User can apply various photo effects to the front camera. Programmers
IBM SPSS Statistics 20 Part 1: Descriptive Statistics
 CALIFORNIA STATE UNIVERSITY, LOS ANGELES INFORMATION TECHNOLOGY SERVICES IBM SPSS Statistics 20 Part 1: Descriptive Statistics Summer 2013, Version 2.0 Table of Contents Introduction...2 Downloading the
Coins, Presidents, and Justices: Normal Distributions and z-scores
 activity 17.1 Coins, Presidents, and Justices: Normal Distributions and z-scores In the first part of this activity, you will generate some data that should have an approximately normal (or bell-shaped)
Visual Logic Instructions and Assignments
 Visual Logic Instructions and Assignments Visual Logic can be installed from the CD that accompanies our textbook. It is a nifty tool for creating program flowcharts, but that is only half of the story.
HOWTO annotate documents in Microsoft Word
 HOWTO annotate documents in Microsoft Word Introduction This guide will help new users markup, make corrections, and track changes in a Microsoft Word document. These instructions are for Word 2007. The
Customer Transaction FBL5N
 Customer Transaction FBL5N Use this job aid to: Display customer transaction details and determine if a customer was paid BEFORE YOU BEGIN You should make sure that you have access to transaction FBL5N
mouse (or the option key on Macintosh) and move the mouse. You should see that you are able to zoom into and out of the scene.
 and move the mouse. You should see that you are able to zoom into and out of the scene.") A Ball in a Box 1 1 Overview VPython is a programming language that is easy to learn and is well suited to creating 3D interactive models of physical systems. VPython has three components that you will
A Ball in a Box 1 1 Overview VPython is a programming language that is easy to learn and is well suited to creating 3D interactive models of physical systems. VPython has three components that you will
Ohio Online Science and Social Studies Practice Tests Guidance Document
 Ohio Online Science and Social Studies Practice Tests Guidance Document Published October 2, 2014 This document covers the following information: About the Practice Tests Signing Into the Practice Tests
Using the Synchronization Client
 Using the Synchronization Client The owncloud Desktop Client remains in the background and is visible as an icon in the system tray (Windows, KDE), status bar (Mac OS X), or notification area (Linux).
Introduction Course in SPSS - Evening 1
 ETH Zürich Seminar für Statistik Introduction Course in SPSS - Evening 1 Seminar für Statistik, ETH Zürich All data used during the course can be downloaded from the following ftp server: ftp://stat.ethz.ch/u/sfs/spsskurs/
IBM SPSS Statistics for Beginners for Windows
 ISS, NEWCASTLE UNIVERSITY IBM SPSS Statistics for Beginners for Windows A Training Manual for Beginners Dr. S. T. Kometa A Training Manual for Beginners Contents 1 Aims and Objectives... 3 1.1 Learning
TraceNet Command TM Application Suite User Guide
 TraceNet Command TM Application Suite User Guide TraceNet Command Application Suite Contents Page 1 Introduction...2 2 Application Launcher...2 3 General Functionality...3 4 Status Monitor Application...4
Online Testing Checklist for Summer 2016 Ohio s State Test Administrations
 Online Testing Checklist for Summer 2016 Ohio s State Test Administrations Test administrators must use this checklist when administering Ohio s State Tests online. It includes step-by-step directions,
Importing Data from a Dat or Text File into SPSS
 Importing Data from a Dat or Text File into SPSS 1. Select File Open Data (Using Text Wizard) 2. Under Files of type, choose Text (*.txt,*.dat) 3. Select the file you want to import. The dat or text file
Figure 1. An embedded chart on a worksheet.
 8. Excel Charts and Analysis ToolPak Charts, also known as graphs, have been an integral part of spreadsheets since the early days of Lotus 1-2-3. Charting features have improved significantly over the
Guidelines for Creating Reports
 Guidelines for Creating Reports Contents Exercise 1: Custom Reporting - Ad hoc Reports... 1 Exercise 2: Custom Reporting - Ad Hoc Queries... 5 Exercise 3: Section Status Report.... 8 Exercise 1: Custom
LRmix tutorial, version 4.1
 LRmix tutorial, version 4.1 Hinda Haned Netherlands Forensic Institute, The Hague, The Netherlands May 2013 Contents 1 What is LRmix? 1 2 Installation 1 2.1 Install the R software...........................
University of Southern California Marshall Information Services
 University of Southern California Marshall Information Services Determine Breakeven Price Using Excel - Using Goal Seek, Data Tables, Vlookup & Charts This guide covers how to determine breakeven price
Elixir Schedule Designer User Manual
 Elixir Schedule Designer User Manual Release 7.3 Elixir Technology Pte Ltd Elixir Schedule Designer User Manual: Release 7.3 Elixir Technology Pte Ltd Published 2008 Copyright 2008 Elixir Technology Pte
FLASH. Mac versus PC. Pixels versus Vectors Two kinds of images are in the digital world: bitmaps and vectors:
 FLASH Macromedia Flash is a multimedia graphics program especially for creating moving images for use on the Web. Flash has opened up a whole new world for digital animators. You can rotoscope with it,
QUICK START GUIDE FOR INSTRUCTORS
 QUICK START GUIDE FOR INSTRUCTORS What is Peer Review? In brief: An instructor sets students an assignment. After students have submitted their assignment, they provide comments on submissions from other
LS-DYNA Material Table. HyperMesh 7.0
 LS-DYNA Material Table HyperMesh 7.0 Table of Contents Using the LS-DYNA Material Table... 5 About the LS-DYNA Material Table... 5 Customizing Views of the Material Table... 6 Creating, Editing, and Loading
WISE Sampling Distribution of the Mean Tutorial
 Name Date Class WISE Sampling Distribution of the Mean Tutorial Exercise 1: How accurate is a sample mean? Overview A friend of yours developed a scale to measure Life Satisfaction. For the population
RuleBender 1.1.415 Tutorial
 RuleBender 1.1.415 Tutorial Installing and Launching RuleBender Requirements OSX Getting Started Linux Getting Started Windows Getting Started Using the Editor The Main Window Creating and Opening Files
OPERATION MANUAL. MV-410RGB Layout Editor. Version 2.1- higher
 OPERATION MANUAL MV-410RGB Layout Editor Version 2.1- higher Table of Contents 1. Setup... 1 1-1. Overview... 1 1-2. System Requirements... 1 1-3. Operation Flow... 1 1-4. Installing MV-410RGB Layout
Oracle Data Miner (Extension of SQL Developer 4.0)
") An Oracle White Paper September 2013 Oracle Data Miner (Extension of SQL Developer 4.0) Integrate Oracle R Enterprise Mining Algorithms into a workflow using the SQL Query node Denny Wong Oracle Data Mining
An Oracle White Paper September 2013 Oracle Data Miner (Extension of SQL Developer 4.0) Integrate Oracle R Enterprise Mining Algorithms into a workflow using the SQL Query node Denny Wong Oracle Data Mining
CONFIGURING VIRTUAL TERMINAL: This is the screen you will see when you first open Virtual Terminal
 CONFIGURING VIRTUAL TERMINAL: This is the screen you will see when you first open Virtual Terminal Before you begin you must configure the Options for Virtual Terminal. Click on the Options drop down menu
Tour of the Pantograph Planner
 (714) 989-6891 Instructions for PANTOGRAPH PLANNER The Pantograph Planner helps to free the quilter from the frustrations of positioning the rows for edge to edge quilting. This document provides step
CS 1133, LAB 2: FUNCTIONS AND TESTING http://www.cs.cornell.edu/courses/cs1133/2015fa/labs/lab02.pdf
 CS 1133, LAB 2: FUNCTIONS AND TESTING http://www.cs.cornell.edu/courses/cs1133/2015fa/labs/lab02.pdf First Name: Last Name: NetID: The purpose of this lab is to help you to better understand functions:
Beware of Cheating in Online Assessing Systems
 Abstract Massive open online courses (MOOCs) are playing an increasingly important role in higher education around the world, but despite their popularity, the measurement of student learning in these
Website Development Komodo Editor and HTML Intro
 Website Development Komodo Editor and HTML Intro Introduction In this Assignment we will cover: o Use of the editor that will be used for the Website Development and Javascript Programming sections of
Accounts Payable Expense Distribution Tables
 Accounts Payable Expense Distribution Tables Use Expense Distribution Table Maintenance to set up tables with general ledger accounts and distribution percentages. The tables can then be selected in Invoice
Lines & Planes. Packages: linalg, plots. Commands: evalm, spacecurve, plot3d, display, solve, implicitplot, dotprod, seq, implicitplot3d.
 Lines & Planes Introduction and Goals: This lab is simply to give you some practice with plotting straight lines and planes and how to do some basic problem solving with them. So the exercises will be