Financial Statements
|
|
|
- Austen Page
- 7 years ago
- Views:
Transcription

1 OTP Bank Annual Report 2014

2 Financial Statements


3 72 OTP Bank Annual Report 2014


4 IFRS consolidated financial statements 73
5 Statement of financial position (consolidated, based on IFRS, as at 31 December 2014, in HUF million) Note Cash, amounts due from banks and balances with the National Banks 4. 2,307, ,125 Placements with other banks, net of allowance for placement losses , ,479 Financial assets at fair value through profit or loss , ,605 Securities available-for-sale ,152 1,637,255 Loans, net of allowance for loan losses 8. 5,864,241 6,245,210 Associates and other investments 9. 23,381 23,837 Securities held-to-maturity , ,051 Property and equipment , ,523 Intangible assets , ,721 Other assets , ,241 TOTAL ASSETS 10,971,052 10,381,047 Amounts due to banks, the Hungarian Government, deposits from the National Banks and other banks , ,212 Deposits from customers 14. 7,673,478 6,866,606 Liabilities from issued securities , ,218 Financial liabilities at fair value through profit or loss ,994 87,164 Other liabilities , ,353 Subordinated bonds and loans , ,162 TOTAL LIABILITIES 9,706,886 8,871,715 Share capital ,000 28,000 Retained earnings and reserves 1,288,757 1,532,164 Treasury shares 21. (55,940) (55,599) Non-controlling interest 22. 3,349 4,767 TOTAL SHAREHOLDERS EQUITY 1,264,166 1,509,332 TOTAL LIABILITIES AND SHAREHOLDERS EQUITY 10,971,052 10,381,047 Budapest, 17 March 2015 The accompanying notes to consolidated financial statements on pages 78 to 163 form an integral part of these Consolidated Financial Statements prepared in accordance with International Financial Reporting Standards. 74 OTP Bank Annual Report 2014
6 Statement of recognized income (consolidated, based on IFRS, for the year ended 31 December 2014, in HUF million) Note Interest Income Loans 708, ,542 Placements with other banks 94, ,951 Securities available-for-sale 41,969 71,743 Securities held-to-maturity 39,934 33,002 Amounts due from banks and balances with the National Banks 16,498 4,207 Securities held for trading 924 Other 7,015 Total Interest Income 909,230 1,089,369 Interest Expense Amounts due to banks, the Hungarian Government, deposits from the National Banks and other banks 100, ,539 Deposits from customers 138, ,236 Liabilities from issued securities 13,826 34,896 Subordinated bonds and loans 13,883 11,412 Other 6,630 2,558 Total Interest Expense 273, ,641 NET INTEREST INCOME 636, ,728 Provision for impairment on loan and placement losses 5., 8., , ,569 NET INTEREST INCOME AFTER PROVISION FOR IMPAIRMENT ON LOAN AND PLACEMENT LOSSES 189, ,159 Income from fees and commissions , ,135 Expense from fees and commissions ,736 55,378 Net profit from fees and commissions 215, ,757 Foreign exchange gains, net 156,918 18,279 Gains on securities, net 6,911 11,546 Dividend income 4,824 2,474 (Provision)/Release of provision on securities available-for-sale and held-to-maturity (297) 11 Other operating income ,379 26,392 Other operating expense 25. (232,609) (39,795) from this: provision on contingent liabilities due to regulations related to customer loans 25. (194,798) Net operating (loss)/gain (49,874) 18,907 Personnel expenses 206, ,277 Depreciation and amortization ,947 78,017 Other administrative expenses 236, ,477 Other administrative expenses , ,771 (LOSS)/PROFIT BEFORE INCOME TAX (153,643) 85,052 Income tax ,385 (20,944) NET (LOSS)/PROFIT FOR THE YEAR (102,258) 64,108 From this, attributable to: Non-controlling interest (273) (91) Owners of the company (101,985) 64,199 Consolidated earnings per share (in HUF) Basic 38. (382) 241 Diluted 38. (382) 240 Statement of comprehensive income (consolidated, based on IFRS, for the year ended 31 December 2014, in HUF million) NET (LOSS)/PROFIT FOR THE YEAR (102,258) 64,108 Fair value adjustment of securities available-for-sale 13,019 (1,721) Derivative financial instruments designated as Cash-flow hedge Net investment hedge in foreign operations (4,489) (1,357) Foreign currency translation difference (108,057) (33,159) Change of actuarial losses related to employee benefits (6) (39) NET COMPREHENSIVE INCOME (201,284) 28,363 From this, attributable to: Non-controlling interest (1,418) (1,016) Owners of the company (199,866) 29,379 The accompanying notes to consolidated financial statements on pages 78 to 163 form an integral part of these Consolidated Financial Statements prepared in accordance with International Financial Reporting Standards. IFRS consolidated financial statements 75
7 Statement of cash-flows (consolidated, based on IFRS, for the year ended 31 December 2014, in HUF million) OPERATING ACTIVITIES Note (Loss)/Profit before income tax (153,643) 85,052 Goodwill impairment ,225 30,819 Depreciation and amortization ,722 47,198 Provision/(Release of provision) for impairment on securities 7., (11) Provision for impairment on loan and placement losses 5., , ,569 Provision for impairment on investments 9. 1,244 1,370 Provision for impairment on other assets 12. 5,066 4,313 Provision on assets subject to operating leases 1,048 Provision on investment properties 3,612 Provision for impairment on off-balance sheet commitments and contingent liabilities ,310 3,990 Share-based payment 2., 29. 4,393 5,704 Change of actuarial losses related to employee benefits (6) (39) Unrealized (losses)/gains on fair value change of securities held for trading (2,907) 859 Unrealized (losses)/gains on fair value change of derivative financial instruments (33,140) 4,921 Net changes in assets and liabilities in operating activities Changes in financial assets at fair value through profit or loss 250,821 (219,517) Net increase in loans, net of allowance for loan losses (48,611) (113,672) Increase in other assets before provisions for impairment 20,557 (67,833) Increase in assets subject to operating lease before provisions for impairment (24,442) Increase in investment properties before provision for impairment (27,034) Net increase in deposits from customers 806, ,898 Decrease in other liabilities (26,908) (1,785) Net (increase)/decrease in compulsory reserves at the National Banks (41,130) 7,414 Dividend income (4,824) (2,474) Income tax paid (20,571) (21,739) Net Cash Provided by Operating Activities 1,418, ,037 INVESTING ACTIVITIES Net (increase)/decrease in placement with other banks before allowance for placements losses (7,537) 83,761 Increase in securities available-for-sale (15,402,966) (24,460,762) Decrease in securities available-for-sale 16,213,064 24,233,421 Net decrease/(increase) in investments in subsidiaries 2,490 (2,711) Net increase in investments in associates (3,278) (14,560) Buy-out of non-controlling interests (1,124) Dividend income 4,824 2,474 Increase in securities held-to-maturity (156,594) (161,411) Decrease in securities held-to-maturity 31,094 10,673 Additions to property, equipment and intangible assets 11,526 (59,286) Disposals of property, equipment and intangible assets 12,455 15,190 Net increase in advances for investments included in other assets (27) (29) Net Cash Provided by/(used in) Investing Activities 705,051 (354,364) FINANCING ACTIVITIES Net (decrease)/increase in amounts due to banks, the Hungarian Government, deposits from the National Banks and other banks (75,938) 249,888 Cash received from issuance of securities 56,165 72,186 Cash used for redemption of issued securities (234,299) (270,091) Increase/(Decrease) in subordinated bonds and loans 14,806 (24,333) Decrease in non-controlling interest (1,418) (1,016) Foreign currency translation (106,925) (32,270) Payments to ICES holders* (4,003) (4,111) Net change in Treasury shares (4,249) (1,316) Dividend paid (40,594) (33,592) Net Cash Used in Financing Activities (396,455) (44,655) Net increase/(decrease) in cash and cash equivalents 1,727,377 (55,982) Cash and cash equivalents at the beginning of the period 275, ,929 Cash and cash equivalents at the end of the period 2,003, ,947 Analysis of cash and cash equivalents Cash, amounts due from banks and balances with the National Banks 539, ,521 Compulsory reserve established by the National Banks (263,178) (270,592) Cash and cash equivalents at the beginning of the period 275, ,929 Cash, amounts due from banks and balances with the National Banks 4. 2,310, ,125 Net cash outflow due to acquisition 31. (2,844) Compulsory reserve established by the National Banks 4. (304,308) (263,178) Cash and cash equivalents at the end of the period 2,003, ,947 The accompanying notes to consolidated financial statements on pages 78 to 163 form an integral part of these Consolidated Financial Statements prepared in accordance with International Financial Reporting Standards. * See more details in Note OTP Bank Annual Report 2014
8 Statement of changes in shareholders equity (consolidated, based on IFRS, for the year ended 31 December 2014, in HUF million) Note Share capital Capital reserve Share-based Payment reserve Retained earnings and reserves Put option reserve Treasury shares Noncontrolling interest Balance as at 1 January , ,800 1,579,188 (55,468) (53,802) 5,783 1,514,553 Net profit for the year 64,199 (91) 64,108 Other Comprehensive Income (34,820) (925) (35,745) Share-based payment 29. 5,704 5,704 Dividend for the year 2012 (33,600) (33,600) Sale of Treasury shares ,943 17,943 Treasury shares gain on sale acquisition 21. (19,740) (19,740) Payments to ICES holders 20. (3,248) (3,248) Buy-out of non-controlling interests (1,124) (1,124) Balance as at 31 December , ,504 1,571,076 (55,468) (55,599) 4,767 1,509,332 Net profit for the year (101,985) (273) (102,258) Other Comprehensive Income (97,881) (1,145) (99,026) Share-based payment 29. 4,393 4,393 Dividend for the year 2013 (40,600) (40,600) Sale of Treasury shares ,180 27,180 Treasury shares loss on sale (3,908) (3,908) acquisition 21. (27,522) (27,522) Payments to ICES holders 20. (3,425) (3,425) Balance as at 31 December , ,897 1,323,277 (55,468) (55,941) 3,349 1,264,166 Total The accompanying notes to consolidated financial statements on pages 78 to 163 form an integral part of these Consolidated Financial Statements prepared in accordance with International Financial Reporting Standards. IFRS consolidated financial statements 77
9 NOTES TO THE CONSOLIDATED FINANCIAL STATEMENTS FOR THE YEAR ENDED 31 DECEMBER 2014 NOTE 1: ORGANIZATION AND BASIS OF CONSOLIDATED FINANCIAL STATEMENTS 1.1 General information OTP Bank Plc. (the Bank or OTP ) was established on 31 December 1990, when the previously State-owned company was transformed into a public liability company. The Bank s registered office address is 16 Nádor Street, Budapest In 1995, the shares of the Bank were listed on the Budapest and the Luxembourg Stock Exchanges and were also listed on the SEAQ board on the London Stock Exchange and PORTAL in the USA. These Consolidated Financial Statements were approved by the Board of Directors and authorised for issue on 17 March The structure of the Share capital by shareholders: Domestic and foreign private and institutional investors 97% 97% Employees 2% 2% Treasury shares 1% 1% Total 100% 100% The Bank and its subsidiaries ( Entities of the Group, together the Group ) provide a full range of commercial banking services through a wide network of 1,434 branches. The Group has operations in Hungary, Bulgaria, Russia, Ukraine, Croatia, Romania, Slovakia, Serbia and Montenegro. The number of employees at the Group: The number of employees at the Group 35,919 38,203 The average number of employees at the Group 35,796 37, Base of Accounting The Entities of the Group maintain their accounting records and prepare its statutory accounts in accordance with the commercial, banking and fiscal regulations prevailing in Hungary and in case of foreign subsidiaries in accordance with the local commercial, banking and fiscal regulations. The Group s presentation currency is the Hungarian forint ( HUF ). Due to the fact that the Bank is listed on international and national stock exchanges, the Bank is obliged to present its financial position in accordance with International Financial Reporting Standards ( IFRS ). Certain adjustments have been made to the entities statutory accounts in order to present the Consolidated Financial Position and Statement of Recognized and Comprehensive Income of the Bank in accordance with all standards and 78 OTP Bank Annual Report 2014
10 interpretations approved by the International Accounting Standards Board ( IASB ). The Consolidated Financial Statements have been prepared in accordance with IFRS as adopted by the European Union (the EU ). IFRS as adopted by the EU do not currently differ from IFRS as issued by the IASB, except for portfolio hedge accounting under IAS 39 Financial Instruments: Recognition and Measurement ( IAS 39 ) which has not been approved by the EU. As the Group does not apply portfolio hedge accounting under IAS 39, there would be no impact on these Consolidated Financial Statements, had it been approved by the EU before the preparation of these financial statement The effect of adopting new and revised International Financial Reporting Standards effective from 1 January 2014 The following standards, amendments to the existing standards and interpretations issued by the IASB and adopted by the EU are effective for the current period: IFRS 10 Consolidated Financial Statements, adopted by the EU on 11 December 2012 (effective for annual periods beginning on or after 1 January 2014), IFRS 11 Joint Arrangements, adopted by the EU on 11 December 2012 (effective for annual periods beginning on or after 1 January 2014), IFRS 12 Disclosures of Interests in Other Entities, adopted by the EU on 11 December 2012 (effective for annual periods beginning on or after 1 January 2014), IAS 27 (revised in 2011) Separate Financial Statements, adopted by the EU on 11 December 2012 (effective for annual periods beginning on or after 1 January 2014), IAS 28 (revised in 2011) Investments in Associates and Joint Ventures, adopted by the EU on 11 December 2012 (effective for annual periods beginning on or after 1 January 2014), Amendments to IFRS 10 Consolidated Financial Statements, IFRS 11 Joint Arrangements and IFRS 12 Disclosures of Interests in Other Entities Transition Guidance, adopted by the EU on 4 April 2013 (effective for annual periods beginning on or after 1 January 2014), Amendments to IFRS 10 Consolidated Financial Statements, IFRS 12 Disclosures of Interests in Other Entities and IAS 27 (revised in 2011) Separate Financial Statements Investment Entities, adopted by the EU on 20 November 2013 (effective for annual periods beginning on or after 1 January 2014), Amendments to IAS 32 Financial instruments: presentation Offsetting Financial Assets and Financial Liabilities, adopted by the EU on 13 December 2012 (effective for annual periods beginning on or after 1 January 2014), Amendments to IAS 36 Impairment of assets Recoverable Amount Disclosures for Non-Financial Assets, adopted by the EU on 19 December 2013 (effective for annual periods beginning on or after 1 January 2014), Amendments to IAS 39 Financial Instruments: Recognition and Measurement Novation of Derivatives and Continuation of Hedge Accounting, adopted by the EU on 19 December 2013 (effective for annual periods beginning on or after 1 January 2014). The adoption of these amendments to the existing standards has not led to any changes in the Group s accounting policies New and revised Standards and Interpretations issued by IASB and adopted by the EU but not yet effective At the date of authorization of these financial statements, the following standards, amendments to the existing standards and interpretations issued by IASB and adopted by the EU were in issue but not yet effective: IFRS consolidated financial statements 79
11 Amendments to various standards Improvements to IFRSs (cycle ) resulting from the annual improvement project of IFRS (IFRS 2, IFRS 3, IFRS 8, IFRS 13, IAS 16, IAS 24 and IAS 38) primarily with a view to removing inconsistencies and clarifying wording adopted by the EU on 17 December 2014 (amendments are to be applied for annual periods beginning on or after 1 February 2015), Amendments to various standards Improvements to IFRSs (cycle ) resulting from the annual improvement project of IFRS (IFRS 1, IFRS 3, IFRS 13 and IAS 40) primarily with a view to removing inconsistencies and clarifying wording adopted by the EU on 18 December 2014 (amendments are to be applied for annual periods beginning on or after 1 January 2015), Amendments to IAS 19 Employee Benefits Defined Benefit Plans: Employee Contributions adopted by the EU on 17 December 2014 (effective for annual periods beginning on or after 1 February 2015), IFRIC 21 Levies adopted by the EU on 13 June 2014 (effective for annual periods beginning on or after 17 June 2014) Standards and Interpretations issued by IASB, but not yet adopted by the EU IFRS 9 Financial Instruments (effective for annual periods beginning on or after 1 January 2018), IFRS 14 Regulatory Deferral Accounts (effective for annual periods beginning on or after 1 January 2016), IFRS 15 Revenue from Contracts with Customers (effective for annual periods beginning on or after 1 January 2017), Amendments to IFRS 10 Consolidated Financial Statements and IAS 28 Investments in Associates and Joint Ventures Sale or Contribution of Assets between an Investor and its Associate or Joint Venture (effective for annual periods beginning on or after 1 January 2016), Amendments to IFRS 10 Consolidated Financial Statements, IFRS 12 Disclosure of Interests in Other Entities and IAS 28 Investments in Associates and Joint Ventures Investment Entities: Applying the Consolidation Exception (effective for annual periods beginning on or after 1 January 2016), Amendments to IFRS 11 Joint Arrangements Accounting for Acquisitions of Interests in Joint Operations (effective for annual periods beginning on or after 1 January 2016), Amendments to IAS 1 Presentation of Financial Statements Disclosure Initiative (effective for annual periods beginning on or after 1 January 2016), - Amendments to IAS 16 Property, Plant and Equipment and IAS 38 Intangible Assets Clarification of Acceptable Methods of Depreciation and Amortisation (effective for annual periods beginning on or after 1 January 2016), Amendments to IAS 16 Property, Plant and Equipment and IAS 41 Agriculture Agriculture: Bearer Plants (effective for annual periods beginning on or after 1 January 2016), Amendments to IAS 27 Separate Financial Statements Equity Method in Separate Financial Statements (effective for annual periods beginning on or after 1 January 2016), Amendments to various standards Improvements to IFRSs (cycle ) resulting from the annual improvement project of IFRS (IFRS 5, IFRS 7, IAS 19 and IAS 34) primarily with a view to removing inconsistencies and clarifying wording (amendments are to be applied for annual periods beginning on or after 1 July 2016). The hedge accounting regarding the portfolio of financial assets and liabilities, whose principles have not been adopted by the EU, is still unregulated. According to the Group s estimates, application of hedge accounting for the portfolio of financial assets or liabilities pursuant to IAS 39: 80 OTP Bank Annual Report 2014
12 Financial Instruments: Recognition and Measurement, would not significantly impact the financial statements, if applied as at the balance sheet date. The adoption of the above presented Amendments and new Standards and Interpretations would have no significant impact on the Consolidated Financial Statements except of the application of IFRS 9 which might have significant impact on the Group Consolidated Financial Statements, the Group will analyse the impact after the adoption of the standard by EU. NOTE 2: SUMMARY OF SIGNIFICANT ACCOUNTING POLICIES Significant accounting policies applied in the preparation of the accompanying Consolidated Financial Statements are summarized below: 2.1 Basis of Presentation These Consolidated Financial Statements have been prepared under the historical cost convention with the exception of certain financial instruments, which are recorded at fair value. Revenues and expenses are recorded in the period in which they are earned or incurred. The presentation of Consolidated Financial Statements in conformity with IFRS requires the Management of the Group to make estimates and assumptions that affect the reported amounts of assets and liabilities and disclosure of contingent assets and liabilities as of the date of the financial statements and their reported amounts of revenues and expenses during the reporting period. Actual results could differ from those estimates. Future changes in economic conditions, business strategies, regulatory requirements, accounting rules and other factors could result in a change in estimates that could have a material impact on future financial statements. 2.2 Foreign currency translation In preparing the financial statements of each individual group entity, transactions in currencies other than the entity s presentation currency are translated into HUF are recognized at the rates of exchange prevailing at the dates of the transactions. At the end of each reporting period, monetary items denominated in foreign currencies are retranslated at the exchange rates quoted by the National Bank of Hungary ( NBH ), or if there is no official rate, at exchange rates quoted by OTP as at the date of the Consolidated Financial Statements. Non-monetary items carried at fair value that are denominated in foreign currencies are retranslated at the rates prevailing at the date when the fair value was determined. Nonmonetary items that are measured in terms of historical cost in a foreign currency are not retranslated. Exchange differences on monetary items are recognized in profit or loss in the period in which they arise except for: exchange differences on foreign currency borrowings relating to assets under construction for future productive use, which are included in the cost of those assets when they are regarded as an adjustment to interest costs on those foreign currency borrowings; exchange differences on transactions entered into in order to hedge certain foreign currency risks (see Note 2.7 below for hedging accounting policies); and exchange differences on monetary items receivable from or payable to a foreign operation for which settlement is neither planned nor likely to occur (therefore forming part of the net investment in the foreign operation), which are recognized IFRS consolidated financial statements 81
13 initially in Other Comprehensive Income and reclassified from equity to profit or loss on repayment of the monetary items. For the purposes of presenting Consolidated Financial Statements, the assets and liabilities of the Group s foreign operations are translated into HUF using exchange rates prevailing at the end of each reporting period. Income and expense items are translated at the average exchange rates for the period, unless exchange rates fluctuate significantly during that period, in which case the exchange rates at the dates of the transactions are used. Exchange differences arising, if any, are recognized in Other Comprehensive Income and accumulated in equity (attributed to non-controlling interests as appropriate). On the disposal of a foreign operation (i.e. a disposal of the Group s entire interest in a foreign operation, or a disposal involving loss of control over a subsidiary that includes a foreign operation, a disposal involving loss of joint control over a jointly controlled entity that includes a foreign operation, or a disposal involving loss of significant influence over an associate that includes a foreign operation), all of the exchange differences accumulated in equity in respect of that operation attributable to the owners of the Group are reclassified to profit or loss. In addition, in relation to a partial disposal of a subsidiary that does not result in the Group losing control over the subsidiary, the proportionate share of accumulated exchange differences are re-attributed to non-controlling interests and are not recognized in profit or loss. For all other partial disposals (i.e. partial disposals of associates or jointly controlled entities that do not result in the Group losing significant influence or joint control), the proportionate share of the accumulated exchange differences is reclassified to profit or loss. Goodwill and fair value adjustments on identifiable assets and liabilities acquired arising on the acquisition of a foreign operation are treated as assets and liabilities of the foreign operation and translated at the rate of exchange prevailing at the end of each reporting period. Exchange differences arising are recognized in Other Comprehensive Income and accumulated in equity. 2.3 Principles of consolidation Included in these Consolidated Financial Statements are the accounts of those subsidiaries in which the Bank exercises control. The list of the major fully consolidated subsidiaries, the percentage of issued capital owned by the Bank and the description of their activities is provided in Note 31. However, certain subsidiaries in which the Bank holds a significant interest have not been consolidated because the effect of consolidating such companies is not material to the Consolidated Financial Statements as a whole (see Note 2.13). As the ultimate parent, the Bank is preparing consolidated financial statement of the Group. 2.4 Accounting for acquisitions Business combinations are accounted for using purchase method of accounting. Any goodwill arising on acquisition is recognized in the Consolidated Statement of Financial Position and accounted for as indicated below. The acquisition date is the date on which the acquirer effectively obtains control over the acquiree. Before this date, it should be presented as Advance for investments within Other assets. Goodwill, which represents the residual cost of the acquisition after obtaining the control over the acquiree in the fair value of the identifiable assets, liabilities and contingent liabilities acquired, is held as an intangible asset and recorded at cost less any accumulated impairment losses in the Consolidated Financial Statements. If the Group loses control of a subsidiary, derecognizes the assets (including any 82 OTP Bank Annual Report 2014
14 goodwill) and liabilities of the subsidiary at their carrying amounts at the date when control is lost and recognizes any difference as a gain or loss on the sale attributable to the parent in Statement of Recognized Income. Goodwill acquired in a business combination is tested for impairment annually or more frequently if events or changes in circumstances indicate. The goodwill is allocated to the cost generating units that are expected to benefit from the synergies of the combinations. The Group calculates the fair value based on discounted cash-flow model. The 5 year period explicit cash-flow model serves as a basis for the impairment test by which the Group defines the impairment need on goodwill based on the strategic factors and financial data of its cash-generating units. The Group, in its strategic plan, has taken into consideration the effects of the present global economic situation, the cautious recovery of economic situation and outlook, the associated risks and their possible effect on the financial sector as well as the current and expected availability of wholesale funding. Negative goodwill (gain from bargain purchase), when the interest of the acquirer in the net fair value of the acquired identifiable net assets exceeds the cost of the business combination, is recognized immediately in the Consolidated Statement of Recognized Income as other income. 2.5 Securities held-to-maturity Investments in securities, traded in active market (with fixed or determinable cash-flows) are accounted for on a settlement date basis and are initially measured at fair value. At subsequent reporting dates, securities that the Group has the expressed intention and ability to hold to maturity are measured at amortised cost, less any impairment losses recognized to reflect irrecoverable amounts. The annual amortisation of any discount or premium on the acquisition of a held-to-maturity security is aggregated with other investment income receivable over the term of the investment so that the revenue recognized in each period represents a constant yield on the investment. Such securities comprise mainly securities issued by the Hungarian and foreign Government, discounted Treasury bills, mortgage bonds and corporate bonds. 2.6 Financial assets at fair value through profit or loss Securities held for trading Investments in securities are accounted for on a settlement date basis and are initially measured at fair value. Securities held for trading are measured at subsequent reporting dates at fair value. Unrealized gains and losses on held for trading securities are recognized in profit or loss and included in the Consolidated Statement of Recognized Income for the period. Such securities consist of corporate shares, Hungarian and foreign government bonds, discounted treasury bills and other securities Derivative financial instruments In the normal course of business, the Group is a party to contracts for derivative financial instruments, which represent a very low initial investment compared to the notional value of the contract and their value depends on value of underlying asset and are settled in the future. The derivative financial instruments used include interest rate forward or swap agreements and currency forward or swap agreements and options. These financial instruments are used by the Group both for trading purposes and to hedge interest rate risk and currency exposures associated with its transactions in the financial markets. Derivative financial instruments are accounted for on a trade date basis and are initially IFRS consolidated financial statements 83
15 measured at fair value and at subsequent reporting dates also at fair value. Fair values are obtained from quoted market prices, discounted cash-flow models and option pricing models as appropriate. The Group adopts multi curve valuation approach for calculating the net present value of future cash-flows based on different curves used for determining forward rates and used for discounting purposes. It shows the best estimation of such derivative deals that are collateralised as the Group has almost all of its open derivative transactions collateralised. Changes in the fair value of derivative financial instruments that do not qualify for hedge accounting are recognized in profit or loss and are included in the Consolidated Statement of Recognized Income for the period. Each derivative deal is determined as asset when fair value is positive and as liability when fair value is negative. prepared, effectiveness test is performed and based on it the hedge is qualified as effective. Changes in fair value of derivatives that are designated and qualify as cash-flow hedges and that prove to be highly effective in relation to the hedged risk are recognized as reserve in other comprehensive income. Amounts deferred in equity are transferred to the Consolidated Statement of Recognized Income and classified as revenue or expense in the periods during which the hedged assets and liabilities effect the Consolidated Statement of Recognized Income for the period. The ineffective element of the hedge is charged directly to the Consolidated Statement of Recognized Income. The Group terminates the hedge accounting if the hedging instrument expires or is sold, terminated or exercised, or the hedge no longer meets the criteria for hedge accounting or the Group revokes the designation. Certain derivative transactions, while providing effective economic hedges under the risk management policy of the Group, do not qualify for hedge accounting under the specific rules of IAS 39 and are therefore treated as derivatives held for trading with fair value gains and losses charged directly to the Consolidated Statement of Recognized Income. 2.7 Derivative financial instruments designated as a fair-value or cash-flow hedge Changes in the fair value of derivatives that are designated and qualify as fair value hedges and that prove to be highly effective in relation to the hedged risk, are recorded in the Consolidated Statement of Recognized Income along with the corresponding change in fair value of the hedged asset or liability that is attributable to the specific hedged risk. The ineffective element of the hedge is charged directly to the Consolidated Statement of Recognized Income. The conditions of hedge accounting applied by the Bank are the following: formally designed as hedge, proper hedge documentation is 2.8 Offsetting Financial assets and liabilities may be offset and the net amount is reported in the Consolidated Statement of Financial Position when the Group has a legally enforceable right to set off the recognized amounts and the transactions are intended to be reported in the Consolidated Statement of Financial Position on a net basis. The Group does not offset any financial assets and financial liabilities. 2.9 Embedded derivatives Sometimes, a derivative may be a component of a combined financial instrument that includes a host contract and a derivative (the embedded derivative) effecting cash-flows or otherwise modifying the characteristics of the host instrument. An embedded derivative must be separated from the host instrument and accounted for as a separate derivative if, and only if: The economic characteristics and risks of the embedded derivative are not closely related 84 OTP Bank Annual Report 2014
16 to the economic characteristics and risks of the host contract; A separate financial instrument with the same terms as the embedded derivative would meet the definition of a derivative as a stand-alone instrument; and The host instrument is not measured at fair or is measured at fair value but changes in fair value are recognized in Other Comprehensive Income Securities available-for-sale Investments in securities are accounted for on a settlement date basis and are initially measured at fair value. Securities available-for-sale are measured at subsequent reporting dates at fair value. Unrealized gains and losses on available-for-sale financial instruments are recognized directly in Other Comprehensive Income, except for interest and foreign exchange gains/losses on monetary items, unless such available-for-sale security is part of an effective hedge. Such gains and losses will be reported when realized in Consolidated Statement of Recognized Income for the applicable period. Such securities consist of Hungarian and foreign government bonds, corporate bonds, discounted Treasury bills and other securities. Other securities include shares in investment funds, shares in non-financing companies and venture capital fund bonds. The provision for impairment is calculated based on discounted cash-flow methodology for debt instruments and calculated based on fair valuation on equity instruments, using the expected future cash-flow and original effective interest rate if there is objective evidence of impairment based on significant or prolonged decrease in fair value. Securities available-for-sale are remeasured at fair value based on quoted prices or amounts derived from cash-flow models. In circumstances where the quoted market prices are not readily available, the fair value of debt securities is estimated using the present value of future cash-flows and the fair value of any unquoted equity instruments are calculated using the EPS ratio. Those available-for-sale financial assets that do not have a quoted market price and whose fair value cannot be reliably measured by other models mentioned above, are measured at cost, less provision for impairment, when appropriate. This exception is related only to equity instruments. Impairment on equity available-for-sale securities is accounted only if there is a significant or prolonged decrease in the market value. Impairment losses recognised in profit or loss for equity AFS securities is not reversed through profit or loss Loans, placements with other banks and allowance for loan and placement losses Loans and placements with other banks are accounted at amortized cost, stated at the principal amounts outstanding (including accrued interest), net of allowance for loan or placement losses, respectively. Transaction fees and charges should adjust the carrying amount at initial recognition and be included in effective interest calculation. Loans and placements with other banks are derecognised when the contractual rights to the cash-flows expire or they are transferred. Interest and amortised cost are accounted using effective interest rate method. When a borrower is unable to meet payments as they fall due or, in the opinion of the Management, there is an indication that a borrower may be unable to meet payments as they fall due, all unpaid interest is impaired. According to IAS 39, initially financial asset shall be recognized at fair value which is usually equal to transaction value of loans and receivables. Initial fair value of loans and receivables lent at interest below market conditions is lower than their transaction price. As a consequence the Bank is deferring the difference between the fair value at initial IFRS consolidated financial statements 85
17 recognition and the transaction price relating to loans and receivables because input data for measuring the fair values are not available on observable markets. The amount of allowance is the difference between the carrying amount and the recoverable amount, being the present value of the expected cash-flows, including amounts recoverable from guarantees and collateral, discounted at the original effective interest rate. Allowance for loan and placement losses with other banks represent Management assessment for potential losses in relation to these activities. The allowances for loan and placement losses are maintained to cover losses that have been specifically identified. Collective impairment losses of portfolios of loans, for which no objective evidence of impairment has been identified on an individual basis, are maintained to reduce the carrying amount of the portfolios of financial assets with similar credit risk characteristics to their estimated recoverable amounts at the balance sheet date. The expected cash-flows for portfolios of similar assets are estimated based on historical loss experience. Historical loss experience is the basis for calculating the expected loss, which is adjusted by the loss confirmation period, which represents the average time lag between occurrence of a loss event and confirmation of the loss. This concept enables recognition of those losses that have occurred in the portfolio at the balance sheet date. If the reason for provisioning is no longer deemed appropriate, the redundant provisioning charge is released into net operating income. If, in a subsequent period, the amount of the impairment loss decreases and the decrease can be related objectively to an event occurring after the impairment was recognised (such as an improvement in the debtor s credit rating), the previously recognised impairment loss shall be reversed by adjusting an allowance account. The reversal shall not result in a carrying amount of the financial asset that exceeds what the amortised cost would have been had the impairment not been recognised at the date the impairment is reversed. Write-offs are generally recorded after all reasonable restructuring or collection activities have taken place and the possibility of further recovery is considered to be remote. The loan is written off against the related account Provision for impairment on loan and placement losses in the Consolidated Statement of Recognized Income. The Group applies partial or full write-off for loans based on the definitions and prescriptions of financial instruments in accordance with IAS 39. If the Group has no reasonable expectations regarding a financial asset (loan) to be recovered, it will be written off partially or fully at the time of emergence. A loan will be written off if it has overdued or was terminated by the Group. The gross amount and impairment loss of the loans shall be written off in the same amount to the estimated maximum recovery amount while the net carrying value remains unchanged. In these cases there is no reasonable expectation from the clients to complete contractual cash flows therefore the Group does not accrue interest income in case of write-off. Loan receivables legally demanded from clients are equal to the former gross amount of the loan before the write-off Sale and repurchase agreements, security lending Where debt or equity securities are sold under a commitment to repurchase them at a predetermined price, they remain on Statement of Financial Position and the consideration received is recorded in Other liabilities or Amounts due to banks, the Hungarian Government, deposits from the National Banks and other banks. Conversely, debt or equity securities purchased under a commitment to resell are not recognized in the Statement of Financial Position and the consideration paid 86 OTP Bank Annual Report 2014
18 is recorded either in Placements with other banks or Deposits from customers. Interest is accrued evenly over the life of the repurchase agreement. In the case of security lending transactions the Group doesn t recognize or derecognize the securities because believes that the transferor retains substantially all the risks and rewards of the ownership of the securities. Only a financial liability or financial receivable is recognized for the consideration amount Associates and other investments Companies where the Bank has the ability to exercise significant influence are accounted for using the equity method. However, certain associated companies in which the Bank holds a significant interest have not been accounted for in accordance with the equity method because the effect of using the equity method to account for such companies is not material to the Consolidated Financial Statements as a whole. Unconsolidated subsidiaries and associated companies that were not accounted for using the equity method and other investments where the Bank does not hold a significant interest are recorded according to IAS 39, when appropriate. Gains and losses on the sale of investments are determined on the basis of the specific identification of the cost of each investment Property and equipment, Intangible assets Property and equipment and Intangible assets are stated at cost, less accumulated depreciation and amortization and impairment, if any. The depreciable amount (book value less residual value) of the non-current assets must be allocated over the useful lives. Depreciation and amortization are computed using the straight-line method over the estimated useful lives of the assets based on the following annual percentages: Intangible assets Software % Property rights 1 50% Property 1 50% Office equipment and vehicles % Depreciation and amortization on Property and equipment and Intangible assets commence on the day such assets are placed into service. At each balance sheet date, the Group reviews the carrying value of its Property and equipment and Intangible assets to determine if there is any indication that those assets have suffered an impairment loss. If any such indication exists, the recoverable amount of the asset is estimated to determine the extent (if any) of the impairment loss. Where it is not possible to estimate the recoverable amount of an individual asset, the Group estimates the recoverable amount of the cash-generating unit to which the asset belongs. Where the carrying value of Property and equipment and Intangible assets is greater than the estimated recoverable amount, it is impaired immediately to the estimated recoverable amount. The Group may conclude contracts for purchasing property, equipment and intangible assets, where the purchase price is settled in foreign currency. By entering into such agreements, firm commitment in foreign currency due on a specified future date arises at the Group. Reducing the foreign currency risk caused by firm commitment, forward foreign currency contracts may be concluded to ensure the amount payable in foreign currency on a specified future date on one hand and to eliminate the foreign currency risk arising until settlement date of the contract on the other hand. In the case of effective hedge the realised profit or loss of hedging instrument is stated IFRS consolidated financial statements 87
19 as the part of the cost of the hedged asset as it has arisen until recognising the asset and it is tightly connecting to the purchasing Financial liabilities The financial liabilities are presented within financial liabilities at fair value through profit or loss or financial liabilities measured at amortized costs. In connection to the financial liabilities at fair value through profit or loss, the Group presents the amount of change in their fair value originated from the changes of market conditions and business environment. Financial liabilities at fair value through profit or loss are either financial liabilities held for trading or they are designated upon initial recognition as at fair value through profit or loss. In the case of financial liabilities measured at amortized cost fees and commissions related to the origination of the financial liability are recognized through profit or loss during the maturity of the instrument. In certain cases the Group repurchases a part of financial liabilities (mainly issued securities or subordinated bonds) and the difference between the carrying amount of the financial liability and the amount paid for it is recognized in the net profit or loss for the period and included in other operating income Leases rate of return on the net investment outstanding of the Group in respect of the leases. Direct costs such as commissions are included in the initial measurement of the finance lease receivables. Rental income from operating leases is recognized on a straight-line basis over the term of the relevant lease. The Group as a lessee Assets held under finance leases, which confer rights and obligations similar to those attached to owned assets, are capitalised at their fair value and depreciated over the useful lives of assets. The principal element of each future lease obligation is recorded as a liability, while the interest elements are charged to the Consolidated Statement of Recognized Income over the period of the leases to produce a constant rate of charge on the balance of principal payments outstanding. Payments made under operating leases are charged to the Consolidated Statement of Recognized and Comprehensive Income on a straight-line basis over the term of the lease. When an operating lease is terminated before the lease period has expired, any payment required to be made to the lessor by way of penalty is recognized as an expense in the period in which termination takes place. Leases are classified as finance leases whenever the terms of the lease transfer substantially all the risks and rewards of ownership to the lessee. All other leases are classified as operating leases. The Group as a lessor Amounts due from lessees under finance leases are recorded as other receivables at the amount of the net investment in the lease of the Group. Finance lease income is allocated to accounting periods so as to reflect a constant 2.17 Investment properties Investment properties of the Group are land, buildings, part of buildings which held (as the owner or as the lessee under a finance lease) to earn rentals or for capital appreciation or both, rather than for use in the production or supply of services or for administrative purposes or sale in the ordinary course of business. The Group measures the investment properties at amortized cost and according to the opinion of the Management there isn t significant difference between the 88 OTP Bank Annual Report 2014
20 fair value and the carrying value of the these properties Treasury shares Treasury shares are shares which are purchased on the stock exchange and the over-the-counter market by the Bank and its subsidiaries and are presented in the Consolidated Financial Position at cost as a deduction from Consolidated Shareholders Equity. Gains and losses on the sale of treasury shares are credited or charged directly to shareholder s equity. Derecognition of treasury shares is based on the FIFO method Interest income and interest expense Interest income and expenses are recognized in profit or loss in the period to which they relate, using the effective interest rate method. Interest from loans and deposits are accrued on a daily basis. Interest income and expenses include relevant transaction costs and the amortisation of any discount or premium between the initial carrying amount of an interest-bearing instrument and its amount at maturity calculated on an effective interest rate basis. The Group recognizes interest income when assumes that the interest associated with the transaction will flow to the Group and the amount of the revenue can reasonably be measured. All interest income and expense recognized are arising from loans, placements with other banks, securities held for trading, securities available-for-sale, securities held-to-maturity and amounts due to banks, deposits from customers, liabilities from issued securities, subordinated bond and loans are presented under these lines of financial statements Fees and Commissions Fees and commissions are recognized using the effective interest method referring to provisions of IAS 39, when they relate and have to be included in amortized cost model. Certain fees and commissions that are not involved in the amortized cost model are recognized in the Consolidated Statement of Recognized Income on an accrual basis based on IAS Dividend income The Group recognizes dividend income in the Consolidated Financial Statements when its right to receive payment is established Income tax The annual taxation charge is based on the tax payable under fiscal regulations prevailing in the country where the company is incorporated, adjusted for deferred taxation. Deferred taxation is accounted for using the balance sheet liability method in respect of temporary differences between the tax bases of assets and liabilities and their carrying value for financial reporting purposes, measured at the tax rates that apply to the future period when the asset is expected to be realized or the liability is settled. Deferred tax assets are recognized by the Group for the amounts of income taxes that are recoverable in future periods in respect of deductible temporary differences as well as the carryforward of unused tax losses and the carryforward of unused tax credits Off-balance sheet commitments and contingent liabilities In the ordinary course of its business, the Group enters into off-balance sheet commitments such as guarantees, letters of credit, commitments to extend credit and transactions IFRS consolidated financial statements 89
21 with financial instruments. The provision for impairment on off-balance sheet commitments and contingent liabilities is maintained at a level adequate to absorb future cash outflows which are probable and relate to present obligations. Management determines the adequacy of the allowance based upon reviews of individual items, recent loss experience, current economic conditions, the risk characteristics of the various categories of transactions and other pertinent factors. The Group recognizes provision when it has a present obligation as a result of a past event; it is probable that an outflow of resources embodying economic benefits will be required to settle the obligation; and a reliable estimate can be made of the obligation Consolidated Statement of Cash-flows For the purposes of reporting Consolidated Statement of Cash-flows, cash and cash equivalents include cash, due from banks and balances with the National Banks, excluding the compulsory reserve established by the National Banks. Consolidated cash-flows from hedging activities are classified in the same category as the item being hedged. The unrealized gains and losses from the translation of monetary items to the closing foreign exchange rates and unrealized gains and losses from derivative financial instruments are presented net in the statement of cash-flows for the monetary items which were being revaluated Share-based payment and employee benefit The Bank has applied the requirements of IFRS 2 Share-based Payment. The Bank issues equity-settled share-based payment to certain employees. Equity-settled share-based payment is measured at fair value at the grant date. The fair value determined at the grant date of the equity-settled share-based payment is expensed on a straight-line basis over the year, based on the Bank s estimate of shares that will eventually vest. Share-based payment is recorded in Consolidated Statement of Recognized Income as Personnel expenses Segment reporting IFRS 8 Operating Segments requires operating segments to be identified on the basis of internal reports about components of the Group that are regularly reviewed by the chief operating decision maker in order to allocate resources to the segments and to assess their performance. Based on the above, the segments identified by the Group are the business and geographical segments. The Group s operating segments under IFRS 8 are therefore as follows: OTP Core Hungary, Russia, Ukraine, Bulgaria, Romania, Serbia, Croatia, Slovakia, Montenegro, Leasing subsidiaries, Asset Management subsidiaries, Other subsidiaries, Corporate Center. Fair value is measured by use of a binomial model. The expected life used in the model has been adjusted, based on Management s best estimate, for the effects of non-transferability, exercise restrictions, and behavioural considerations. The Group has applied the requirement of IAS 19 Employee Benefits. IAS 19 requires to recognise employee benefits to be paid as a liability and as an expense in the Consolidated Financial Statements Comparative figures There were no changes in prior period data due to either prior period error or change in accounting policies. In some notes certain amounts in the Consolidated Financial Statements for the year ended 31 December 2014 have been restructured within the particular note to conform with the current year presentation and these amounts are not significant. 90 OTP Bank Annual Report 2014
22 2.28 Government measures related to customer loan contracts Act XXXVIII of 2014 on Settlement of certain issues concerning the Uniformity Decision of the Supreme Court related to customer loan agreements 1 provided by financial institutions ( Curia Law ) was promulgated on 18 July The Hungarian Parliament has adopted on 24 September 2014 the Act XL of 2014 on Rules of the settlement and certain other issues put in Act XXXVIII of 2014 on Settlement of certain issues concerning the Uniformity Decision of the Supreme Court related to customer loan agreements provided by financial institutions ( Act on Settlement ), based on that financial institutions need to settle up with their clients on account of overpayments arisen from invalidity of the bid-ask exchange rate spread and unilateral amendment of contractual clauses. Act on Settlement has specified the regulations of Curia Law; obligation of settlement does not apply to credit cards, current account loans and mortgage housing loans supported by State. Furthermore amount due to customers can be reduced by total amount of allowances. Act LXXVII of 2014 on Settlement of certain issues concerning the modification of the currency and interest conditions related to customer loan agreements was promulgated. The act includes regulations about the conversion of foreign currency customer mortgage loans into HUF which became legally effective on 1 February 2015 ( Act on Conversion into HUF ). Hereinafter three acts together are called as Acts on Customer Loans. Based on these regulations the Group recognised the following items in the financial statements as at 31 December 2014: a) Act on Settlement The Group s reimbursement obligation related to invalidity of the bid-ask exchange rate spread will be prospectively in amount of HUF 32.4 billion. Related to bid-ask exchange rate spread the Group recognised provision for impairment in the amount of HUF 1,776 million during the year Based on unilateral amendment of contractual clauses being assumed unfair, the Group, based on estimation of the amount of expected obligation related to loans under legal proceeding, recognised provision for impairment in the amount of HUF billion. In case of these amounts, provision for impairment on mortgage loans concerned in conversion into HUF was recognised at foreign exchange rates applied in conversion into HUF in financial statements as at 31 December 2014 (CHF: ; EUR: ; JPY: 2.163). In case of loans not concerned in conversion into HUF mostly foreign currency customer loans the provision for impairment was recognized at foreign exchange rates according to NBH as at 31 December 2014 in these financial statements. The Group is recognising the provision on contingent liabilities related to Act on Settlement among the other off-balance sheet commitments and contingent liabilities in the IFRS Consolidated Statements. b) Act on Conversion into HUF Based on the Act on Conversion into HUF, in case of mortgage loans concerned in conversion into HUF, the Group records the foreign currency loans, provision for impairment, accrued interest and provision at foreign exchange rates applied in conversion into HUF in IFRS financial statements as at 31 December The foreign currency loans concerned in conversion into HUF and the relating fees need to be derecognised at the time of conversion into HUF from IFRS financial statements and the HUF loans need to be recognised as newly granted loans. According to IFRS, HUF loans shall be recognised initially at fair value and for the new loans below-market interest test should be prepared. Based on expected negative fair value of loans, and due to the conversion into HUF of foreign currency loans, provision for impairment was recognised for covering the expected loss of the hedging positions broken up in the amount of 1 Uncovered consumer loans and covered retail mortgage and mortgage backed loans, excluding SME loans are considered as customer loans. IFRS consolidated financial statements 91
23 HUF 36,598 million in the Group s Consolidated IFRS Financial Statements. c) Effect of the Acts on Customer Loans on the Group Provision on losses expected from bid-ask exchange rate spread and unilateral amendment was recognised up to the Bank s standalone expected losses in the Bank s financial statements as at 31 December Provision on expected losses in case of subsidiaries is recognised by subsidiaries in their financial statements. In the level of the Group provision recognised due to Act on Settlement is the following (in HUF mn): Bid-ask exchange rate spread Unilateral amendment of interests Unilateral amendment of fees OTP Bank Plc. 7,377 34,926 1,824 44,127 OTP Mortgage Bank Ltd. 13,978 74, ,537 Merkantil Bank Ltd. 9,480 5,622 4,964 20,066 Merkantil Car Ltd. 1, ,283 OTP Real Estate Leasing Ltd ,501 4,963 Subtotal 32, ,079 7, ,976 Provision for impairment on foreign currency customer loans concerned 36,598 in conversion into HUF Total 196,574 Total In order to eliminate the negative effects of the Acts on its subsidiaries financial position and to secure the continuous capital adequacy, OTP provided capital contribution in amount of HUF 78,304 million in December At the same amount investment in subsidiaries were increased: HUF million OTP Mortgage Bank Ltd. 56,581 Merkantil Bank Ltd. 16,826 OTP Real Estate Leasing Ltd. 4,897 Total 78,304 In the same amount provision for impairment on investment in subsidiaries was recognised. The Group still maintains the point of view that the group members keep completely the effective regulations during its loan activity practice. d) Introduction of deferred tax relating to Acts on Customer Loans Prescription 29/ZS of the Act LXXXI of enables based on accounting regulations in 44 of Act on Settlement to recognise tax difference ( tax receivables ) calculated for clients overpayments relating to customer loan agreements in the form of corporate tax, special tax of business partnerships, local business tax, innovation contribution, special tax of financial institutions, up to the tax declared and paid for the tax years. Tax receivable shall be deducted from the amount of corporate tax payable for the 2015 and the following tax years. Furthermore prescription 29/ZS of the Act LXXXI of 1996 enables to provide non-repayable financial support or grant for subsidiaries, for covering the costs and 2 On Corporate Tax and Dividend Tax. 92 OTP Bank Annual Report 2014
24 expenses directly incurred in connection with implementation of the Act on Settlement. This support has been claimed as expense during calculation of corporate tax. OTP Bank proposes to provide financial support for its subsidiaries to cover their losses. The Bank recognized 33.2 billion HUF deferred tax receivable in the separate financial statements prepared for year 2014 due to the expecting tax receivable based on Act on Settlement and considering the contribution provided to the subsidiaries. e) Derivative deals contracted due to the obligations in relation with the act on customers loan agreements The Bank hedged its theoretically opened position due to the effect of Act on Settlement and Act on Conversion into HUF with spot and derivative deals contracted with NBH. With those subsidiaries which were affected by the Act on Settlement the Bank concluded further derivative deals to have been covered all the opened foreign exchange positions of the subsidiaries, so all the opened foreign exchange position was covered on Group level by EUR/CHF market transactions. NOTE 3: SIGNIFICANT ACCOUNTING ESTIMATES AND DECISIONS IN THE APPLICATION OF ACCOUNTING POLICIES The presentation of financial statements in conformity with IFRS requires the Management of the Group to make judgement about estimates and assumptions that affect the reported amounts of assets and liabilities and the disclosure of contingent assets and liabilities as at the date of the financial statements and their reported amounts of revenues and expenses during the reporting period. The estimates and associated assumptions are based on historical experience and other factors that are considered to be relevant. The estimates and underlying assumptions are reviewed on ongoing basis. Revisions to accounting estimates are recognized in the period. Actual results could differ from those estimates. Significant areas of subjective judgement include: 3.1 Impairment on loans and placements The Group regularly assesses its loan portfolio for impairment. Management determines the adequacy of the allowances based upon reviews of individual loans and placements, recent loss experience, current economic conditions, the risk characteristics of the various categories of loans and other pertinent factors. Provisioning involves many uncertainties about the outcome of those risks and requires the Management of the Group to make many subjective judgements in estimating the loss amounts. An impairment loss is incurred when there is objective evidence of impairment due to one or more events that occurred after the initial recognition of the asset ( a loss event ), when the loss has a reliably measurable impact on the expected future cash flows from the financial asset or group of financial assets. Future cash flows are assessed by the Group on the basis of estimates based on historical parameters. The adopted methodology used for estimating impairment allowances will be developed in line with the further possibilities of accumulations of historic impairment data from the existing information systems and applications. As a consequence, acquiring new data by the Group could affect the level of impairment allowances in the future. IFRS consolidated financial statements 93
25 3.2 Valuation of instruments without direct quotations amount of potential financial losses which are appropriately provided for (see Note 17.) Financial instruments without direct quotations in an active market are valued using the valuation model technique. The models are regularly reviewed and each model is calibrated for the most recent available market data. While the models are built only on available data, their use is subject to certain assumptions and estimates (e.g. correlations, volatilities, etc.). Changes in the model assumptions may affect the reported fair value of the relevant financial instruments. IFRS 13 Fair Value Measurement seeks to increase consistency and comparability in fair value measurements and related disclosures through a fair value hierarchy. The hierarchy categorises the inputs used in valuation techniques into three levels. The hierarchy gives the highest priority to (unadjusted) quoted prices in active markets for identical assets or liabilities and the lowest priority to unobservable inputs. The objective of a fair value measurement is to estimate the price at which an orderly transaction to sell the asset or to transfer the liability would take place between market participants at the measurement date under current market conditions. 3.3 Provisions Provisions are recognized and measured based on IAS 37 Provisions, Contingent Liabilities and Contingent Assets. The Group is involved in a number of ongoing legal disputes. Based upon historical experience and expert reports, the Group assesses the developments in these cases, and the likelihood and the A provision is recognized by the Group when it has a present obligation as a result of a past event, it is probable that an outflow of resources embodying economic benefits will be required to settle the obligation, and a reliable estimate can be made of the amount of the obligation. Provision for off-balance sheet items includes provision for litigation, provision for retirement and expected liabilities, for commitments to extend credit, provision for warranties arising from banking activities and provision for confirmed letter of credit. 3.4 Impairment on goodwill Goodwill acquired in a business combination is tested for impairment annually or more frequently when there is an indication that the unit might be impaired, in accordance with IAS 36 Impairment of assets. The Group calculates the fair value based on discounted cash-flow model. The 5 year period explicit cash-flow model serves as a basis for the impairment test by which the Group defines the impairment need on goodwill based on the strategic factors and financial data of its cash-generating units. In the calculation of the goodwill impairment, also the expectations about possible variations in the amount or timing of those future cash-flows, the time value of money, represented by the current market risk-free rate of interest and other factors are reflected. Goodwill impairment is recorded among the Depreciation and amortization in the Consolidated Statement of Recognized Income. 94 OTP Bank Annual Report 2014
26 NOTE 4: CASH, AMOUNTS DUE FROM BANKS AND BALANCES WITH THE NATIONAL BANKS (in HUF mn) Cash on hand In HUF 66,332 68,063 In foreign currency 143, , , ,132 Amounts due from banks and balances with the National Banks Within one year: In HUF* 1,798,959 51,807 In foreign currency 298, ,528 2,096, ,335 Over one year: In HUF In foreign currency Accrued interest ,097, ,993 Total 2,307, ,125 Compulsory reserve set by the National Banks 304, ,178 NOTE 5: PLACEMENTS WITH OTHER BANKS, NET OF ALLOWANCE FOR PLACEMENT LOSSES (in HUF mn) Within one year: In HUF 12,522 32,424 In foreign currency 266, , , ,322 Over one year: In HUF In foreign currency 2,032 4,911 2,032 4,911 Accrued interest Provision for impairment on placement losses (47) (31) Total 281, ,479 An analysis of the change in the provision for impairment on placement with other banks, net of allowance for placement losses is as follows: Balance as at 1 January 31 1,111 Provision for the year Release of provision for the year (854) (367) Use of provision (712) Foreign currency translation difference (4) (29) Closing balance Interest conditions of placements with other banks: In HUF 0.4% 6.6% 0.1% 9.0% In foreign currency 0.01% 14.9% 0.01% 11.9% Average interest rates on placements with other banks 1.22% 1.48% * Securities issued by the NBH were changed into two-weeks NBH deposit during the year ended 31 December IFRS consolidated financial statements 95
27 NOTE 6: FINANCIAL ASSETS AT FAIR VALUE THROUGH PROFIT OR LOSS (in HUF mn) Securities held for trading: Shares 59,231 73,703 Government bonds 22,942 34,817 Discounted Treasury bills 3,414 2,159 Securities issued by the NBH* 209,347 Other securities 4,439 14,615 Other non-interest bearing securities 3,989 5,912 94, ,553 Accrued interest Total 94, ,540 Positive fair value of derivative financial instruments classified held for trading: CCIRS and mark-to-market CCIRS** classified as held for trading 85,010 8,444 Foreign exchange swaps classified as held for trading 48,636 5,357 Interest rate swaps classified as held for trading 43,401 53,667 Option contracts classified as held for trading 7,128 Foreign exchange forward contracts classified as held for trading 6, Other derivative transactions classified as held for trading 4,223 6, ,635 74,065 Total 289, ,605 An analysis of securities held for trading portfolio by currency: Denominated in HUF 81.7% 86.9% Denominated in foreign currency 18.3% 13.1% Total 100.0% 100.0% An analysis of government bond portfolio by currency: Denominated in HUF 54.0% 9.5% Denominated in foreign currency 46.0% 90.5% Total 100.0% 100.0% Interest rates on securities held for trading 1.5% 11.0% 2.9% 13.0% Average interest rates on securities held for trading 2.06% 1.46% * Securities issued by the NBH were changed into two-weeks NBH deposit during the year ended 31 December ** CCIRS: Cross Currency Interest Rate Swaps (see Note 28.). 96 OTP Bank Annual Report 2014
28 Interest conditions and the remaining maturities of securities held for trading can be analysed as follows: Within five years: With variable interest 1,125 7,245 With fixed interest 23, ,085 24, ,330 Over five years: With variable interest With fixed interest 6,198 3,945 6,204 4,608 Non-interest bearing securities 63,220 79,615 Total 94, ,553 NOTE 7: SECURITIES AVAILABLE-FOR-SALE (in HUF mn) Government bonds 680, ,263 Discounted Treasury bills 42,168 38,088 Corporate bonds 37,457 71,148 From this: Listed securities: In HUF In foreign currency 11,598 67,930 11,598 67,930 Non-listed securities: In HUF 3,261 3,218 In foreign currency 22,598 25,859 3,218 Bonds issued by NBH* 1,151,208 Other securities 21,138 8,562 Other non-interest bearing securities 43,646 41,702 From this: Listed securities: In HUF In foreign currency 7,114 6,521 7,114 6,521 Non-listed securities: In HUF 28,346 27,013 In foreign currency 8,186 8,168 36,532 35, ,732 1,628,971 Accrued interest 15,694 9,250 Provision for impairment on securities available-for-sale (1,274) (966) Total 839,152 1,637,255 * Securities issued by the NBH were changed into two-weeks NBH deposit during the year ended 31 December IFRS consolidated financial statements 97
29 An analysis of securities available-for sale by currency: Denominated in HUF 84.6% 82.6% Denominated in foreign currency 15.4% 17.4% Total 100.0% 100.0% An analysis of government bonds by currency: Denominated in HUF 81.2% 47.1% Denominated in foreign currency 18.8% 52.9% Total 100.0% 100.0% Interest rates on securities available-for-sale denominated in HUF 1.7% 8.0% 2.9% 8.0% Interest rates on securities available-for-sale denominated in foreign currency 0.3% 28.0% 0.3% 22.0% Average interest rates on securities available-for-sale denominated in HUF 3.07% 4.10% Average interest rates on securities available-for-sale denominated in foreign currency 5.85% 9.12% Interest conditions and the remaining maturities of available-for-sale financial assets can be analysed as follows: Within five years: With variable interest 2,701 4,258 With fixed interest 616,404 1,500, ,105 1,504,574 Over five years: With variable interest 117 3,730 With fixed interest 161,864 78, ,981 82,695 Non-interest bearing securities 43,646 41,702 Total 824,732 1,628,971 An analysis of the change in the provision for impairment on securities available-for-sale is as follows: Balance as at 1 January 966 1,226 Provision for the year Release of provision (1) Use of provision (265) Foreign currency translation difference 11 5 Closing balance 1, Certain securities are hedged against interest rate risk. See Note 40. NOTE 8: LOANS, NET OF ALLOWANCE FOR LOAN LOSSES (in HUF mn) Short-term loans and promissory notes (within one year) 2,245,818 2,537,167 Long-term loans and promissory notes (over one year) 4,690,266 4,875,633 6,936,084 7,412,800 Accrued interest 57,242 68,044 Provision for impairment on loan losses (1,129,085) (1,235,634) Total 5,864,241 6,245, OTP Bank Annual Report 2014
30 An analysis of the loan portfolio by currency: In HUF 29% 27% In foreign currency 71% 73% Total 100% 100% Interest rates of the loan portfolio are as follows: Short-term loans denominated in HUF 0.04% 42.0% 0.3% 40.4% Long-term loans denominated in HUF 0.04% 42.0% 0.3% 40.4% Short-term loans denominated in foreign currency 0.01% 64.9% 0.01% 66% Long-term loans denominated in foreign currency 0.01% 66.9% 0.01% 64.9% Average interest rates on loans denominated in HUF 4.68% 4.94% Average interest rates on loans denominated in foreign currency 16.23% 16.54% Gross loan portfolio on which interest to customers is not being accrued 17.9% 18.4% An analysis of the change in the provision for impairment on loan losses is as follows: Balance as at 1 January 1,235,634 1,154,176 Provision for the year 708, ,614 Release of provision (319,393) (328,859) Partial write-off* (237,593) Increase due to acquisition 772 Use of provision (85,494) (79,996) Foreign currency translation difference (173,584) (24,301) Closing balance 1,129,085 1,235,634 Provision for impairment on loan and placement losses is summarized as below: Provision for impairment (Release of provision) on placement losses 10 (374) Provision for impairment on loan losses 446, ,943 Total 446, ,569 NOTE 9: ASSOCIATES AND OTHER INVESTMENTS (in HUF mn) Investments Investments in associates (non-listed) 17,768 15,583 Other investments (non-listed) at cost** 8,917 12,485 26,685 28,068 Provision for impairment on investments (3,304) (4,231) Total 23,381 23,837 An analysis of the change in the provision for impairment on investments is as follows: Balance as at 1 January 4,231 2,968 Provision for the year 1,244 1,370 Change due to merge (1,927) Use of provision (245) (132) Foreign currency translation difference 1 25 Closing balance 3,304 4,231 * See details in Note ** These instruments do not have a quoted market price in an active market and whose fair value cannot be reliably measured. IFRS consolidated financial statements 99
31 NOTE 10: SECURITIES HELD-TO-MATURITY (in HUF mn) Government bonds 692, ,522 Mortgage bonds Discounted Treasury bills Corporate bonds 7 1, , ,542 Accrued interest 16,725 14,284 Provision for impairment on securities held-to-maturity (814) (775) Total 709, ,051 Interest conditions and the remaining maturities of securities held-to-maturity can be analysed as follows: Within five years: With variable interest 7,438 16,457 With fixed interest 375, , , ,569 Over five years: With variable interest With fixed interest 310, , , ,973 Total 693, ,542 An analysis of securities held-to-maturity by currency: Denominated in HUF 92.7% 89.8% Denominated in foreign currency 7.3% 10.2% Total 100% 100% In most cases, interest on variable rate bonds is based on the interest rates of 90 day Hungarian government Treasury bills and is adjusted semi-annually. Interest on fixed rate and variable rate securities is, in most cases, paid semi-annually. Interest rates of securities held-to-maturity with variable interest 0.02% 2.5% 0.02% 4.25% Interest rates of securities held-to-maturity with fixed interest 0.9% 12.0% 2.6% 10.9% Average interest rates on securities held-to-maturity 6.34% 6.71% An analysis of the change in the provision for impairment on securities held-to-maturity is as follows: Balance as at 1 January Provision for the year 21 Release of provision (32) Foreign currency translation difference Closing balance OTP Bank Annual Report 2014
32 NOTE 11: PROPERTY, EQUIPMENT AND INTANGIBLE ASSETS (in HUF mn) For the year ended 31 December 2014: Intangible assets and goodwill Property Office equipmen and vehicles Construction in progress Cost Balance as at 1 January 374, , ,906 26, ,792 Additions 41,354 7,292 14,785 18,246 81,677 Acquisition 252 1, ,156 Foreign currency translation differences (20,986) (3,887) (5,142) 165 (29,850) Disposals (49,075) (2,398) (16,275) (32,777) (100,525) Transfer* (628) (28,190) (20,939) (49,757) Change in consolidation scope Balance as at 31 December 345, , ,855 11, ,616 Depreciation and Amortization Balance as at 1 January 181,190 49, , ,548 Charge for the year (without goodwill impairment) 22,614 5,346 15,762 43,722 Goodwill impairment 22,225 22,225 Foreign currency translation differences 3,207 (1,311) (4,219) (2,323) Disposals (41,945) (180) (13,168) (55,293) Transfer* (179) (6,909) (7,403) (14,491) Change in consolidation scope Balance as at 31 December 187,134 46, , ,455 Net book value Balance as at 1 January 193, ,835 62,347 26, ,244 Balance as at 31 December 158, ,178 44,279 11, ,161 Total An analysis of the changes in the goodwill for the six month period ended 31 December 2014 is as follows: Goodwill Cost Balance as at 1 January 145,564 Additions Foreign currency translation difference (22,277) Impairment for the current period (22,225) Balance as at 31 December 101,062 Net book value Balance as at 1 January 145,564 Balance as at 31 December 101,062 Book value of the goodwill allocated to the appropriate cash generation units: List of units HUF million JSC OTP Bank (Russia) 41,806 DSK Bank EAD 28,541 OTP banka Hrvatska d.d. 18,280 OTP Bank Romania S.A. 6,257 Monicomp Ltd. 5,732 OTP Banka Slovensko a.s. 93 Other** 353 Total 101,062 The Bank prepared the IFRS goodwill impairment tests of the subsidiaries based on two different net present value calculation methods that shows the same result; however they represent different economical logics. On one hand is the discount cash-flow method (DCF) * Assets subject to operating lease and investment properties are differentiated according to their purposes for use so they had been transferred from tangible and intangible assets to other assets (see more details in Note 12.). ** Other category includes: OTP Real Estate Leasing Ltd., Nimo 2002 Ltd., POK DSK-Rodina a.d. IFRS consolidated financial statements 101
33 that calculates the value of the subsidiaries by discounting their expected cash-flow; on the other hand the economic value added (EVA) method estimates the value of the subsidiaries from the initial invested capital and the present value of the economic profit that the companies are expected to generate in the future. The Bank applied a cash-flow model with an explicit period between , except in the case of OTP Bank JSC (Russia) and JSC OTP Bank (Ukraine) where the explicit period was , where for 2015 the actual, accepted annual financial plans are included and the actual financial strategic plans ( ) were used as forecasts for the period between 2018 and Present value calculation with the DCF method The Bank calculated the expected cash-flow for the given period based on the expected after-tax profit of the companies. For calculating the discount factor it was considered the base rates of the national banks in the actual macro forecasts as risk free rates and the Group calculated risk premiums by modifying the country risk premiums that are published on damodaran.com with the CDS of the different countries spread as at 31 December The values of the subsidiaries in the DCF method were then calculated as the sum of the discounted cash-flows of the explicit period, the present value of the terminal values and the initial free capital assuming an effective capital structure. Present value calculation with the EVA method A company creates positive economic profit/ value if the profitability of the invested capital is higher than the normal profit the profit that can be usually generated in the banking sector, which means that the company s profitability exceeds the expected yield. The economic profit of the subsidiaries was calculated by deducting the cost of invested capital from the net profit for the year. The applied discount factor and the indicators used for calculating the residual value (long-term cost of capital and growth rate) are the same that are used in the DCF method. Summary of the impairment test for the year ended 31 December 2014 Based on the valuations of the subsidiaries, the total IFRS goodwill, recorded for OTP Bank JSC (Ukraine) as at the balance sheet date, was impaired, which meant HUF 22,225 million consolidated IFRS goodwill impairment as at 31 December For the year ended 31 December 2013: Intangible assets and goodwill Property Office equipmen and vehicles Construction in progress Cost Balance as at 1 January 363, , ,618 18, ,806 Additions 32,622 11,394 22,509 29,217 95,742 Foreign currency translation differences (7,438) (901) (893) 97 (9,135) Disposals (13,939) (2,605) (20,562) (22,755) (59,861) Change in consolidation scope ,240 Balance as at 31 December 374, , ,906 26, ,792 Depreciation and Amortization Balance as at 1 January 125,775 44, , ,664 Charge for the year (without goodwill impairment) 22,192 5,644 19,362 47,198 Goodwill impairment 30,819 30,819 Foreign currency translation differences 6, (776) 5,561 Disposals (3,818) (963) (17,135) (21,916) Change in consolidation scope Balance as at 31 December 181,190 49, , ,548 Net book value Balance as at 1 January 237, ,869 62,596 18, ,142 Balance as at 31 December 193, ,835 62,347 26, ,244 Total 102 OTP Bank Annual Report 2014
34 An analysis of the changes in the goodwill for the year ended 31 December 2013 is as follows: Goodwill Cost Balance as at 1 January 189,619 Additions Foreign currency translation difference (13,236) Impairment for the current period (30,819) Balance as at 31 December 145,564 Net book value Balance as at 1 January 189,619 Balance as at 31 December 145,564 Book value of the goodwill allocated to the appropriate cash generation units: List of units HUF million JSC OTP Bank (Russia) 61,534 DSK Bank EAD 28,541 OTP Bank JSC (Ukraine) 26,179 OTP banka Hrvatska d.d. 17,236 OTP Bank Romania S.A. 5,900 Monicomp Ltd. 5,732 OTP Banka Slovensko a.s. 88 Other* 354 Total 145,564 Summary of the impairment test for the year ended 31 December 2013 Based on the valuations of the subsidiaries HUF 30,819 million consolidated IFRS goodwill impairment was recorded for OTP Bank JSC (Ukraine). NOTE 12: OTHER ASSETS** (in HUF mn) Deferred tax receivables 61,009 5,286 Investment properties*** 31,322 Assets subject to operating lease*** 24,668 Inventories 43,936 63,136 Fair value of derivative financial instrument designated as fair value hedge 30,454 26,803 Prepayments and accrued income 24,513 19,305 Trade receivables 12,121 14,581 Receivable from the National Asset Management 9,718 12,295 Receivables from card operations**** 9,615 Current income tax receivable 8,843 6,938 Other advances 5,695 8,426 Variation margin 3,996 3,623 Receivables from investment services 3,960 3,155 Receivables due from pension funds and investment funds 3,874 2,115 Loans sold under deferred payment scheme 2,299 Other receivables from Hungarian Government 2,233 5,042 Receivables from leasing activities 1, Advances for securities and investments Other 44,704 62,143 Subtotal 324, ,488 Provision for impairment on other assets***** (32,902) (23,247) Total 291, ,241 * Other category includes: OTP Real Estate Leasing Ltd., Nimo 2002 Ltd., POK DSK-Rodina a.d. ** Other assets except income tax receivable and fair value of derivative financial instruments designated as fair value hedge are expected to be recovered or settled no more than twelve months after the reporting period. Income tax receivable will be enforced in the tax return for the year Unrealised gains/losses on derivative financial instruments are recovering in accordance with their maturity. *** Assets subject to operating lease and investment properties are differentiated according to their purposes for use so they had been transferred from tangible and intangible assets to other assets (see more details in Note 11.). **** Accounting of receivables from card operations recognized due to different timing of cash settlement has changed for the year ended 31 December ***** Provision for impairment on other assets mainly consists of provision for impairment on investment properties and inventories. IFRS consolidated financial statements 103
35 Positive fair value of derivative financial instruments designated as fair value hedge: Interest rate swaps designated as fair value hedge 14,032 9,733 CCIRS and mark-to-market CCIRS designated as fair value hedge 13,940 15,472 Foreign exchange swaps designated as fair value hedge 2,437 1,520 Forward security agreements designated as fair value hedge 44 Other transactions designated as fair value hedge Total 30,454 26,803 An analysis of the movement in the provision for impairment on other assets is as follows: Balance as at 1 January 23,247 21,265 Provision for the year 9,726 4,313 Provision due to transfer* 2,353 Use of provision (2,573) (2,422) Foreign currency translation difference Closing balance 32,902 23,247 NOTE 13: AMOUNTS DUE TO BANKS, THE HUNGARIAN GOVERNMENT, DEPOSITS FROM THE NATIONAL BANKS AND OTHER BANKS (in HUF mn) Within one year: In HUF 148, ,641 In foreign currency 302, , , ,355 Over one year: In HUF 150, ,958 In foreign currency 106, , , ,394 Accrued interest 890 1,463 Total** 708, ,212 Interest rates on amounts due to banks, the Hungarian Government, deposits from the National Banks and other banks are as follows: Within one year: In HUF 1.2% 5.2% 0.2% 5.8% In foreign currency 0.05% 18.8% 0.02% 8.9% Over one year: In HUF 0.1% 5.2% 0.2% 5.2% In foreign currency 0.1% 18.0% 0.1% 18.0% Average interest rates on amounts due to banks, the Hungarian Government, deposits from the National Banks and other banks 1.72% 2.13% * Provisions on assets subject to operating lease and investment properties which were transferred from tangible and intangible assets to the other assets (see more details in Note 11 and Note 25.). ** It contains loans lent among the frame of Funding for Growth Scheme, which are accounted as government grant regulated by IAS 20 standard. See more details in Note OTP Bank Annual Report 2014
36 NOTE 14: DEPOSITS FROM CUSTOMERS (in HUF mn) Within one year: In HUF 3,716,886 3,045,371 In foreign currency 3,667,694 3,518,242 7,384,580 6,563,613 Over one year: In HUF 101, ,582 In foreign currency 158, , , ,590 Accrued interest 28,541 38,403 Total 7,673,478 6,866,606 Interest rates on deposits from customers are as follows: Within one year: In HUF 0.01% 10.3% 0.01% 10.3% In foreign currency 0.01% 29.0% 0.01% 27.0% Over one year: In HUF 0.01% 3.1% 0.01% 5.0% In foreign currency 0.01% 26.0% 0.01% 28.5% Average interest rates on deposits from customers denominated 0.80% 1.62% in HUF Average interest rates on deposits from customers denominated in foreign currency 5.52% 6.98% An analysis of deposits from customers by type, is as follows*: Retail deposits 4,566,737 60% 4,269,711 62% Corporate deposits 2,693,704 35% 2,235,522 33% Municipality deposits 384,496 5% 322,970 5% Total 7,644, % 6,828, % NOTE 15: LIABILITIES FROM ISSUED SECURITIES (in HUF mn) With original maturity Within one year: In HUF 28,812 50,795 In foreign currency 53, ,580 82, ,375 Over one year: In HUF 162, ,889 In foreign currency 13,051 43, , ,695 Accrued interest 9,414 11,148 Total 267, ,218 Interest rates on liabilities from issued securities are as follows: Issued securities denominated in HUF 0.10% 10.0% 0.25% 10.0% Issued securities denominated in foreign currency 0.23% 10.5% 0.44% 4.0% Average interest rates on issued securities 4.01% 6.61% * Without accrued interest liability. IFRS consolidated financial statements 105
37 Issued securities denominated in HUF as at 31 December 2014: Name Date of issue Maturity Nominal value (in HUF mn) Interest conditions (in % p.a.) Hedged 1. OTP TBSZ 2015/I 26/02/ /12/ /12/2015 5, fixed 2. OTP TBSZ 2016/I 14/01/ /08/ /12/2016 1, fixed 3. OTP TBSZ 2016/II 26/08/ /12/ /12/ fixed 4. OTP TBSZ /I 13/01/ /06/ /12/ fixed 5. OTP TBSZ /II 21/12/ /12/ fixed 6. OTP TBSZ /I 18/01/ /02/ /12/ fixed 7. OTP TBSZ /I 13/01/ /06/ /12/ fixed 8. OTP 2015/Ax 25/03/ /03/2015 4,429 indexed floating hedged 9. OTP 2015/Bx 28/06/ /07/2015 4,060 indexed floating hedged 10. OTP 2015/Dx 22/03/ /03/ indexed floating hedged 11. OTP 2015/Ex 18/07/ /07/ indexed floating hedged 12. OTP 2015/Hx 28/12/ /12/ indexed floating hedged 13. OTP 2016/Ax 11/11/ /11/2016 3,654 indexed floating hedged 14. OTP 2016/Bx 16/12/ /12/2016 2,786 indexed floating hedged 15. OTP 2016/Ex 28/12/ /12/ indexed floating hedged 16. OTP 2016/Fx 22/03/ /03/ indexed floating hedged 17. OTP 2017/Ax 01/04/ /03/2017 4,347 indexed floating hedged 18. OTP 2017/Bx 17/06/ /06/2017 4,243 indexed floating hedged 19. OTP 2017/Cx 19/09/ /09/2017 3,186 indexed floating hedged 20. OTP 2017/Dx 20/10/ /10/ indexed floating hedged 21. OTP 2017/Ex 21/12/ /12/2017 3,449 indexed floating hedged 22. OTP 2018/Ax 03/01/ /01/ indexed floating hedged 23. OTP 2018/Bx 22/03/ /03/2018 4,091 indexed floating hedged 24. OTP 2018/Cx 18/07/ /07/2018 3,523 indexed floating hedged 25. OTP 2018/Dx 29/10/ /10/2018 2,930 indexed floating hedged 26. OTP 2018/Ex 28/12/ /12/2018 3,029 indexed floating hedged 27. OTP 2019/Ax 25/06/ /07/ indexed floating hedged 28. OTP 2019/Bx 05/10/ /02/ /10/ indexed floating hedged 29. OTP 2019/Cx 14/12/ /12/ indexed floating hedged 30. OTP 2019/Dx 22/03/ /03/2019 4,400 indexed floating hedged 31. OTP 2019/Ex 28/06/ /06/2019 3,344 indexed floating hedged 32. OTP 2020/Ax 25/03/ /03/ indexed floating hedged 33. OTP 2020/Bx 28/06/ /07/ indexed floating hedged 34. OTP 2020/Cx 11/11/ /11/ indexed floating hedged 35. OTP 2020/Dx 16/12/ /12/ indexed floating hedged 36. OTP 2020/Ex 18/06/ /06/2020 4,100 indexed floating hedged 37. OTP 2020/Fx 10/10/ /10/2020 3,500 indexed floating hedged 38. OTP 2020/Gx 15/12/ /12/2020 3,250 indexed floating hedged 39. OTP 2021/Ax 01/04/ /04/ indexed floating hedged 40. OTP 2021/Bx 17/06/ /06/ indexed floating hedged 41. OTP 2021/Cx 19/09/ /09/ indexed floating hedged 42. OTP 2021/Dx 21/12/ /12/ indexed floating hedged 43. OTP 2022/Ax 22/03/ /03/ indexed floating hedged 44. OTP 2022/Bx 18/07/ /07/ indexed floating hedged 45. OTP 2022/Cx 29/10/ /10/ indexed floating hedged 46. OTP 2022/Dx 28/12/ /12/ indexed floating hedged 47. OTP 2023/Ax 22/03/ /03/ indexed floating hedged 48. OTP 2023/Bx 28/06/ /06/ indexed floating hedged 49. OTP 2024/Ax 18/06/ /06/ indexed floating hedged 50. OTP 2024/Bx 10/10/ /10/ indexed floating hedged 51. OTP 2024/Cx 15/12/ /12/ indexed floating hedged 52. OTP 2020/RF/A 12/07/ /07/2020 2,370 indexed floating hedged 53. OTP 2020/RF/B 12/07/ /07/2020 1,131 indexed floating hedged 54. OTP 2020/RF/C 11/11/ /11/2020 2,475 indexed floating hedged 55. OTP 2021/RF/A 05/07/ /07/2021 1,946 indexed floating hedged 56. OTP 2021/RF/B 20/10/ /10/2021 1,961 indexed floating hedged 57. OTP 2021/RF/C 21/12/ /12/ indexed floating hedged 58. OTP 2021/RF/D 21/12/ /12/ indexed floating hedged 59. OTP 2021/RF/E 21/12/ /12/ indexed floating hedged 60. OTP 2022/RF/A 22/03/ /03/2022 1,053 indexed floating hedged 61. OTP 2022/RF/B 22/03/ /03/ indexed floating hedged 62. OTP 2022/RF/C 28/06/ /06/ indexed floating hedged 63. OTP 2022/RF/D 28/06/ /06/ indexed floating hedged 64. OTP 2022/RF/E 29/10/ /10/ indexed floating hedged 106 OTP Bank Annual Report 2014
38 Name Date of issue Maturity Nominal value (in HUF mn) Interest conditions (in % p.a.) Hedged 65. OTP 2022/RF/F 28/12/ /12/ indexed floating hedged 66. OTP 2023/RF/A 22/03/ /03/ indexed floating hedged 67. OTP DNT HUF % 30/06/ /01/ indexed floating hedged 68. OTP EK 2015/I 29/07/ /01/2015 5, fixed 69. OTP OJK 2016/I 26/08/ /12/ /08/ fixed 70. OTP OJK 2017/I 27/01/ /07/ /01/ fixed 71. OJB 2015/I 10/06/ /06/2015 3, fixed 72. OJB 2015/J 28/01/ /01/ fixed 73. OJB 2016/I 03/02/ /02/2016 1, fixed 74. OJB 2016/II 31/08/ /08/2016 4, fixed 75. OJB 2016/J 18/04/ /09/ fixed 76. OJB 2019/I 17/03/ /03/ , fixed 77. OJB 2019/II 25/05/ /03/2019 1, fixed 78. OJB 2020/I 19/11/ /11/2020 5,503 9 fixed 79. OJB 2020/II 25/05/ /11/2020 1,486 9 fixed 80. Other* 33,976 Subtotal issued securities in HUF 181,906 Unamortized premium (3,889) Fair value adjustment 13,377 Total issued securities in HUF 191,394 * From the total amount HUF 33,745 million is mobil deposits of Merkantil Bank. IFRS consolidated financial statements 107
39 Issued securities denominated in foreign currency as at 31 December 2014: Name Date of issue Maturity Type of FX Nominal value (FX mn) (HUF mn) Interest conditions (in % p.a.) 1. OTP EUR /I 20/12/ /01/2015 EUR , fixed 2. OTP EUR /II 17/01/ /01/2015 EUR , fixed 3. OTP EUR /III 31/01/ /02/2015 EUR , fixed 4. OTP EUR /IV 14/02/ /02/2015 EUR , fixed 5. OTP EUR /V 28/02/ /03/2015 EUR , fixed 6. OTP EUR /VI 14/03/ /03/2015 EUR , fixed 7. OTP EUR /VII 21/03/ /04/2015 EUR fixed 8. OTP EUR /VIII 11/04/ /04/2015 EUR , fixed 9. OTP EUR /IX 18/04/ /05/2015 EUR fixed 10. OTP EUR /X 09/05/ /05/2015 EUR , fixed 11. OTP EUR /XI 23/05/ /06/2015 EUR , fixed 12. OTP EUR /XII 06/06/ /06/2015 EUR fixed 13. OTP EUR /XIII 20/06/ /07/2015 EUR fixed 14. OTP EUR /XIV 04/07/ /07/2015 EUR fixed 15. OTP EUR /XV 18/07/ /08/2015 EUR fixed 16. OTP EUR /XVI 30/07/ /08/2015 EUR , fixed 17. OTP EUR /XVII 08/08/ /08/2015 EUR , fixed 18. OTP EUR /XVIII 29/08/ /09/2015 EUR , fixed 19. OTP EUR /XIX 12/09/ /09/2015 EUR , fixed 20. OTP EUR /XX 03/10/ /10/2015 EUR , fixed 21. OTP EUR /XXI 22/10/ /11/2015 EUR ,659 1 fixed 22. OTP EUR /XXII 31/10/ /11/2015 EUR fixed 23. OTP EUR /XXIII 14/11/ /11/2015 EUR ,739 1 fixed 24. OTP EUR /XXIV 28/11/ /12/2015 EUR ,635 1 fixed 25. OTP EUR /XXV 19/12/ /01/2016 EUR ,969 1 fixed 26. OTP EUR /I 11/01/ /01/2015 EUR fixed 27. OTP EUR /II 25/01/ /01/2015 EUR fixed 28. OTP EUR /III 01/02/ /02/2015 EUR fixed 29. OTP EUR /IV 15/02/ /02/2015 EUR fixed 30. OTP EUR /V 01/03/ /03/2015 EUR fixed 31. OTP EUR /VI 22/03/ /03/2015 EUR fixed 32. OTP EUR /VII 05/04/ /04/2015 EUR fixed 33. OTP EUR /VIII 19/04/ /04/2015 EUR fixed 34. OTP EUR /IX 10/05/ /05/2015 EUR fixed 35. OTP EUR /X 24/05/ /05/2015 EUR fixed 36. OTP EUR /XI 07/06/ /06/2015 EUR fixed 37. OTP EUR /XII 21/06/ /06/2015 EUR fixed 38. OTP EUR /XIII 28/06/ /06/2015 EUR fixed 39. OTP EUR /XIV 12/07/ /07/2015 EUR fixed 40. OTP EUR /XV 26/07/ /07/2015 EUR fixed 41. OTP EUR /XVI 16/08/ /08/2015 EUR fixed 42. OTP EUR /XVII 30/08/ /08/2015 EUR fixed 43. OTP EUR /XVIII 13/09/ /09/2015 EUR fixed 44. OTP EUR /XIX 27/09/ /09/2015 EUR fixed 45. OTP EUR /XX 11/10/ /10/2015 EUR fixed 46. OTP EUR /XXI 31/10/ /10/2015 EUR fixed 47. OTP EUR /XXII 15/11/ /11/2015 EUR fixed 48. OTP EUR /XXIII 29/11/ /11/2015 EUR fixed 49. OTP EUR /XXIV 20/12/ /12/2015 EUR fixed 50. OTP EUR /I 17/01/ /01/2016 EUR fixed 51. OTP EUR /II 31/01/ /01/2016 EUR fixed 52. OTP EUR /III 14/02/ /02/2016 EUR fixed 53. OTP EUR /IV 28/02/ /02/2016 EUR fixed 54. OTP EUR /V 14/03/ /03/2016 EUR fixed 55. OTP EUR /VI 21/03/ /03/2016 EUR fixed 56. OTP EUR /VII 11/04/ /04/2016 EUR fixed 57. OTP EUR /VIII 18/04/ /04/2016 EUR fixed 58. OTP EUR /IX 09/05/ /05/2016 EUR fixed 59. OTP EUR /X 23/05/ /05/2016 EUR fixed 60. OTP EUR /XI 06/06/ /06/2016 EUR fixed 61. OTP EUR /XII 20/06/ /06/2016 EUR fixed 62. OTP EUR /XIII 04/07/ /07/2016 EUR fixed 63. OTP EUR /XIV 18/07/ /07/2016 EUR fixed 64. OTP EUR /XV 30/07/ /07/2016 EUR fixed 65. OTP EUR /XVI 08/08/ /08/2016 EUR fixed 66. OTP EUR /XVII 29/08/ /08/2016 EUR fixed 67. OTP EUR /XVIII 12/09/ /09/2016 EUR fixed Hedged 108 OTP Bank Annual Report 2014
40 Name Date of issue Maturity Type of FX Nominal value (FX mn) (HUF mn) Interest conditions (in % p.a.) Hedged 68. OTP EUR /XIX 03/10/ /10/2016 EUR fixed 69. OTP 2015/Cx 27/12/ /12/2015 EUR indexed floating hedged 70. OTP 2015/Fx 21/12/ /12/2015 EUR indexed floating hedged 71. OTP 2016/Cx 22/04/ /04/2016 EUR indexed floating hedged 72. OTP 2016/Dx 22/12/ /12/2016 EUR indexed floating hedged 73. OTP 2017/Fx 19/06/ /06/2017 EUR indexed floating hedged 74. OTP 2018/Fx 19/12/ /12/2018 EUR indexed floating hedged 75. OTP_VK_USD_2_2016/1 28/11/ /11/2016 USD fixed 76. OMB2015_I 30/08/ /03/2015 EUR 5 1, floating hedged 77. Mortgage bonds OTP VII 21/12/ /12/2015 EUR , floating 78. Mortgage bonds OTP XXV 28/09/ /09/2016 EUR , fixed 79. OTPRU 15/03 06/03/ /03/2015 RUB , fixed 80. Other* 4,493 Subtotal issued securities in FX 66,061 Unamortized premium 139 Fair value adjustment 76 Total issued securities in FX 66,276 Accrued interest 9,414 Total issued securities 267,084 Term Note Program in the value of HUF 500 billion for the year of 2013/2014 On 9 July 2013 the Bank initiated term note program in the value of HUF 500 billion with the intention of issuing registered dematerialized bonds in public. The Authority approved on 30 July 2013 the prospectus of Term Note Program and the disclosure as at 17 July The prospectus is valid for 12 months following the disclosure. The Issuer can initiate to introduce the bonds issued under the program to the Budapest, Slovakian, Romanian and Bulgarian Stock Exchange. 54,204 pieces of fixed bonds with nominal value of EUR 100 each in the total nominal amount of EUR 5,420,400 have been introduced to the Budapest Stock Exchange. On 10 September 2014 the NBH approved the disclosure and the prospectus as at 27 August Term Note Program in the value of HUF 500 billion for the year of 2014/2015 On 8 July 2014 the Bank initiated term note program in the value of HUF 500 billion with the intention of issuing registered dematerialized bonds in public. The NBH approved on 29 July 2014 the prospectus of Term Note Program and the disclosure as at 25 July The prospectus is valid for 12 months following the disclosure. The Issuer can initiate to introduce the bonds issued under the program to the Budapest, Slovakian, Romanian and Bulgarian Stock Exchange. Certain structured bonds are hedged by interest rate swaps ( IRS ) which may transfer to a transferee a fixed rate and enter into an interest rate swap with the transferee to receive a fixed interest rate and pay a variable interest rate and amount of the structure if any based on a notional amount which is equal to the notional amount of the hedged bond. In certain cases amount of the structure is hedged by options which give the owner the right to get amount of the structure which is equal to the structure of the hedged bond. The hedge is highly effective if changes in fair value or cash-flows attributable to the hedged risk during the period for which the hedge is designated are within a range of per cent. The cash-flows of the fixed rate securities issued by the Bank are exposed to the change in the HUF/EUR foreign exchange rate and the risk of change in the quoted interest rates of EUR and HUF. The interest rate risk and foreign exchange risk related to these securities are hedged with EUR and HUF IRS transactions, where the fixed interests were swapped to payments linked to 3 month HUF BUBOR and EURIBOR, resulting a decrease in the interest rate and foreign exchange exposure of issued securities. * Other category includes promissory notes issued by OTP Banka Slovensko a.s. in the amount of HUF 1,133 million and by JSC OTP Bank (Russia) in the amount of HUF 3,360 million. IFRS consolidated financial statements 109
41 NOTE 16: FINANCIAL LIABILITIES AT FAIR VALUE THROUGH PROFIT OR LOSS (in HUF mn) Negative fair value of derivative financial instruments classified as held for trading by type of contracts: Interest rate swaps classified as held for trading 63,691 67,881 CCIRS and mark-to-market CCIRS classified as held for trading 53,724 7,521 Foreign exchange swaps classified as held for trading 51,537 5,316 Option contracts classified as held for trading 6,215 3,047 Foreign exchange forward contracts classified as held for trading 5,582 1,989 Forward security agreements classified as held for trading Forward rate agreements classified as held for trading (FRA) Other transactions classified as held for trading 2, Total 183,994 87,164 NOTE 17: OTHER LIABILITIES* (in HUF mn) Provision for impairment on off-balance sheet commitments and contingent liabilities 217,351 22,180 Fair value of derivative financial instruments designated as fair value hedge 85,679 74,695 Financial liabilities from OTP MOL share swap transaction** 56,445 71,548 Liabilities from investment services 41,264 53,068 Accrued expenses 33,015 32,701 Salaries and social security payable 25,583 26,111 Liabilities connected to Cafeteria benefits 22,700 21,475 Accounts payable 22,373 18,231 Current income tax payable 14,707 21,786 Giro clearing accounts 13,119 7,964 Deferred tax liabilities 9,855 17,559 Clearing, settlement and pending accounts 7,284 8,135 Advances received from customers 3,266 2,546 Liabilities connected to leasing activities 1,080 1,235 Liabilities connected to loans for collection 909 1,044 Loans from government Liabilities related to housing loans Dividend payable Other 36,102 39,892 Subtotal 591, ,182 Accrued interest Total 592, ,353 * Other liabilities except financial liabilities from OTP MOL share swap transaction, deferred tax liabilities and fair value of derivative financial instruments designated as fair value hedge are expected to be recovered or settled no more than twelve months after the reporting period. Unrealised gains/losses on OTP MOL share swap transaction is settled in June of each year until the maturity date. The fair value of amount being settled in 2014 is HUF 423 million as at 31 December Unrealised gains/losses on derivative financial instruments is recovering in accordance with their maturity. Besides the total other liabilities mentioned above which are expected to be recovered or settled more than twelve months after the reporting period it should be mentioned accrued contractual liabilities, compulsory pension reserve, guarantee deposits in relation with leasing activities, loans from government and liabilities from preferential dividend shares. ** On 16 April 2009 OTP Bank Plc. and MOL Hungarian Oil and Gas Plc. entered into a 3 years share swap transaction. MOL obtained 24 million pieces of Bank s ordinary shares (8.57% of the ordinary shares) and OTP obtained approximately 5 million pieces of MOL shares. Both parties were granted by an American style call and put option to initiate the gross physical settlement of shares back to the issuer until 11 July On 11 July 2012 the parties amended the final maturity of the share swap agreement for 11 July 2017 until which any party can initiate cash or physical settlement of the transaction. There is no compulsory settlement of shares at the maturity of the swap agreement. The agreement contains additional settlement provisions in case of certain movement of relative share prices of the parties subject to net cash or net share settlement. Due to the loss of control over the Treasury shares, the Treasury shares were derecognized and MOL shares were recognized as held for trading securities. The written put option over OTP ordinary shares were accounted as a deduction from equity with the amount of HUF 55.5 billion and a recognition of a corresponding liability. As at 31 December 2014 and 2013 HUF 56,445 and HUF 71,548 million liability was presented in other liabilities. The measurement is based on the fair value of MOL shares to be delivered at the potential exercise of the call and put options adjusted with the expected present value of the net cash or net share settlement due to certain movement of relative share prices. 110 OTP Bank Annual Report 2014
42 The provision for losses on off-balance sheet commitments and contingent liabilities are detailed as follows: Provision on contingent liabilities due to regulations related to customer loans* 196,574 Provision for litigation 7,454 3,267 Provision for losses on other off-balance sheet commitments and contingent 3,566 10,189 liabilities related to lending Provision for expected pension commitments 3,430 1,253 Provision for other liabilities 6,327 7,471 Total 217,351 22,180 The movements of provision for losses on off-balance sheet commitments and contingent liabilities can be summarized as follows: Balance as at 1 January 22,180 19,727 Provision for the year 195,310 3,990 Change due to acquisition 1,756 Use of provision (1,031) (1,498) Foreign currency translation differences (864) (39) Closing balance 217,351 22,180 The negative fair value of derivative financial instruments designated as fair value hedge by type of contracts: CCIRS and mark-to-market CCIRS designated as fair value hedge 79,940 71,512 Interest rate swaps designated as fair value hedge 3,463 2,639 Foreign exchange swaps designated as fair value hedge 2, Forward security agreements designated as fair value hedge 45 Total 85,679 74,695 NOTE 18: SUBORDINATED BONDS AND LOANS (in HUF mn) Within one year: In HUF In foreign currency 16, , Over one year: In HUF In foreign currency 264, , , ,884 Accrued interest 1,171 3,206 Total 281, ,162 Interest rates on subordinated bonds and loans are as follows: Denominated in foreign currency 0.6% 8.25% 0.8% 8.25% Average interest rates on subordinated bonds and loans 5.10% 4.13% * See details in Note IFRS consolidated financial statements 111
43 Subordinated bonds and loans can be detailed as follows: Type Nominal value Date of issuance Date of maturity Issue price Subordinated bond EUR million 04/03/ /03/ % Subordinated bond EUR million 07/11/2006 Subordinated bond (under EMTN* program) Subordinated bond (under EMTN* program) Perpetual, but callable after 10 years % Interest conditions Three-month EURIBOR % quarterly Fixed 5.875% annual in the first 10 years (payable annually), three-month EURIBOR + 3%, variable after year 10 (payable quarterly) Interest rate as at 31 December 2014 EUR 300 million 19/09/ /09/ % Fixed 5.27% annual 5.27% EUR 200 million 26/02/ /09/ % Fixed 5.27% annual 5.27% Subordinated loan USD 65 million 21/04/ /10/ % Subordinated bond RUB 4.2 million 30/04/ /06/ % Variable, six-month LIBOR + 1.4% Variable monthly, based on the Russian National Bank s interest rate 1.72% 8.25% NOTE 19: SHARE CAPITAL (in HUF mn) Authorized, issued and fully paid: Ordinary shares 28,000 28,000 NOTE 20: RETAINED EARNINGS AND RESERVES (in HUF mn) The reserves of the Bank under Hungarian Accounting Standards ( HAS ) are as follows (the reserves under IFRS are detailed in consolidated statement of changes in equity): Capital reserve General reserve 153, ,935 Retained earnings 814, ,357 Tied-up reserve 8,558 8,287 Total 976,944 1,032,631 The legal reserves (general reserve and tied-up reserve) are not available for distribution. The dividend has been determined on the basis of the net profit for the year determined in the separate financial statements in accordance with the HAS. These Financial Statements subject to approval by the Board of Directors in the Annual General Meeting in March In 2014 the Bank paid dividend of HUF 40,600 million from the profit of the year 2013, which meant 145 HUF payable dividend by share to the shareholders. In 2015 dividend of HUF 40,600 million are expected to be proposed by the Management from the profit of the year 2014, which means 145 HUF payable dividends by share to the shareholders. The retained earnings and reserves according to IFRS contains the retained earnings (HUF 686,000 million and HUF 664,856 million) and reserves (HUF 602,757 million and HUF 867,308 million) as at 31 December 2014 and 2013 * European Medium Term Note Program. 112 OTP Bank Annual Report 2014
44 respectively. The reserves include mainly net profit for the year attributable to the owners of the company, the fair value adjustment of securities available-for-sale, additional reserves of Income Certificates Exchangeable for Shares ( ICES ), changes in equity accumulated in the previous year at the subsidiaries, changes due to consolidation and exchange differences. In the Consolidated Financial Statement the Group recognizes the non-monetary items on historical cost. The difference between the historical cost of the non-monetary items in forint amount and the translated foreign currencies into the presentation currency using the exchange rate at the balance sheet date, is presented among the shareholders equity as difference of translation. The accumulated amounts of exchange differences were HUF 121,306 million and HUF 14,381 million as at 31 December 2014 and 2013 respectively. On 19 October 2006, the Bank sold 14.5 million Treasury shares owned by the Group through an issue of ICES. Within the transaction 10 million shares owned by OTP, and further 4.5 million shares owned by OTP Group were sold during the underwriting period of ICES on the weighted average market price (HUF 7,080) of the Budapest Stock Exchange. The shares have been purchased by Opus Securities S.A. ( OPUS ), which issued an exchangeable bond with a total face value of EUR 514,274,000 backed by those shares. The exchangeable bonds have been sold at a 32% premium over the selling price of the shares. The EUR denominated exchangeable bonds are perpetual and the investors can exercise the conversion right between year 6 and 10. The bonds carry a fixed coupon of 3.95% during the first 10 years, thereafter the Issuer has the right to redeem the bonds at face value. Following the year 10, the bonds carry a coupon of 3 month EURIBOR +3%. OTP has discretional right to cancel the interest payments. The interest payable is noncumulative. Due to the conditions described above, ICES was accounted as an equity instrument and therefore any payment was accounted as equity distribution paid to ICES holders. NOTE 21: TREASURY SHARES ((in HUF mn) Nominal value (Ordinary shares) 1,818 1,797 Carrying value at acquisition cost 55,940 55,599 The changes in the carrying value of treasury shares are due to repurchase and sale transactions on market authorised by the General Assembly. Change in number of shares: Number of shares as at 1 January 17,972,405 18,755,373 Additions 6,474,942 4,247,043 Disposals (6,272,000) (5,030,011) Closing number of shares 18,175,347 17,972,405 Change in carrying value: Balance as at 1 January 55,599 53,802 Additions 27,522 19,740 Disposals (27,181) (17,943) Closing balance 55,940 55,599 IFRS consolidated financial statements 113
45 NOTE 22: NON-CONTROLLING INTEREST (in HUF mn) Balance as at 1 January 4,767 5,783 Changes due to ownership structure (177) (423) Non-controlling interest included in net profit for the year (273) (91) Foreign currency translation difference (968) (502) Closing balance 3,349 4,767 NOTE 23: PROVISION FOR IMPAIRMENT ON LOAN AND PLACEMENT LOSSES (in HUF mn) Provision for impairment on loan losses Provision for the year 708, ,614 Release of provision (319,393) (328,859) Provision for impairment on loan losses 57,470 77, , ,943 Provision for impairment/(release of provision) on placement losses Provision for the year Release of provision (854) (367) Release of provision for impairment on placement losses (10) (35) 10 (374) Provision for impairment on loan and placement losses 446, ,569 NOTE 24: NET PROFIT FROM FEES AND COMMISSIONS (in HUF mn) Income from fees and commissions: Deposit and account maintenance fees and commissions 109,765 98,726 Fees and commissions related to the issued bank cards 45,997 50,757 Fees related to cash withdrawal 29,477 32,757 Fees and commissions related to lending 21,495 21,336 Fees and commissions related to fund management 20,215 15,168 Fees and commissions related to security trading 12,643 10,961 Other 25,800 27,430 Total 265, ,135 Expense from fees and commissions: Fees and commissions paid on loans 12,489 14,023 Fees and commissions related to issued bank cards 11,907 8,780 Interchange fees 7,351 10,356 Fees and commissions related to collection of loans 2,856 5,601 Fees and commissions related to deposits 2,579 2,428 Cash withdrawal transaction fees 2,158 2,970 Fees and commissions related to security trading 1,610 1,152 Postal fees Money market transaction fees and commissions 794 1,074 Insurance fees 532 1,860 Other 6,624 6,298 Total 49,736 55,378 Net profit from fees and commissions 215, , OTP Bank Annual Report 2014
46 NOTE 25: OTHER OPERATING INCOME AND EXPENSES AND OTHER ADMINISTRATIVE EXPENSES (in HUF mn) Other operating income Gains on real estate transactions 734 1,552 Other income from non-financial activities 13,645 24,840 Total 14,379 26,392 Other operating expenses Provision on contingent liabilities due to regulations related to customer loans* 194,798 Provision for impairment on other assets 5,066 4,313 Provision for assets subject to operating lease** 1,048 Provision for investment properties** 3,612 Provision for impairment on investments*** 1,244 1,370 Provision for off-balance sheet commitments and contingent liabilities 512 3,990 Other expense from non-financial activities 19,975 19,366 Other operating costs 6,354 10,756 Total 232,609 39,795 Other administrative expenses Personnel expenses Wages 151, ,462 Taxes related to personnel expenses 41,319 40,677 Other personnel expenses 13,549 13,138 Subtotal 206, ,277 Depreciation and amortization**** 65,947 78,017 Other administrative expenses Taxes, other than income tax***** 116, ,002 Administration expenses, including rental fees 51,119 50,775 Services 40,515 44,831 Professional fees 16,892 14,490 Advertising 11,736 13,379 Subtotal 236, ,477 Total 508, ,771 NOTE 26: INCOME TAX (in HUF mn) The Group is presently liable for income tax at rates between 9% and 35% of taxable income. Deferred tax is calculated at the income tax rate of 9% in Montenegro, 10% in Bulgaria, 12,5% in Cyprus, 15% in Serbia, 16% in Romania, 18% in Ukraine, 19% in Hungary, 20% in Croatia, Russia and the United Kingdom, 22% in Slovakia and 25% in the Netherlands. The breakdown of the income tax expense is: Current tax expense 16,520 24,542 Deferred tax benefit (67,905) (3,598) Total (51,385) 20,944 * See details in Note ** Provisions on assets subject to operating lease and investment properties which were transferred from tangible and intangible assets to the other assets (see more details in Note 12.). *** See details in Note 9. **** See details in Note 11. ***** Special tax of financial institutions was paid by the Group in the amount of HUF 37 billion and HUF 36.9 billion for the year 2014 and 2013 respectively, recognized as an expense thus decreased the corporate tax base. In the year period ended 31 December 2014 financial transaction duty was paid by the Bank in the amount of HUF 44 billion. IFRS consolidated financial statements 115
47 A reconciliation of the net deferred tax asset/liability is as follows: Balance as at 1 January (12,273) (17,295) Deferred tax benefit 67,905 3,598 Deferred tax related to items recognized directly in equity and in Other Comprehensive Income (1,418) 1,173 Foreign currency translation difference (3,060) 251 Closing balance 51,154 (12,273) A breakdown of the deferred tax assets and liabilities are as follows: Refundable tax in accordance with Acts on Customer Loans* 33,226 Tax loss carry forward 15,207 3,114 Provision for impairment on investments (Goodwill) 10,705 Fair value adjustment of securities held for trading and securities available-for-sale 8,704 6,626 Repurchase agreement and security lending 4,176 4,458 Provision for off-balance sheet commitments and contingent liabilities, derivative financial instruments Premium and discount amortization on bonds 177 Difference in accounting for leases Difference in depreciation and amortization 73 Fair value adjustment of derivative financial instruments 8 8 Adjustment from effective interest rate method 5,572 Other 23,167 6,176 Deferred tax asset 96,213 26,573 Fair value adjustment of securities held for trading and securities available-for-sale (16,193) (10,255) Difference in depreciation and amortization (5,051) (8,835) Fair value adjustment of derivative financial instruments (5,031) (1,987) Difference in accounting for leases (3,992) (66) Net effect of treasury share transactions (2,681) (2,934) Adjustment from effective interest rate method (2,380) (2,063) Temporary differences arising on consolidation (1,817) (1,741) Accounting of equity instrument (ICES) (1,333) (1,912) Provision for off-balance sheet commitments and contingent liabilities, derivative financial instruments (110) Premium and discount amortization on bonds (23) (215) Other (6,448) (8,838) Deferred tax liabilities (45,059) (38,846) Net deferred tax asset/(liability) 51,154 (12,273) A reconciliation of the income tax income/expense is as follows: (Loss)/Profit before income tax (153,643) 85,052 Income tax (income)/expense at statutory tax rates (26,793) 22,603 * See details in Note OTP Bank Annual Report 2014
48 Income tax adjustments due to permanent differences are as follows: Differences in carrying value of subsidiaries 14,982 3,267 Share-based payment 835 1,084 Reversal of statutory general provision 1,198 Amount removed from statutory general provision to retained earnings 5,533 OTP MOL share swap transaction (80) (186) Revaluation of investments denominated in foreign currency to historical cost (185) 3,243 Difference of accounting of equity instrument (ICES) (211) 49 Treasury share transactions (917) 113 Use of tax allowance in the current year (2,479) (9,523) Deferred use of tax allowance* (6,335) (459) Tax refund in accordance with Acts on Customer Loans (28,306) Other (1,896) (5,978) Income tax (income)/expense (51,385) 20,944 Effective tax rate** 33.44% 24.62% NOTE 27: FINANCIAL RISK MANAGEMENT (in HUF mn) A financial instrument is any contract that gives rise to a financial asset of one entity and a financial liability or equity instrument of another entity. Financial instruments may result in certain risks to the Group. The most significant risks the Group faces include: Exposure to credit risk is managed through regular analysis of the ability of borrowers and potential borrowers to meet interest and principal repayment obligations and by changing these lending limits when appropriate. Exposure to credit risk is managed by obtaining collateral, corporate and personal guarantees Credit risk The Group takes on exposure to credit risk which is the risk that a counter-party will be unable to pay amounts in full when due. The Group structures the levels of credit risk it undertakes by placing limits on the amount of risk accepted in relation to one borrower, or banks of borrowers, and to geographical and loan types. Such risks are monitored on a periodical basis and subject to an annual or more frequent review. The exposure to any borrower including banks and brokers is further restricted by sub-limits covering on and off-balance sheet exposures and daily delivery risk limits in relation to trading items such as forward foreign exchange contracts. Actual exposures against limits are monitored daily Analysis by loan types and by DPD categories Classification into DPD categories The Group presents the performing loan portfolio according delay of payment above 90 days past due. When determining the impairment beside the delay of payment other information available for the Group is also taking into consideration. The foreseeable risks and expected losses are considered, when the Group during determining the result of the current year, calculates and accounts impairment and credits provisions. The impairments and provisions are accounted notwithstanding whether the result recognized in the current year is gain or loss. The Group * From year 2011 legal regulation has allowed to recognize the financial support provided to sight-team sport as extraordinary expense and corporate tax allowance in the financial statements prepared on the base of HAS. The Bank couldn t apply this tax allowance in the financial statements prepared according to the HAS in 2012, since the tax base for year 2012 was negative. In IFRS financial statements this amount was settled as deferred tax. ** Effective tax rate has changed due to deferred tax receivable recognized in relation with the expecting tax receivable based on Act on Settlement and considering the contribution provided to the subsidiaries. IFRS consolidated financial statements 117
49 when calculates the impairment of the loans applies the requirement of IFRS and the principles defined in the impairment policy of the Group. Exposures with small amounts are subject to collective valuation method, which is a simplified assessment. The exposures subject to collective valuation method are classified into five valuation groups which have been formed based on past due days from which there classes were presented (A: 0 90 days past due DPD, B: DPD, C: over 360 days past due). The three new groups do not match one by one to the earlier used risk classes, the composition of the classes has changed due to the different criteria. The Group intends where enough large number of items and enough long experiences are available applying models on statistical bases. The impairment is calculated according to the possibility of listing the loan into default categories examined on the base of objective valuation criteria (delay of payment, change of exchange) and the expected recovery from the collecting. If the loss of the exposure can t be modelled reliably, the impairment is determined by expert keys. Impairment on claims above the limit are under individual assessment method. Depending on the incurred loss of each item is determined based on the consideration of all of the following criteria: the credit rating of the customer or the partner: the financial position, stability and income-generating capacity affected by the financial or investment service and issuer of the security, and any changes thereto; compliance with the rules of repayment (delay): delays in the repayment of the loan principal and its interests, regularity of the fulfillment of payment obligations; the status of the restructuring (renegotiating) of risk taking contracts; the country risk relating to the customer (both political and transfer risks) and any changes thereto; the value of collaterals, their liquidity and accessibility, and any changes therein; the transferability and liquidity of the exposures (the market conditions of supply and demand, the available market prices and participation in the shareholders equity of the issuer in proportion to the investment); the future payment obligation recognized as a loss arising from the exposure. The expected future losses of the individually assessed item are determined by taking into considerations the above listed objective valuation aspects. The expected loss, the volume of the necessary reserve is defined by taking into account the value of the collaterals, comparing with the value of the collaterals relating to the exposure. The expected recovery is calculated by applying the effective interest rate method and the discounted cash-flow method. The impairment accounted for the item before should be completed to this level by increasing the amount of the impairment or by releasing the provision accounted before. 118 OTP Bank Annual Report 2014
50 An analysis of the gross loan portfolio by loan types and DPD categories is as follows: As at 31 December 2014: Loan type Up to 90 days days Above 360 days Total carrying amount/allowance Mortgage loans 2,014,737 95, ,123 2,590,332 Corporate loans 1,565,654 49, ,997 1,857,937 Consumer loans 1,389, , ,581 1,660,514 SME loans 329,030 15, , ,476 Car-finance loans 175,980 17,755 36, ,319 Municipal loans 117, ,313 Gross portfolio 5,592, ,350 1,044,863 6,931,891 Placement with other banks 280, ,938 Bill of exchange 4,193 4,193 Total gross portfolio 5,877, ,362 1,044,872 7,217,022 Allowance for loans (169,562) (180,880) (778,643) (1,129,085) Allowance for placements (26) (12) (9) (47) Total allowance (169,588) (180,892) (778,652) (1,129,132) Total net portfolio 5,708, , ,220 6,087,890 Accrued interest for loans 57,242 for placements 115 Total accrued interest 57,357 Total net loans 5,864,242 Total net placements 281,006 Total net exposures 6,145,248 As at 31 December 2013: Loan type Up to 90 days days Above 360 days Total carrying amount/allowance Mortgage loans 2,061,992 97, ,222 2,623,097 Corporate loans 1,566,018 49, ,784 1,904,699 Consumer loans 1,550, , ,894 1,916,282 SME loans 306,767 11, , ,231 Car-finance loans 188,221 13,286 38, ,101 Municipal loans 271, ,450 Gross portfolio 5,945, ,689 1,181,956 7,408,860 Placement with other banks 273, ,233 Bill of exchange 3,940 3,940 Total gross portfolio 6,222, ,689 1,181,965 7,686,033 Allowance for loans (198,928) (156,362) (880,344) (1,235,634) Allowance for placements (23) (8) (31) Total allowance (198,951) (156,362) (880,352) (1,235,665) Total net portfolio 6,023, , ,613 6,450,368 Accrued interest for loans 68,044 for placements 277 Total accrued interest 68,321 Total net loans 6,245,210 Total net placements 273,479 Total net exposures 6,518,689 The Group s loan portfolio decreased by 6.1% in year Analysing the contribution of loan types to the loan portfolio, the share of the mortgage loan types slightly increased, the consumer and municipal loan type slightly decreased, while the other types of loans remained almost the same as at 31 December 2014 comparing with the previous year. As a consequence of the economic situation, the qualification of the loan portfolio deteriorated in the previous year, but for the end of 2014 the ratio of the more than 90 days past due to the above 360 days past due loans IFRS consolidated financial statements 119
51 compared to the gross loan portfolio decreased from 19% to 18.6%. Among the qualified loan portfolio, the loans classified to the risk class of more than 90 until 360 days past due expanded at the fastest level. The Group has a prudent provisioning policy, the indicator which describes the coverage of loans by provision for impairment on loans classified as Above 360 days, was the same 74.5% as at 31 December 2014 and 31 December 2013 respectively. Not impaired loan portfolio The loan portfolio analysis of the gross values of the loans that are not impaired, not past due and past due is as follows: As at 31 December 2014: Loan type Not past due Up to 90 days days Above 360 days Mortgage loans 1,254, ,032 6,170 7,526 1,418,186 Corporate loans 839,949 13, , ,742 Consumer loans 374,485 57, ,380 Placement with other banks 280, ,891 SME loans 182,352 8,557 1,305 1, ,617 Municipal loans 97, ,182 Car-finance loans 52,772 20, ,820 Total 3,082, ,632 8,715 10,698 3,352,818 Total As at 31 December 2013: Loan type Not past due Up to 90 days days Above 360 days Mortgage loans 1,227, ,115 6,044 6,134 1,414,193 Corporate loans 822,027 18, , ,430 Consumer loans 402,625 62, ,009 Placement with other banks 246, ,764 SME loans 191,023 10,848 1,328 2, ,329 Municipal loans 210, ,052 Car-finance loans 34,343 25, ,759 Total 3,134, ,643 8,522 9,704 3,444,536 Total Loans not past due or past due, but not impaired cover only balance sheet items. The ratio of the gross value of the loans neither past due nor impaired compared to the whole portfolio slightly increased from 40.85% to 42.72% as at 31 December 2014 comparing to the end of the previous year. The ratio of the mortgage loans and placements with other banks compared to the portfolio of loans neither past due nor impaired increased slightly during year 2014, while the ratio of the municipal loans decreased mostly. The loans that are past due but not impaired are concentrated mainly in the mortgage loan type. In the other loan types the low level of loans past due but not impaired is a consequence of the prudent provisioning policy of the Group. Loans individually assessed for provision The individually rated exposures contain both the loans and the off-balance sheet commitments. The rating has been performed based on the factors used at determining the provision for impairment for them. 120 OTP Bank Annual Report 2014
52 An analysis of financial assets that are individually determined to be impaired, the factors taken into consideration at the assessment, the provision for impairment for them and the collaterals considered as at 31 December 2014 and 31 December 2013 is as follows: As at 31 December 2014: Considered factors Carrying value Allowance for impairment Collateral value Off-balance sheet commitments Provision for off-balance sheet commitments Delay of payment 300, , , Decrease of client classification 182,472 49, ,716 11,041 3,835 Legal proceedings 78,037 54,745 48, Regularity of payment 48,373 37,290 12,790 Loan characteristics 39,370 1,975 27,341 Country risk 33,145 7,935 13,752 Cross default 28,229 4,498 12, Business lines risks 16,125 3,670 8,454 12, Restructuring 1,954 1,014 1,054 Other 10,061 2,030 10,402 4, Corporate total 738, , ,686 29,925 4,605 Delay of payment 8, ,927 Legal proceedings ,267 Decrease of client classification Other Municipal total 9, , Placements with other banks Total 748, , ,880 30,309 4,609 As at 31 December 2013: Considered factors Carrying value Allowance for impairment Collateral value Off-balance sheet commitments Provision for off-balance sheet commitments Delay of payment 246, , , Decrease of client classification 158,892 39, ,532 7,510 4,369 Legal proceedings 179, ,950 67, Regularity of payment Loan characteristics 54,200 7,448 19,775 Country risk 3,425 1,224 2,687 Cross default 12,906 5,695 4,592 1, Business lines risks 12,062 3,130 4,645 5, Restructuring 1, Other 22,159 7,399 16,714 6, Corporate total 692, , ,597 20,549 5,205 Delay of payment 1, ,053 Legal proceedings Decrease of client classification 3, Restructuring 4, ,667 Regularity of payment 1, Cross default Other 14, , Municipal total 27,153 1,780 8,716 1, Placements with other banks Total 719, , ,313 21,692 5,216 By 31 December 2014 the volume of the individually rated portfolio increased by 6.7% in the corporate loan type. Among the rating factors of the corporate loan type, the decrease is mostly based on the legal proceedings and loan characteristics, while increase is based on the regularity of payment and country risk. The decrease is more significant in the municipal loan portfolio, where the decrease is mostly based on the improving regularity of payment, restructuring, and on the improving client classification. The increase is based only on the delay of payment. IFRS consolidated financial statements 121
53 Transactions with high level of risk Loans to customers are classified by using this category name if the clients are performing according to the contracts but the risks of the transactions are higher than usual (balloon payment, using loan to finance the monetary expenditures in the phase of investment). Business lines risks Transactions are classified by using this category name, if the client works in a business line which was most exposed to the financial crisis (vehicle industry, building industry, real estate services, metal processing, financial services). Loan portfolio by countries An analysis of the non-qualified and qualified gross loan portfolio in a country breakdown is as follows: Country Carrying amount of gross Allowance Carrying amount of gross Allowance loan and placement with other banks portfolio loan and placement with other banks portfolio Hungary 2,888, ,121 3,216, ,238 Bulgaria 1,220, ,427 1,183, ,410 Russia 588, , , ,704 Ukraine 578, , , ,574 Croatia 510,344 39, ,850 30,892 Romania 484,602 69, ,080 63,308 Slovakia 370,649 22, ,866 22,824 Montenegro 186,890 71, ,175 80,312 United Kingdom 123,716 2,075 54,179 1,867 Serbia 112,822 33, ,274 36,998 Cyprus 47,333 10,476 50,082 10,412 Germany 22, , United States of America 24, , Austria 9, ,655 4 Switzerland 8, ,480 2 Czech Republic 6, ,299 France 5, ,772 Seychelles 4,877 4,855 4,624 2,317 Norway 4, ,404 2 Italy 4, Turkey 1, ,228 Denmark 1,660 1,062 Poland 1,454 3,417 The Netherlands 1, ,828 4 Sweden ,759 8 Ireland Kazakhstan Japan Belgium ,506 1 Latvia Spain Australia Island Canada Egypt Luxembourg 3 2 Other* 1, Total** 7,212,829 1,129,132 7,682,093 1,235,665 ** Other category in the year of 2014 includes e.g.: Bosnia and Herzegovina, Greece, Hong Kong, Vietnam, Moldova, Macedonia, United Arab Emirates, Brazil, Israel, Slovenia, India, South Korea, Finland, Morocco, Armenia and Kyrgyzstan. ** Without the amount of bill of exchange. 122 OTP Bank Annual Report 2014
54 The loan portfolio decreased mostly in Russia, Ukraine and Hungary, and increased in the Croatia and Slovakia but there were no significant changes in the other countries of Group members. Their stock of provision increased mostly in Ukraine, Croatia and Romania, decreased in Russia, Bulgaria and Hungary due to the slightly decreased loan portfolio but there were no significant movements in none of the other countries. In some countries the stock of provision increased due to local regulations on the base of which it is compulsory to account fix rate of provision on the non-qualified portfolio Collaterals The values of collaterals held by the Group by types are as follows (total collaterals). The collaterals cover loans as well as off-balance sheet exposures. Types of collaterals Mortgages 5,323,528 5,899,371 Assignments (revenue or other receivables) 407, ,540 Guarantees of state or organizations owned by state 277, ,258 Guarantees and warranties 114, ,589 Cash deposits 74,435 83,890 Securities 34,508 56,813 Other 793, ,311 Total 7,023,953 7,645,772 The values of collaterals held by the Group by types are as follows (to the extent of the exposures). The collaterals cover loans as well as off-balance sheet exposures. Types of collaterals Mortgages 2,737,324 3,064,157 Assignments (revenue or other receivables) 330, ,435 Guarantees of state or organizations owned by state 207, ,281 Guarantees and warranties 86,475 91,271 Cash deposits 42,956 50,080 Securities 16,723 12,054 Other 455, ,689 Total 3,877,134 4,282,967 The coverage level of the loan portfolio (total collaterals) decreased by 0.7%, as well as the coverage level to the extent of the exposures decreased by 1.05% as at 31 December IFRS consolidated financial statements 123
55 The fair value of collaterals related to past due, but not impaired loans An analysis of the fair value of collaterals related to past due, but not impaired loans, total collaterals and to the extent of the exposures as at 31 December 2014 and 31 December 2013 is as follows: Fair value of the collaterals (total collaterals) Mortgage loans 268, ,271 Corporate loans 47,563 53,944 SME loans 46,095 51,357 Car-finance loans 17,640 20,507 Consumer loans 4,020 3,367 Municipal loans Placements with other banks Total 383, ,510 Fair value of the collaterals (to the extent of the exposures) Mortgage loans 151, ,702 Corporate loans 14,788 18,728 SME loans 10,822 13,747 Car-finance loans 13,012 16,115 Consumer loans 1, Municipal loans Placements with other banks Total 191, ,084 The collaterals above are related to only on-balance sheet exposures Restructured loans Gross portfolio Allowance Gross Allowance portfolio Corporate loans 197,382 43, ,418 80,658 Retail loans 76,124 6,636 95,370 9,094 SME loans 14,046 2,018 16,381 1,954 Municipal loans , Total 287,623 52, ,555 91,734 Restructured portfolio definition: Restructured portfolio for retail business line contains every loan which is relevant restructured and less than 91 days delinquent. Loan is considered as relevant restructured if: it was restructured in the last 12 months, or it was restructured more than 12 months ago, but the connected preferential period is not expired or expired in the last 12 months. Hungarian FX mortgage loans in the fixed exchange rate scheme are not included. In case of loans that have been restructured more than once the last restructuring is considered. Restructured portfolio for corporate/sme/ municipal business line contains every loan which is relevant restructured and less than 91 days delinquent. Loan is considered as relevant restructured if: independently from the date of the restructuring the following restructuring tool was applied: cancellation of principal outstanding (cancelled or partially cancelled principal receivables); it was restructured in the last 12 months or the loan was restructured more than 12 months ago, but the connected preferential period is not expired or expired in the last 12 months, 124 OTP Bank Annual Report 2014
56 and any of the following restructuring tools were applied: cancellation of interest rate (final or temporary reduction of the interest margin, cancellation of due interest), or restructuring of interest payments (postponement of the interest payment, capitalization of the interest), or restructuring of principal repayment (partial or full postponement of repayment of a given instalment, rescheduling one or more instalments within the original term or with extension of the term simultaneously). Other modifications of contract not mentioned above are not considered as restructuring (i.e. modifying the collateral structure, modification of the credit purpose). In case of loans that have been restructured more than once the last restructuring is considered Financial instruments by rating categories* Securities held for trading as at 31 December 2014: Aaa Aa3 A1 A2 A3 Baa1 Baa2 Baa3 Ba1 Ba3 Not Total rated Shares ,309 ** 59,231 Government bonds 1,044 4,072 5,093 12,733 22,942 Discounted Treasury bills 3, ,414 Other securities - 4, ,439 Other non-interest bearing securities 1, ,299 3,989 Total 1, ,266 6,765 17, ,872 94,015 Accrued interest 625 Total 94,640 Securities available-for-sale as at 31 December 2014: Aaa A1 Baa2 Baa3 Ba1 Ba3 B1 Caa1 Caa3 C Not rated Total Government bonds 40, , ,796 1, , ,323 Discounted Treasury bills 9,873 32,295 42,168 Corporate bonds ,542 2, ,566 37,457 Other securities 20, ,138 Other non-interest bearing securities ,093 43,646 Total , , ,459 2, , , ,732 Accrued interest 15,694 Total 840,426 Securities held-to-maturity as at 31 December 2014: Aaa A1 A2 Baa2 Baa3 Ba1 Caa3 Not Total rated Government bonds 4,497 22,681 1,184 11, ,644 10, ,410 Mortgage bonds Discounted Treasury bills Corporate bonds 7 7 Total 4, ,681 1,184 11, ,990 10, ,458 Accrued interest 16,725 Total 710,183 ** Moody s ratings. ** These contain mostly corporate shares listed on Budapest Stock Exchange. IFRS consolidated financial statements 125
57 27.2 Market risk The Group takes on exposure to market risks. Market risks arise from open positions in interest rate, currency and equity products, all of which are exposed to general and specific market movements. The Group applies a Value-at-Risk methodology to estimate the market risk of positions held and the maximum losses expected, based upon a number of assumptions for various changes in market conditions. The Management Board sets limits on the value of risk that may be accepted, which is monitored on a daily basis. (Analysis of liquidity risk is detailed in Note 35.) Market Risk sensitivity analysis The VaR risk measure estimates the potential loss in pre-tax profit over a given holding period for a specified confidence level. The VaR methodology is a statistically defined, probability-based approach that takes into account market volatilities as well as risk diversification by recognizing offsetting positions and correlations between products and markets. Risks can be measured consistently across all markets and products, and risk measures can be aggregated to arrive at a single risk number. The one-day 99% VaR number used by the Group reflects the 99% probability that the daily loss will not exceed the reported VaR. VaR methodologies are employed to calculate daily risk numbers include the historical and variance-covariance approach. In addition to these two methodologies, Monte Carlo simulations are applied to the various portfolios on a monthly basis to determine potential future exposure. The FX Var rose due to significant increase of USD/RUB volatility. The VaR of the trading portfolio can be summarized as follows: Historical VaR (99%, one-day) by risk type Average in HUF million Foreign exchange 1, Interest rate Equity instruments Diversification (278) (181) Total VaR exposure 1, While VaR captures the Group s daily exposure to currency and interest rate risk, sensitivity analysis evaluates the impact of a reasonably possible change in interest or foreign currency rates over a year. The longer time frame of sensitivity analysis complements VaR and helps the Group to assess its market risk exposures. Details of sensitivity analysis for foreign currency risk are set out in Note , for interest rate risk in Note , and for equity price sensitivity analysis in Note below Foreign currency sensitivity analysis The following table details the Group s sensitivity to an increase and decrease in the HUF exchange rate against the EUR, over a 3 months period. Monte Carlo simulation is used when reporting foreign currency risk internally to key management personnel and represents Management s assessment of the reasonably possible change in foreign exchange rates. The sensitivity analysis includes only outstanding 126 OTP Bank Annual Report 2014
58 foreign currency denominated monetary items as strategic open positions related to foreign activities. The strategic open position related to the foreign operations was short, amounted to EUR 310 million and was long amounted to1.9 million CHF as at 31 December High portion of strategic positions is considered as effective hedge of future profit inflows of investment of foreign subsidiaries, and so FX risk affects the Group s other comprehensive income and not its earnings. A positive number below indicates an increase in profit where the HUF strengthens against the EUR. For a weakening of the HUF against the EUR, there would be an equal and opposite impact on the profit, and the balances below would be negative. Probability Effects to the Consolidated Statement of Recognized Income in 3 months period 2014 (in HUF billion) 2013 (in HUF billion) 1% (15.2) (12.7) 5% (10.6) (8.7) 25% (4.6) (3.6) 50% (0.8) (0.3) 25% % % Notes: (1) The short-term loss on the strategic open position is compensated by the long-term exchange rate gain on the foreign operations. (2) The HUF/EUR volatility remained at its long-term average, so the probability of losses or gains has not changed significantly. (3) Monte Carlo simulation is based on the empirical distribution of the historical exchange rate movements between 2002 and Interest rate sensitivity analysis The sensitivity analyses below have been determined based on the exposure to interest rates for both derivatives and non-derivative instruments at the balance sheet date. The analysis is prepared assuming the amount of assets and liabilities outstanding at the balance sheet date were outstanding for the whole year. The analysis was prepared by assuming only adverse interest rate changes. The main assumptions were as follows: Floating rate assets and liabilities were repriced to the modelled benchmark yields at the repricing dates assuming the unchanged margin compared to the last repricing. Fixed rate assets and liabilities were repriced at the contractual maturity date. As for liabilities with discretionary repricing feature by the Bank were assumed to be repriced with two-weeks delay, assuming no change in the margin compared to the last repricing date. Assets and liabilities with an interest rate lower than 0.3% were assumed to be unchanged for the whole period. The sensitivity of interest income to changes in BUBOR is analyzed. The simulations were prepared by assuming two scenarios: (1) HUF base rate decreases gradually to 1.5% (probable scenario) (2) HUF base rate decreases gradually to 0.1% (alternative scenario) The net interest income in a one year period after 31 December 2014 would be decreased by HUF 1,030 million (probable scenario) and HUF 4,098 million (alternative scenario) as a result of these simulation. The same simulation indicated HUF 2,208 million (probable scenario) and HUF 3,432 million (alternative scenario) decrease in the Net interest income in a one year period after 31 December This effect is counterbalanced by capital gains (HUF 899 million for probable scenario, HUF 3,689 million for alternative scenario) as at 31 December 2014 and (HUF 1,344 million for probable scenario, HUF 1,978 million for alternative scenario) as at 31 December 2013 on the government bond portfolio held for hedging (economic). IFRS consolidated financial statements 127
59 The effects of the parallel shifts of the yield-curves to the net interest income on a one-year period and to the market value of the hedge government bond portfolio booked against capital can be summarized as follows: Description Effects to the net Effects to capital Effects to the net interest income (Price change of AFS interest income (one-year period) government bonds) (one-year period) Effects to capital (Price change of AFS government bonds) HUF (0.1%) parallel shift (361) 374 (410) 240 EUR (0.1%) parallel shift (503) (451) USD (0.1%) parallel shift (50) (3) Total (914) 374 (864) Equity price sensitivity analysis The following table shows the effect of the equity price sensitivity. The Group uses VaR calculation with 1 day holding period and a 99% confidence level. The VaR methodology is a statistically defined, probability-based approach that takes into account market volatilities as well as risk diversification by recognizing offsetting positions and correlations between products and markets. The daily loss will not exceed the reported VaR number with 99% of probability. The stress test assumes the largest price movement of the last year and calculates with it as the adverse direction. These scenarios show the loss of the portfolio when all prices change with the maximum amount of the last year. Description VaR (99%, one day, HUF million) Stress test (HUF million) (43) (60) Capital management Capital management The primary objective of the capital management of the Group is to ensure the prudent operation, the entire compliance with the prescriptions of the regulator for a persistent business operation and maximising the shareholder value, accompanied by an optimal financing structure. The capital management of the Group members includes the management and evaluation of the shareholders equity available for hedging risks, other types of funds to be recorded in the equity and all material risks to be covered by the capital. The basis of the capital management of the Group members in the short run is the continuous monitoring of their capital position, in the long run the strategic and the business planning, which includes the monitoring and forecast of the capital position. The Group members maintain the capital adequacy required by the regulatory bodies and the planned risk taking mainly by means of ensuring and developing their profitability. In case the planned risk level of a Group member exceeded its Core and the previously raised Supplementary capital, it ensures the prudent operation by occasional measures. A further tool in the capital management of the Bank is the dividend policy, and the transactions performed with the treasury shares. Capital adequacy The Capital Requirements Directive package (CRDIV/CRR) transposes the new global standards on banking regulation (known as the Basel III agreement) into the EU legal framework. The new rules are applied from 1 January They set stronger prudential requirements for institutions, requiring them to keep sufficient capital reserves and liquidity. This new framework makes institutions in the EU more solid and strengthens their capacity to adequately manage the risks linked to their activities, 128 OTP Bank Annual Report 2014
60 and absorb any losses they may incur in doing business. The capital adequacy of the Group is supervised based on the financial statements data prepared in accordance with IFRS applying the current directives, rulings and indicators from 1 January The Group has entirely complied with the regulatory capital requirements in 2014 as well as in The Group uses the standard method for determining the regulatory capital requirements of the credit risk and market risk, and parallel to that, the base indicator method and the advanced method (AMA) in case of the operational risk. For international comparison purposes, the Group calculated the Regulatory capital based on IFRS data, and the consolidated Capital adequacy ratio based on this. The capital adequacy calculations of the Group were prepared in accordance with Basel II at the end of 2013, while due to the modifications of the regulations it was calculated on the base of Basel III as at 31 December The Capital adequacy ratio of the Group (Basel III) was 17.5%, the Regulatory capital was HUF 1,201,874 million and the Total regulatory capital requirement was HUF 548,755 million as at 31 December The same ratios calculated as at 31 December 2013 according to Basel II were the following: 19.9%, HUF 1,440,962 million and HUF 579,408 million. Calculation on IFRS basis Basel III Basel II Core capital (Tier1) = Common Equity Tier1 (CET1) 969,935 Core capital (Tier1) 1,264,286 Positive components 1,513,448 Issued capital 28,000 Issued capital 28,000 Reserves 1,280,396 Reserves 1,385,423 Other capital components (113,047) Other issued capital components 100,025 Fair value corrections 25,389 Negative components (249,162) Non-controlling interests 736 Treasury shares (55,940) Treasury shares (55,599) Goodwill and other intangible assets (158,681) Goodwill and other intangible assets (193,563) Other adjustments (36,918) Additional Tier1 (AT1) Supplementary capital (Tier2) 231,939 Supplementary capital (Tier2) 177,043 Subordinated bonds and loans 133,217 Subordinated bonds and loans 164,393 Other issued capital components 96,019 Fair value corrections 12,650 Components recognized in T2 capital issued by subsidiaries 2,703 Deductions (367) Regulatory capital* 1,201,874 Regulatory capital 1,440,962 Credit risk capital requirement 450,073 Credit risk capital requirement 461,765 Market risk capital requirement 26,848 Market risk capital requirement 37,295 Operational risk capital requirement 71,834 Operational risk capital requirement 80,348 Total requirement regulatory capital 548,755 Total requirement regulatory capital 579,408 Surplus capital 653,119 Surplus capital 861,554 CET1 ratio 14.1% CET1 ratio Tier1 ratio 14.1% Tier1 ratio 17.5% Capital adequacy ratio 17.5% Capital adequacy ratio 19.9% * The regulatory capital doesn t contain the payable dividend from the result of 2014 in accordance with ITS 680/2014/EU. IFRS consolidated financial statements 129
61 Basel II Basel III The positive components of the Core capital are the following: Issued capital, Other reserve, Profit reserve, Changes in the equity of subsidiaries, Changes due to consolidation, Profit for the year, Other issued capital components. The negative components of the Core capital are the following: Treasury shares, Goodwill and other Intangible assets, Dividends. The components of the Supplementary capital are the following: Supplementary loan capital, Subordinated loan capital, Revaluation reserves, Fair value adjustments, Share based payments, Cash-flow hedges, Net investment hedge in foreign operations (in Supplementary Capital), Other issued capital. The components of the Deductions: deductions due to investments. The components of the Common Equity Tier1 capital (CET1) are the following: Issued capital, Reserves (Profit reserves, Other reserves, Changes in the equity of subsidiaries, Profit for the year, Changes due to consolidation) Fair value adjustments, Other capital components, (Revaluation reserves, Share based payments, Cash-flow hedges, Net investment hedge in foreign operations), Non-controlling interest, Treasury shares, Goodwill and other Intangible assets, other adjustments (due to prudential filters, due to deferred tax receivables, due to temporary regulations). Supplementary capital (Tier2): Subordinated loan capital, Supplementary loan capital, Other issued capital components, Components recognized in T2 capital issued by subsidiaries. The capital adequacy of the foreign subsidiary banks prescribed by the local regulator, and the compliance with these prescriptions is as follows: Subsidiary bank Country JSC OTP Bank (Russia) Russia 12.1% 14.0% OTP Bank JSC (Ukraine) Ukraine 10.4% 20.6% DSK Bank EAD Bulgaria 18.0% 16.4% OTP Bank Romania S.A. Romania 12.7% 12.7% OTP banka Srbija a.d. Serbia 31.5% 37.8% OTP banka Hrvatska d.d. Croatia 15.0% 16.7% OTP Banka Slovensko a. s. Slovakia 13.5% 10.6% Crnogorska komercijalna banka a.d. Montenegro 15.8% 14.4% The ratios of the foreign subsidiaries exceed the requirements of the local regulations in every cases. 130 OTP Bank Annual Report 2014
62 NOTE 28: OFF-BALANCE SHEET ITEMS AND DERIVATIVE FINANCIAL INSTRUMENTS (in HUF mn) In the normal course of business, the Group becomes a party to various financial transactions that are not reflected on the Consolidated Statement of Financial Position and are referred to as off-balance sheet financial instruments. The following represent notional amounts of these off-balance sheet financial instruments, unless stated otherwise. Contingent liabilities: Commitments to extend credit 999,732 1,266,185 Guarantees arising from banking activities 368, ,994 Contingent liabilities ordered by law related to customer loans* 157,693 from this: obligation related to application of the bid-ask exchange rate spread 31,297 from this: obligation related to unilateral amendment of contractual clauses 126,396 Legal disputes (disputed value) 71,808 66,988 Confirmed letters of credit 25,581 25,919 Other 208, ,422 Total 1,832,399 1,810,508 Legal disputes At the balance sheet date the Group was involved in various claims and legal proceedings of a nature considered normal to its business. The level of these claims and legal proceedings corresponds to the level of claims and legal proceedings in previous years. The Group believes that the various asserted claims and litigations in which it is involved will not materially affect its financial position, future operating results or cash-flows, although no assurance can be given with respect to the ultimate outcome of any such claim or litigation. Provisions due to legal disputes were HUF 7,454 million and HUF 3,267 million as at 31 December 2014 and 2013, respectively (see Note 17.). Complying with Act CXX of 2001 on the capital market, the Bank announces that action for damages initiated by DOO VEKTRA JAKIC in bankruptcy in the amount of EUR 80 million against OTP before the Commercial Court in Bijelo Polje (Montenegro) has been dismissed entirely and the court decided in favour of OTP. The decision of the court is subject to appeal. The Bank considers the claim is entirely unfounded as it is confirmed by the court of first instance. The Competition Council of the Hungarian Competition Authority with its resolution issued on 18 June 2014 established that OTP committed a violation of law, therefore the company was obliged to pay a fine in the amount of HUF 38 million. Commitments to extend credit, guarantees and letters of credit The primary purpose of these instruments is to ensure that funds are available to a customer as required. Guarantees and standby letters of credit, which represent irrevocable assurances that the Group will make payments in the event that a customer cannot meet its obligations to third parties, carry the same credit risk as loans. Documentary and commercial letters of credit, which are written undertakings by the Group on behalf of a customer authorising a third party to draw drafts on the Group up to a stipulated amount under specific terms and conditions, * See details in Note IFRS consolidated financial statements 131
63 are collateralised by the underlying shipments of goods to which they relate and therefore carry less risk than a direct borrowing. Commitments to extend credit represent unused portions of authorisations to extend credit in the form of loans, guarantees or letters of credit. With respect to credit risk on commitments to extend credit, the Group is potentially exposed to loss in an amount equal to the total unused commitments. However, the likely amount of loss is less than the total unused commitments since most commitments to extend credit are contingent upon customers maintaining specific credit standards. Guarantees, irrevocable letters of credit and undrawn loan commitments are subject to similar credit risk monitoring and credit policies as utilised in the extension of loans. The Management of the Group believes the market risk associated with guarantees, irrevocable letters of credit and undrawn loan commitments are minimal. Guarantees, payment undertakings arising from banking activities Payment undertaking is a promise by the Group to assume responsibility for the debt obligation of a borrower if that borrower defaults until a determined amount, until a determined date, in case of fulfilling conditions, without checking the undermined transactions. The guarantee s liability is joint and primary with the principal, in case of payment undertaking, while the Group assumes the obligation derived from guarantee independently by the conditions established by the Group. A guarantee is most typically required when the ability of the primary obligor or principal to perform its obligations under a contract is in question, or when there is some public or private interest which requires protection from the consequences of the principal s default or delinquency. A contract of guarantee is subject to the statute of frauds (or its equivalent local laws) and is only enforceable if recorded in writing and signed by the surety and the principal. If the surety is required to pay or perform due to the principal s failure to do so, the law will usually give the surety a right of subrogation, allowing the surety to use the surety s contractual rights to recover the cost of making payment or performing on the principal s behalf, even in the absence of an express agreement to that effect between the surety and the principal. Derivatives The Group maintains strict control limits on net open derivative positions, i.e. the difference between purchase and sale contracts, by both amount and term. At any one time the amount subject to credit risk is limited to the current fair value of instruments that are favourable to the Group (i.e. assets), which in relation to derivatives is only a small fraction of the contract or notional values used to express the volume of instruments outstanding. This credit risk exposure is managed as part of the overall lending limits with customers, together with potential exposures from market movements. Collateral or other security is not usually obtained for credit risk exposures on these instruments, except for trading with clients, where the Group in most of the cases requires margin deposits. Foreign currency contracts Foreign currency contracts are agreements to exchange specific amounts of currencies at a specified rate of exchange, at a spot date (settlement occurs two days after the trade date) or at a forward date (settlement occurs more than two days after the trade date). The notional amount of these spot contracts does not represent the actual market or credit risk associated with these contracts. Foreign currency contracts are used by the Group for risk management and trading purposes. The risk management foreign currency contracts of the Group were used to 132 OTP Bank Annual Report 2014
64 hedge the exchange rate fluctuations of loans and deposits to credit institutions denominated in foreign currency. Foreign exchange swaps and interest rate swaps The Group enters into foreign exchange swap and interest rate swap transactions. The swap transaction is a complex agreement concerning the swap of certain financial instruments, which usually consists of a prompt and one or more forward contracts. Interest rate swaps oblige two parties to exchange one or more payments calculated with reference to fixed or periodically reset rates of interest applied to a specific notional principal amount (the base of the interest calculation). Notional principal is the amount upon which interest rates are applied to determine the payment streams under interest rate swaps. Such notional principal amounts often are used to express the volume of these transactions but are not actually exchanged between the counterparties. The interest rate swaps are used by the Group for risk management and trading purposes. Cross-currency interest rate swaps The Bank enters into cross-currency interest rate swap (CCIRS) transactions which have special attributes, i.e. the parties exchange the notional amount at the beginning and also at the maturity of the transaction. A special type of these deals is the mark-to-market CCIRS agreements. At this kind of deals the parties in accordance with the foreign exchange prices revalue the notional amount during lifetime of the transaction. Equity and commodity swaps Equity swaps obligate two parties to exchange more payments calculated with reference periodically reset rates of interest and performance of indexes. A specific notional principal amount is the base of the interest calculation. The payment of index return is calculated on the basis of current market price compared to the previous market price. In case of commodity swaps payments are calculated on the basis of the strike price of a predefined commodity compared to its average market price in a period. Forward rate agreements (FRA) A forward rate agreement is an agreement to settle amounts at a specified future date based on the difference between an interest rate index and an agreed upon fixed rate. Market risk arises from changes in the market value of contractual positions caused by movements in interest rates. The Group limits its exposure to market risk by entering into generally matching or offsetting positions and by establishing and monitoring limits on unmatched positions. Credit risk is managed through approval procedures that establish specific limits for individual counterparties. The Group s forward rate agreements were transacted for management of interest rate exposures and have been accounted for at mark-to-market fair value. Foreign exchange options A foreign exchange option is a derivative financial instrument that gives the owner the right to exchange money denominated in one currency into another currency at a pre-agreed exchange rate at a specified future date. The transaction, for a fee, guarantees a worst-case exchange rate for the futures purchase of one currency for another. These options protect against unfavourable currency movements while preserving the ability to participate in favourable movements. IFRS consolidated financial statements 133
65 NOTE 29: SHARE-BASED PAYMENTS AND EMPLOYEE BENEFITS (in HUF mn) Previously approved option program required a modification thanks to the introduction of the Bank Group Policy on Payments accepted in 9/2011 resolution of Annual General Meeting regarding to the amendment of CRD III. directives and Act on Credit Institutions and Financial Enterprises. Key management personnel affected by the Bank Group Policy receive compensation based on performance assessment generally in the form of cash bonus and equity shares in a ratio of 50 50%. Assignment is based on OTP shares, furthermore performance based payments are deferred in accordance with the rules of Credit Institutions Act. The Bank ensures the share-based payment part for the management personnel of the Group members. The value of the discounted share-based payment at the performance assessment is determined by Board of Directors based on the average of the three previous trade day s middle rate of the Bank s equity shares fixed on the Budapest Stock Exchange. Discounted share-based payment shall contain maximum HUF 2,000 discount at the assessment date, and earnings for the shares at the payment date is determined by Board of Directors, maximum HUF 4,000. During implementation of the Remuneration Policy of the Group appeared that in case of certain foreign subsidiaries it is not possible to ensure the originally determined share-based payment because of legal reasons incompatible with concerning EU-directives, therefore the Board of Directors made a decision to cancel the share-based payment in the referred countries. Employee benefits are all forms of consideration given by an entity in exchange for service rendered by employees or for the termination of employment. IAS 19 Employee Benefits shall be applied in accounting for all employee benefits, except those to which IFRS 2 Share-based Payment applies. In case of the jubilee benefits both standards contain regulations. Short-term employee benefits are employee benefits (other than termination benefits) that are expected to be settled wholly before twelve months after the end of the annual reporting period in which the employees render the related service. Post-employment benefits are employee benefits (other than termination and short-term employee benefits) that are payable after the completion of employment. Post-employment benefit plans are formal or informal arrangements under which an entity provides post-employment benefits for one or more employees. Post-employment benefit plans are classified as either defined contribution plans or defined benefit plans, depending on the economic substance of the plan as derived from its principal terms and conditions. Termination benefits are employee benefits provided in exchange for the termination of an employee s employment as a result of either: an entity s decision to terminate an employee s employment before the normal retirement date or an employee s decision to accept an offer of benefits in exchange for the termination of employment. Other long-term employee benefits are all employee benefits other than short-term employee benefits, postemployment benefits and termination benefits. 134 OTP Bank Annual Report 2014
66 Board of Directors determined the parameters for the share-based payment relating to the year for periods of each year as follows: Year Exercise price per share Maximum earnings per share Exercise price per share Maximum earnings per share Exercise price per share Maximum earnings per share Exercise price per share Maximum earnings per share for the year 2010 for the year 2011 for the year 2012 for the year ,946 2, ,946 3,000 1,370 3, ,446 3,500 1,870 3,000 2,886 3, ,946 3,500 1,870 4,000 2,886 3,000 2,522 2, ,870 4,000 2,886 3,000 2,522 3, ,886 3,500 2,522 3, ,522 3,500 Based on parameters accepted by Board of Directors relating to the year 2010 effective pieces are follows as at 31 December 2014: Effective pieces Approved pieces of shares Exercised until 31 December 2014 Weighted average share price at the date of exercise (in HUF) Expired pieces Share purchasing period started in ,950 11,622 5, ,328 Share purchasing period started in , ,791 4,593 20,931 Share purchasing period started in ,479 31,789 4, ,690 Share purchasing period started in , ,451 Effective pieces are follows in exercise periods of each year relating to the year 2011 as at 31 December 2014: Effective pieces Approved pieces of shares Exercised until 31 December 2014 Weighted average share price at the date of exercise (in HUF) Expired pieces Share purchasing period started in , ,753 3,758 6,487 Share purchasing period started in ,267,173 1,256,529 4,886 10,644 Share purchasing period started in , , ,332 4,491 Share purchasing period starting in ,886 Effective pieces are follows in exercise periods of each year relating to the year 2012 as at 31 December 2014: Effective pieces Approved pieces of shares Exercised until 31 December 2014 Weighted average share price at the date of exercise (in HUF) Expired pieces Share purchasing period started in , ,671 4,413 5,190 Share purchasing period started in ,281 1,156, ,350 4,502 Share purchasing period starting in ,653 Share purchasing period starting in ,990 Effective pieces are follows in exercise periods of each year relating to the year 2013 as at 31 December 2014: Effective pieces Approved pieces of shares Exercised until 31 December 2014 Weighted average share price at the date of exercise (in HUF) Expired pieces Share purchasing period started in , ,263 4,369 1,781 Share purchasing period starting in ,340 Share purchasing period starting in ,340 Share purchasing period starting in ,909 IFRS consolidated financial statements 135
67 Effective pieces relating to the periods starting in settled during valuation of performance of year , can be modified based on risk assessment and personal changes. In connection with shares as a part of the Bank Group Policy on Payments modified by 7/2013 resolution of Annual General Meeting and the share-based compensation for Board of Directors detailed in 8/2013 resolution of Annual General Meeting and connecting compensation based on performance assessment accounted as equity-settled share based transactions, HUF 4,393 million was recognized as expense as at 31 December NOTE 30: RELATED PARTY TRANSACTIONS (in HUF mn) The compensation of key management personnel, such as the members of the Board of Directors, members of the Supervisory Board, key employees of the Bank and its major subsidiaries involved in the decision-making process in accordance with the compensation categories defined in IAS 24 Related Party Disclosures, is summarised below: Compensations Short-term employee benefits 8,373 9,534 Share-based payment 2,937 3,297 Other long-term employee benefits Termination benefits Total 12,184 13,885 Commitments to extend credit and guarantees 15,690 1,221 Loans provided to companies owned by the Management (normal course of business) 13,357 38,828 Credit lines of the members of Board of Directors and the Supervisory Board and their close family members (at normal market conditions) Loans provided to unconsolidated subsidiaries 1,304 1,124 The members of the Board of Directors, members of the Supervisory Board, chief executives and their close family members owned credit line A in the amount of HUF million and HUF million as at 31 December 2014 and as at 31 December An analysis of credit limit related to MasterCard Gold is as follows: Members of Board of Directors and their close family members Members of Supervisory Board 4 4 Chief executives 2 An analysis of credit limit related to Visa Card is as follows: Members of Board of Directors and their close family members Members of Supervisory Board OTP Bank Annual Report 2014
68 One member of Board of Directors and its family member owned AMEX Blue credit card loan in the amount of HUF 0.6 million as at 2014 and 31 December 2013, respectively. and their close family members owned AMEX Platinum credit card loan in the amount of HUF 23.5 and 10.5 million, respectively as at 31 December 2014 and 31 December Chief executives owned AMEX Gold credit card loan in the amount of HUF 3.5 million as at 2014 and 31 December 2013, respectively. The members of the Board of Directors, members of the Supervisory Board, chief executives Members of Board of Directors, members of Supervisory Board and chief executives owned other kinds of credit card loan, which are not listed above in the amount of HUF 18.2 and 35.4 million as at 2014 and 31 December 2013, respectively. An analysis of payment to chief executives of the Bank related to their activity in Board of Directors and Supervisory Board is as follows: Members of Board of Directors Members of Supervisory Board Total In the normal course of business, the Bank enters into other transactions with its subsidiaries, the amounts and volumes of which are not significant to these financial statements taken as a whole. NOTE 31: ACQUISITION (in HUF mn) a) Purchase and consolidation of subsidiaries On 31 January 2014 OTP banka Hrvatska d.d. signed a purchase agreement with the Croatian Banco Popolare d.d. on acquiring a 98.37% stake in the bank. The transaction was closed by setting the purchase price on 24 April The acquisition contributes to a more optimal economies of scale of the Bank in Croatia. IFRS consolidated financial statements 137
69 The fair value of the assets and liabilities acquired, and the related negative goodwill (gain from bargain purchase) is as follows: 2014 Cash, amounts due from banks and balances with the National Banks 1,719 Placements with other banks, net of allowance for placement losses 26,797 Financial assets at fair value through profit or loss Securities available-for-sale 4,555 Loans, net of allowance for loan losses 52,566 Associates and other investments Securities held-to-maturity Property and equipment 2,320 Intangible assets 248 Other assets 188 Amounts due to banks, the Hungarian Government, deposits from the National Banks and other banks (4,067) Deposits from customers (72,565) Liabilities from issued securities Financial liabilities at fair value through profit or loss Other liabilities (2,798) Subordinated bonds and loans Net assets 8,963 Non-controlling interest Negative goodwill (4,400) Cash consideration 4,563 b) Analysis of net outflow of cash in respect of purchase of subsidiaries 2014 Cash consideration (4,563) Cash acquired 1,719 Net cash outflow (2,844) NOTE 32: SIGNIFICANT SUBSIDIARIES AND ASSOCIATES (in HUF mn) Investments in companies in which the Bank has a significant interest are detailed below. They are fully consolidated companies and incorporated in Hungary unless otherwise stated. The Bank considers the subsidiaries as cash generating units. 138 OTP Bank Annual Report 2014
70 Significant subsidiaries Name Ownership (Direct and Indirect) Activity DSK Bank EAD (Bulgaria) % % commercial banking services OTP Bank JSC (Ukraine) % % commercial banking services JSC OTP Bank (Russia) 97.86% 97.81% commercial banking services OTP banka Hrvatska d.d. (Croatia) % % commercial banking services OTP Bank Romania S.A. (Romania) % % commercial banking services OTP banka Srbija a.d. (Serbia) 97.90% 97.56% commercial banking services OTP Banka Slovensko a. s. (Slovakia) 99.26% 99.21% commercial banking services OTP Financing Malta Company Ltd. (Malta) % refinancing activities OTP Factoring Ltd % % work-out OTP Mortgage Bank Ltd % % mortgage lending OTP Real Estate Ltd % % real estate management and development Merkantil Bank Ltd % % finance lease Merkantil Car Ltd % % finance lease OTP Building Society Ltd % % flat finance and reconstruction OTP Fund Management Ltd % % fund management Crnogorska komercijalna banka a.d. (Montenegro) % % commercial banking services OTP Financing Netherlands B.V. (the Netherlands) % % refinancing activities OTP Holding Ltd. (Cyprus)/OTP Financing Cyprus % % refinancing activities Bank Center No. 1. Ltd % % real estate lease Inga Kettő Ltd % % property management OTP Funds Servicing and Consulting Ltd % % fund services OTP Real Estate Leasing Ltd. (previously OTP Flat Lease Ltd.) % % real estate leasing OTP Life Annuity Ltd % % life annuity services Significant associates* Most significant indicators of associates which are accounted or not accounted for using the equity method is as follows: As at 31 December 2014: KITE Mezőgazdasági Szolgáltató és Kereskedelmi Ltd. D-ÉG Thermoset Ltd. Company for Cash Services Ltd. Suzuki Pénzügyi Szolgáltató Ltd. Total assets 56,717 5,758 2, ,354 Total liabilities 23,637 4, ,211 Shareholders equity 33,080 1,293 2, ,143 Total revenues 245,370 7,268 1, ,803 Total As at 31 December 2013: KITE Mezőgazdasági Szolgáltató és Kereskedelmi Ltd. D-ÉG Thermoset Ltd. Company for Cash Services Ltd. Suzuki Pénzügyi Szolgáltató Ltd. Total assets 48,717 5,961 2, ,444 Total liabilities 18,774 4, ,406 Shareholders equity 29,943 1,421 2, ,038 Total revenues 221,461 6,412 1, ,927 Total * Based on unaudited financial statements. IFRS consolidated financial statements 139
71 NOTE 33: TRUST ACTIVITIES (in HUF mn) The Bank acts as a trustee for certain loans granted by companies or employers to their employees, mainly for housing purposes. The ultimate risk for these loans rests with the party advancing the funds. As these loans and related funds are not considered to be assets or liabilities of the Group, they have been excluded from the accompanying Consolidated Statement of Financial Position. The amount of loans managed by the Group as a trustee 39,706 42,345 NOTE 34: CONCENTRATION OF ASSETS AND LIABILITIES In the percentage of the total assets Receivables from, or securities issued by the Hungarian Government or the NBH* 27.9% 21.0% There were no other significant concentrations of the assets or liabilities of the Group as at 31 December 2014 or as at 31 December The Group continuously provides the Authority with reports on the extent of dependency on large depositors as well as the exposure of the biggest 50 depositors towards the Group. Further to this obligatory reporting to the Authority, the Group pays particular attention on the exposure of its largest partners and cares for maintaining a closer relationship with these partners in order to secure the stability of the level of deposits. The organisational unit of the Group in charge of partner-risk management analyses the biggest partners on a constant basis and sets limits on the Bank s and the Group s exposure separately partner-by-partner. If necessary, it modifies partner-limits in due course thereby reducing the room for manoeuvring of the Treasury and other business areas. NOTE 35: MATURITY ANALYSIS OF LIABILITIES AND LIQUIDITY RISK (in HUF mn) Liquidity risk is a measure of the extent to which the Group may be required to raise funds to meet its commitments associated with financial instruments. The Group maintains its liquidity profiles in accordance with regulations prescribed by the NBH. The essential of the liquidity risk management strategy is to identify all relevant systemic and idiosyncratic sources of liquidity risk and to measure the probability and severity of such events. During liquidity risk management the Group considers the effect of liquidity risk events caused by reasons arising in the bank business line (deposit withdrawal), the national economy (exchange rate shock yield curve shock) and the global financial system (capital market shock). In line with the Group s risk management policy liquidity risks are measured and managed on multiply hierarchy levels and applying integrated unified VaR based methodology. The basic requirement is that the Group must keep high quality liquidity reserves by means it can fulfill all liabilities when they fall due without material additional costs. * Securities issued by the NBH were changed into two-weeks NBH deposit during the year ended 31 December OTP Bank Annual Report 2014
72 The liquidity reserves can be divided to two parts. There are separate decentralized liquid asset portfolios at subsidiary level and a centralized flexible liquidity pool at Group s level. The reserves at subsidiary levels are held to cover the relevant shocks of the subsidiaries which may arise in local currencies (deposit withdrawal, local capital market shock, unexpected business expansion), while the centralized liquidity pool is held to cover the Bank s separate shocks (deposit-, yield curveand exchange rate shocks) and all group member s potential shocks that may arise in foreign currencies (deposit withdrawal, capital market shock). The recalculation of shocks is made at least quarterly while the recalibration of shock measurement models and review of the risk management methodology is an annual process. The monitoring of liquidity reserves for both centralized and decentralized liquid asset portfolio has been built in the daily reporting process. The contractual amounts disclosed in the maturity analyses are the contractual undiscounted cash-flows like gross finance lease obligations (before deducting finance charges); prices specified in forward agreements to purchase financial assets for cash; net amounts for pay-floating/receive-fixed interest rate swaps for which net cash-flows are exchanged; contractual amounts to be exchanged in a derivative financial instrument for which gross cash-flows are exchanged; gross loan commitments. Such undiscounted cash-flows differ from the amount included in the statement of financial position because the amount in that statement is based on discounted cash-flows. When the amount payable is not fixed, the amount disclosed is determined by reference to the conditions existing at the end of the reporting period. For example, when the amount payable varies with changes in an index, the amount disclosed may be based on the level of the index at the end of the period. Due to the balance sheet adjustment process (deleveraging) experienced in the last few years, the liquidity reserves of the Group increased significantly while the liquidity risk exposure has decreased considerably. Currently the (over) coverage of risk liquidity risk exposure by high quality liquid assets is in all-time record highs. In 2014 there were no material changes in liquidity risk management process. The following tables provide an analysis of liabilities about the non-discounted cash-flow into relevant maturity groupings based on the remaining period from the balance sheet date to the contractual maturity date. It is presented under the most prudent consideration of maturity dates where options or repayment schedules allow for early repayment possibilities. IFRS consolidated financial statements 141
73 As at 31 December 2014: Within 3 months Within one year and over 3 months Within 5 year and over one year Over 5 years Without maturity Amounts due to banks, the Hungarian Government, deposits from the National Banks 413,402 42,767 98, , ,357 and other banks Deposits from customers 6,219,811 1,223, ,098 19,366 7,713,819 Liabilities from issued securities 35,666 52, ,622 23, ,797 Other liabilities* 417, ,980 4,718 2, ,858 Subordinated bonds and loans 30,593 17, , ,191 ** 299,732 TOTAL LIABILITIES 7,117,188 1,488, , , ,191 9,553,563 Receivables from derivative financial instruments classified as held for trading 1,480, ,420 47,408 19,340 1,886,963 Liabilities from derivative financial instruments classified as held for trading (1,393,686) (304,425) (9,408) (5,578) (1,713,097) Net notional value of financial instruments classified as held for trading 87,109 34,995 38,000 13, ,866 Receivables from derivative financial instruments designated as fair value hedge 203, , ,138 3,898 1,098,668 Liabilities from derivative financial instruments designated as fair value hedge (199,337) (500,996) (308,413) (3,273) (1,012,019) Net notional value of financial instruments designated as fair value hedge 4,520 51,779 29, ,649 Net notional value of derivative financial instruments total 91,629 86,774 67,725 14, ,515 Commitments to extend credit 414, , ,034 59, ,732 Bank guarantees 61,818 82,014 64, , ,670 Off-balance sheet commitments 476, , , ,526 1,368,402 Total As at 31 December 2013: Within 3 months Within one year and over 3 months Within 5 year and over one year Over 5 years Without maturity Amounts due to banks, the Hungarian Government, deposits from the National Banks 467,393 60, ,362 84, ,761 and other banks Deposits from customers 5,515,729 1,110, ,421 23,144 6,913,614 Liabilities from issued securities 65, , ,567 65, ,090 Other liabilities* 329,973 15,572 12,223 1, ,990 Subordinated bonds and loans 3,211 4, , ,842 ** 291,128 TOTAL LIABILITIES 6,381,657 1,401, , , ,842 8,827,583 Receivables from derivative financial instruments classified as held for trading 741, ,784 56,205 14, ,193 Liabilities from derivative financial instruments classified as held for trading (772,367) (114,122) (94,783) (32,048) (1,013,320) Net notional value of financial instruments classified as held for trading (31,083) (10,338) (38,578) (17,128) (97,127) Receivables from derivative financial instruments designated as fair value hedge 250, , ,987 3,942 1,192,772 Liabilities from derivative financial instruments designated as fair value hedge (261,502) (264,224) (735,838) (2,579) (1,264,143) Net notional value of financial instruments designated as fair value hedge (10,689) (15,194) (46,851) 1,363 (71,371) Net notional value of derivative financial instruments total (41,772) (25,532) (85,429) (15,765) (168,498) Commitments to extend credit 652, , ,340 69,161 6,028 1,266,185 Bank guarantees 53,902 78, ,536 25, ,994 Off-balance sheet commitments 706, , ,876 95,037 6,531 1,579,179 Total * Without derivative financial instruments designated as fair value hedge. ** See Note OTP Bank Annual Report 2014
74 NOTE 36: NET FOREIGN CURRENCY POSITION AND FOREIGN CURRENCY RISK (in HUF mn) As at 31 December 2014 USD EUR CHF Others Total Assets 434,794 1,887, ,241 2,278,135 5,417,543 from this: loans concerned in conversion into HUF* 27, ,150 74, ,696 Liabilities (428,962) (1,887,894) (139,131) (2,263,759) (4,719,746) from this: provision for loans concerned in conversion into HUF* (1,531) (73,854) (3,870) (79,255) Off-balance sheet assets and liabilities, net (9,117) (40,166) (277,512) 55,425 (271,370) Net position (3,285) (40,687) 400,598 69,801 1,124,224 As at 31 December 2013 USD EUR CHF Others Total Assets 490,095 1,523, ,116 2,620,053 5,567,643 Liabilities (423,536) (1,477,154) (209,899) (2,312,443) (4,423,032) Off-balance sheet assets and liabilities, net 44,933 (2,758) (743,924) (109,072) (810,821) Net position 111,492 43,467 (19,707) 198, ,790 The table above provides an analysis of the main foreign currency exposures of the Group. The remaining foreign currencies are shown within Others. Others category contains mainly foreign currencies in RON, UAH, RUB and BGN. Whilst the Group monitors its foreign exchange position for compliance with the regulatory requirements of the National Banks and own limit system established in respect of limits on open positions. The measurement of the open foreign currency position of the Group involves monitoring the Value-at-Risk ( VaR ) limit on the foreign exchange exposure of the Group. NOTE 37: INTEREST RATE RISK MANAGEMENT (in HUF mn) Interest rate risk is the risk that the value of a financial instrument will fluctuate due to changes in market interest rates. The length of time for which the rate of interest is fixed on a financial instrument, therefore, indicates to what extent it is exposed to interest rate risk. In addition, the significant spread existing between the different types of interest bearing assets and liabilities enables the Group to benefit from a high level of flexibility in adjusting for its interest rate matching and interest rate risk exposure. The majority of the interest bearing assets and liabilities of the Group are structured to match either short-term assets and short-term liabilities, or long-term assets and liabilities with repricing opportunities within one year, or long-term assets and corresponding liabilities where repricing is performed simultaneously. The following table presents the interest repricing dates of the Group. Variable yield assets and liabilities have been reported in accordance with their next repricing date. Fixed income assets and liabilities have been reported in accordance with their maturity. * Loans were converted into HUF at foreign exchange rates applied in conversion due to Acts on Customer loans, so these do not bear further foreign currency risk or exposure. Loans denominated in JPY are included by others. See Note IFRS consolidated financial statements 143
75 As at 31 December 2014: Within 1 month Over 1 month and Over 3 moths and Over 1 year and Over 2 years Non-interest- Total within 3 months within 12 months within 2 years bearing Total HUF Currency HUF Currency HUF Currency HUF Currency HUF Currency HUF Currency HUF Currency ASSETS Cash, amounts due from banks and balances with the National Banks 1,798,973 69, , ,030 1,865, ,732 2,307,632 fixed rate 1,796,928 30, ,796,928 30,510 1,827,438 variable rate 2,045 39, ,150 39,192 41,342 non-interest-bearing 66, ,030 66, , ,852 Placements with other banks, net of allowance for placements losses 12, , ,015 15,303 1, ,721 12, , ,006 fixed rate , ,729 1,924 1, ,147 78,978 variable rate 11,689 80,893 71,286 13, , , ,237 non-interest-bearing 70 23, ,721 23,791 Securities held for trading ,381 2,922 3,866 3, ,431 7,171 59,710 3,634 77,227 17,413 94,640 fixed rate ,252 2,922 3,052 3, ,431 7,171 16,001 13,671 29,672 variable rate , ,624 non-interest-bearing 59,710 3,634 59,710 3,634 63,344 Securities available-for-sale 2,427 14,087 18,832 36,295 25,771 48,118 9,377 42, ,653 77,539 39,896 20, , , ,152 fixed rate 2,427 11,732 18,832 36,295 25,771 47,656 9,377 42, ,653 77, , , ,074 variable rate 2, ,817 2,817 non-interest-bearing 39,896 20,365 39,896 20,365 60,261 Loans, net of allowance for loan losses 774,424 2,567, , ,622 83, ,337 89, , , ,738 38, ,467 1,621,955 4,242,286 5,864,241 fixed rate 6, ,372 5,392 79,611 23, ,269 35, ,949 88, , ,243 1,133,843 1,293,086 variable rate 767,576 2,284, , ,011 60, ,068 53,577 42, ,206 80,096 1,423,979 2,796,976 4,220,955 non-interest-bearing 38, ,467 38, , ,200 Securities held-to-maturity 10,860 63,374 5,076 1,527 1,481 36,902 2, ,000 30,974 14, ,839 51, ,369 fixed rate 10,648 56,697 4,553 1,527 1,454 36,902 2, ,000 30, ,126 50, ,296 variable rate 212 6, , ,439 non-interest-bearing 14, , ,634 Derivative financial instruments 889,464 1,377, ,489 2,361, , ,239 8,578 19,996 31,973 41,671 34,609 1,939,786 4,647,022 6,586,808 fixed rate 511,452 1,154, , ,747 85, ,065 8,578 19,996 31,973 41, ,469 2,844,949 3,603,418 variable rate 378, , ,057 1,541,674 51,248 3,174 1,181,317 1,767,464 2,948,781 non-interest-bearing 34,609 34,609 34,609 As at 31 December 2014: LIABILITIES Amounts due to banks, the Hungarian Government, deposits from the National Bank of Hungary and other banks Within 1 month Over 1 month and within 3 months Over 3 moths and within 12 months Over 1 year and within 2 years Over 2 years Non-interestbearing Total HUF Currency HUF Currency HUF Currency HUF Currency HUF Currency HUF Currency HUF Currency 48, ,132 2,698 43,788 35,659 14,911 5,144 4, ,454 5, , , , ,274 fixed rate 48, ,159 1,209 17,169 9,371 13,890 5,144 4, ,454 5, , , ,855 variable rate 137,973 1,489 26,619 26,288 1,021 27, , ,390 non-interest-bearing , ,809 22,029 Deposits from customers 1,976,745 2,380, , , , ,481 37,652 68,263 1,172, ,464 9, ,878 3,824,782 3,848,696 7,673,478 fixed rate 1,557, , , , , ,534 37,652 54,368 41,176 26,410 2,256,397 1,999,369 4,255,766 variable rate 419,631 1,400,328 7,970 17,225 15,947 13,895 1,131, ,054 1,558,813 1,685,449 3,244,262 non-interest-bearing 9, ,878 9, , ,450 Liabilities from issued securities 6,142 5,995 5,683 15,831 12,544 32,782 21,526 11, , ,022 2, ,310 68, ,084 fixed rate 6,142 5,384 5,683 7,365 12,544 32,420 21,526 11, , ,288 56, ,111 variable rate 611 8, ,439 9,439 non-interest-bearing 8,022 2,512 8,022 2,512 10,534 Derivative financial instruments 794,288 1,514, ,978 2,318, , ,283 6,698 19,847 23,515 41, ,635 2,001,380 4,630,128 6,631,508 fixed rate 628,184 1,033, ,690 1,013, , ,466 6,698 19,847 23,515 41,313 1,021,938 2,809,455 3,831,393 variable rate 166, , ,288 1,304,482 3,024 30, ,416 1,817,038 2,796,454 non-interest-bearing 26 3, ,635 3,661 Subordinated bonds and loans 29,375 16, ,642 1, , ,968 fixed rate 234, , ,642 variable rate 29,375 16,779 46,154 46,154 non-interest-bearing 1,172 1,172 1,172 Net position 652,817 (91,764) (247,305) 77,235 (169,584) (166,491) 73, ,778 1,558 45, , , , ,475 1,120,536 Total 144 OTP Bank Annual Report 2014
76 As at 31 December 2013: Within 1 month Over 1 month and Over 3 moths and Over 1 year and Over 2 years Non-interest- Total within 3 months within 12 months within 2 years bearing Total HUF Currency HUF Currency HUF Currency HUF Currency HUF Currency HUF Currency HUF Currency ASSETS Cash, amounts due from banks and balances with the National Banks 51,834 51, , , , , ,125 fixed rate 49,234 15, ,248 15,209 64,457 variable rate 2,600 36, ,794 37,071 39,865 non-interest-bearing 68, ,681 68, , ,803 Placements with other banks, net of allowance for placements losses 32, ,021 27, ,804 1,033 18,097 33, , ,479 fixed rate 32, ,781 7, ,677 32, , ,859 variable rate 20,240 20, ,490 40,490 non-interest-bearing 1,033 18,097 1,033 18,097 19,130 Securities held for trading 211, ,515 2,104 4,629 6, ,019 3,562 28,279 73,201 7, ,829 45, ,540 fixed rate 211, ,327 2,104 4,484 5, ,019 3,562 28, ,295 38, ,586 variable rate non-interest-bearing 73,201 7,209 73,201 7,209 80,410 Securities available-for-sale 1,152,169 38,649 10,449 36,614 26,967 52,259 37,793 48,589 87,696 96,282 30,794 18,994 1,345, ,387 1,637,255 fixed rate 1,152,169 36,443 10,449 35,109 26,967 52,259 37,793 48,066 87,696 96,282 1,315, ,159 1,583,233 variable rate 2,206 1, ,234 4,234 non-interest-bearing 30,794 18,994 30,794 18,994 49,788 Loans, net of allowance for loan losses 927,001 2,354, , ,164 58, ,809 38, , , ,783 53, ,680 1,651,245 4,593,965 6,245,210 fixed rate 2, ,096 8, ,371 13, ,547 4, ,254 31, ,702 60,426 1,475,970 1,536,396 variable rate 924,652 2,018, , ,793 44,786 51,262 34,444 2, ,741 35,081 1,537,524 2,855,315 4,392,839 non-interest-bearing 53, ,680 53, , ,975 Securities held-to-maturity 1,653 10,682 2,692 5,368 25,977 57,681 1, ,086 26,693 12,782 1, ,599 59, ,051 fixed rate 1,429 2, ,946 57,681 1, ,086 26, ,108 57, ,676 variable rate , , , ,457 non-interest-bearing 12,782 1,136 12,782 1,136 13,918 Derivative financial instruments 577,139 1,217, ,140 1,004,215 75, ,740 12,228 28,152 30,284 21, ,168,674 2,372,468 3,541,142 fixed rate 255, ,732 30, ,203 52,259 97,755 12,149 28,152 30,284 21, ,546 1,124,272 1,504,818 variable rate 322, , , ,012 23,624 2, ,128 1,247,530 2,035,658 non-interest-bearing As at 31 December 2013: LIABILITIES Amounts due to banks, the Hungarian Government, deposits from the National Bank of Hungary and other banks Within 1 month Over 1 month and within 3 months Over 3 moths and within 12 months Over 1 year and within 2 years Over 2 years Non-interestbearing Total HUF Currency HUF Currency HUF Currency HUF Currency HUF Currency HUF Currency HUF Currency 328, ,044 10,336 60,570 67,457 11, ,264 85,647 26,184 12,323 2, , , ,212 fixed rate 315, ,680 6,548 1,839 1,041 9, ,171 85,647 25, , , ,378 variable rate 13,035 33,364 3,788 58,731 66,416 1, ,239 94, ,471 non-interest-bearing 12,323 2,040 12,323 2,040 14,363 Deposits from customers 1,485,295 1,972, , , , , ,210 85, , ,337 9, ,137 3,193,591 3,673,015 6,866,606 fixed rate 1,119, , , , , , ,210 73,423 16,490 29,523 1,913,754 2,079,925 3,993,679 variable rate 366,029 1,055,051 20,560 8, ,892 12, , ,814 1,270,815 1,417,953 2,688,768 non-interest-bearing 9, ,137 9, , ,159 Liabilities from issued securities 6,767 3,510 17,874 33,748 21, ,792 26,578 39, ,519 3,610 8,556 3, , , ,218 fixed rate 6,436 3,510 17,729 21,524 20, ,792 25,040 39, ,923 3, , , ,708 variable rate , ,538 31,596 34,269 12,224 46,493 non-interest-bearing 8,556 3,461 8,556 3,461 12,017 Derivative financial instruments 434,554 1,368,756 64,868 1,459,170 44, ,093 28,699 28,541 22,221 21, ,852 3,007,280 3,602,132 fixed rate 434, ,255 63, ,299 40, ,518 28,699 28,541 22,221 21, , ,709 1,494,009 variable rate ,501 1,032 1,303,871 3,991 22,575 5,552 2,101,947 2,107,499 non-interest-bearing Subordinated bonds and loans ,746 15, ,041 3, , ,162 fixed rate 221, , ,041 variable rate ,746 15,117 42,963 42,963 non-interest-bearing 3,158 3,158 3,158 Net position 696, , ,478 (96,737) (170,372) (422,019) (15,135) 109,751 (300,400) 163, , , , ,633 1,192,472 Total IFRS consolidated financial statements 145
77 NOTE 38: CONSOLIDATED EARNINGS PER SHARE (in HUF mn) Consolidated Earnings per share attributable to the ordinary shares of the Group are determined by dividing consolidated Net profit for the year attributable to ordinary shareholders, after the deduction of declared preference dividends, by the weighted average number of ordinary shares outstanding during the year. Dilutive potential ordinary shares are deemed to have been converted into ordinary shares. Consolidated net profit for the year attributable to ordinary shareholders (in HUF mn) (101,985) 64,199 Weighted average number of ordinary shares outstanding during the year for calculating basic EPS (number of share) 267,035, ,914,990 Basic Earnings per share (in HUF) (382) 241 Consolidated net profit for the year attributable to ordinary shareholders (in HUF mn) (101,985) 64,199 Modified weighted average number of ordinary shares outstanding during the year for calculating diluted EPS (number of share) 267,323, ,148,860 Diluted Earnings per share (in HUF) (382) 240 Weighted average number of ordinary shares 280,000, ,000,010 Average number of Treasury shares 12,964,851 13,085,020 Weighted average number of ordinary shares outstanding during the year for calculating basic EPS 267,035, ,914,990 Dilutive effects of options issued in accordance with the Remuneration Policy/Management Option Program and 288, ,870 convertible into ordinary shares* The modified weighted average number of ordinary shares outstanding during the year for calculating diluted EPS 267,323, ,148,860 The ICES bonds could potentially dilute basic EPS in the future, but were not included in the calculation of diluted EPS because they are antidilutive for the year presented. NOTE 39: NET GAIN OR LOSS REALIZED ON FINANCIAL INSTRUMENTS (in HUF mn) As at 31 December 2014: Net interest gain and loss Net non-interest gain and loss Provision for impairment Other Comprehensive Income Cash, amounts due from banks and balances with the National Banks 16,498 Placements with other banks, net of allowance for placements losses 3,683 (10) Securities held for trading 4,275 Securities available-for-sale 41,969 4,299 (297) 16,073 Loans, net of allowance for loan losses 700,265 9,007 (446,820) Securities held-to-maturity 39,934 Other assets 2,549 Derivative financial instruments 6,529 (162) Amounts due to banks, the Hungarian Government, deposits from the National Banks and other banks (12,541) Deposits from customers (135,080) 161,242 Liabilities from issued securities (13,826) Subordinated bonds and loans (13,883) Total 636, ,661 (447,127) 16,073 * The dilutive effect is in connection with the Remuneration Policy. 146 OTP Bank Annual Report 2014
78 As at 31 December 2013: Net interest gain and loss Net non-interest gain and loss Provision for impairment Other Comprehensive Income Cash, amounts due from banks and balances with the National Banks 4,207 Placements with other banks, net of allowance for placements losses 5, Securities held for trading Securities available-for-sale 71,743 7,936 (2,125) Loans, net of allowance for loan losses 765,042 7,312 (262,943) Securities held-to-maturity 33,002 (87) 11 Derivative financial instruments 25,307 (1,569) Amounts due to banks, the Hungarian Government, deposits from the National Banks and other banks (13,826) Deposits from customers (191,514) 157,707 Liabilities from issued securities (34,896) Subordinated bonds and loans (11,412) Total 653, ,612 (262,558) (2,125) IFRS consolidated financial statements 147
79 NOTE 40: FAIR VALUE OF FINANCIAL INSTRUMENTS (in HUF mn) In determining the fair value of a financial asset or liability the Group in the case of instruments that are quoted on an active market uses the market price. In most cases market price is not publicly available so the Group has to make assumptions or use valuation techniques to determine the fair value of a financial instrument. See Note 40. e) for more information about fair value classes applied for financial assets and liabilities measured at fair value in these financial statements. To provide a reliable estimate of the fair value of those financial instrument that are originally measured at amortized cost, the Group used the discounted cash-flow analyses (loans, placements with other banks, amounts due to banks, deposits from customers). The fair value of issued securities and subordinated bonds is based on quoted prices (e.g. Reuters). Cash and amounts due from banks and balances with the National Banks represent amounts available immediately thus the fair value equals to the cost. The assumptions used when calculating the fair value of financial assets and liabilities when using valuation technique are the following: the discount rates are the risk free rates related to the denomination currency adjusted by the appropriate risk premium as of the end of the reporting period, the contractual cash-flows are considered for the performing loans and for the non-performing loans, the amortized cost less impairment is considered as fair value, the future cash-flows for floating interest rate instruments are estimated from the yield curves as of the end of the reporting period, the fair value of the deposit which can be due in demand cannot be lower than the amount payable on demand. Classes of assets and liabilities not measured at fair value in the statement of financial position, income approach was used to convert future cash-flows to a single current amount. Fair value of current assets is equal to carrying amount, fair value of liabilities from issued securities and other bond-type classes of assets and liabilities not measured at fair value measured based on Reuters market rates, fair value of other classes not measured at fair value of the statement of financial position measured at discounted cash-flow method. Fair value of loans, net of allowance for loan losses measured at discount rate adjustment technique, the discount rate is derived from observed rates of return for comparable assets or liabilities that are traded in the market. Fair value measurements in relation with instruments measured not at fair value are categorized in level 2 of the fair value hierarchy. 148 OTP Bank Annual Report 2014
80 a) Fair value of financial assets and liabilities Carrying amount Fair value Carrying Fair value amount Cash, amounts due from banks and balances with the National Banks 2,307,632 2,307, , ,125 Placements with other banks, net of allowance for placements losses 281, , , ,984 Financial assets at fair value through profit or loss 289, , , ,605 Securities held for trading 94,640 94, , ,540 Fair value of derivative financial instruments classified as held for trading 194, ,635 74,065 74,065 Securities available-for-sale 839, ,152 1,637,255 1,637,255 Loans, net of allowance for loan losses 5,864,241 6,506,922 6,245,210 6,635,614 Securities held-to-maturity 709, , , ,899 Fair value of derivative financial instruments designated as fair value hedge 30,454 30,454 26,803 26,803 Financial assets total 10,321,129 10,959,309 9,717,528 10,124,285 Amounts due to banks, the Hungarian Government, deposits from the National Banks and other banks 708, , , ,467 Deposits from customers 7,673,478 7,672,819 6,866,606 6,874,230 Liabilities from issued securities 267, , , ,956 Fair value of derivative financial instruments designated as fair value hedge 85,679 85,679 74,695 74,695 Fair value of derivative financial instruments classified as held for trading 183, ,994 87,164 87,164 Subordinated bonds and loans 281, , , ,605 Financial liabilities total 9,200,477 9,250,578 8,525,057 8,511,117 b) Fair value of derivative instruments Fair value Notional value, net Interest rate swaps classified as held for trading Positive fair value of interest rate swaps classified as held for trading 43,401 53,667 45,929 59,566 Negative fair value of interest rate swaps classified as held for trading (63,691) (67,881) (67,678) (74,603) Foreign exchange swaps classified as held for trading Positive fair value of foreign exchange swaps classified as held for trading 48,636 5,357 42,458 5,512 Negative fair value of foreign exchange swaps classified as held for trading (51,537) (5,316) (48,154) (5,876) Interest rate swaps designated as fair value hedge Positive fair value of interest rate swaps designated as fair value hedge 14,032 9,733 8,539 5,836 Negative fair value of interest rate swaps designated as fair value hedge (3,463) (2,639) (4,602) 682 Foreign exchange swaps designated as fair value hedge Positive fair value of foreign exchange swaps designated as fair value hedge 2,437 1,520 2,276 2,097 Negative fair value of foreign exchange swaps designated as fair value hedge (2,276) (499) (2,066) (587) CCIRS classified as held for trading Positive fair value of CCIRS classified as held for trading 85,010 8,133 83,611 8,883 Negative fair value of CCIRS classified as held for trading (53,724) (7,521) (51,012) (9,126) Mark-to-market CCIRS classified as held for trading Positive fair value of mark-to-market CCIRS classified as held for trading Negative fair value of mark-to-market CCIRS classified as held for trading CCIRS designated as fair value hedge Positive fair value of CCIRS designated as fair value hedge 13,940 13,934 14,095 13,826 Negative fair value of CCIRS designated as fair value hedge (70,364) (68,742) (70,124) (70,004) Mark-to-market CCIRS designated as fair value hedge Positive fair value of mark-to-market CCIRS designated as fair value hedge 1,538 1,295 Negative fair value of mark-to-market CCIRS designated as fair value hedge (9,576) (2,770) (9,856) (3,339) Other derivative contracts designated as fair value hedge Positive fair value of other derivative contracts designated as fair value hedge ,617 Negative fair value of other derivative contracts designated as fair value hedge (45) (547) Other derivative contracts classified as held for trading Positive fair value of other derivative contracts classified as held for trading 17,588 6,597 14,592 2,845 Negative fair value of other derivative contracts classified as held for trading (15,042) (6,446) (11,844) (15,041) Derivative financial assets total 225, , , ,648 Derivative financial liabilities total (269,673) (161,859) (265,336) (178,441) Derivative financial instruments total (44,584) (60,991) (53,797) (75,793) IFRS consolidated financial statements 149
81 c) Hedge accounting The Group regularly enters into hedging transactions in order to decrease its financial risks. However some economically hedging trans- action do not meet the criteria to account for hedge accounting, therefore these transactions were accounted as derivatives held for trading. The summary of the hedging transactions of the Group are as follows: As at 31 December 2014: Types of the hedges Description of the hedging instrument Fair value of the hedging instrument The nature of the risk being hedged Cash-flow hedges Fair value hedges IRS/Index option HUF 10,578 million Interest rate Net investment hedge CCIRS and issued in foreign operations* securities HUF (5,575) million Foreign exchange As at 31 December 2013: Types of the hedges Description of the hedging instrument Fair value of the hedging instrument The nature of the risk being hedged Cash-flow hedges Fair value hedges IRS/Index option HUF 7,095 million Interest rate Net investment hedge CCIRS and issued in foreign operations* securities HUF (1,743) million Foreign exchange d) Fair value hedges 1. Deposits from customers The interest payment cash-flows of some structured deposits of the Group denominated in HUF and EUR are exposed to the change of equity prices, equity indices or the change of EUR/HUF exchange rate. In order to hedge the interest rate risk of the interest payments the Group entered into interest rate swap transactions, where the risk of the cash-flow s from the structured deposits were swapped to payments linked to 3 month BUBOR or EURIBOR, resulting in a decrease in the fair value exposure of the deposits from customers. Fair value of the hedging instruments Securities available-for-sale The Group holds fixed interest rate securities denominated in foreign currencies and fixed interest rate government bonds denominated in HUF within the available-for-sale portfolio. These fixed interest rate securities and bonds are exposed to the fair value risk driven by the changes in the risk-free interest rates. In order to hedge the interest rate risk of the cash-flows the Group entered into pay fixed-receive floater interest rate swap transactions, where the risk from the cash-flows of the securities are swapped to payments linked to 3 or 12 month EURIBOR and the risk from the cash-flows of the bonds are swapped to payments linked to 6 month BUBOR, resulting in a decrease in the fair value exposure of the securities available-for-sale. Fair value of the hedging instruments (2,570) (879) * The objective of these hedge relationships is to mitigate the risk of changes in value of net investments in foreign subsidiaries (namely: OTP Banka Slovensko a.s., DSK Bank EAD, Crnogorska komercijalna banka a.d., OTP banka Hrvatska d.d.) due to change in foreign exchange rates. 150 OTP Bank Annual Report 2014
82 3. Loans to customers The Group has fixed interest rate loans denominated in various currencies. These fixed interest rate loans are exposed to fair value risk of changes of risk-free interest rates. In order to hedge the interest rate risk of the cash-flows the Group entered into pay-fixed, receive-floater interest rate swap transactions, where the risk of the payments from the loans are swapped to payments linked to 3 month EURIBOR or BUBOR resulting in a decrease in the interest rate fair value exposure of the loans to customers. Fair value of the hedging instruments (417) (518) 4. Issued securities The cash-flows of the fixed rate securities issued by the Group are exposed to the change in the EUR/HUF foreign exchange rate and the risk of change in the risk-free interest rates of EUR and HUF. The interest rate risk and foreign exchange risk related to these securities are hedged with EUR and HUF IRS and index option transactions. In the case of IRS transactions the fixed cash-flows were swapped to payments linked to 3 month EURIBOR or BUBOR, resulting a decrease in the interest rate and foreign exchange exposure of issued securities. Certain structured bonds are hedged by options which give the owner the right to get amount of the structure which is equal to the structure of the hedged bond. Fair value of the hedging IRS instruments 13,449 8,379 Fair value of the hedging index option instruments 9 12 As at 31 December 2014: Types of hedged items Types of hedging instruments Fair value of the hedged items Fair value of the hedging instruments Gains/Losses on the hedged on hedging items instruments Securities available-for-sale IRS HUF 286,344 million HUF (2,570) million HUF 1,691 million HUF (1,691) million Loans to customers IRS HUF 12,158 million HUF (417) million HUF (101) million HUF 101 million Deposits from customers IRS HUF 1,627 million HUF 107 million HUF (6) million HUF 6 million Liabilities from issued securities IRS HUF 88,309 million HUF 13,449 million HUF (5,070) million HUF 5,070 million Liabilities from issued securities Index option HUF 651 million HUF 9 million HUF 3 million HUF (3) million As at 31 December 2013: Types of hedged items Types of hedging instruments Fair value of the hedged items Fair value of the hedging instruments Gains/Losses on the hedged on hedging items instruments Securities available-for-sale IRS HUF 23,629 million HUF (879) million HUF (388) million HUF 388 million Loans to customers IRS HUF 12,866 million HUF (518) million HUF (540) million HUF 540 million Deposits from customers IRS HUF 5,224 million HUF 101 million HUF (197) million HUF 197 million Liabilities from issued securities IRS HUF 94,344 million HUF 8,379 million HUF (6,640) million HUF 6,640 million Liabilities from issued securities Index option HUF 644 million HUF 12 million HUF (8) million HUF 8 million IFRS consolidated financial statements 151
83 e) Fair value classes Methods and significant assumptions used to determine fair value of the different classes of financial instruments: Level 1: quoted prices (unadjusted) in active markets for identical assets or liabilities; Level 2: inputs other than quoted prices included within Level 1, that are observable for the asset or liability either directly or indirectly. Fair value measurements in relation with instruments measured not at fair value are categorized in level 2; Level 3: inputs for the asset or liability that are not based on observable market data (unobservable inputs). The following table shows an analysis of financial instruments recorded at fair value by level of the fair value hierarchy: As at 31 December 2014 Total Level 1 Level 2 Level 3 Financial assets at fair value through profit or loss 288,650 90, ,597 from this: securities held for trading 94,015 89,496 4,519 from this: positive fair value of derivative financial instruments classified 194, ,078 as held for trading Securities available-for-sale 823, ,957 97,154 4,347 Positive fair value of derivative financial instruments designated as fair value hedge 30,454 30,454 Financial assets measured at fair value total 1,142, , ,205 4,347 Negative fair value of derivative financial instruments classified as held for trading 183,994 1, ,774 Negative fair value of derivative financial instruments designated as fair value hedge 85,679 85,679 Financial liabilities measured at fair value total 269,673 1, ,453 As at 31 December 2013 Total Level 1 Level 2 Level 3 Financial assets at fair value through profit or loss 414, ,194 93,424 from this: securities held for trading 340, ,133 19,420 from this: positive fair value of derivative financial instruments classified 74, ,004 as held for trading Securities available-for-sale 1,628,005 1,474, , Positive fair value of derivative financial instruments designated as fair value hedge 26, ,796 Financial assets measured at fair value total 2,069,426 1,795, , Negative fair value of derivative financial instruments classified as held for trading 87, ,146 Negative fair value of derivative financial instruments designated as fair value hedge 74,695 74,695 Financial liabilities measured at fair value total 161, ,841 There were no transfers from and to Level 3 among the financial instruments in year 2014 and OTP Bank Annual Report 2014
84 Movements in Level 3 financial instruments measured at fair value The following table shows a reconciliation of the opening and closing amount of Level 3 securities available-for-sale which are recorded at fair value: Movement on securities available-for-sale in Level 3 Opening balance Increase Closing balance OTP Factoring Ltd. 2,103 2,103 OTP Factoring Ukarine LLC 1,175 1,175 DSK Bank EAD OTP banka Srbija a.d Total 27 4,320 4,347 NOTE 41: SEGMENT REPORTING BY BUSINESS AND GEOGRAPHICAL SEGMENTS (in HUF mn) The Group distinguishes business and geographical segments. The report on the base of the business and geographical segments is reported bellow. The reportable segments of the Group on the base of IFRS 8 are the following: OTP Core Hungary, Russia, Ukraine, Bulgaria, Romania, Serbia, Croatia, Slovakia, Montenegro, Leasing subsidiaries, Asset Management subsidiaries, Other subsidiaries and Corporate Center. OTP Core is an economic unit for measuring the result of core business activity of the Group in Hungary. Financials for OTP Core are calculated from the consolidated financial statements of the companies engaged in the Group s underlying banking operation in Hungary. These companies include OTP Bank Hungary Plc., OTP Mortgage Bank Ltd., OTP Building Society Ltd., OTP Factoring Ltd., OTP Financing Netherlands Ltd., OTP Holding Ltd., OTP Financing Cyprus and OTP Financing Solutions B.V. Corporate Centre: it is separated from OTP Core consolidated financial statements, this is a virtual entity responsible for rendering debt and capital market related to services to the subsidiaries across the Group, mainly in the form of capital and credit financing. The results of OTP Factoring Ukraine LLC, OTP Factoring SRL, OTP Factoring Bulgaria LLC, OTP Factoring Serbia d.o.o., OTP Factoring Montenegro d.o.o. and OTP Factoring Slovensko s.r.o. are included into the foreign banks segment. The activities of the other subsidiaries are out of the leasing and fund management activity, like: OTP Real Estate Ltd., OTP Life Annuity Ltd., OTP Funds Servicing and Consulting Ltd., Monicomp Ltd., OTP Building s.r.o., OTP Real Slovensko s.r.o. The reportable business and geographical segments of the Group are those components where: separated incomes and expenses, assets and liabilities can be identified and assignable to the segments, transactions between the different segments were eliminated, the main decisive board of the Group regularly controls the operating results, separated financial information is available. Goodwill/investment impairment and their tax saving effect: HUF 22,225 million goodwill impairment was recognized as at 31 December 2014 for OTP Bank JSC (Ukraine), while at the end of 2013 HUF 30,819 million was the effect of goodwill impairment after-tax for the same company. The tax saving effect was HUF (17,210) million in relation with goodwill and investment impairment of OTP Bank JSC (Ukraine) in the year ended as at 31 December The total saving effect was HUF (5,015) million in the year 2014 while the same effect at the same company was recognized in the amount of HUF (29,440) in year IFRS consolidated financial statements 153
85 Information regarding the Group s reportable segments is presented below: As at 31 December 2014: Main components of the Consolidated Statement of Recognized Income in HUF million OTP Group consolidated in the Consolidated Statement of Recognized Income structure of accounting reports Adjustements on the accounting in Recognized Income OTP Group consolidated in the Consolidated Statement of Recognized Income structure of management reports OTP CORE (Hungary) Foreign banks subtotal (without adjustments) JSC OTP Bank (Russia) OTP Bank JSC (Ukraine) DSK Bank EAD (Bulgaria) a b 1=a+b 1= = Net profit for the year (102,258) (102,258) Adjustments (total) (220,273) (220,273) Dividends and net cash transfers (after income tax) Goodwill/investment impairment (after income tax) (5,015) (5,015) Bank tax on financial institutions (after income tax) (30,193) (30,193) Effect of Banco Popolare acquisition (after income tax) 4,131 4,131 Impact of the expected refund obligation stemming from the invalidity of using FX margin in Hungary (after income tax) (26,923) (26,923) Potential refund obligation stemming from the presumed unfairness of unilateral amendments to loan contracts in Hungary (after income tax) Risk cost created toward Crimean exposures in 2014 (after income tax) Risk cost created toward exposues to Donetsk and Luhansk in 2014 (after income tax) (128,985) (128,985) (7,943) (7,943) (25,536) (25,536) Consolidated adjusted net profit for the year (102,258) 220, , ,418 (17,196) (14,541) (43,166) 39,170 Profit before income tax (153,643) 295, , ,097 (19,237) (17,678) (47,322) 43,587 Adjusted operating profit 293, , , , , ,028 27,269 62,392 Adjusted total income 801,879 24, , , , ,392 52, ,238 Adjusted net interest income 636, , , , ,972 45,327 79,116 Adjusted net profit from fees and commissions 215,656 (46,076) 169,580 94,244 67,306 21,378 10,306 20,262 Adjusted other net non-interest income (49,874) 70,183 20,309 15,095 2,506 (958) (3,555) 2,860 Adjusted other administrative expenses (508,692) 97,166 (411,526) (193,716) (200,651) (78,364) (24,809) (39,846) Total risk costs (446,830) 172,081 (274,749) (23,411) (238,302) (118,706) (74,591) (18,805) Adjusted provision for impairment on loan and placement losses (without the effect of revaluation of FX) (446,830) 183,318 (263,512) (22,088) (231,272) (117,623) (71,947) (17,526) Other provision (adjustment) 0 (11,237) (11,237) (1,323) (7,030) (1,083) (2,644) (1,279) Total other adjustments (one-off items)* 0 2,556 2,556 2, Income tax 51,385 (75,711) (24,326) (23,679) 2,041 3,137 4,156 (4,417) Total Assets 10,971, ,971,052 7,251,833 4,678, , ,363 1,603,812 Total Liabilities 9,706, ,706,886 5,932,448 4,122, , ,903 1,355,819 ( ) used at: provisions, impairment and expenses. * * One-off items consist of: revaluation result of FX swap at OTP Core in the amount of HUF (824) million; result of the treasury share swap agreement in the amount of HUF 3,380 million. 154 OTP Bank Annual Report 2014
86 OTP Bank Romania S.A. (Romania) OTP banka Srbija a.d. (Serbia) OTP banka Hrvatska d.d. (Croatia) OTP Banka Slovensko a.s. (Slovakia) Crnogorska komercijalna banka a.d. (Montenegro) Non-banking subsidiaries subtotal Leasing subsidiaries Asset Management subsidiaries Other subsidiaries Corporate Centre Eliminations and adjustments = (1,172) (1,588) 5,529 (5,113) (1,210) (1,508) 6,753 (4,452) (1,433) 1,120 9,807 1,358 7,527 5,895 3,789 13,404 5,970 6, (1,433) 1,545 23,410 8,555 25,426 17,099 11,518 43,483 14,073 9,041 20,369 (1,175) (11,633) 19,388 6,612 17,923 14,207 8,359 21,675 17, ,189 (1,175) (563) 2,429 1,851 5,203 3,000 2,877 7,934 (2,611) 9, , ,300 (108) ,874 (721) (935) 15,530 0 (11,166) (13,603) (7,197) (17,899) (11,204) (7,729) (30,079) (8,103) (2,337) (19,639) (258) 13,178 (9,042) (1,313) (6,900) (5,528) (3,417) (12,611) (7,478) 49 (5,182) 0 (425) (8,881) (1,202) (5,747) (5,277) (3,069) (9,682) (8,312) 1 (1,371) 0 (470) (161) (111) (1,153) (251) (348) (2,929) (3,811) (524) (334) 19 (1,965) (80) (1,224) (661) 223 (946) 476, , , , , , , ,756 1,668,257 (2,997,807) 441,371 79, , , , , , , ,085 (1,523,564) IFRS consolidated financial statements 155
87 As at 31 December 2013: Main components of the Consolidated Statement of Recognized Income in HUF million OTP Group consolidated in the Consolidated Statement of Recognized Income structure of accounting reports Adjustements on the accounting in Recognized Income OTP Group consolidated in the Consolidated Statement of Recognized Income structure of management reports OTP CORE (Hungary) Foreign banks subtotal (without adjustments) JSC "OTP Bank" (Russia) OTP Bank JSC (Ukraine) DSK Bank EAD (Bulgaria) a b 1=a+b 1= = Net profit for the year 64,108 64,108 Adjustments (total) (81,775) (81,775) Dividends and net cash transfers (after income tax) (406) (406) Goodwill/investment impairment (after income tax) (29,440) (29,440) Bank tax on financial institutions (after income tax) (43,219) (43,219) Fine imposed by the Hungarian Competition Authority (3,177) (3,177) (after income tax) Corporate tax impact of the transfer of general risk reserves to retained (5,533) (5,533) earnings Consolidated adjusted net profit for the year 64,108 81, , ,879 26,066 2,356 6,715 30,222 Profit before income tax 85,052 99, , ,836 36,051 3,409 11,162 33,758 Adjusted operating profit 347, , , , , ,223 40,285 55,089 Adjusted total income 874,392 (9,482) 864, , , ,493 72,811 92,965 Adjusted net interest income 653,728 (602) 653, , , ,041 53,385 72,908 Adjusted net profit from fees and commissions 201,757 (34,821) 166,936 91,507 71,612 21,990 17,020 18,208 Adjusted other net non-interest income 18,907 25,941 44,848 19,804 12,690 1,462 2,406 1,849 Adjusted other administrative expenses (526,771) 109,570 (417,201) (190,197) (206,678) (83,270) (32,526) (37,876) Total risk costs (262,569) (9,890) (272,459) (54,093) (206,616) (120,814) (29,123) (21,331) Adjusted provision for impairment on loan and placement losses (without the effect of revaluation of FX) (262,569) 28 (262,541) (48,899) (204,318) (121,310) (27,431) (20,723) Other provision (adjustment) 0 (9,918) (9,918) (5,194) (2,298) 496 (1,692) (608) Total other adjustments (one-off items)* 0 9,643 9,643 3, Income tax (20,944) (18,068) (39,012) (28,957) (9,985) (1,053) (4,447) (3,536) Total Assets 10,381, ,381,047 6,454,938 4,597, , ,730 1,343,595 Total Liabilities 8,871, ,871,715 5,210,465 3,921, , ,495 1,122,843 ( ) used at: provisions, impairment and expenses. * * One-off items consist of: revaluation result of FX swap at OTP Core in the amount of HUF 715 million; gain on the repurchase of own upper and lower Tier2 capital in the amount of HUF 6,104 million; result of the treasury share swap agreement in the amount of HUF 2,824 million. 156 OTP Bank Annual Report 2014
88 OTP Bank Romania S.A. (Romania) OTP banka Srbija a.d. (Serbia) OTP banka Hrvatska d.d. (Croatia) OTP Banka Slovensko a.s. (Slovakia) Crnogorska komercijalna banka a.d. (Montenegro) Non-banking subsidiaries subtotal Leasing subsidiaries Asset Management subsidiaries Other subsidiaries Corporate Centre Eliminations and adjustments = (4,143) (13,246) 2,209 1, ,038 2,286 3,681 (4,929) 2,398 1,501 (4,143) (13,235) 2,796 1, ,005 2,357 4,284 (4,636) 2, , ,909 4,099 3,506 12,688 6,566 4,226 1,896 (3,272) 1,237 20,375 7,580 22,696 14,909 10,516 46,423 17,447 6,692 22,284 (3,105) (12,340) 14,254 4,553 16,010 12,088 7,804 20,042 15, ,486 (3,105) (2,130) 2,269 1,671 4,878 3,101 2,475 3,876 (2,555) 6,690 (259) 0 (59) 3,852 1,356 1,808 (280) ,505 4,512 (64) 18,057 0 (10,151) (13,228) (7,171) (14,787) (10,810) (7,010) (33,735) (10,881) (2,466) (20,388) (167) 13,576 (11,290) (13,644) (5,113) (2,596) (2,705) (10,683) (4,209) 58 (6,532) 0 (1,067) (11,109) (13,002) (5,142) (2,594) (3,007) (7,544) (4,413) 0 (3,131) 0 (1,780) (181) (642) 29 (2) 302 (3,139) (3,401) , (11) (587) (351) 0 (967) (71) (603) (293) (434) 1, ,789 86, , , , , ,716 9, ,967 1,561,552 (2,784,978) 420,689 62, , , , , ,859 2, , ,010 (1,569,057) IFRS consolidated financial statements 157
89 NOTE 42: SIGNIFICANT EVENTS DURING THE YEAR ENDED 31 DECEMBER ) Government measures related to customer loan contracts 4) Incorporation of OTP Financing Malta Company Ltd. See details in Note ) Acquisition in Croatia By setting the purchase price on 24 April 2014, the Group accomplished its Croatian acquisition. On 31 January 2014 OTP banka Hrvatska d.d. signed a purchase agreement with the Croatian Banco Popolare d.d. on acquiring a 98.37% stake in the bank. Following the submission of all the relevant documents the Croatian Central Bank approved the purchase of the majority stake. OTP banka Hrvatska accomplished the merge with Banco Popolare in December, The Group gained whole control over the company and will be fully consolidated from January, As a result of the deal OTP banka Hrvatska d.d. will enhance its presence in Northern Croatia, Zagreb and Slavonia in particular, mainly in the retail segment. On 29 October 2014 OTP Financing Malta Company Ltd. was incorporated in Malta. The company has a share capital of EUR 105,000,000 and is under 100% ownership (direct and indirect) of the Bank. 5) Incorporation of OTP Holding Malta Ltd. On 30 June 2014 OTP Holding Malta Limited has been registered by the Registrar of Companies. The registered capital of the Company EUR million and the direct and indirect ownership ratio of OTP Bank is 100%. 6) Term Note Program See details in Note 15. 3) Purchase of Banco Comercial Português On 30 July 2014 OTP Bank Romania S.A. signed an agreement in Bucharest with Banco Comercial Português on the purchase of its 100% ownership in its Romanian subsidiary. The purchase price was EUR 39 million. As a result of the acquisition the market share of OTP Bank Romania S.A. will rise to 2.1% elevating the bank into the 11 th place amongst the Romanian banks. 7) Judgment of the Competition Council of the Hungarian Competition Authority See details in Note 28. 8) Legal dispute in Montenegro See details in Note OTP Bank Annual Report 2014
90 NOTE 43: POST BALANCE SHEET EVENTS 1) Act on Fair banking Act LXXVIII of 2014 known as Act on Fair banking was promulgated that modified the Act CLXII of 2009 on Consumer Credit. The Act on Fair banking is aimed at making the variation in interest of customer loan contracts transparent and traceable. Regulations of the act are effective from 1 February The Act includes new regulations for modification of loan contracts, rules for uncharged cancellation by clients, special directions for foreign currency loans and rules of change for new contract conditions. The Act prescribes in relation with unilateral amendment of contractual clauses that interest, spread, cost and fee can be solely modified disadvantageously. Disadvantageous amendment for clients is not allowed in other conditions. 2) The impact of CHF strengthening started in January 2015 on the Group On 15 January 2015 the Swiss National Bank announced the abandonment of the CHF s exchange rate floor set at 1.2 against the euro. After the decision, the CHF sharply and substantially strengthened against the EUR and other foreign currencies in the CEE region: the CHF appreciated against the EUR from 1.2 CHF/EUR to under the parity, then it went up to 1.08 until 19 February. According to NBH s data the CHF strengthened by 20% against the HUF on the day of the announcement, the devaluation moderated to 7% until 19 February. In Hungary, according to the Act on Conversion into HUF the CHF mortgage loans are to be converted to forint loans at CHF/HUF exchange rate. The conversion became legally effective on 1 February (A customer may initiate on opt-out if meeting the criteria set by the law.) Starting from 1 January 2015 the monthly instalments of the FX mortgage loans must be calculated with the fixed rates set in the law on conversion, thus clients under the scope of the conversion law did not experience any negative effect of the CHF strengthening. The Bank fully hedged the open EUR/HUF positions derived from the conversion of FX mortgage loans to HUF on the FX tenders of the NBH, while the open EUR/CHF and EUR/JPY positions were hedged on the market until the end of Within the Hungarian household loan portfolio at the end of 2014 the net volume of CHF customer loans at OTP Core stood at HUF 12 billion equivalent, and the net volume of CHF car financing loans at Merkantil Bank Ltd. reached HUF 82 billion equivalent. The car financing loans are not subject to the conversion law. However, the monthly instalments increase due to the CHF strengthening may be mitigated (to a different extent at individual clients) by the reduction in the nominal interest rate according to Curia Law and Act on Settlement, and the compensation may lower the loan principal. In Romania the subsidiary of the Bank had HUF 134 billion equivalent net CHF mortgage loan volumes at the end of OTP Bank Romania S.A. was the first one to react to the step of the Swiss National Bank abolishing the peg to the euro: on 16 January 2015 the Romanian subsidiary announced that in order to mitigate the negative impact of CHF appreciation on monthly instalments the interest margin will be reduced by 1.5 ppts for 3 months for those customers who had variable-rate CHF mortgage loans (in accordance with effective conditions and depending on the antecedents of the loans). Clients can apply for this scheme until 27 February 2015 in the branches. By 12 February the take-up ratio reached 40% of performing CHF mortgage loan volumes. The Croatian subsidiary held HUF 22 billion equivalent net CHF mortgage loan volumes on its balance sheet at the end of On 19 January 2015 the Croatian Government announced that the CHF/HRK rate will be fixed at 6.39 for 12 months. The measure took effect on 26 January. IFRS consolidated financial statements 159
91 NOTE 44: STATEMENT OF ECONOMIC SITUATION AND IMPLICATIONS ON THE GROUP S FINANCIALS In 2014, economic developments in Hungary were shaped by sluggish external demand, supportive international money market environment, and intensifying domestic demand. The Eurozone s economy picked up speed in the second half of the year, and a number of Eurozone periphery countries came out of recession. Money market background was supportive even though the Fed started phasing out its Quantitative Easing, the Bank of Japan and the European Central Bank introduced further monetary stimuli measures. The dollar s firming, the plunging commodity prices and the Russian conflict adversely affected emerging markets, but this had little effect on the less commodity-oriented Central and Eastern European region. Hungary s economy grew by 3.5% in 2014, stronger than the 1.5% expansion in Last year broke the trend of the preceding years, when the main driving force of growth was net exports. Instead, an increase in investments became the key driver in 2014, while net exports contribution to growth became negative for the first time after a long while. In addition to investments, consumption also picked up: the consumption expenditure of households rose about 1.5% in 2014, following the stagnation in As a combined effect of the election year and the end of the seven-year EU budget, public investments surged at an extraordinary pace, but gross fixed capital formation also started to increase in the private sector. The key drivers in the latter were mostly car manufacturing, and the related capacity increasing projects in the supplier network. Picking up from the stagnation in 2013, the households consumption expenditure could go up in But its rise lagged behind that of real income, allowing retail savings to expand faster. The improvement on the labour market was pronounced mostly in the first half-year, the increase in employment came to a halt by the end of the year. The low interest rate environment and the higher real incomes led to a turnaround in private investments too, helping housing-related lending and housing investments start to rise. Following a record low of 1.7% in 2013, inflation fell further: consumer prices dropped by 0.2% in In addition to the government s measures, the favourable development in agricultural product prices, and oil prices plunge in the last four months of the year all contributed to the lower inflation rate. A steady fall in inflation justified the continuation of the rate cut cycle in the first half of the year, which ended with a 20-basis-point cut in July, at 2.1%. In the supportive international backdrop (abundance of liquidity), government bond yields fell further. Funding for Growth Scheme On 11 September 2013 the National Bank of Hungary decided on extending the Funding for Growth Scheme with a second phase which is to be open from 1 October 2013 till 31 December The total amount of refinancing available for banks in the second phase was originally set at HUF 500 billion, in September 2014 the total amount of available funding was lifted to HUF 1,000 billion. The limit can be increased to a maximum of HUF 2,000 billion by the Monetary Council. Similarly to the first phase, the central bank refinancing carries zero interest rate, a maximum 10-year tenor and can be lend over to SMEs by applying a maximum interest margin of 2.5%. The goal of the first pillar is to originate new loans, whereas the second pillar is for refinancing forint or foreign currency denominated liabilities of SMEs. The share of loan contracts concluded under the second pillar must not surpass 10% of the total amount of contracts concluded under the two pillars. The maximum available amount of loans for SMEs is limited at HUF 10 billion in each pillar. Under the second phase of the Programme the Group already contracted in the amount of more than HUF 117 billion until the end of 160 OTP Bank Annual Report 2014
92 2014, moreover loan applications in the pipeline exceeded HUF 38 billion. The macroeconomic outlook of Russia and Ukraine significantly deteriorated last year. The sanctions imposed because of the escalating Russia-Ukraine conflict, coupled with the dramatic fall in crude oil prices have significantly slowed down Russia s GDP growth, to 0.5%. The rouble s weakening pushed the USD/RUB to 58 by December, up from 37 in September. Although the 76% y-o-y depreciation offsets the lower oil price s effect on budgetary and export revenues (in rouble terms), it projects considerable recession through multiple factors. First, in an attempt to fend off market turbulence, the Central Bank of Russia raised its benchmark rate by 10.5 percentage points, to 17% which, together with the higher instalment burden of companies foreign currency loans, holds back investment activity. The Russian economy s foreign currency exposure is clearly low and the country can exploit its competitiveness advantages in the medium term, but the weaker currency comes at a price: y-o-y inflation reached 11.4% in December. This will lead to a rare decrease in real wages, damaging consumption. Russia s balance of payments position remained stable, but the USD 131 billion net capital outflow in 2014 is a red flag. The central bank s reserves stood at USD 389 billion at the end of December, about four times the reserve requirement. In Ukraine, the revolution at the beginning of 2014 ousted President Viktor Yanukovych. In response, Russia de facto separated the Crimean peninsula from Ukraine and provided support to separatists in Eastern Ukraine, which lead to warfare in the Donetsk and Luhansk regions. Because of capital flight and despite the IMF loan, Ukraine s currency, the hryvnia depreciated by 92% over the year. Ukraine s central bank lifted its base rate by 7.5 percentage points to 14% in Industrial production and GDP may have contracted by 10.7% and 7.5% y-o-y, respectively. By December, inflation grew to 24.9% y-o-y, partly because of the hike in the retail price of natural gas in April. Public debt ratio doubled between the end of 2013 and 2014 (to 66%). In February 2015 the expansion and extension of the IMF programme was announced. Originally the credit facility amounted to USD 27 billion, of which USD 17 billion was provided by the IMF. According to the IMF the credit line will be widened to USD 40 billion. In the meantime the Ukrainian government downgraded its GDP growth forecast for 2015: the economy is estimated to contract by 5.5% against the previous forecast of 4.3%. The Bank s operation in Russia Since the second half of 2013 the Bank has put particular emphasis on the improvement of consumer loan products profitability, in line with the fine-tuning of the risk profile of these portfolios and the efficiency of collection activities. Both the stricter underwriting rules applied by the Bank, the measures introduced by the supervisory authorities, the economic slowdown and the cyclical setback of the consumer loan market eventually resulted in moderated loan dynamics in As a reaction to the deterioration of the operating environment in the fourth quarter of 2014 (significant weakening of the rouble, 900 bps base rate hike in total) the Bank halted or limited new loan disbursement and made certain pricing steps. Since October no new credit cards have been sent out and the Bank cut back part of the card limits in December. Due to the market turbulences, since the middle of December cash loan disbursement has been suspended. The total FX-adjusted deposit base dropped by 10% in the first quarter of 2014 quarter-over-quarter, than it remained stable in the second quarter and grew already both in the third and fourth quarter, thus the yearly FX-adjusted decrease was 4% altogether. In the fourth quarter the Bank managed to increase its deposit base (+3% quarter-over-quarter, FX-adjusted) despite the unfavourable market environment deposit rates were increased in line with market trends at the end of December in order to reverse the deposit outflows. IFRS consolidated financial statements 161
93 In the course of 2014 the deposit base of JSC OTP Bank (Russia) increased nominally by 7% in RUB terms due to the devaluation of RUB. Due to the fact that the liquidity demand of maturing capital market instruments and the funding need of higher loan volumes increased, the net funding provided by the Partner Company to the Russian bank grew to USD 320 million by the end of 2014 from USD 204 million in 2013 (which practically meant that JSC OTP Bank (Russia) was net lender to the Group in 2013). It is important to note that the partner company funding provided at the end of 2014 contained a significant safety buffer due to the long Russian holiday period and the uncertainties stemming from the market turbulences. This is proved well by the fact that the net partner company funding dropped to USD 9 million at the end of January In 2015 JSC OTP Bank (Russia) will have RUB 300 million capital market redemptions (this is the total outstanding amount of issued bonds), so from a liquidity perspective the emphasis will be put on keeping the loan and deposit volume developments in balance. Given that the deposit of JSC OTP Bank (Russia) deposit base remained stable despite the liquidity shock the Russian banking system suffered, the liquidity risks are deemed to be moderate in 2015, too. might decrease in The operating environment is not expected to improve materially, thus with respect to elevated risk costs no material turnaround is expected in The Russian operation is expected to remain loss-making in The Bank s operation in Ukraine In 2014 both the retail and corporate lending activity of the Ukrainian banking group became muted. In the consumer lending segment more stringent lending standards were introduced already in the first quarter of Cash loan disbursement was suspended from 9 April However, it was resumed in the second half of August, but since then newly sold cash loan volumes significantly lagged behind those in the base period (in the fourth quarter the volume of new disbursements reached only 14% that a year ago). From the second quarter of 2014 the cross-sale of credit cards declined to practically zero. As for the retail lending the Bank has remained active only in the point of sale (POS) loan segment. As a consequence of stricter lending conditions new POS loan origination melted down by more than 40% year-over-year in Regarding corporate lending the activity is focused rather on using existing credit limits. The Bank paid back issued bonds in the amount of RUB 13.3 billion in 2014, out of which RUB 1.1 billion matured in the fourth quarter of In the fourth quarter the Russian subsidiary received RUB 3 billion subordinated loan with 10 years maturity from the Partner Company, whereas in 2014 JSC OTP Bank (Russia) repaid altogether RUB 1.2 billion equivalent subordinated debt to the parent company. The capital adequacy ratio of JSC OTP Bank (Russia) stood at 12.1% at the end of In 2015 the DPD0 90 loan portfolio is expected to decline, which, together with a stable deposit base might result in improving liquidity position, but lower revenues. Due to the increased funding cost net interest income Customer deposit volumes showed a 9% yearover-year increase (adjusted for the FX-effect). After the 7% FX-adjusted quarter-over-quarter decline in the first quarter, the second quarter saw a 7% increase followed by a 4% expansion in the third quarter and a 5% growth in the fourth quarter of The net loan to deposit ratio came down to 137% at the end of 2014, which marks multi-year low. The decline of USD deposits did not cause liquidity problems, because this coincided with the decline of FX loan volumes. Latter was attributable not only to the loan repayments, but to the elevated provisioning, too, which required the Bank to purchase USD from its UAH liquidity reserves. Both the USD liquidity generated through these transactions and the FX liquidity coming from repayments of performing FX 162 OTP Bank Annual Report 2014
94 loans was used by the Ukrainian banking group (including the bank, the Leasing and Factoring company) to repay partner company financing, which declined by altogether USD 445 million in 2014 (without subordinated debt). In January 2015 an additional USD 30 million intragroup funding was paid back by OTP Bank JSC (Ukraine). of Leasing and Factoring companies are exempt from banks capital adequacy rules. The Ukrainian Factoring company that received HUF 19 billion equivalent capital increase in September 2014 (through converting debt into equity). In 2015 the equity of the Factoring Company is expected to be raised by converting partner company financing into equity. The UAH liquidity is managed in Ukraine and the Ukrainian bank has to prepare for any UAH liquidity needs. The excess UAH liquidity is invested typically in assets maturing within 1 month, mainly central bank instruments, collateralized money market instruments (FX swap, repo). The excess liquidity can be invested in uncollateralized instruments only in small amount, with strict counterparty risk limits and a maturity of 1 7 days. In 2014 the maturing Ukrainian government bonds were not rolled over, at the beginning of 2015 the amount of Ukrainian government bonds kept on the balance sheet reached only UAH 26 million. The UAH liquidity has to safely cover at all times the UAH money market and capital market redemptions within 3 months as well as the potential UAH deposit shocks. The shareholders equity of the Ukrainian banking group under IFRS consists of the impact of the conversion of UAH 800 million equivalent subordinated debt into equity booked in the fourth quarter of The decision about the capital increase was signed on 12 December 2014, which meant issue of additional 64,563 pieces of ordinary shares. Compared to December 2013 the shareholders equity of the Ukrainian banking group in HUF terms dropped as a result of weakening UAH against HUF, whereas losses realized in 2014 had a negative impact on equity, too. The Ukrainian shareholders equity includes that of 3 entities: the Bank, the Leasing and Factoring companies. The standalone capital adequacy ratio of the Bank under local regulation stood at 10.4% at the end of 2014, thus it exceeded the regulatory minimum. This capital adequacy ratio under local regulation did not incorporate the impact of the capital conversion booked in the fourth quarter In the second quarter of 2014 the Bank decided to close down its business in the Crimea, 8 branches were closed there. In Donetsk and Luhansk counties where special circumstances prevail the Bank closed altogether 15 branches, thus the number of banking outlets declined to 2 at the end of Significant additional risk cost was created both in Crimea and the Eastern Ukrainian region (Donetsk and Luhansk), as a result the provision coverage of total gross loans reached 100% in Crimea and went up to 99.4% in case of gross loan exposures toward Donetsk and Luhansk regions. The Ukrainian market and operating environment was volatile, especially in the time period between the end of 2014 and the writing of the report: after the conflict intensified again the parties reached a cease-fire accord and the IMF assistance programme is likely to be expanded, but despite all of these the UAH weakened further against the dollar. This points to further losses in Ukraine in 2015 both in case of OTP Bank JSC (Ukraine) and the Factoring company. By the end of 2014 the large majority of exposures toward Crimea, Donetsk and Luhansk counties were covered by provisions. If the territorial conflict did not escalate, and if the operating environment changed in the positive direction in Donetsk and Luhansk counties paving the way for banks to operate normally, that could create the possibility to release part of the provision already created there. The key focus areas are the optimisation of the operation and the gradual reduction of OTP s exposures. The funds expected to be granted to the country by supranational institutions as well as the related requirements to implement structural changes in the economy might stabilize the economic situation and the exchange rate of the UAH. IFRS consolidated financial statements 163


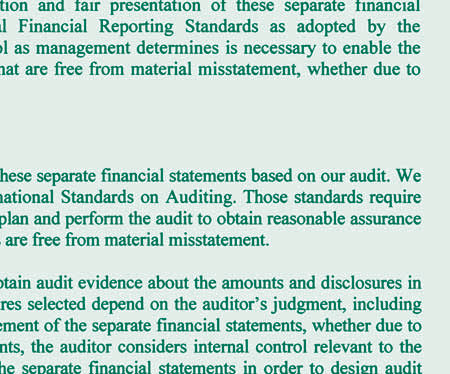
95 164 OTP Bank Annual Report 2014


96 IFRS separate financial statements 165
Note 2 SIGNIFICANT ACCOUNTING
 Note 2 SIGNIFICANT ACCOUNTING POLICIES BASIS FOR THE PREPARATION OF THE FINANCIAL STATEMENTS The consolidated financial statements have been prepared in accordance with International Financial Reporting
Acal plc. Accounting policies March 2006
 Acal plc Accounting policies March 2006 Basis of preparation The consolidated financial statements of Acal plc and all its subsidiaries have been prepared in accordance with International Financial Reporting
G8 Education Limited ABN: 95 123 828 553. Accounting Policies
 G8 Education Limited ABN: 95 123 828 553 Accounting Policies Table of Contents Note 1: Summary of significant accounting policies... 3 (a) Basis of preparation... 3 (b) Principles of consolidation... 3
Türkiye İş Bankası A.Ş. Separate Financial Statements As at and for the Year Ended 31 December 2015
 Türkiye İş Bankası A.Ş. Separate Financial Statements As at and for the Year Ended 2015 29 April 2016 This report includes 93 pages of separate financial statements together with their explanatory notes.
The statements are presented in pounds sterling and have been prepared under IFRS using the historical cost convention.
 Note 1 to the financial information Basis of accounting ITE Group Plc is a UK listed company and together with its subsidiary operations is hereafter referred to as the Company. The Company is required
Notes to Consolidated Financial Statements Note 1: Basis of Presentation
 NOTES TO CONSOLIDATED FINANCIAL STATEMENTS to Consolidated Financial Statements Note 1: Basis of Presentation Bank of Montreal ( the bank ) is a public company incorporated in Canada having its registered
Consolidated financial statements
 Summary of significant accounting policies Basis of preparation DSM s consolidated financial statements have been prepared in accordance with International Financial Reporting Standards (IFRS) as adopted
NOTES TO THE COMPANY FINANCIAL STATEMENTS
 FINANCIAL S 78 79 80 81 82 CONSOLIDATED INCOME CONSOLIDATED OF COMPREHENSIVE INCOME CONSOLIDATED OF FINANCIAL POSITION CONSOLIDATED OF CONSOLIDATED OF CHANGES IN EQUITY 83 NOTES TO THE CONSOLIDATED FINANCIAL
Summary of Significant Accounting Policies FOR THE FINANCIAL YEAR ENDED 31 MARCH 2014
 46 Unless otherwise stated, the following accounting policies have been applied consistently in dealing with items which are considered material in relation to the financial statements. The Company and
CSCBANK S.A.L. (FORMERLY CREDITCARD SERVICES COMPANY S.A.L.)
") CSCBANK S.A.L. (FORMERLY CREDITCARD SERVICES COMPANY S.A.L.) CONSOLIDATED FINANCIAL STATEMENTS AND INDEPENDENT AUDITORS REPORT YEAR ENDED DECEMBER 31, 2010 CSCBANK S.A.L. (FORMERLY CREDITCARD SERVICES
CSCBANK S.A.L. (FORMERLY CREDITCARD SERVICES COMPANY S.A.L.) CONSOLIDATED FINANCIAL STATEMENTS AND INDEPENDENT AUDITORS REPORT YEAR ENDED DECEMBER 31, 2010 CSCBANK S.A.L. (FORMERLY CREDITCARD SERVICES
ACCOUNTING POLICIES. for the year ended 30 June 2014
 ACCOUNTING POLICIES REPORTING ENTITIES City Lodge Hotels Limited (the company) is a company domiciled in South Africa. The group financial statements of the company as at and comprise the company and its
The consolidated financial statements of
 Our 2014 financial statements The consolidated financial statements of plc and its subsidiaries (the Group) for the year ended 31 December 2014 have been prepared in accordance with International Financial
Transition to International Financial Reporting Standards
 Transition to International Financial Reporting Standards Topps Tiles Plc In accordance with IFRS 1, First-time adoption of International Financial Reporting Standards ( IFRS ), Topps Tiles Plc, ( Topps
Preliminary Final report
 Appendix 4E Rule 4.3A Preliminary Final report AMCOR LIMITED ABN 62 000 017 372 1. Details of the reporting period and the previous corresponding period Reporting Period: Year Ended Previous Corresponding
Shin Kong Investment Trust Co., Ltd. Financial Statements for the Years Ended December 31, 2014 and 2013 and Independent Auditors Report
 Shin Kong Investment Trust Co., Ltd. Financial Statements for the Years Ended, 2014 and 2013 and Independent Auditors Report INDEPENDENT AUDITORS REPORT The Board of Directors and stockholder Shin Kong
International Accounting Standard 12 Income Taxes. Objective. Scope. Definitions IAS 12
 International Accounting Standard 12 Income Taxes Objective The objective of this Standard is to prescribe the accounting treatment for income taxes. The principal issue in accounting for income taxes
5N PLUS INC. Condensed Interim Consolidated Financial Statements (Unaudited) For the three month periods ended March 31, 2016 and 2015 (in thousands
 For the three month periods ended March 31, 2016 and 2015 (in thousands") Condensed Interim Consolidated Financial Statements (Unaudited) (in thousands of United States dollars) Condensed Interim Consolidated Statements of Financial Position (in thousands of United States dollars)
Condensed Interim Consolidated Financial Statements (Unaudited) (in thousands of United States dollars) Condensed Interim Consolidated Statements of Financial Position (in thousands of United States dollars)
(Amounts in millions of Canadian dollars except for per share amounts and where otherwise stated. All amounts stated in US dollars are in millions.
 Notes to the Consolidated Financial Statements (Amounts in millions of Canadian dollars except for per share amounts and where otherwise stated. All amounts stated in US dollars are in millions.) 1. Significant
Principal Accounting Policies
 1. Basis of Preparation The accounts have been prepared in accordance with Hong Kong Financial Reporting Standards ( HKFRS ). The accounts have been prepared under the historical cost convention as modified
Consolidated Statement of Financial Position
 18 Consolidated Statement of Financial Position As at December 31, 2010 and 2009 Notes SAR 000 SAR 000 Assets Cash and balances with SAMA 4 11,997,395 10,457,455 Due from banks and other financial institutions
E-STAR ALTERNATIVE PLC.
 E-STAR ALTERNATIVE PLC. CONSOLIDATED FINANCIAL STATEMENTS PREPARED IN ACCORDANCE WITH INTERNATIONAL FINANCIAL REPORTING STANDARDS AS ADOPTED BY THE EUROPEAN UNION FOR THE YEAR ENDED DECEMBER 31, 2011 The
Arab National Bank Saudi Joint Stock Company
 CONSOLIDATED STATEMENT OF FINANCIAL POSITION As at December 31, 2013 and 2012 ASSETS Note 2013 SAR 000 2012 SAR 000 Cash and balances with SAMA 4 14,971,749 20,334,429 Due from banks and other financial
Residual carrying amounts and expected useful lives are reviewed at each reporting date and adjusted if necessary.
 87 Accounting Policies Intangible assets a) Goodwill Goodwill represents the excess of the cost of an acquisition over the fair value of identifiable net assets and liabilities of the acquired company
ARABIAN SCANDINAVIAN INSURANCE COMPANY P.L.C.
 ARABIAN SCANDINAVIAN INSURANCE COMPANY P.L.C. Financial statements and independent auditor s report for the year ended 31 December 2012 ARABIAN SCANDINAVIAN INSURANCE COMPANY P.L.C. Contents Pages Independent
NOTES TO THE ANNUAL FINANCIAL STATEMENTSNOTE
 NOTES TO THE ANNUAL FINANCIAL STATEMENTSNOTE Notes to the ANNUAL FINANCIAL STATEMENTS 19 1. SUMMARY OF SIGNIFICANT ACCOUNTING POLICIES The principal accounting policies adopted in the preparation of these
International Accounting Standard 12 Income Taxes
 EC staff consolidated version as of 21 June 2012, EN IAS 12 FOR INFORMATION PURPOSES ONLY International Accounting Standard 12 Income Taxes Objective The objective of this Standard is to prescribe the
Moscow-Minsk Foreign Bank (unitary enterprise) Financial Statements Together With Independent Auditors Report For The Year Ended December 31, 2004
 Financial Statements Together With Independent Auditors Report For The Year Ended December 31, 2004") Moscow-Minsk Foreign Bank (unitary enterprise) Financial Statements Together With Independent Auditors Report For The Year Ended December 31, 2004 Financial statements for the year ended 31 December 2004
Moscow-Minsk Foreign Bank (unitary enterprise) Financial Statements Together With Independent Auditors Report For The Year Ended December 31, 2004 Financial statements for the year ended 31 December 2004
SIGNIFICANT GROUP ACCOUNTING POLICIES
 SIGNIFICANT GROUP ACCOUNTING POLICIES Basis of consolidation Subsidiaries Subsidiaries are all entities over which the Group has the sole right to exercise control over the operations and govern the financial
Volex Group plc. Transition to International Financial Reporting Standards Supporting document for 2 October 2005 Interim Statement. 1.
 Volex Group plc Transition to International Financial Reporting Standards Supporting document for 2 October 2005 Interim Statement 1. Introduction The consolidated financial statements of Volex Group plc
RELIANCE INDUSTRIES (MIDDLE EAST) DMCC 1. Reliance Industries (Middle East) DMCC Reports and Financial Statements for the year ended 31 December 2014
 DMCC 1. Reliance Industries (Middle East) DMCC Reports and Financial Statements for the year ended 31 December 2014") RELIANCE INDUSTRIES (MIDDLE EAST) DMCC 1 Reliance Industries (Middle East) DMCC Reports and Financial Statements for the year ended 31 December 2014 2 RELIANCE INDUSTRIES (MIDDLE EAST) DMCC Independent
RELIANCE INDUSTRIES (MIDDLE EAST) DMCC 1 Reliance Industries (Middle East) DMCC Reports and Financial Statements for the year ended 31 December 2014 2 RELIANCE INDUSTRIES (MIDDLE EAST) DMCC Independent
EXPLANATORY NOTES. 1. Summary of accounting policies
 1. Summary of accounting policies Reporting Entity Taranaki Regional Council is a regional local authority governed by the Local Government Act 2002. The Taranaki Regional Council group (TRC) consists
ANNUAL FINANCIAL RESULTS FOR THE YEAR ENDED 31 JULY 2014 FONTERRA ANNUAL FINANCIAL RESULTS 2014 A
 ANNUAL FINANCIAL RESULTS FOR THE YEAR ENDED 31 JULY 2014 FONTERRA ANNUAL FINANCIAL RESULTS 2014 A CONTENTS DIRECTORS STATEMENT 1 INCOME STATEMENT 2 STATEMENT OF COMPREHENSIVE INCOME 3 STATEMENT OF FINANCIAL
136 ST ENGINEERING / ABOVE & BEYOND
 136 ST ENGINEERING / ABOVE & BEYOND Independent auditors report Members of the Company Singapore Technologies Engineering Ltd Report on the financial STATEMENTS We have audited the accompanying financial
Income Taxes STATUTORY BOARD SB-FRS 12 FINANCIAL REPORTING STANDARD
 STATUTORY BOARD SB-FRS 12 FINANCIAL REPORTING STANDARD Income Taxes This version of the Statutory Board Financial Reporting Standard does not include amendments that are effective for annual periods beginning
NAS 09 NEPAL ACCOUNTING STANDARDS ON INCOME TAXES
 NAS 09 NEPAL ACCOUNTING STANDARDS ON INCOME TAXES CONTENTS Paragraphs OBJECTIVE SCOPE 1-4 DEFINITIONS 5-11 Tax Base 7-11 RECOGNITION OF CURRENT TAX LIABILITIES AND CURRENT TAX ASSETS 12-14 RECOGNITION
IFRS Illustrative Consolidated Financial Statements 2014
 IFRS Illustrative Consolidated Financial Statements 2014 1 PKF International Limited administers a network of legally independent member firms which carry on separate businesses under the PKF Name. PKF
MATRIX IT LTD. AND ITS SUBSIDIARIES CONSOLIDATED FINANCIAL STATEMENTS
 CONSOLIDATED FINANCIAL STATEMENTS AS OF DECEMBER 31, 2013 CONSOLIDATED FINANCIAL STATEMENTS AS OF DECEMBER 31, 2013 NIS IN THOUSANDS INDEX Page Auditors' Reports 2-4 Consolidated Statements of Financial
Fortis Financial Statements 2006
 Fortis Financial Statements 2006 Fortis Financial Statements 2006 Fortis Consolidated Financial Statements Report of the Board of Directors of Fortis SA/NV and Fortis N.V. Fortis SA/NV Financial Statements
TURKISH BANK A.Ş. CONSOLIDATED FINANCIAL STATEMENTS FOR THE YEAR ENDED 31 DECEMBER 2008
 CONSOLIDATED FINANCIAL STATEMENTS FOR THE YEAR ENDED 31 DECEMBER 2008 To the Board of Directors of Turkish Bank A.Ş. Đstanbul INDEPENDENT AUDITOR S REPORT We have audited the accompanying consolidated
ANNUAL FINANCIAL RESULTS
 ANNUAL FINANCIAL RESULTS For the year ended 31 July 2013 ANNUAL FINANCIAL RESULTS 2013 FONTERRA CO-OPERATIVE GROUP LIMITED Contents: DIRECTORS STATEMENT... 1 INCOME STATEMENT... 2 STATEMENT OF COMPREHENSIVE
Indian Accounting Standard (Ind AS) 12. Income Taxes
 12. Income Taxes") Indian Accounting Standard (Ind AS) 12 Contents Income Taxes Paragraphs Objective Scope 1 4 Definitions 5 11 Tax base 7 11 Recognition of current tax liabilities and current tax assets 12 14 Recognition
Indian Accounting Standard (Ind AS) 12 Contents Income Taxes Paragraphs Objective Scope 1 4 Definitions 5 11 Tax base 7 11 Recognition of current tax liabilities and current tax assets 12 14 Recognition
Samsung Life Insurance Co., Ltd. Separate Financial Statements March 31, 2013 and 2012
 Separate Financial Statements Index Page(s) Report of Independent Auditors 1-2 Separate Financial Statements Statements of Financial Position 3 Statements of Comprehensive Income 4 5 Statements of Changes
INGENICO GROUP Consolidated Financial Statements
 INGENICO GROUP Consolidated Financial Statements December 31, 2014 Ingenico Consolidated Financial Statements December 31, 2014 I. CONSOLIDATED INCOME STATEMENTS For the years ended December 31, 2014 and
SAMPLE MANUFACTURING COMPANY LIMITED CONSOLIDATED FINANCIAL STATEMENTS. Year ended December 31, 2012
 SAMPLE MANUFACTURING COMPANY LIMITED CONSOLIDATED FINANCIAL STATEMENTS Year ended SAMPLE MANUFACTURING COMPANY LIMITED CONSOLIDATED FINANCIAL STATEMENTS For the year ended The information contained in
EKO FAKTORİNG A.Ş. FINANCIAL STATEMENTS AT 31 DECEMBER 2013 TOGETHER WITH INDEPENDENT AUDITOR S REPORT
 FINANCIAL STATEMENTS TOGETHER WITH INDEPENDENT AUDITOR S REPORT FINANCIAL STATEMENTS CONTENTS PAGES BALANCE SHEET (STATEMENT OF FINANCIAL POSITION)... 1 STATEMENT OF COMPREHENSIVE INCOME... 2 STATEMENT
DBS BANK LTD (Incorporated in Singapore. Registration Number: 196800306E) AND ITS SUBSIDIARIES
 AND ITS SUBSIDIARIES") DBS BANK LTD (Incorporated in Singapore. Registration Number: 196800306E) AND ITS SUBSIDIARIES FINANCIAL STATEMENTS For the financial year ended 31 December 2013 Financial Statements Table of Contents
DBS BANK LTD (Incorporated in Singapore. Registration Number: 196800306E) AND ITS SUBSIDIARIES FINANCIAL STATEMENTS For the financial year ended 31 December 2013 Financial Statements Table of Contents
MOL Hungarian Oil and Gas Public Limited Company and Subsidiaries
 MOL Hungarian Oil and Gas Public Limited Company and Subsidiaries Consolidated financial statements prepared in accordance with International Financial Reporting Standards together with the independent
Consolidated Statement of Financial Position Sumitomo Corporation and Subsidiaries As of March 31, 2016 and 2015. Millions of U.S.
 Consolidated Statement of Financial Position Sumitomo Corporation and Subsidiaries As of March 31, 2016 and 2015 ASSETS Current assets: Cash and cash equivalents 868,755 895,875 $ 7,757 Time deposits 11,930
FUBON LIFE INSURANCE CO., LTD. AND SUBSIDIARIES. CONDENSED CONSOLIDATED INTERIM FINANCIAL STATEMENTS JUNE 30, 2013 and 2012
 FUBON LIFE INSURANCE CO., LTD. AND SUBSIDIARIES CONDENSED CONSOLIDATED INTERIM FINANCIAL STATEMENTS JUNE 30, 2013 and 2012 (with Independent Auditors Report Thereon) Address: 14F, No. 108, Sec. 1, Tun
Consolidated financial statements 2014. Zurich Insurance Group Annual Report 2014
 Consolidated financial statements 2014 Annual Report 2014 2 Annual results 2014 Consolidated financial statements Contents Consolidated income statements 3 Consolidated statements of comprehensive income
FUBON LIFE INSURANCE CO., LTD. AND SUBSIDIARIES. CONSOLIDATED INTERIM FINANCIAL STATEMENTS June 30, 2014 and 2013
 CONSOLIDATED INTERIM FINANCIAL STATEMENTS 2014 and (with Independent Accountants Report Thereon) Address: 14F, No. 108, Sec. 1, Tun Hua S. Road, Taipei, Taiwan Telephone: 886-2-8771-6699 - 1 - 2014 and
Losses within a subsidiary are attributed to the non-controlling interest even if that results in a deficit balance.
 IFRS ACCOUNTING POLICIES 2012 CORPORTATE INFORMATION The consolidated financial statements of Visma AS, for the year ended 31 December 2012 were authorised for issue in accordance with a resolution of
SAMPLE MANUFACTURING COMPANY LIMITED CONSOLIDATED FINANCIAL STATEMENTS. Year ended December 31, 2011
 SAMPLE MANUFACTURING COMPANY LIMITED CONSOLIDATED FINANCIAL STATEMENTS Year ended SAMPLE MANUFACTURING COMPANY LIMITED CONSOLIDATED FINANCIAL STATEMENTS For the year ended The information contained in
Microfinance Organization Credo LLC Financial statements
 LLC Financial statements Year ended 31 December 2015, together with independent auditor s report Financial statements Contents Independent auditors report Financial statements Statement of financial position...
Banking Department Income Statement for the year to 28 February 2011
 48 Bank of England Annual Report 2011 Banking Department Income Statement for the year to 28 February 2011 Note Profit before tax 4 132 231 Corporation tax net of tax relief on payment to HM Treasury 7
Brussels, March 2014 Summary of significant accounting policies
 Brussels, March 2014 Summary of significant accounting policies Tessenderlo Chemie NV (hereafter referred to as the "company"), the parent company, is domiciled in Belgium. The consolidated financial statements
Address: 296, Jen Ai Road, Sec. 4, Taipei, Taiwan, R.O.C. Telephone: 886-2-2755-1399
 Consolidated Statements For The Years Ended 2013 and With Independent Auditors Report The reader is advised that these financial statements have been prepared originally in Chinese. These financial statements
CONSOLIDATED INCOME STATEMENT for the year ended 31st December
 CONSOLIDATED INCOME STATEMENT for the year ended 31st December HK$ million Notes 2012 2011 Group turnover 5 4,105 3,493 Share of turnover of jointly controlled entities 5 1,644 1,532 5,749 5,025 Group
Notes to the Consolidated Financial Statements
 1. General The Company is a public limited company incorporated in Hong Kong and its shares are listed on The Stock Exchange of Hong Kong Limited (the Stock Exchange ). The address of the registered office
Consolidated financial statements of MTY Food Group Inc. November 30, 2015 and 2014
 Consolidated financial statements of MTY Food Group Inc. Independent auditor s report...1 2 Consolidated statements of income... 3 Consolidated statements of comprehensive income... 4 Consolidated statements
ATS AUTOMATION TOOLING SYSTEMS INC. Annual Audited Consolidated Financial Statements
 Annual Audited Consolidated Financial Statements For the year ended March 31, 2014 MANAGEMENT S RESPONSIBILITY FOR FINANCIAL REPORTING The preparation and presentation of the Company s consolidated financial
Sri Lanka Accounting Standard LKAS 12. Income Taxes
 Sri Lanka Accounting Standard LKAS 12 Income Taxes CONTENTS paragraphs SRI LANKA ACCOUNTING STANDARD-LKAS 12 INCOME TAXES OBJECTIVE SCOPE 1 4 DEFINITIONS 5 11 Tax base 7 11 RECOGNITION OF CURRENT TAX LIABILITIES
NOTES TO THE FINANCIAL STATEMENTS FOR THE YEAR ENDED 31 DECEMBER 2014
 1. STATEMENT OF ACCOUNTING POLICIES General information Kingspan Group plc is a public limited company registered and domiciled in Ireland, with its registered office at Dublin Road, Kingscourt, Co Cavan.
What science can do. AstraZeneca Annual Report and Form 20-F Information 2014
 What science can do Financial Statements Group Accounting Policies Basis of accounting and preparation of financial information The Consolidated Financial Statements have been prepared under the historical
In addition, Outokumpu has adopted the following amended standards as of January 1, 2009:
 1. Corporate information Outokumpu Oyj is a Finnish public limited liability company organised under the laws of Finland and domiciled in Espoo. The parent company, Outokumpu Oyj, has been listed on the
Finding and retaining the right customers. Bâloise-Holding Financial Report 2005
 Finding and retaining the right customers Bâloise-Holding Financial Report 2005 Contents Consolidated Annual Financial Statements of the Baloise Group Consolidated balance sheet 4 Consolidated income
Financial and statutory reports
 Financial and statutory reports Understanding our reports This financial report enables readers to assess the corporation s results for the year, including our present financial position, future outlook
GENWORTH MI CANADA INC.
 Condensed Consolidated Interim Financial Statements (In Canadian dollars) GENWORTH MI CANADA INC. Three and six months ended June 30, 2015 and 2014 Condensed Consolidated Interim Statements of Financial
CEZ GROUP CONSOLIDATED FINANCIAL STATEMENTS PREPARED IN ACCORDANCE WITH INTERNATIONAL FINANCIAL REPORTING STANDARDS AS OF DECEMBER 31, 2015
 CEZ GROUP CONSOLIDATED FINANCIAL STATEMENTS PREPARED IN ACCORDANCE WITH INTERNATIONAL FINANCIAL REPORTING STANDARDS AS OF DECEMBER 31, 2015 PRELIMINARY UNAUDITED ACCOUNTS Prepared as of March 14, 2016
VASSETI (UK) PLC CONSOLIDATED FINANCIAL STATEMENTS FOR THE SIX MONTHS ENDED 30 JUNE 2013
 PLC CONSOLIDATED FINANCIAL STATEMENTS FOR THE SIX MONTHS ENDED 30 JUNE 2013") CONSOLIDATED FINANCIAL STATEMENTS FOR THE SIX MONTHS ENDED 30 JUNE 2013 INTERIM MANAGEMENT REPORT (UNAUDITED) FOR THE 6 MONTHS ENDED 30 JUNE 2013 1. Key Risks and uncertainties Risks and uncertainties
CONSOLIDATED FINANCIAL STATEMENTS FOR THE SIX MONTHS ENDED 30 JUNE 2013 INTERIM MANAGEMENT REPORT (UNAUDITED) FOR THE 6 MONTHS ENDED 30 JUNE 2013 1. Key Risks and uncertainties Risks and uncertainties
Rabobank Group. Consolidated Financial Statements 2005. prepared in accordance with International Financial Reporting Standards
 Rabobank Group Consolidated Financial Statements 2005 prepared in accordance with International Financial Reporting Standards Rabobank Group Consolidated Financial Statements 2005 This publication, the
Statement of Cash Flows
 HKAS 7 Revised February November 2014 Hong Kong Accounting Standard 7 Statement of Cash Flows HKAS 7 COPYRIGHT Copyright 2014 Hong Kong Institute of Certified Public Accountants This Hong Kong Financial
ILLUSTRATIVE FINANCIAL STATEMENTS YEAR ENDED 31 DECEMBER 2013 International Financial Reporting Standards
 ILLUSTRATIVE FINANCIAL STATEMENTS YEAR ENDED 31 DECEMBER 2013 International Financial Reporting Standards 2 A Layout (International) Group Ltd Annual report and financial statements For the year ended
Growing with. our customers. Bâloise-Holding Financial Report 2006
 Growing with our customers Bâloise-Holding Financial Report 2006 Contents Consolidated annual financial statements of the Baloise Group Consolidated balance sheet 2 Consolidated income statement 4 Consolidated
Notes to Consolidated Financial Statements (forming part of the financial statements)
") Notes to Consolidated Financial Statements 85 1 Reporting entity DP World Limited ( the Company ) was incorporated on 9 August 2006 as a Company Limited by Shares with the Registrar of Companies of the
Notes to Consolidated Financial Statements 85 1 Reporting entity DP World Limited ( the Company ) was incorporated on 9 August 2006 as a Company Limited by Shares with the Registrar of Companies of the
NOTES TO THE FINANCIAL STATEMENTS
 NOTES TO THE FINANCIAL STATEMENTS 1: Significant Accounting Policies The financial statements of Australia and New Zealand Banking Group Limited (the Company) and its controlled entities (the Group) for
Notes to the Consolidated Financial Statements
 Deutsche Bank 2 Consolidated Financial Statements 289 Notes to the Consolidated Financial Statements 1 Significant Accounting Policies and Critical Accounting Estimates Notes to the Consolidated Financial
The Awa Bank, Ltd. Consolidated Financial Statements. The Awa Bank, Ltd. and its Consolidated Subsidiaries. Years ended March 31, 2011 and 2012
 The Awa Bank, Ltd. Consolidated Financial Statements Years ended March 31, 2011 and 2012 Consolidated Balance Sheets (Note 1) 2011 2012 2012 Assets Cash and due from banks (Notes 3 and 4) \ 230,831 \
NOTES TO THE FINANCIAL STATEMENTS For the financial year ended 31 March 2012
 For the financial year ended 31 March These notes form an integral part of and should be read in conjunction with the accompanying financial statements. 1. GENERAL The Company, Singapore Telecommunications
ČEZ, a. s. FINANCIAL STATEMENTS PREPARED IN ACCORDANCE WITH INTERNATIONAL FINANCIAL REPORTING STANDARDS AS OF DECEMBER 31, 2015
 ČEZ, a. s. FINANCIAL STATEMENTS PREPARED IN ACCORDANCE WITH INTERNATIONAL FINANCIAL REPORTING STANDARDS AS OF DECEMBER 31, 2015 PRELIMINARY UNAUDITED ACCOUNTS Prepared as of March 14, 2016 ČEZ, a. s. BALANCE
STATEMENT BY THE BOARD
 Financial Statements 1 FINANCIAL STATEMENTS STATEMENT BY THE BOARD In our opinion, (a) the accompanying consolidated financial statements of Info-communications Development Authority of Singapore (the
HKAS 12 Revised May November 2014. Hong Kong Accounting Standard 12. Income Taxes
 HKAS 12 Revised May November 2014 Hong Kong Accounting Standard 12 Income Taxes HKAS 12 COPYRIGHT Copyright 2014 Hong Kong Institute of Certified Public Accountants This Hong Kong Financial Reporting Standard
Fiat Group Consolidated Financial Statements
 Fiat Group 120 Income Statement 121 Statement of Comprehensive Income 122 Statement of Position 124 Statement of Cash Flows 125 Statement of Changes in Equity 126 Income Statement pursuant to Consob Resolution
1. Accounting policies for consolidated financial statements
 1 1. Accounting policies for consolidated financial statements Corporate information The Sanoma Group comprises three reporting segments: Media, News and Learning. The Media segment consists of four strategic
Historical cost is generally based on the fair value of the consideration given in exchange for goods and services.
 Overview business review sustainability and governance performance financials additional information 123 ANNUAL REPORT For the financial year ended 31 March These notes form an integral part of and should
IFrS. Disclosure checklist. July 2011. kpmg.com/ifrs
 IFrS Disclosure checklist July 2011 kpmg.com/ifrs Contents What s new? 1 1. General presentation 2 1.1 Presentation of financial statements 2 1.2 Changes in equity 12 1.3 Statement of cash flows 13 1.4
Notes to Consolidated Balance Sheet
 Notes to Consolidated Balance Sheet 1. Amounts less than one million yen have been omitted. 2. Standards for recognition and measurement of trading assets and liabilities are as follows: Recognition: Trading
Acerinox, S.A. and Subsidiaries. Consolidated Annual Accounts 31 December 2014. Consolidated Directors' Report 2014. (With Auditors Report Thereon)
") Acerinox, S.A. and Subsidiaries Consolidated Annual Accounts 31 December 2014 Consolidated Directors' Report 2014 (With Auditors Report Thereon) (Free translation from the original in Spanish. In the event
Acerinox, S.A. and Subsidiaries Consolidated Annual Accounts 31 December 2014 Consolidated Directors' Report 2014 (With Auditors Report Thereon) (Free translation from the original in Spanish. In the event
12.31.2014 CONSOLIDATED FINANCIAL STATEMENTS. (Unaudited figures)
") 12.31.2014 CONSOLIDATED FINANCIAL STATEMENTS (Unaudited figures) CONTENTS Consolidated financial statements Consolidated balance sheet 1 Consolidated income statement 3 Statement of net income and unrealised
12.31.2014 CONSOLIDATED FINANCIAL STATEMENTS (Unaudited figures) CONTENTS Consolidated financial statements Consolidated balance sheet 1 Consolidated income statement 3 Statement of net income and unrealised
AL FUJAIRAH NATIONAL INSURANCE COMPANY P.S.C. Independent auditor s report and financial statements for the year ended 31 December 2014
 AL FUJAIRAH NATIONAL INSURANCE COMPANY P.S.C. Independent auditor s report and financial statements for the year ended 31 December 2014 Al Fujairah National Insurance Company P.S.C. Content Pages Independent
IFRS. Disclosure checklist. August 2012. kpmg.com/ifrs
 IFRS Disclosure checklist August 2012 kpmg.com/ifrs Contents About this publication 1 What s new? 2 The Checklist 3 1. General presentation 3 1.1 Presentation of financial statements 3 1.2 Changes in equity
AGROLIGA GROUP PLC. REPORT AND CONSOLIDATED FINANCIAL STATEMENTS 31 December 2011
 REPORT AND CONSOLIDATED FINANCIAL STATEMENTS 31 December 2011 REPORT AND CONSOLIDATED FINANCIAL STATEMENTS 31 December 2011 CONTENTS PAGE Board of Directors and other Officers 1 Report of the Board of
KOREAN AIR LINES CO., LTD. AND SUBSIDIARIES. Consolidated Financial Statements
 Consolidated Financial Statements December 31, 2015 (With Independent Auditors Report Thereon) Contents Page Independent Auditors Report 1 Consolidated Statements of Financial Position 3 Consolidated Statements
International Accounting Standard 7 Statement of cash flows *
 International Accounting Standard 7 Statement of cash flows * Objective Information about the cash flows of an entity is useful in providing users of financial statements with a basis to assess the ability
Metropolitan Holdings Limited Group accounting policies used in preparation of the restated financial information under International Financial
 Metropolitan Holdings Limited Group accounting policies used in preparation of the restated financial information under International Financial Reporting Standards (IFRS) and the interim results for the
1. Parent company accounting policies
 Financial Statements Notes to the parent company financial statements 1. Parent company accounting policies Basis of preparation The separate financial statements of the Company are presented as required
Consolidated financial statements
 Rexam Annual Report 83 Consolidated financial statements Consolidated financial statements: Independent auditors report to the members of Rexam PLC 84 Consolidated income statement 87 Consolidated statement
Abbey plc ( Abbey or the Company ) Interim Statement for the six months ended 31 October 2007
 Interim Statement for the six months ended 31 October 2007") Abbey plc ( Abbey or the Company ) Interim Statement for the six months ended 31 October 2007 The Board of Abbey plc reports a profit before taxation of 18.20m which compares with a profit of 22.57m for
Abbey plc ( Abbey or the Company ) Interim Statement for the six months ended 31 October 2007 The Board of Abbey plc reports a profit before taxation of 18.20m which compares with a profit of 22.57m for
Summary of Certain Differences between SFRS and US GAAP
 Summary of Certain Differences between and SUMMARY OF CERTAIN DIFFERENCES BETWEEN AND The combined financial statements and the pro forma consolidated financial information of our Group included in this
Consolidated financial statements 2011
 Consolidated financial statements 2011 Page 1 4.2 Consolidated financial statements 4.2.1 Consolidated income statement ( million) 2011 2010 Sales of goods and services 41,192 37,654 Sales financing revenues