JVM Garbage Collector settings investigation
|
|
|
- Justin Ward
- 9 years ago
- Views:
Transcription
1 JVM Garbage Collector settings investigation Tigase, Inc.

2 1. Objective Investigate current JVM Garbage Collector settings, which results in high Heap usage, and propose new optimised ones. Following memory usage of the installation not being under heavy load was the reason to perform the investigation ( projects.tigase.org/issues/3248): (note: Tigase Monitor reports in Memory Usage section usage of the OldGen Heap region) It shows slow ramping up Heap usage and then performing FullGC. It would indicate premature promotion short-lived objects. Best possible usage pattern is relatively low number of stop-the-world collections with shortest time. 2. Investigation For the purpose of analysing and comparing JVM memory management performance following tools were used: internal JVM tooling for logging and debugging GC performance Tigase Monitor (observing load, checking OldGen heap region utilisation) VisualVM (with VisualGC add-on) GCViewer ( version build from sources as currently available release contains a bug when JVM was configured with particular set of flags - -XX:+PrintTenuringDistribution -XX:+PrintGCDetails -XX:+PrintGCDateStamps -XX: +PrintGCTimeStamps -Xloggc:logs/jvm.log -verbose:gc ) other tools were used for comparison as well (e.g.: gceasy.io) More detailed description of the utilised options are described in the Tigase Server - JVM settings sections sure.im installation (VM machines, regular traffic) All machines have relatively same traffic, it s configuration (Tigase wise) is exactly the same, JVM was configured with Xms=5G and Xmx=5G (both initial and maximum Heap was configured to 5G). Load on all the machines is relatively low (both packet-pre-second and number-of-connections wise). Tigase Monitor shows steady rising of percentage Memory Usage (which takes values only from OldGen region) when using CMS garbage collector with relatively default settings and then clearing memory once reaching roughly 80-99% occupancy of such region. G1 and Parallel collectors show more stable OldGen usage. Because Tigase Monitor displays only OldGen region metrics, actual Heap usage is different - especially when we consider only percentage. While looking at actual sizing we notice that depending on used GC the OldGen uses different amount of memory. Tigase, Inc. 1

3 G1GC (+UseG1GC -XX:ConcGCThreads=4 -XX:G1HeapRegionSize=2 -XX:InitiatingHeapOccupancyPercent=35 - XX:MaxGCPauseMillis=1000 -XX:MaxHeapSize= XX:ParallelGCThreads=4): CMS with default settings from etc/tigase.conf enabled (-XX:+UseBiasedLocking -XX:+UseConcMarkSweepGC -XX: +CMSIncrementalMode -XX:ParallelCMSThreads=2 -XX:-ReduceInitialCardMarks) Tigase, Inc. 2

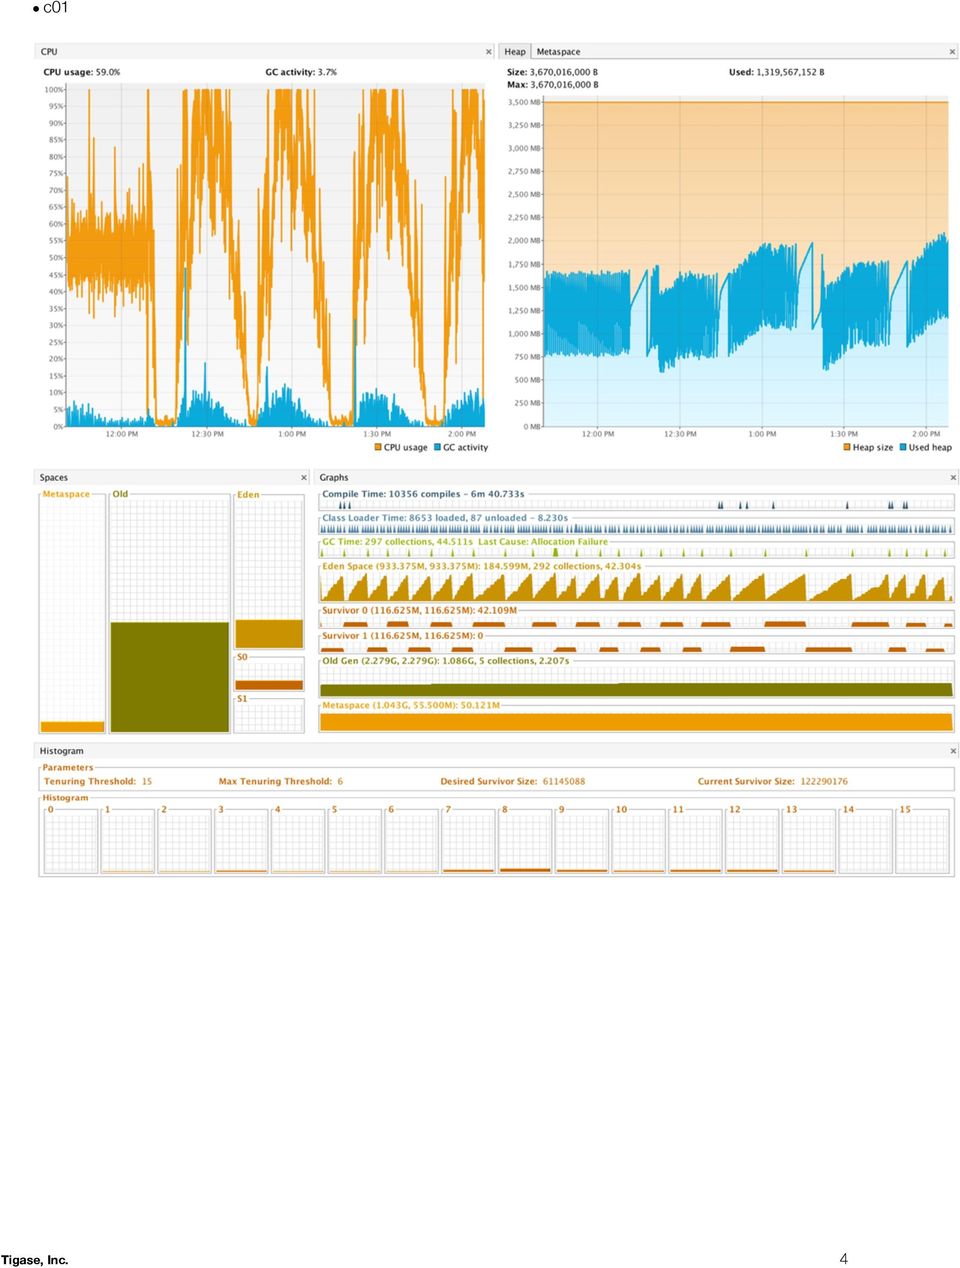
4 Default GC (Parallel) - without enabling any GC settings: 2.2. c0x installation I (VM machines, 2 core & 4GB, high load traffic) All machines had same Tigase and JVM heap size settings (Xms=Xmx=3,5G), used different GC settings: c01 - Default GC (Parallel collector for both Young and Old generations, i.e. -XX:+UseParallelGC -XX:+UseParallelOldGC) c02 - G1GC collector (runs collections both in Young and Old generations, i.e. -XX:+UseG1GC -XX:MaxGCPauseMillis=100 - XX:InitiatingHeapOccupancyPercent=35 -XX:G1HeapRegionSize=2 -XX:ParallelGCThreads=2 -XX:ConcGCThreads=2) c03 - Concurrent Mark and Sweep (CMS) enabled (applies to Tenured space only) with explicit configuration of NewRatio set to default value of 2 (i.e. -XX:+UseBiasedLocking -XX:+UseConcMarkSweepGC -XX:+UseParNewGC -XX:+CMSIncrementalMode - XX:CMSInitiatingOccupancyFraction=70 -XX:-ReduceInitialCardMarks -XX:NewRatio=2) c04 - Concurrent Mark and Sweep (CMS) enabled (applies to Tenured space only) with default Tigase settings (i.e. -XX: +UseParNewGC -XX:+UseConcMarkSweepGC) On the surface we can observe, that default default parallel collector causes very uneven usage of OldGen which would suggest lot of premature promotions; G1GC collector, in addition to uneven allocation also imposes higher CPU usage, which imposes processing time resulting in queues overflowing; CMS garbage collector offers more even use of OldGen space on average lower CPU usage. In general CMS poses as better solution. Looking into details of memory allocation and GC operation we can make a couple of observations: Tigase, Inc. 3

5 c01 Tigase, Inc. 4
6 c02 Tigase, Inc. 5

7 c03 Tigase, Inc. 6

8 c04 Completely ignoring internal operations of GC, the most and the longest pauses (total) were caused by G1GC collector (almost 7minutes), followed by CMS with default Tigase settings (5m11s), followed by CMS with enforced MaxNew size (1m9s) and the least and shortest pauses were inflicted by default Parallel collector, which would seems like the best choice. Tigase, Inc. 7

9 However, if we analyse the operations of the GC in each run, addition information will be revealed: c01 c02 c03 Tigase, Inc. 8

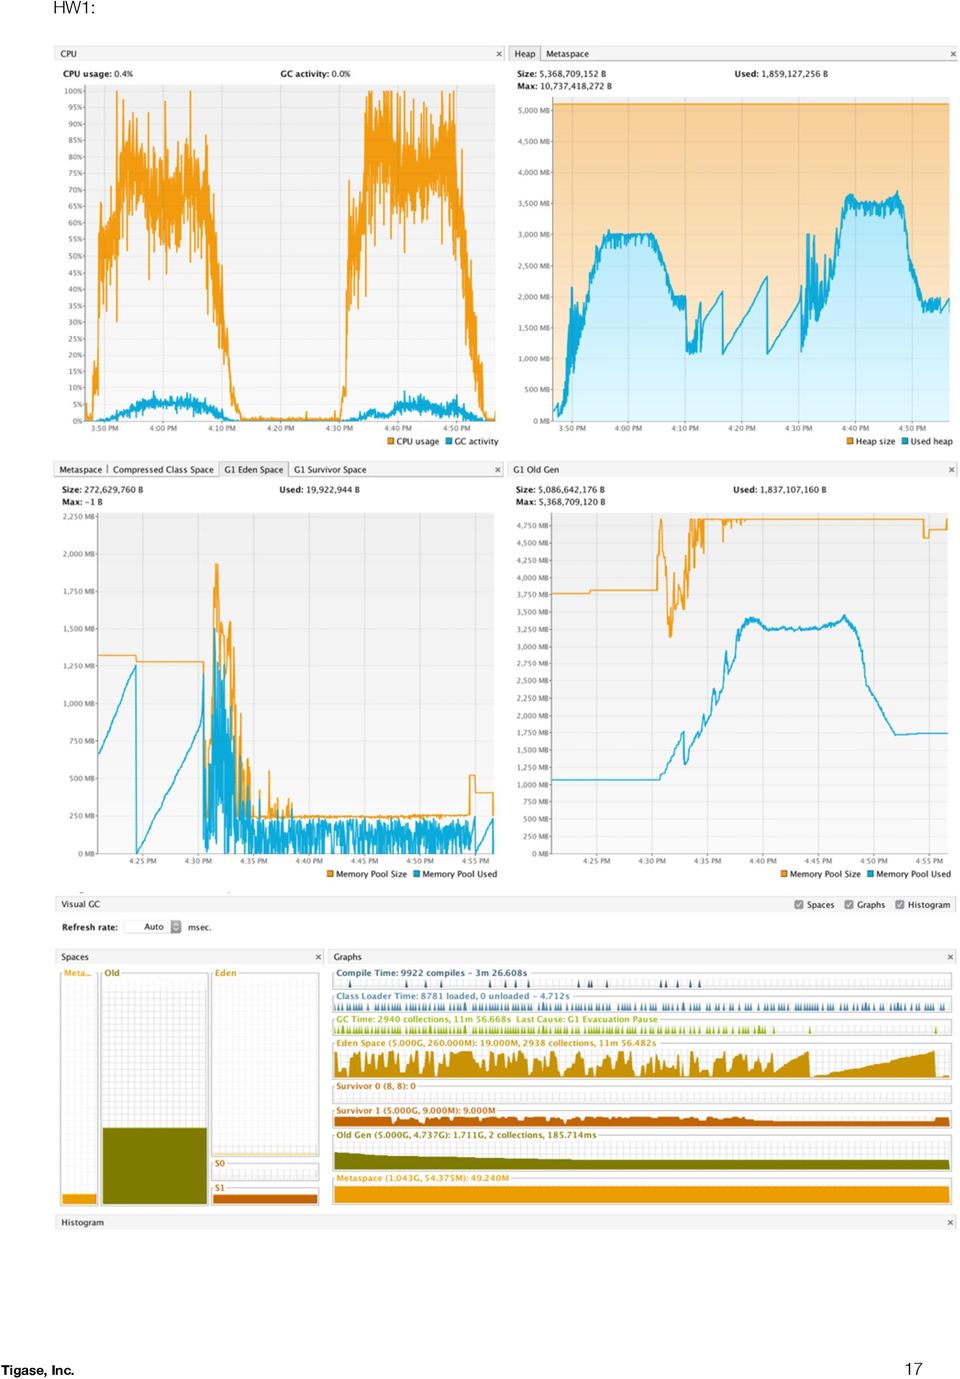
10 c04 Again G1GC offers lowest GC performance rate while making the most pauses taking the most time; default, parallel collector displays highest rate of cleared memory as well as least (count-wise) and shortest cumulative pause times (45s) however all of them were Stop-The-World (STW) which means that all application threads were stopped. Lastly CMS garbage collectors - looking at the above stats reveal huge impact of Young Generation sizing. With the default (c04), small size of Young Gen (which seems to change from JVM7 to JVM8) we can observe that total pauses took 3m20s and only 22s of those GC activities were not STW pauses (i.e. GC proceeded concurrently with application threads); additionally GC performance was relatively slow and only slightly better than G1GC. On the other hand enforcing ratio of Young Generation with NewSize property set to 2 resulted in decreasing GC pauses to 70s which while still higher than Parallel collector has the advantage, that only 22s of those pauses were STW pauses (which is roughly half the time Parallel collector stopped the application) hw1/hw2 installation (real hardware, Xeon W3530 4c/8t 2.8 Ghz, 48 GB RAM high load) All machines had same Tigase and JVM heap size settings (Xms=Xmx=5G), used different GC settings: A. Parallel GC (hw1) vs CMS with explicit YoungGeneration size (hw2) hw1 - Default GC (Parallel collector for both Young and Old generations, i.e. -XX:+UseParallelGC -XX:+UseParallelOldGC) hw2 - Concurrent Mark and Sweep (CMS) enabled (applies to Tenured space only) with explicit configuration of NewRatio set to default value of 2 (i.e. -XX:+UseBiasedLocking -XX:+UseConcMarkSweepGC -XX:+UseParNewGC -XX:+CMSIncrementalMode - XX:CMSInitiatingOccupancyFraction=70 -XX:-ReduceInitialCardMarks -XX:NewRatio=2) Tigase, Inc. 9
, small size of Young Gen (which seems to change from JVM7 to JVM8) we can observe that total pauses took 3m20s and only 22s of those GC activities were not STW pauses (i.e. GC proceeded concurrently with application threads); additionally GC performance was relatively slow and only slightly better than G1GC.")
11 HW1: Tigase, Inc. 10

12 HW2 Tigase, Inc. 11

13 GC statistics from HW1 (above) and HW2 (below) Comments: While allocation patterns are quite similar looking closer at GC statistics shows that CMS with YoungGeneration set to 1/3 of the Heap size while operating on real hardware (with more available threads) shows better performance than default Parallel GC - it needs less time (almost 15s less, 52s vs 66s) than Parallel collector and in addition, only roughly half of this time caused STW pauses. B. Parallel GC (hw1) vs CMS with explicit YoungGeneration size (hw2) hw1 - Concurrent Mark and Sweep (CMS) enabled (applies to Tenured space only) with default Tigase settings (i.e. -XX: +UseConcMarkSweepGC -XX:+UseParNewGC) hw2 - Concurrent Mark and Sweep (CMS) enabled (applies to Tenured space only) with explicit configuration of NewRatio set to default value of 2 (i.e. -XX:+CMSIncrementalMode -XX:CMSInitiatingOccupancyFraction=70 -XX:ConcGCThreads=3 - XX:NewRatio=2 -XX:ParallelGCThreads=8 -XX:+UseConcMarkSweepGC -XX:+UseParNewGC ) Tigase, Inc. 12
 vs CMS with explicit YoungGeneration size (hw2) hw1 - Concurrent Mark and Sweep (CMS) enabled (applies to Tenured space only) with default Tigase settings (i.e. -XX: +UseConcMarkSweepGC -XX:+UseParNewGC) hw2 - Concurrent Mark and Sweep (CMS) enabled (applies to Tenured space only) with explicit configuration of NewRatio set to default value of 2 (i.")
14 HW1: Tigase, Inc. 13

15 HW2: Tigase, Inc. 14

16 GC statistics from HW1 (above) and HW2 (below) Comments: On real HW and using CMS collector, JVM seems to allocate more heap space for Young Generation (ratio wise) comparing to VM, yet still lower than the defaults that javadoc suggests - enforcing NewRatio=2 causes pause time to drop by half from 110s to 55s, decreasing pauses count by more than half and in addition results in better overall GC Performance. Tigase, Inc. 15

17 C. G1GC vs CMS with explicit NewRatio hw1 - G1 garbage collector (i.e. -XX:ConcGCThreads=4 -XX:G1HeapRegionSize=2 -XX:InitiatingHeapOccupancyPercent=35 - XX:MaxGCPauseMillis=100 -XX:ParallelGCThreads=4 -XX:+UseG1GC) hw2 - Concurrent Mark and Sweep (CMS) enabled (applies to Tenured space only) with explicit configuration of NewRatio set to default value of 2 (i.e. -XX:+CMSIncrementalMode -XX:CMSInitiatingOccupancyFraction=70 -XX:ConcGCThreads=3 - XX:NewRatio=2 -XX:ParallelGCThreads=8 -XX:+UseConcMarkSweepGC -XX:+UseParNewGC) Tigase Monitor shows higher average CPU usage while using G1 collector (roughly 20 p.p. higher than CMS), which also imposes higher risk of queues overflowing. Tigase, Inc. 16

18 HW1: Tigase, Inc. 17
19 HW2: Tigase, Inc. 18

20 GC statistics from HW1 (above) and HW2 (below) Comments: In addition to observed in Monitor higher CPU utilisation we also can see that G1 activity is also higher under load (around 5%). Pause time wise G1 has almost 20 times higher pause time while offering almost 20 times lower GC performance resulting in lower throughput. 3. Concussions and recommendations Summarising all the above and adding a couple of pointers: Garbage Collection is the faster the more dead objects occupies given space, therefore on high-traffic installation it s better to have rather large YoungGen resulting in lower promotion of the objects to the OldGen; Using Heap size adjusted to the actual usage is better as the larger the heap the larger are spaces over which collection needs to be performed thus resulting in longer pauses; in case of huge heaps G1 collector may be better solution to avoid longer pauses; It was revealed that with JVM8 default sizing of Young / Old generation changed, even tho NewRatio is still defaulting to 2 : $ java -server -XX:+PrintFlagsFinal -version grep "NewRatio" intx NewRatio = 2 {product} Java(TM) SE Runtime Environment (build 1.7.0_25-b15) $ java -server -XX:+PrintFlagsFinal -version grep "OldSize" uintx OldSize = {product} Java(TM) SE Runtime Environment (build 1.7.0_25-b15) $ /usr/lib/jvm/jdk1.8.0_11/bin/java -server -XX:+PrintFlagsFinal -version grep "NewRatio" uintx NewRatio = 2 {product} Java(TM) SE Runtime Environment (build 1.8.0_11-b12) $ /usr/lib/jvm/jdk1.8.0_11/bin/java -server -XX:+PrintFlagsFinal -version grep "OldSize" uintx OldSize := {product} Java(TM) SE Runtime Environment (build 1.8.0_11-b12) Statistics API in Tigase were not optimised thus (especially retaining statistics history) increased promotion rate to Tenured space. Tigase, Inc. 19

2 2011 Oracle Corporation Proprietary and Confidential
 The following is intended to outline our general product direction. It is intended for information purposes only, and may not be incorporated into any contract. It is not a commitment to deliver any material,
JVM Performance Study Comparing Oracle HotSpot and Azul Zing Using Apache Cassandra
 JVM Performance Study Comparing Oracle HotSpot and Azul Zing Using Apache Cassandra January 2014 Legal Notices Apache Cassandra, Spark and Solr and their respective logos are trademarks or registered trademarks
JBoss Data Grid Performance Study Comparing Java HotSpot to Azul Zing
 JBoss Data Grid Performance Study Comparing Java HotSpot to Azul Zing January 2014 Legal Notices JBoss, Red Hat and their respective logos are trademarks or registered trademarks of Red Hat, Inc. Azul
Introduction to Spark and Garbage Collection
 Tuning Java Garbage Collection for Spark Applications May 28, 2015 by Daoyuan Wang and Jie Huang This is a guest post from our friends in the SSG STO Big Data Technology group at Intel. Join us at the
Java Performance Tuning
 Summer 08 Java Performance Tuning Michael Finocchiaro This white paper presents the basics of Java Performance Tuning for large Application Servers. h t t p : / / m f i n o c c h i a r o. w o r d p r e
Memory Management in the Java HotSpot Virtual Machine
 Memory Management in the Java HotSpot Virtual Machine Sun Microsystems April 2006 2 Table of Contents Table of Contents 1 Introduction.....................................................................
MID-TIER DEPLOYMENT KB
 MID-TIER DEPLOYMENT KB Author: BMC Software, Inc. Date: 23 Dec 2011 PAGE 1 OF 16 23/12/2011 Table of Contents 1. Overview 3 2. Sizing guidelines 3 3. Virtual Environment Notes 4 4. Physical Environment
Angelika Langer www.angelikalanger.com. The Art of Garbage Collection Tuning
 Angelika Langer www.angelikalanger.com The Art of Garbage Collection Tuning objective discuss garbage collection algorithms in Sun/Oracle's JVM give brief overview of GC tuning strategies GC tuning (2)
Java Garbage Collection Basics
 Java Garbage Collection Basics Overview Purpose This tutorial covers the basics of how Garbage Collection works with the Hotspot JVM. Once you have learned how the garbage collector functions, learn how
Garbage Collection in NonStop Server for Java
 Garbage Collection in NonStop Server for Java Technical white paper Table of contents 1. Introduction... 2 2. Garbage Collection Concepts... 2 3. Garbage Collection in NSJ... 3 4. NSJ Garbage Collection
Enabling Java in Latency Sensitive Environments
 Enabling Java in Latency Sensitive Environments Matt Schuetze, Product Manager, Azul Systems Utah JUG, Murray UT, November 20, 2014 High level agenda Intro, jitter vs. JITTER Java in a low latency application
Java Garbage Collection Characteristics and Tuning Guidelines for Apache Hadoop TeraSort Workload
 Java Garbage Collection Characteristics and Tuning Guidelines for Apache Hadoop TeraSort Workload Shrinivas Joshi, Software Performance Engineer Vasileios Liaskovitis, Performance Engineer 1. Introduction
Extreme Performance with Java
 Extreme Performance with Java QCon NYC - June 2012 Charlie Hunt Architect, Performance Engineering Salesforce.com sfdc_ppt_corp_template_01_01_2012.ppt In a Nutshell What you need to know about a modern
JBoss Cookbook: Secret Recipes. David Chia Senior TAM, JBoss May 5 th 2011
 JBoss Cookbook: Secret Recipes David Chia Senior TAM, JBoss May 5 th 2011 Secret Recipes Byteman Cluster and Load Balancing Configuration Generator Troubleshooting High CPU Mocking a JBoss Hang State Byte
The Fundamentals of Tuning OpenJDK
 The Fundamentals of Tuning OpenJDK OSCON 2013 Portland, OR Charlie Hunt Architect, Performance Engineering Salesforce.com sfdc_ppt_corp_template_01_01_2012.ppt In a Nutshell What you need to know about
WebSphere Performance Monitoring & Tuning For Webtop Version 5.3 on WebSphere 5.1.x
 Frequently Asked Questions WebSphere Performance Monitoring & Tuning For Webtop Version 5.3 on WebSphere 5.1.x FAQ Version 1.0 External FAQ1. Q. How do I monitor Webtop performance in WebSphere? 1 Enabling
Azul Pauseless Garbage Collection
 TECHNOLOGY WHITE PAPER Azul Pauseless Garbage Collection Providing continuous, pauseless operation for Java applications Executive Summary Conventional garbage collection approaches limit the scalability
Java Performance. Adrian Dozsa TM-JUG 18.09.2014
 Java Performance Adrian Dozsa TM-JUG 18.09.2014 Agenda Requirements Performance Testing Micro-benchmarks Concurrency GC Tools Why is performance important? We hate slow web pages/apps We hate timeouts
Java Troubleshooting and Performance
 Java Troubleshooting and Performance Margus Pala Java Fundamentals 08.12.2014 Agenda Debugger Thread dumps Memory dumps Crash dumps Tools/profilers Rules of (performance) optimization 1. Don't optimize
Performance Optimization For Operational Risk Management Application On Azure Platform
 Performance Optimization For Operational Risk Management Application On Azure Platform Ashutosh Sabde, TCS www.cmgindia.org 1 Contents Introduction Functional Requirements Non Functional Requirements Business
Tomcat Tuning. Mark Thomas April 2009
 Tomcat Tuning Mark Thomas April 2009 Who am I? Apache Tomcat committer Resolved 1,500+ Tomcat bugs Apache Tomcat PMC member Member of the Apache Software Foundation Member of the ASF security committee
Optimize GlassFish Performance in a Production Environment Performance White Paper February 2009. Abstract
 Optimize GlassFish Performance in a Production Environment Performance White Paper February 2009 Abstract Sun GlassFish Application Server v2 is a high performance application server. This white paper
Garbage Collection in the Java HotSpot Virtual Machine
 http://www.devx.com Printed from http://www.devx.com/java/article/21977/1954 Garbage Collection in the Java HotSpot Virtual Machine Gain a better understanding of how garbage collection in the Java HotSpot
Advanced Liferay Architecture: Clustering and High Availability
 Advanced Liferay Architecture: Clustering and High Availability Revision 1.1, Oct 2010 *Note: All of the configuration examples in 3 rd -party software (i.e. Apache, Sun Java) in this document are examples
Performance Tuning for Oracle WebCenter Content 11g: Strategies & Tactics CHRIS ROTHWELL & PAUL HEUPEL FISHBOWL SOLUTIONS, INC.
 Performance Tuning for Oracle WebCenter Content 11g: Strategies & Tactics CHRIS ROTHWELL & PAUL HEUPEL FISHBOWL SOLUTIONS, INC. i Fishbowl Solutions Notice The information contained in this document represents
Tuning WebSphere Application Server ND 7.0. Royal Cyber Inc.
 Tuning WebSphere Application Server ND 7.0 Royal Cyber Inc. JVM related problems Application server stops responding Server crash Hung process Out of memory condition Performance degradation Check if the
Using jvmstat and visualgc to Solve Memory Management Problems
 Using jvmstat and visualgc to Solve Memory Management Problems java.sun.com/javaone/sf 1 Wally Wedel Sun Software Services Brian Doherty Sun Microsystems, Inc. Analyze JVM Machine Memory Management Problems
JBoss Seam Performance and Scalability on Dell PowerEdge 1855 Blade Servers
 JBoss Seam Performance and Scalability on Dell PowerEdge 1855 Blade Servers Dave Jaffe, PhD, Dell Inc. Michael Yuan, PhD, JBoss / RedHat June 14th, 2006 JBoss Inc. 2006 About us Dave Jaffe Works for Dell
Implementing a Well- Performing and Reliable Portal
 Implementing a Well- Performing and Reliable Portal Adam Rybicki [email protected] Agenda I. Introduction II. Tools Needed III. Capacity Planning IV. Load Testing V. Automatic Failover VI. Performance
Practical Performance Understanding the Performance of Your Application
 Neil Masson IBM Java Service Technical Lead 25 th September 2012 Practical Performance Understanding the Performance of Your Application 1 WebSphere User Group: Practical Performance Understand the Performance
Enterprise Manager Performance Tips
 Enterprise Manager Performance Tips + The tips below are related to common situations customers experience when their Enterprise Manager(s) are not performing consistent with performance goals. If you
J2EE-JAVA SYSTEM MONITORING (Wily introscope)
") J2EE-JAVA SYSTEM MONITORING (Wily introscope) Purpose: To describe a procedure for java system monitoring through SAP certified third party tool Wily introscope. Scope: (Assumption) This procedure is applicable
J2EE-JAVA SYSTEM MONITORING (Wily introscope) Purpose: To describe a procedure for java system monitoring through SAP certified third party tool Wily introscope. Scope: (Assumption) This procedure is applicable
Web Performance, Inc. Testing Services Sample Performance Analysis
 Web Performance, Inc. Testing Services Sample Performance Analysis Overview This document contains two performance analysis reports created for actual web testing clients, and are a good example of the
Apache Tomcat Tuning for Production
 Apache Tomcat Tuning for Production Filip Hanik & Mark Thomas SpringSource September 2008 Copyright 2008 SpringSource. Copying, publishing or distributing without express written permission is prohibited.
USE IMPROVE EVANGELIZE. JVM Internals, 0.75. Stefan Parvu System Administrator. http://www.nbl.fi/stefan.parvu
 JVM Internals, 0.75 Stefan Parvu System Administrator http://www.nbl.fi/stefan.parvu License, copyrights COPYRIGHT: Copyright (c) 2008 Stefan Parvu The contents of this file are subject to the terms of
Monitoring and Managing a JVM
 Monitoring and Managing a JVM Erik Brakkee & Peter van den Berkmortel Overview About Axxerion Challenges and example Troubleshooting Memory management Tooling Best practices Conclusion About Axxerion Axxerion
Performance Monitoring and Tuning. Liferay Chicago User Group (LCHIUG) James Lefeu 29AUG2013
 James Lefeu 29AUG2013") Performance Monitoring and Tuning Liferay Chicago User Group (LCHIUG) James Lefeu 29AUG2013 Outline I. Definitions II. Architecture III.Requirements and Design IV.JDK Tuning V. Liferay Tuning VI.Profiling
Performance Monitoring and Tuning Liferay Chicago User Group (LCHIUG) James Lefeu 29AUG2013 Outline I. Definitions II. Architecture III.Requirements and Design IV.JDK Tuning V. Liferay Tuning VI.Profiling
Blackboard Learn TM, Release 9 Technology Architecture. John Fontaine
 Blackboard Learn TM, Release 9 Technology Architecture John Fontaine Overview Background Blackboard Learn Deployment Model and Architecture Setup and Installation Common Administrative Tasks Tuning Integrating
HeapStats: Your Dependable Helper for Java Applications, from Development to Operation
 : Technologies for Promoting Use of Open Source Software that Contribute to Reducing TCO of IT Platform HeapStats: Your Dependable Helper for Java Applications, from Development to Operation Shinji Takao,
University of Southern California Shibboleth High Availability with Terracotta
 University of Southern California Shibboleth High Availability with Terracotta Overview Intro to HA architecture with Terracotta Benefits Drawbacks Shibboleth and Terracotta at USC Monitoring Issues Resolved
AgencyPortal v5.1 Performance Test Summary Table of Contents
 AgencyPortal v5.1 Performance Test Summary Table of Contents 1. Testing Approach 2 2. Server Profiles 3 3. Software Profiles 3 4. Server Benchmark Summary 4 4.1 Account Template 4 4.1.1 Response Time 4
An Oracle White Paper March 2013. Load Testing Best Practices for Oracle E- Business Suite using Oracle Application Testing Suite
 An Oracle White Paper March 2013 Load Testing Best Practices for Oracle E- Business Suite using Oracle Application Testing Suite Executive Overview... 1 Introduction... 1 Oracle Load Testing Setup... 2
Agenda. Tomcat Versions Troubleshooting management Tomcat Connectors HTTP Protocal and Performance Log Tuning JVM Tuning Load balancing Tomcat
 Agenda Tomcat Versions Troubleshooting management Tomcat Connectors HTTP Protocal and Performance Log Tuning JVM Tuning Load balancing Tomcat Tomcat Performance Tuning Tomcat Versions Application/System
11.1 inspectit. 11.1. inspectit
 11.1. inspectit Figure 11.1. Overview on the inspectit components [Siegl and Bouillet 2011] 11.1 inspectit The inspectit monitoring tool (website: http://www.inspectit.eu/) has been developed by NovaTec.
Java Garbage Collection Best Practices for Sizing and Tuning the Java Heap
 IBM Software Group Java Garbage Collection Best Practices for Sizing and Tuning the Java Heap Chris Bailey WebSphere Support Technical Exchange Objectives Overview Selecting the Correct GC Policy Sizing
High-Availability. Configurations for Liferay Portal. James Min. Senior Consultant / Sales Engineer, Liferay, Inc.
 High-Availability Configurations for Liferay Portal James Min Senior Consultant / Sales Engineer, Liferay, Inc. Is Clustering Enough? What Liferay High-Availability (HA) means: HA is more than just server
Agility Database Scalability Testing
 Agility Database Scalability Testing V1.6 November 11, 2012 Prepared by on behalf of Table of Contents 1 Introduction... 4 1.1 Brief... 4 2 Scope... 5 3 Test Approach... 6 4 Test environment setup... 7
Performance Management for Cloudbased STC 2012
 Performance Management for Cloudbased Applications STC 2012 1 Agenda Context Problem Statement Cloud Architecture Need for Performance in Cloud Performance Challenges in Cloud Generic IaaS / PaaS / SaaS
How To Use Java On An Ipa 2.2.2 (Jspa) With A Microsoft Powerbook (Jempa) With An Ipad 2.3.2 And A Microos 2.5 (Microos)
 With A Microsoft Powerbook (Jempa) With An Ipad 2.3.2 And A Microos 2.5 (Microos)") Java Monitoring and Diagnostic Tooling Iris Baron IBM Java JIT on System Z [email protected] Session ID: 16182 Insert Custom Session QR if Desired. Java Road Map Java 7.0 Language Updates Java 6.0 SE 5.0
Java Monitoring and Diagnostic Tooling Iris Baron IBM Java JIT on System Z [email protected] Session ID: 16182 Insert Custom Session QR if Desired. Java Road Map Java 7.0 Language Updates Java 6.0 SE 5.0
WAS Performance on i5/os. Lisa Wellman [email protected] May 2010
 WAS Performance on i5/os Lisa Wellman [email protected] May 2010 A simplified view: major WAS functions widely used Administered Java runtime environment HTTP request routing Web container Web thread pool
Monitoring HP OO 10. Overview. Available Tools. HP OO Community Guides
 HP OO Community Guides Monitoring HP OO 10 This document describes the specifications of components we want to monitor, and the means to monitor them, in order to achieve effective monitoring of HP Operations
Liferay Performance Tuning
 Liferay Performance Tuning Tips, tricks, and best practices Michael C. Han Liferay, INC A Survey Why? Considering using Liferay, curious about performance. Currently implementing and thinking ahead. Running
System Requirements Table of contents
 Table of contents 1 Introduction... 2 2 Knoa Agent... 2 2.1 System Requirements...2 2.2 Environment Requirements...4 3 Knoa Server Architecture...4 3.1 Knoa Server Components... 4 3.2 Server Hardware Setup...5
Berlin Mainframe Summit. Java on z/os. 2006 IBM Corporation
 Java on z/os Martina Schmidt Agenda Berlin Mainframe Summit About the mainframe Java runtime environments under z/os For which applications should I use a mainframe? Java on z/os cost and performance Java
Adobe LiveCycle Data Services 3 Performance Brief
 Adobe LiveCycle ES2 Technical Guide Adobe LiveCycle Data Services 3 Performance Brief LiveCycle Data Services 3 is a scalable, high performance, J2EE based server designed to help Java enterprise developers
Enabling Java in Latency Sensitive Environments
 Enabling Java in Latency Sensitive Environments 1 Matt Schuetze Azul Director of Product Management Matt Schuetze, Product Manager, Azul Systems Utah JUG, Murray UT, November 20, 2014 Austin Java Users
Zing Vision. Answering your toughest production Java performance questions
 Zing Vision Answering your toughest production Java performance questions Outline What is Zing Vision? Where does Zing Vision fit in your Java environment? Key features How it works Using ZVRobot Q & A
A Performance Analysis of Distributed Indexing using Terrier
 A Performance Analysis of Distributed Indexing using Terrier Amaury Couste Jakub Kozłowski William Martin Indexing Indexing Used by search
Understanding Java Garbage Collection
 TECHNOLOGY WHITE PAPER Understanding Java Garbage Collection And What You Can Do About It Table of Contents Executive Summary... 3 Introduction.... 4 Why Care About the Java Garbage Collector?.... 5 Classifying
XTM Web 2.0 Enterprise Architecture Hardware Implementation Guidelines. A.Zydroń 18 April 2009. Page 1 of 12
 XTM Web 2.0 Enterprise Architecture Hardware Implementation Guidelines A.Zydroń 18 April 2009 Page 1 of 12 1. Introduction...3 2. XTM Database...4 3. JVM and Tomcat considerations...5 4. XTM Engine...5
Advanced Performance Forensics
 Advanced Performance Forensics Uncovering the Mysteries of Performance and Scalability Incidents through Forensic Engineering Stephen Feldman Senior Director Performance Engineering and Architecture [email protected]
Delivering Quality in Software Performance and Scalability Testing
 Delivering Quality in Software Performance and Scalability Testing Abstract Khun Ban, Robert Scott, Kingsum Chow, and Huijun Yan Software and Services Group, Intel Corporation {khun.ban, robert.l.scott,
An Oracle White Paper September 2013. Advanced Java Diagnostics and Monitoring Without Performance Overhead
 An Oracle White Paper September 2013 Advanced Java Diagnostics and Monitoring Without Performance Overhead Introduction... 1 Non-Intrusive Profiling and Diagnostics... 2 JMX Console... 2 Java Flight Recorder...
Configuring Apache Derby for Performance and Durability Olav Sandstå
 Configuring Apache Derby for Performance and Durability Olav Sandstå Database Technology Group Sun Microsystems Trondheim, Norway Overview Background > Transactions, Failure Classes, Derby Architecture
Hardware Recommendations
 Hardware Recommendations Alpha Anywhere is a Windows based system that will run on various Windows versions. The minimum requirement is Windows XP SP3 or Server 2003. However, it is recommended that at
General Introduction
 Managed Runtime Technology: General Introduction Xiao-Feng Li ([email protected]) 2012-10-10 Agenda Virtual machines Managed runtime systems EE and MM (JIT and GC) Summary 10/10/2012 Managed Runtime
Oracle WebLogic Server 11g Administration
 Oracle WebLogic Server 11g Administration This course is designed to provide instruction and hands-on practice in installing and configuring Oracle WebLogic Server 11g. These tasks include starting and
CSCI E 98: Managed Environments for the Execution of Programs
 CSCI E 98: Managed Environments for the Execution of Programs Draft Syllabus Instructor Phil McGachey, PhD Class Time: Mondays beginning Sept. 8, 5:30-7:30 pm Location: 1 Story Street, Room 304. Office
Resource Aware Scheduler for Storm. Software Design Document. <[email protected]> Date: 09/18/2015
 Resource Aware Scheduler for Storm Software Design Document Author: Boyang Jerry Peng Date: 09/18/2015 Table of Contents 1. INTRODUCTION 3 1.1. USING
TDA - Thread Dump Analyzer
 TDA - Thread Dump Analyzer TDA - Thread Dump Analyzer Published September, 2008 Copyright 2006-2008 Ingo Rockel Table of Contents 1.... 1 1.1. Request Thread Dumps... 2 1.2. Thread
Jonathan Worthington Scarborough Linux User Group
 Jonathan Worthington Scarborough Linux User Group Introduction What does a Virtual Machine do? Hides away the details of the hardware platform and operating system. Defines a common set of instructions.
CHAPTER 1 - JAVA EE OVERVIEW FOR ADMINISTRATORS
 CHAPTER 1 - JAVA EE OVERVIEW FOR ADMINISTRATORS Java EE Components Java EE Vendor Specifications Containers Java EE Blueprint Services JDBC Data Sources Java Naming and Directory Interface Java Message
How To Monitor A Server With Zabbix
 & JavaEE Platform Monitoring A Good Match? Company Facts Jesta Digital is a leading global provider of next generation entertainment content and services for the digital consumer. subsidiary of Jesta Group,
SmartFoxServer 2X Performance And Scalability White Paper
 SmartFoxServer 2X Performance And Scalability White Paper March 2012 Author Marco Lapi The gotoandplay() Team Introduction Performance and scalability are among the most common topics that customers want
What s Cool in the SAP JVM (CON3243)
") What s Cool in the SAP JVM (CON3243) Volker Simonis, SAP SE September, 2014 Public Agenda SAP JVM Supportability SAP JVM Profiler SAP JVM Debugger 2014 SAP SE. All rights reserved. Public 2 SAP JVM SAP
What s Cool in the SAP JVM (CON3243) Volker Simonis, SAP SE September, 2014 Public Agenda SAP JVM Supportability SAP JVM Profiler SAP JVM Debugger 2014 SAP SE. All rights reserved. Public 2 SAP JVM SAP
MEASURING WORKLOAD PERFORMANCE IS THE INFRASTRUCTURE A PROBLEM?
 MEASURING WORKLOAD PERFORMANCE IS THE INFRASTRUCTURE A PROBLEM? Ashutosh Shinde Performance Architect [email protected] Validating if the workload generated by the load generating tools is applied
Java and Real Time Storage Applications
 Java and Real Time Storage Applications Gary Mueller Janet Borzuchowski 1 Flavors of Java for Embedded Systems Software Java Virtual Machine(JVM) Compiled Java Hardware Java Virtual Machine Java Virtual
Development of Monitoring and Analysis Tools for the Huawei Cloud Storage
 Development of Monitoring and Analysis Tools for the Huawei Cloud Storage September 2014 Author: Veronia Bahaa Supervisors: Maria Arsuaga-Rios Seppo S. Heikkila CERN openlab Summer Student Report 2014
Using VMware VMotion with Oracle Database and EMC CLARiiON Storage Systems
 Using VMware VMotion with Oracle Database and EMC CLARiiON Storage Systems Applied Technology Abstract By migrating VMware virtual machines from one physical environment to another, VMware VMotion can
THE BUSY DEVELOPER'S GUIDE TO JVM TROUBLESHOOTING
 THE BUSY DEVELOPER'S GUIDE TO JVM TROUBLESHOOTING November 5, 2010 Rohit Kelapure HTTP://WWW.LINKEDIN.COM/IN/ROHITKELAPURE HTTP://TWITTER.COM/RKELA Agenda 2 Application Server component overview Support
IBM WebSphere Portal 7.0 Performance Tuning Guide
 IBM WebSphere Portal software family Your world. Your way. IBM WebSphere Portal 7.0 Performance Tuning Guide IBM Collaboration Solutions Performance Team December 2010 Document version 1 Contents PERFORMANCE
Troubleshoot the JVM like never before. JVM Troubleshooting Guide. Pierre-Hugues Charbonneau Ilias Tsagklis
 Troubleshoot the JVM like never before JVM Troubleshooting Guide Pierre-Hugues Charbonneau Ilias Tsagklis Table of Contents Oracle HotSpot JVM Memory...3 Java HotSpot VM Heap space...3 Java HotSpot VM
PARALLELS CLOUD SERVER
 PARALLELS CLOUD SERVER Performance and Scalability 1 Table of Contents Executive Summary... Error! Bookmark not defined. LAMP Stack Performance Evaluation... Error! Bookmark not defined. Background...
Validating Java for Safety-Critical Applications
 Validating Java for Safety-Critical Applications Jean-Marie Dautelle * Raytheon Company, Marlborough, MA, 01752 With the real-time extensions, Java can now be used for safety critical systems. It is therefore
Benchmark Testing Results: OpenText Email Monitoring and Records Management Running on SQL Server 2012
 Benchmark Testing Results: OpenText Email Monitoring and Records Management Running on SQL Server 2012 Running OpenText Email Monitoring and Records Management on Microsoft SQL Server 2012 provides excellent
A Comparison of Oracle Performance on Physical and VMware Servers
 A Comparison of Oracle Performance on Physical and VMware Servers By Confio Software Confio Software 4772 Walnut Street, Suite 100 Boulder, CO 80301 303-938-8282 www.confio.com Comparison of Physical and
Tool - 1: Health Center
 Tool - 1: Health Center Joseph Amrith Raj http://facebook.com/webspherelibrary 2 Tool - 1: Health Center Table of Contents WebSphere Application Server Troubleshooting... Error! Bookmark not defined. About
Robert Honeyman http://www.honeymanit.co.uk [email protected]
 An Introduction to WebLogic Administration Robert Honeyman http://www.honeymanit.co.uk [email protected] WEBLOGIC 11G : WHAT IS IT? Weblogic 10.3.3-10.3.6 = 11g Java EE 5 compliant Application
Oracle WebLogic Thread Pool Tuning
 Oracle WebLogic Thread Pool Tuning AN ACTIVE ENDPOINTS TECHNICAL NOTE 2010 Active Endpoints Inc. ActiveVOS is a trademark of Active Endpoints, Inc. All other company and product names are the property
Multi-core Programming System Overview
 Multi-core Programming System Overview Based on slides from Intel Software College and Multi-Core Programming increasing performance through software multi-threading by Shameem Akhter and Jason Roberts,
WEBAPP PATTERN FOR APACHE TOMCAT - USER GUIDE
 WEBAPP PATTERN FOR APACHE TOMCAT - USER GUIDE Contents 1. Pattern Overview... 3 Features 3 Getting started with the Web Application Pattern... 3 Accepting the Web Application Pattern license agreement...
Performance Analysis of Web based Applications on Single and Multi Core Servers
 Performance Analysis of Web based Applications on Single and Multi Core Servers Gitika Khare, Diptikant Pathy, Alpana Rajan, Alok Jain, Anil Rawat Raja Ramanna Centre for Advanced Technology Department
Mobile Cloud Computing for Data-Intensive Applications
 Mobile Cloud Computing for Data-Intensive Applications Senior Thesis Final Report Vincent Teo, [email protected] Advisor: Professor Priya Narasimhan, [email protected] Abstract The computational and storage
Deployment Checklist. Liferay Portal 6.1 Enterprise Edition
 Deployment Checklist Liferay Portal 6.1 Enterprise Edition Table of Contents Deployment Checklist...1 Introduction... 1 Reference Architecture... 1 Virtualized and Cloud Deployments... 3 Security... 3
An Oracle White Paper July 2011. Oracle Primavera Contract Management, Business Intelligence Publisher Edition-Sizing Guide
 Oracle Primavera Contract Management, Business Intelligence Publisher Edition-Sizing Guide An Oracle White Paper July 2011 1 Disclaimer The following is intended to outline our general product direction.