Tracking down discretionary income
|
|
|
- Daisy Paul
- 9 years ago
- Views:
Transcription
1 Spring 1991 (Vol. 3, No. 1) Article No. 3 Tracking down discretionary income Donna J. Owens "Discretionary income", "unencumbered funds", "fun money", or "spare cash": call it whatever you like, no one ever thinks that they can have enough of it. Even economists are dissatisfied with the term "discretionary income". But theirs is a conceptual concern: what is discretionary income and how can it be measured? Nevertheless, it is important to know the amount of discretionary income available in the economy, because discretionary income statistics: show how personal income taxes and average household expenditures affect the amount of money that Canadians are free to spend or save; can successfully target a desirable group of consumers in a competitive marketplace; measure how rapidly "extra cash" is growing for Canadians who are well off. This article proposes a method for identifying people with "discretionary income". It then describes some of their characteristics-who they are, how much money they have and how they spend it. What is discretionary income? Discretionary income is not synonymous with disposable income. Disposable income is usually defined as the amount of income remaining after payment of personal income taxes, while discretionary income is usually defined as total income less personal income taxes, Unemployment Insurance premiums and other compulsory payments, and household spending on "necessities". What remains is "discretionary income" which can be spent or saved as one pleases on vintage wines, stocks and bonds, vacations. This kind of calculation would be simple enough in a world inhabited by theorists. In fact, discretionary income is a highly subjective concept and is difficult to define because what some consider a necessity is a luxury for others. For example, a car may be a necessity for a mother with young children living in the suburbs, but a luxury for a single woman living and working downtown. Therefore, "any definition of discretionary income in precise statistical terms will be arbitrary". (1) file:///n /LHSBR/LHSAD/PERSPECT/Pe9113.htm (1 of 12) [6/1/01 10:02:41 AM]

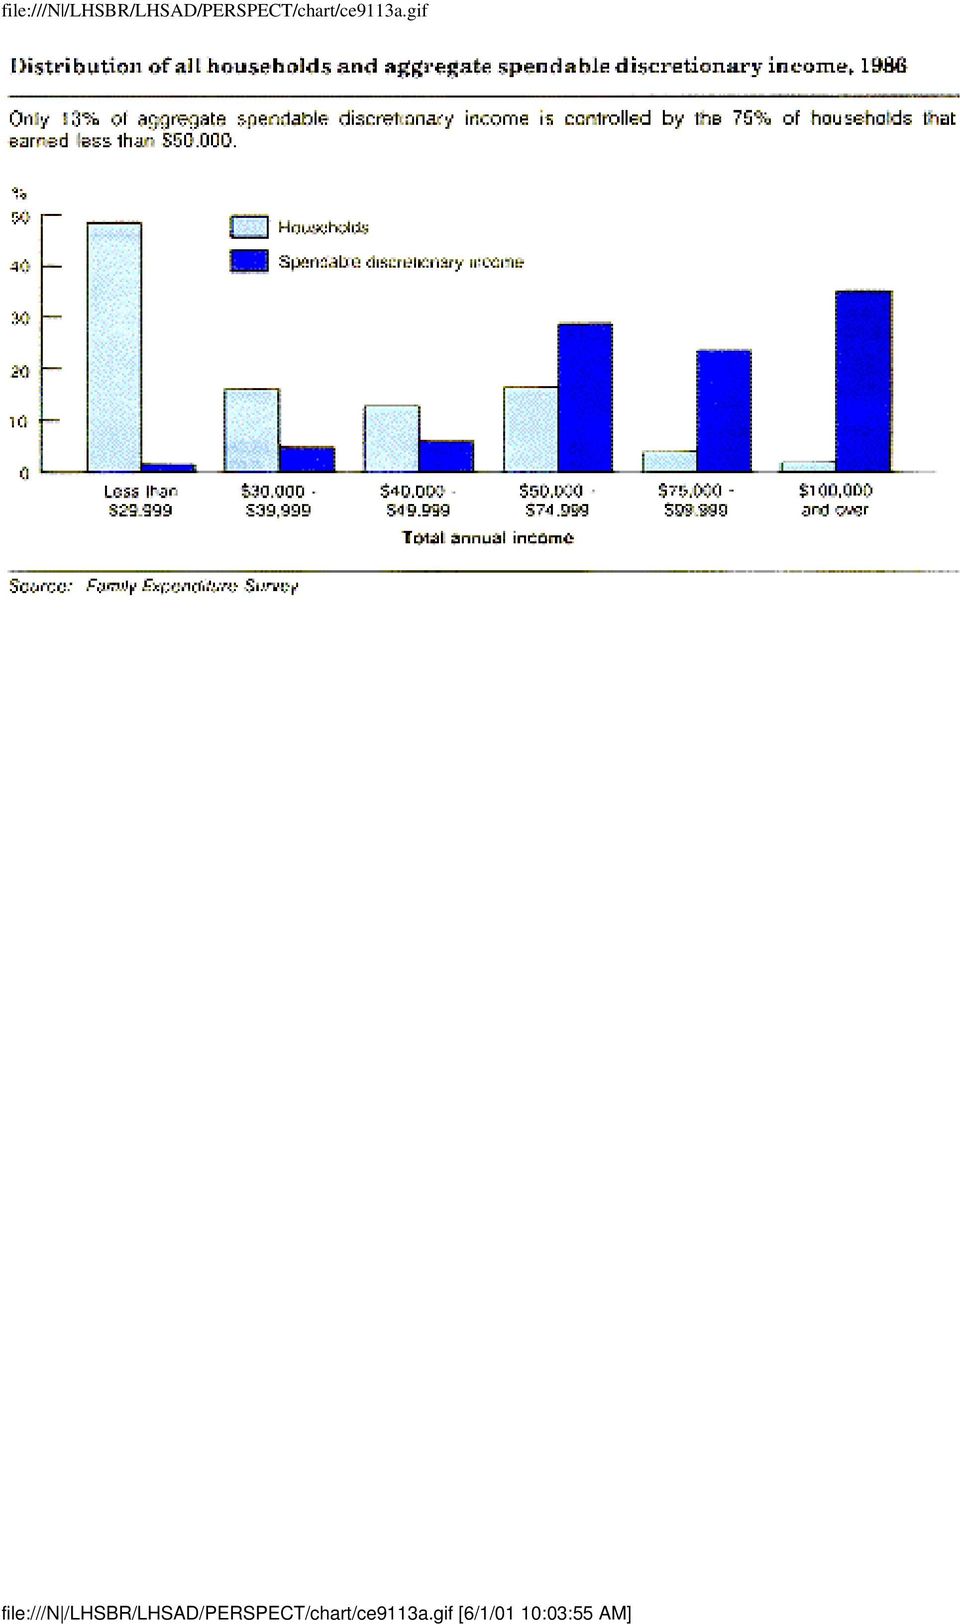
2 Little analytical work has been done on discretionary income (DI) but one of the few attempts in recent years was made in a joint study by the U.S. Consumer Research Centre, The (U.S.) Conference Board and the U.S. Bureau of the Census. The study avoided defining "necessities" and instead used an income threshold as a measure. It defined DI as "the amount of money which would permit a family to maintain a living standard comfortably higher than the average for similar families". (2) To set the threshold, the researchers used a U.S. Department of Labor survey which had concluded that to allow for a relatively comfortable standard of living, a household's budget had to be about 30% higher than the average consumption expenditure for similar households. This study adopts the U.S. definition that a household has discretionary income if its after-tax income is at least 30% higher than the average family expenditures on goods and services for that type of household. (Disposable income and after-tax income are synonymous; this study will use the term aftertax income.) For an explanation of the limitations imposed by the DI measurement, see Technical notes. What can be spent: Aggregate spendable discretionary income In 1986, the total amount of spendable discretionary income (SDI) available in the economy was estimated to be $28.9 billion. This total was available to one-quarter of the households in Canada. With pre-tax incomes averaging more than $63,000, these 2.1 million families each enjoyed an average of just over $13,500 "extra cash". (Table 1 includes the figures for the population that would have had DI based on income cut-offs of 20%, 30% and 40%. This demonstrates how the choice of cut-off can change our perception of the issue. For the remainder of this study, the cut-off is 30%.) Table 1 Summary income statistics, 1986 Source: Family Expenditure Survey Who had money to spend: Profile of the DI household For the most part, DI families have much higher incomes than the average for all households. This is especially true as household size and attendant expenditures rise: the DIL threshold moves beyond the reach of the average household. But discretionary income is not necessarily linked to income that is high compared with the Canadian average. For example, in 1986, almost 40% of all households had total file:///n /LHSBR/LHSAD/PERSPECT/Pe9113.htm (2 of 12) [6/1/01 10:02:41 AM]
 To set the threshold, the researchers used a U.S.")
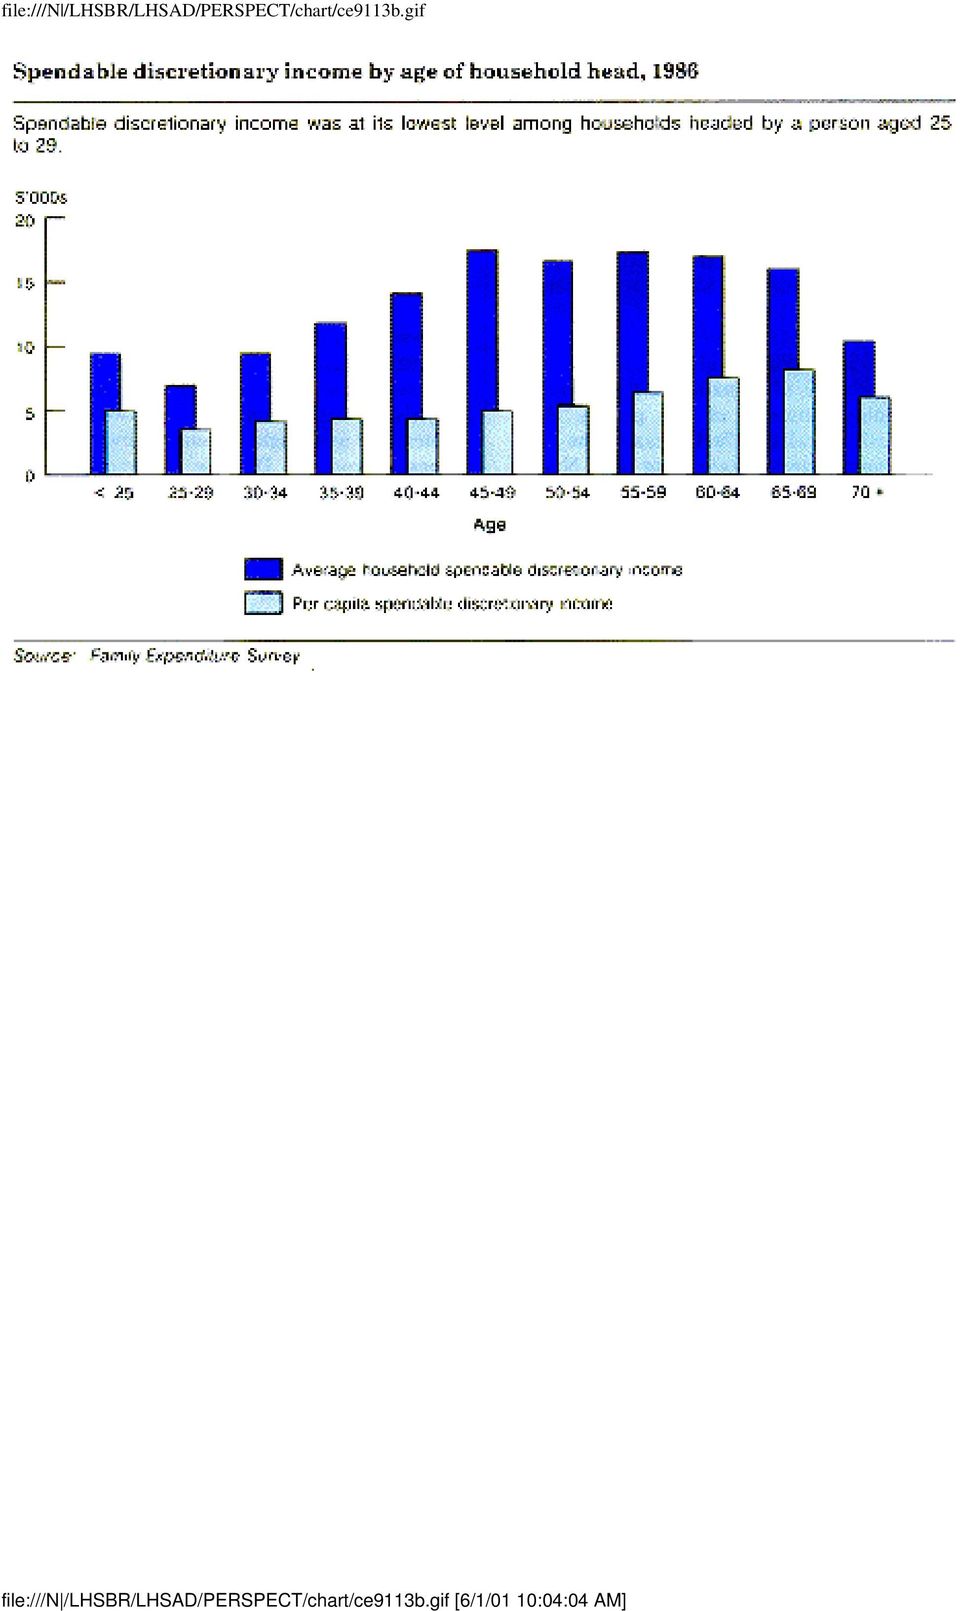
3 annual incomes of less than $25,000, yet 2.4% of them had discretionary income. This arises from the methodology used to select households with DI. Impact of household life cycle Canadians families headed by a person aged 25 to 29 had the lowest average household SDI. The SDI per household then rose steadily and peaked at $17,472 among those aged 45 to 49, where it remained fairly stable until the head of the household reached retirement age. Per capita SDI was also low among households headed by young adults (aged 25 to 29), but contrary to the pattern shown by household SDI, it did not rise as quickly. In fact, it did not peak until the household head was over 49, a stage of the family life cycle when income remains high but household size begins to shrink. Families and individuals Just over 27% of Canada's 2.1 million DI households consisted of two people. With one-third of available "extra cash", they had the largest share of aggregate SDI. Nevertheless, married couples with children had slightly more household SDI than did couples without children, perhaps reflecting that the childless couples were younger and therefore had less income. Approximately 24% of the one-person households in Canada had discretionary income. They controlled the smallest percentage (14%) of aggregate spendable discretionary income, but with almost $8,300, they had the highest per capita SDI. And men had more SDI than women: in 1986, women comprised 60% of the single population but possessed only 40% of SDI. On average, men had $9,047 in SDI, about 24% more than women. Chart A Distribution of all households and aggregate spendable discretionary income, Source: Family Expenditure Survey Chart B Spendable discretionary income by age of household head, file:///n /LHSBR/LHSAD/PERSPECT/Pe9113.htm (3 of 12) [6/1/01 10:02:41 AM]
, but contrary to the pattern shown by household SDI, it did not rise as quickly.")
4 Source: Family Expenditure Survey Chart C Income and spendable discretionary income by size of household with discretionary income, Source: Family Expenditure Survey Dollars and degrees A 1986 Statistics Canada study of high-income families concluded that a strong positive relationship exists between high education and high income. (3) Since higher income produces DI, the evidence should show that the same relationship holds for education and DI. Indeed, approximately 52% of families headed by people with university degrees had SDI. Furthermore, average SDI in DI households headed by university graduates was almost $20,400, double that of DI households headed by people who had not completed high school. Types of jobs Of the 2.1 million households with DI, almost half were headed by a person employed as a professional or manager, a reflection in large part of the relationship between education and DI. They controlled 53% of aggregate SDI and each of them averaged $16,342 in household SDI. But at $6,414, per capita SDI was highest among those who were "not working/retired". It may seem unexpected that these nonworkers had more DI than the "blue collar" workers, despite "blue collar" DI households having higher before-tax income. This reflects the larger average size of blue-collar households (close to four people), putting them into a group with a higher DIL threshold than the two-person group to which most "not working/retired" households belonged. Where the money came from Two-thirds of all DI households reported wages and salaries as their major source of income. Although only 1 in 20 Canadian households gained the majority of their income from self-employment in unincorporated businesses, the highest incidence of DI 35% occurred in this small group. At just over $76,500, the average before-tax income of self-employed households with DI ran $14,000 higher than that of investment earners with DI; but the SDI of each group was identical at $21,275 per household. The similarity in SDI despite the dissimilarity in income arises because most investment earners belong to small households, while the self-employed earners are maintaining larger households. file:///n /LHSBR/LHSAD/PERSPECT/Pe9113.htm (4 of 12) [6/1/01 10:02:41 AM]

5 Number of cash contributors With 37% of DI households being families in which both spouses worked, it is not surprising that this group controlled 55% of aggregate SDI. However, the average amount of household SDI for those families where only the husband earned a paycheque was over 40% more than for those units where both the husband and wife were employed. Similar results were reported in the U.S. study: its authors noted that this apparent anomaly "is explained by the fact that in the exceptionally high income class, comparatively few wives are employed". (4) The "no workers" households, although a relatively small portion of the DI population (less than 6%), had the second highest average SDI and the highest per capita SDI. This group had a large amount of extra cash because most "no workers" belonged to the one- or two-person household groups, whose DIL thresholds are comparatively low. "No workers" received the bulk of their incomes from investments and pensions. Table 2 Discretionary income: A profile, 1986 Source: Family Expenditure Survey Region of residence important Not surprisingly, residents of Ontario with 36% of Canadian households controlled almost half of Canada's aggregate SDI. The province also recorded the highest average before-tax income for DI households ($66,574), and the top household SDI, at $15,119. However, Alberta families were the most likely to be "in the money": that province claimed the highest incidence of SDI, with 32% of households above the DI threshold. Not just the province, but the population density of an area also affected the distribution of DI. Over half the discretionary cash in Canada was controlled by households in urban areas with populations over 500,000. This group had an average of $15,290 in household SDI, whereas the average DI household had $13,566. The second largest concentration of SDI almost 16% was in rural areas, where one-quarter of households enjoyed having an average of $11,450 in extra cash. How they spent their money: Expenditures of DI households file:///n /LHSBR/LHSAD/PERSPECT/Pe9113.htm (5 of 12) [6/1/01 10:02:41 AM]
 The \"no workers\" households, although a relatively small portion of the DI population (less than 6%), had the second highest average SDI and the highest per capita SDI.")
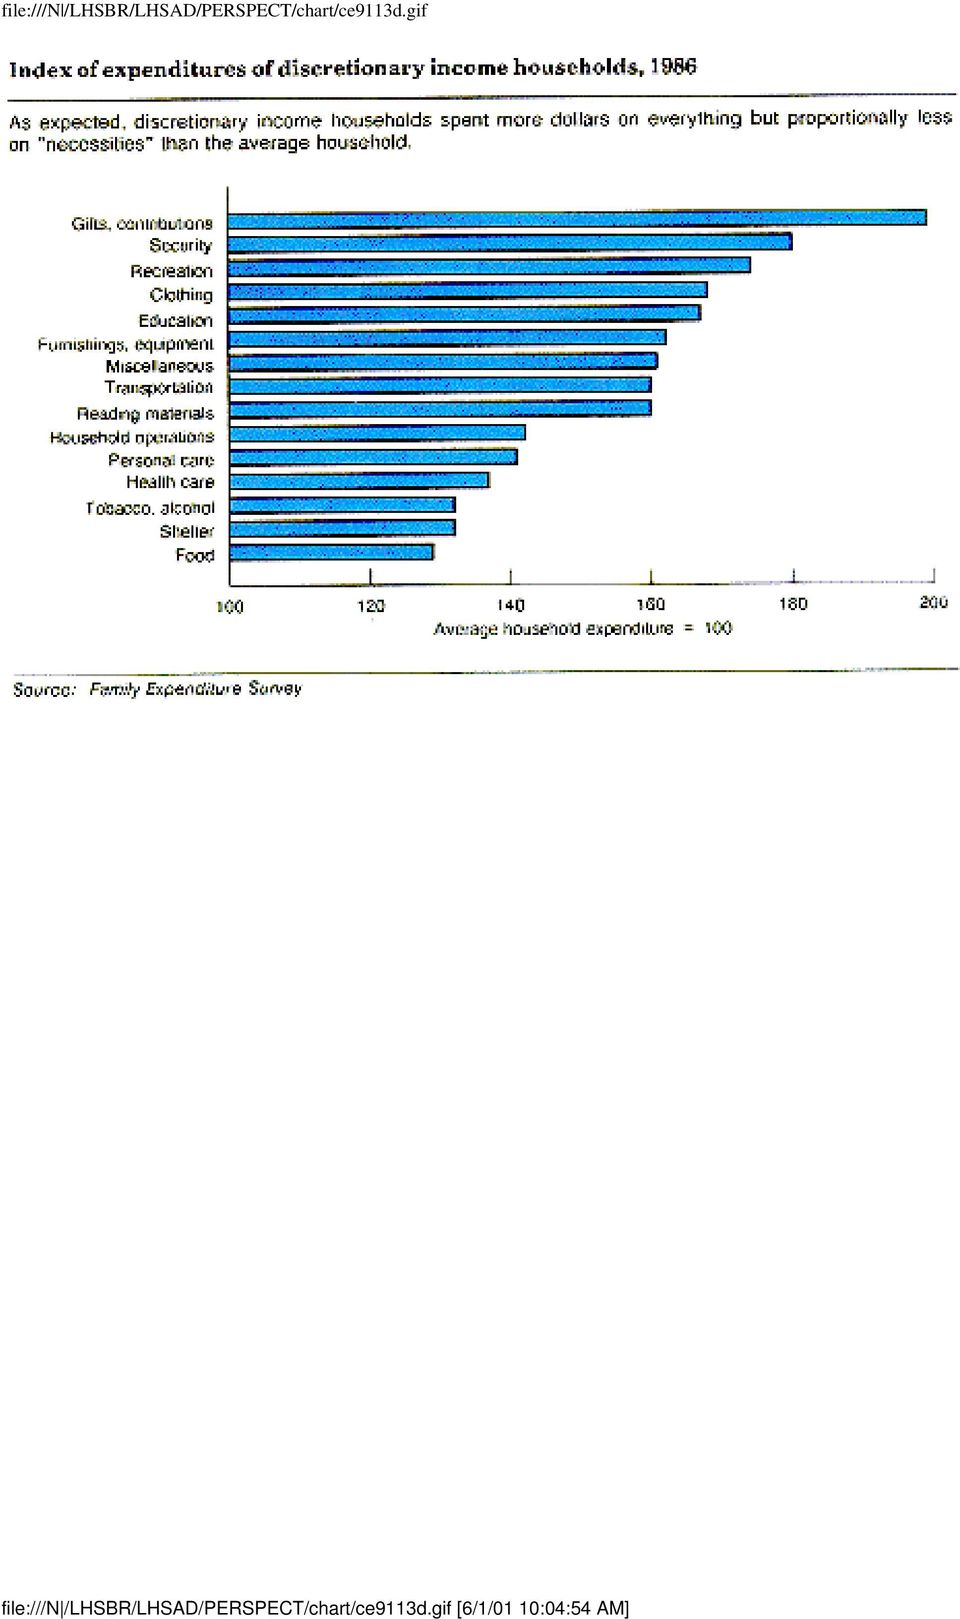
6 Given this portrait of households with discretionary income, what are their spending patterns compared with those of the average household? The first thing to consider is how much income was actually available to spend on both necessities and "discretionary" items, after personal income taxes had been paid. Personal income taxes accounted for the largest share of everyone's budget. In 1986, those households with discretionary income paid an average of $13,629 in personal income taxes, or 24% of their total expenditure (21.5% of income). The average household was taxed at 18.5% of its budget (18.2% of income), which in dollars was actually less than half the amount the DI families paid. Chart D Index of expenditures of discretionary income households, Source: Family Expenditure Survey Shelter Shelter was the greatest post-tax expenditure for all households the average household spent almost 20% of its budget on shelter while a household with DI spent just over 17%. DI families allocated almost $800 more to household furnishings and equipment than average families. Similarly, additions and renovations to property attracted almost twice as much spending from DI households ($1,200) than from average households. DI families also paid double the average on hotels, motels and vacation homes. Food At $6,500 per year, households with DI spent considerably more on food than the average household, probably because their fondness for eating out consumed one-third of this amount. Nevertheless, in accordance with Engel's Law, (5) they actually dedicated a smaller portion of their total budgets to food. Transportation DI households spent almost as much on transportation as they did on shelter. Their expenditures amounted to an average $7,440, representing 60% more than those of the average household. A DI household had two motor vehicles, while the average household had one motor vehicle. Discretionary income families also devoted almost twice as many dollars to public transportation, including air travel. file:///n /LHSBR/LHSAD/PERSPECT/Pe9113.htm (6 of 12) [6/1/01 10:02:41 AM]
. The average household was taxed at 18.")
7 Clothing Clothing expenditures tend to confirm that DI families are more likely to be adult-only households: they spent $1,500 more on clothing than the average household, spending a great deal more on women's and men's clothing than on children's. Recreation Recreation was an important component of all households' budgets; it was the fifth largest expenditure (excluding taxes) for everyone. DI families spent almost twice as much as other households on items such as recreation vehicles and equipment, home entertainment, movies and travel tours. Security Discretionary income is available not just for consumption but also for saving. Life insurance premiums and retirement/pension fund payments (forms of saving) were certainly a favoured expenditure among DI households. At $2,825, they spent 80% more than the average family on these items. Registered Retirement Savings Plans (RRSPs) were also popular among DI families: they invested almost three times as much in RRSPs $1,863 as the average household. Miscellaneous Personal care and health care did not figure prominently in the discretionary income household budget, although those with extra cash did spend 60% more on private health care plans. Expen-ditures on education and reading were also dominated by the DI group. "Gifts and contributions" accounted for twice as much spending by DI families than by average households, with almost one-quarter of the $2,200 they spent donated to charities. And although DI households spent more on tobacco and alcohol than average households, it was alcohol and not tobacco that consumed most of their "vices" budget. Conclusion This brief examination of DI households and their expenditure patterns is far from definitive; the concept raises methodological concerns, and the results pose economic questions. Has the number of households with DI increased or decreased over time, and how much discretionary cash is available to spend? With changes in the economy, how do expenditure habits of DI families change? And given the impact of demographic factors on income and consumption, how will the file:///n /LHSBR/LHSAD/PERSPECT/Pe9113.htm (7 of 12) [6/1/01 10:02:41 AM]

8 changing composition of the Canadian population affect the household distribution of SDI in the future? The concerns raised by the methodology used may never be definitively resolved by statisticians. Like the calculation of low income cut-offs, DI levels are arbitrary, depending entirely upon subjective assessments of "necessities" and "luxuries". Nevertheless, despite all the unanswered questions, it is hoped that this article provides food for thought and a starting point for further analysis. Coming to terms with the terminology Spending unit a group of people living in the same dwelling who depend on a common or pooled income for major expenses, or one financially independent individual living alone. Never-married sons or daughters living with their parents are always considered part of their parents' unit. A spending unit, in most cases, is equivalent to a household, and is generally referred to as such in this study. Family Income before tax this includes gross income from wages and salaries, net income from selfemployment, receipts from military pay and allowances, gross receipts from roomers and boarders, net rentals, family allowances, interest and dividends, all pensions, Worker's Compensation and Unemployment Insurance benefits, social assistance and income supplements, child tax credits and miscellaneous regular income receipts. Major source of income the source accounting for the largest share of the total income of a spending unit; for example, wages and salaries, and interest and dividends. Discretionary income line (DIL) a set of income cut-offs equal to 1.3 times the average consumption level of households, grouped by their size and their locale. A household with after-tax income above the 30% cut-off for its type is classified as a "DI household" (see Technical notes). Spendable discretionary income (SDI) the "extra cash" available for consumption or saving, expressed as the actual dollar amount over and above the DIL cut-off for that type of household (see Technical notes). Per capita SDI the value resulting when the total SDI of a spending unit is divided by the number of persons in that unit, regardless of age. file:///n /LHSBR/LHSAD/PERSPECT/Pe9113.htm (8 of 12) [6/1/01 10:02:41 AM]

9 Technical notes Data source Data collected by the Family Expenditure Survey (FAMEX), conducted nationally every four years since 1953, relate family expenditures to family income and other family characteristics. This study uses FAMEX data on spending by Canadian families during For further information about the survey, see the User's Guide, Family Expenditure in Canada, 1986, Statistics Canada, Catalogue How discretionary income was calculated (6) Six steps were used to estimate discretionary income (DI) and spendable discretionary income (SDI): 1. All 10,356 spending units in the FAMEX sample were divided into separate groups according to size of the household and urbanization of the area. This was done because living expenses vary significantly depending upon the number of people in the home, and are believed to vary according to the size of area of residence. Thus, all families in the FAMEX sample were separated into groups sharing the same two basic characteristics; for example, all two-person rural households were collected into one group, all fourperson large urban households in another, and so on. The procedure created a matrix of 25 different household types, ranging from one-person rural to five-or-more person urban with populations over 500, Once the groups had been established, the consumption expenditures of each household in a particular group were calculated. First, personal income taxes and Unemployment Insurance premiums (defined by FAMEX as part of annual consumption) were subtracted from the household's total expenditures. Then, the remaining expenditures items such as shelter, transportation, clothing, and education were defined as the household's "annual consumption level". (Other compulsory payments, such as Canada or Quebec Pension Plan, and provincial health plan payments, were not deducted for this initial study. However, calculations showed that deducting compulsory pensions made no significant difference to the results.) 3. After establishing the "annual consumption level" for each household, an average level was calculated for the group. This group average then became the basis for calculating the "discretionary income line" (DIL) for each type of household. 4. The average "annual consumption level" estimated for each group was multiplied by 1.3, to establish an income cut-off or "DIL" that was 30% above the average consumption level for each type of household. There are 25 DILs (see table). A cut-off of 30% was used to identify households with a "standard of living comfortably higher than the average for similar families". (7) The 30% mark was also used to remain consistent with the U.S. study cited earlier. file:///n /LHSBR/LHSAD/PERSPECT/Pe9113.htm (9 of 12) [6/1/01 10:02:41 AM]
 Six steps were used to estimate discretionary income (DI) and spendable discretionary income (SDI): 1.")
10 5. After the DIL for each household type had been established, households with after-tax income greater than others in the same group were identified using a two-step procedure. First, the after-tax income for each household was determined by subtracting total personal income taxes from total income; then, the household's after-tax income was compared to the DIL for its group. If its after-tax income exceeded the DIL threshold, the household qualified as having discretionary income (DI). 6. Having identified those households with incomes above the DIL for their type, the next step was to estimate the actual dollars available for consumption or saving the spendable discretionary income (SDI). This was determined by subtracting the DIL dollar amount from the household's after-tax income. The resulting difference was the SDI available to that individual household. For example, consider a two-person spending unit living in a rural area. Assume that the household has an income of almost $40,000. To determine if it has DI, the following calculations are made: (a) Total income: $39,800 (b) Less personal income taxes: $5,450 (c) Equal after-tax income: $34,350 (d) The DIL for the group: $27,612 Since this household's after-tax income is greater than the DIL for its group, it has discretionary income (DI). Furthermore, it has $6,738 ($34,350 - $27,612) in spendable discretionary income (SDI). Table Size of area of residence by number of persons in spending unit Source: Family Expenditure Survey, 1986 Notes Note 1 F. Linden, G.W. Green, Jr. and J.F. Coder, A marketer's guide to discretionary income: a joint study, p.7. Note 2 Ibid., p. 7. Note 3 file:///n /LHSBR/LHSAD/PERSPECT/Pe9113.htm (10 of 12) [6/1/01 10:02:41 AM]

11 A. Rashid, Characteristics of high income families, 1980, p. 31. Note 4 Linden et al, p. 12. Note 5 Engel's law was formulated by nineteenth century German statistician Ernst Engel, and states that "as a family's income increases, it spends a declining proportion of that income on food and other necessities; in other words, poor families spend a much greater share of their income on food and necessities than do rich families". (D. Crane, A dictionary of Canadian economics, p. 108.) Note 6 The methodology used to derive discretionary income has been modified from the calculation used in the U.S. study, in order to "fit" the data limitations and definitional differences posed by FAMEX. Note 7 Linden, Green and Coder, loc. cit. References Crane, D. A dictionary of Canadian economics. Edmonton: Hurtig Publishers, Linden, F., G.W. Green, Jr. and J.F. Coder. A marketer's guide to discretionary income: a joint study. Washington, D.C.: U.S. Bureau of the Census; New York: Conference Board, O'Hare, W. "How to Use Income Statistics." American Demographics, Vol. 11, no 4, Ithaca, NY, April 1989, pp Rashid, A. Characteristics of high income families, 1980, Occasional, Catalogue Ottawa: Statistics Canada, Statistics Canada. Family expenditure in Canada, 1986, Occasional, Catalogue Ottawa, Author Ernest Akyeampong is with the Labour and Household Surveys Analysis Division of Statistics Canada. file:///n /LHSBR/LHSAD/PERSPECT/Pe9113.htm (11 of 12) [6/1/01 10:02:41 AM]
 Note 6 The methodology used to derive discretionary income has been modified from the calculation used in the U.S.")
12 Source Perspectives on Labour and Income, Spring 1991, Vol. 3, No. 1 (Statistics Canada, Catalogue E). This is the first of four articles in the issue. file:///n /LHSBR/LHSAD/PERSPECT/Pe9113.htm (12 of 12) [6/1/01 10:02:41 AM]

13 TE91131 Table 1 Summary income statistics, 1986 Number of households 8,849,365 Average before-tax income $35,665 Average after-tax income $29,174 Discretionary income lines 20% 30% 40% Number of households with discretionary income (estimates) 2,645,472 2,127,369 1,732,644 Proportion of all households with discretionary income (%) Average before-tax income ($) 59,495 63,269 66,638 Average after-tax income ($) 46,897 49,640 52,102 Spendable discretionary income Average ($) 13,403 13,566 13,597 Per capita ($) 4,982 5,070 5,136 Aggregate spendable discretionary income ($ billions) Source: Family Expenditure Survey file:///n /LHSBR/LHSAD/PERSPECT/table/te91131.htm [6/1/01 10:03:38 AM]
 4,982 5,070 5,136 Aggregate spendable discretionary income ($ billions) 35.5 28.9 23.6 Source: Family Expenditure Survey file:///n /LHSBR/LHSAD/PERSPECT/table/te91131.")
14 file:///n /LHSBR/LHSAD/PERSPECT/chart/ce9113a.gif file:///n /LHSBR/LHSAD/PERSPECT/chart/ce9113a.gif [6/1/01 10:03:55 AM]
15 file:///n /LHSBR/LHSAD/PERSPECT/chart/ce9113b.gif file:///n /LHSBR/LHSAD/PERSPECT/chart/ce9113b.gif [6/1/01 10:04:04 AM]
16 file:///n /LHSBR/LHSAD/PERSPECT/chart/ce9113c.gif file:///n /LHSBR/LHSAD/PERSPECT/chart/ce9113c.gif [6/1/01 10:04:16 AM]

17 TE91132 Table 2 Discretionary income: A profile, 1986 Distribution of all households Incidence of households with DI % Share of aggregate SDI Age of household head Under 25 years and over Occupation of household head Professional/Managerial Sales/Clerical/Services Blue collar workers Other/Not specified Not working/retired Family composition Unattached Married/No children Married/Children Other Region Atlantic Quebec Ontario Manitoba Saskatchewan Alberta British Columbia file:///n /LHSBR/LHSAD/PERSPECT/table/te91132.htm (1 of 2) [6/1/01 10:04:34 AM]

18 TE91132 Source: Family Expenditure Survey file:///n /LHSBR/LHSAD/PERSPECT/table/te91132.htm (2 of 2) [6/1/01 10:04:34 AM]

19 file:///n /LHSBR/LHSAD/PERSPECT/chart/ce9113d.gif file:///n /LHSBR/LHSAD/PERSPECT/chart/ce9113d.gif [6/1/01 10:04:54 AM]
20 TE9113B1 Number of persons in spending unit Discretionary income line (dollars) Size of area of residence Urban centre 500,000 or more 21,874 36,171 46,193 51,733 55,805 Urban centre 100, ,999 18,348 33,583 41,577 48,892 52,305 Urban centre 30,000-99,999 19,132 31,052 36,817 43,690 54,055 Urban centre less than 30,000 16,357 30,051 37,380 44,100 51,450 Rural (farm + non-farm) 15,986 27,612 36,145 39,620 43,406 Source: Family Expenditure Survey, 1986 file:///n /LHSBR/LHSAD/PERSPECT/table/te9113b1.htm [6/1/01 10:05:11 AM]
 15,986 27,612 36,145 39,620 43,406 Source: Family Expenditure Survey, 1986 file:///n /LHSBR/LHSAD/PERSPECT/table/te9113b1.")
ON LABOUR AND INCOME. JUNE 2002 Vol. 3, No. 6 HOUSING: AN INCOME ISSUE PENSIONS: IMMIGRANTS AND VISIBLE MINORITIES.
 Catalogue no. 75-001-XIE ON LABOUR AND INCOME JUNE 2002 Vol. 3, No. 6 HOUSING: AN INCOME ISSUE PENSIONS: IMMIGRANTS AND VISIBLE MINORITIES Statistics Canada Statistique Canada Sophie Lefebvre HOUSING IS
ONE INTERESTING DEVELOPMENT in the labour
 Health-related insurance for the self-employed Ernest B. Akyeampong and Deborah Sussman ONE INTERESTING DEVELOPMENT in the labour market in the 199s was the rapid growth of self-employment relative to
In May 2008, the Internal Revenue
 How Consumers Used the 2008 Tax Rebates: Spending, Saving, or Paying Off Debt GEOFFREY PAULIN Geoffrey Paulin is a senior economist in the Branch of Information and Analysis, Division of Consumer Expenditure
Article. Economic Well-being. by Cara Williams. December 2010. Component of Statistics Canada Catalogue no. 89-503-X
 Component of Statistics Canada Catalogue no. 89-503-X Women in Canada: A Gender-based Statistical Report Article Economic Well-being by Cara Williams December 2010 How to obtain more information For information
Discouraged workers - where have they gone?
 Autumn 1992 (Vol. 4, No. 3) Article No. 5 Discouraged workers - where have they gone? Ernest B. Akyeampong One of the interesting but less publicized labour market developments over the past five years
City of Surrey. Preface. Total Income Fact Sheet
 City of Total Income Fact Sheet Preface Statistics Canada conducts its Census of Population every five years with the most recent census having occurred in 2006. The Census provides information on the
Men retiring early: How How are they doing? Dave Gower
 Men retiring early: How retiring are they doing? early: How are they doing? Dave Gower During the first half of this century, men generally stayed in the labour force until at least age 65. In the second
Composition of Farm Household Income and Wealth
 Composition of Farm Household Income and Wealth Today it is rare for any household to receive all of its from a single source. Even when only one household member is employed, it is possible to earn from
CONGRESS OF THE UNITED STATES CONGRESSIONAL BUDGET OFFICE CBO. The Distribution of Household Income and Federal Taxes, 2008 and 2009
 CONGRESS OF THE UNITED STATES CONGRESSIONAL BUDGET OFFICE Percent 70 The Distribution of Household Income and Federal Taxes, 2008 and 2009 60 50 Before-Tax Income Federal Taxes Top 1 Percent 40 30 20 81st
1960-61. United States
 61-61 United States By, the U.S. population had surpassed 179 million, a gain of 19.0 percent from. The median age had decreased to 29.5 (28.7 for men and.3 for women), the first decline since 1900. The
IMPACT OF INCREASES IN ELECTRICITY RATES ON LOW AND NON LOW INCOME HOUSEHOLDS IN MANITOBA
 IMPACT OF INCREASES IN ELECTRICITY RATES ON LOW AND NON LOW INCOME HOUSEHOLDS IN MANITOBA Prepared for the Public Interest Law Centre By Harvey Stevens and Wayne Simpson February 2014 1 TABLE OF CONTENTS
Article. Gambling 2011. by Katherine Marshall. Component of Statistics Canada Catalogue no. 75-001-X Perspectives on Labour and Income
 Component of Statistics Canada Catalogue no. 75-001-X Perspectives on Labour and Income Article Gambling 2011 by Katherine Marshall September 23, 2011 Statistics Canada Statistique Canada Standard symbols
Working After Age 65
 ALTERNATIVE FEDERAL BUDGET 2012 TECHNICAL PAPER Working After Age 65 What is at Stake? Angella MacEwen Highlights The OAS and GIS combined today provide one third of the income of all seniors aged over
Fraser Alert. Canadians Celebrate Tax Freedom Day on June 6. June 2009. Main Conclusions. Market solutions to public policy problems
 Fraser Alert Market solutions to public policy problems June 2009 Canadians Celebrate Tax Freedom Day on June 6 Main Conclusions On Tax Freedom Day, the average Canadian family has earned enough money
Saskatchewan Small Business Profile 2015
 Saskatchewan Small Business Profile 2015 October 2015 Ministry of the Economy Performance and Strategic Initiatives Division economy.gov.sk.ca Table of Contents INTRODUCTION... 1 KEY FACTS... 3 1. SMALL
How is poverty measured in Canada?
 How is poverty measured in Canada? Unlike the United States and some other countries, Canada has no official, governmentmandated poverty line. It is generally agreed that poverty refers to the intersection
ICI RESEARCH PERSPECTIVE
 ICI RESEARCH PERSPECTIVE 0 H STREET, NW, SUITE 00 WASHINGTON, DC 000 0-6-800 WWW.ICI.ORG OCTOBER 0 VOL. 0, NO. 7 WHAT S INSIDE Introduction Decline in the Share of Workers Covered by Private-Sector DB
Compensation of Full-Time Employees in Small Charities in Canada (2010)
") Compensation of Full-Time Employees in Small Charities in Canada (2010) January 2013 The HR Council takes action on nonprofit labour force issues. As a catalyst, the HR Council sparks awareness and action
Compensation of Full-Time Employees in Small Charities in Canada (2010) January 2013 The HR Council takes action on nonprofit labour force issues. As a catalyst, the HR Council sparks awareness and action
Personal debt ON LABOUR AND INCOME
 ON LABOUR AND INCOME Personal debt Although the economy and population are almost times the size of s, the two countries show several similarities. Both have relatively high per-capita income and living
Early retirement trends
 Patrick Kieran IN THE EARLY 197S, one in five Canadians was 5 or older. By 8, one in three will fall into this age group. This reality has led many researchers to focus on the potential consequences of
Looking Into Poverty: Income Sources of Poor People with Disabilities in Canada
 Looking Into Poverty: Income Sources of Poor People with Disabilities in Canada Researched and written by Cameron Crawford Director of Research, IRIS Looking Into Poverty: Income Sources of Poor People
How Can You Reduce Your Taxes?
 RON GRAHAM AND ASSOCIATES LTD. 10585 111 Street NW, Edmonton, Alberta, T5M 0L7 Telephone (780) 429-6775 Facsimile (780) 424-0004 Email [email protected] How Can You Reduce Your Taxes? Tax Brackets.
Construction of variables from CE
 Online Appendix for Has Consumption Inequality Mirrored Income Inequality? by Mark Aguiar and Mark Bils In this appendix we describe construction of the variables in our data set and the impact of sample
Working Beyond Retirement-Age
 Working Beyond Retirement-Age Kelly A. Holder and Sandra L. Clark U.S. Census Bureau Housing and Household Economics Division Labor Force Statistics Branch Presented at the American Sociological Association
Annual Income Estimates for Census Families and Individuals (T1 Family File) Family Data. - User's Guide -
 Family Data. - User's Guide -") Annual Income Estimates for Census Families and Individuals (T1 Family File) Family Data - User's Guide - Statistics Canada 13C0016 Income Statistics Division Statistics Canada [email protected] June
Annual Income Estimates for Census Families and Individuals (T1 Family File) Family Data - User's Guide - Statistics Canada 13C0016 Income Statistics Division Statistics Canada [email protected] June
Dimensions of core housing need in Canada
 C O O P E R A T I V E H O U S I N G F E D E R A T I O N O F C A N A D A Dimensions of core housing need in Canada Completed by Will Dunning Inc. for Co-operative Housing Federation of Canada July 2007
As the U.S. workforce comes to rely
 Research Summary Expenditures of college-age students nonstudents Geoffrey D. Paulin As the U.S. workforce comes to rely increasingly on computer technology, including the Internet, higher levels of education
For Immediate Release
 Household Income Trends May 2015 Issued July 2015 Gordon Green and John Coder Sentier Research, LLC For Immediate Release 1 Household Income Trends May 2015 Note This report on median household income
An explanation of social assistance, pension schemes, insurance schemes and similar concepts
 From: OECD Framework for Statistics on the Distribution of Household Income, Consumption and Wealth Access the complete publication at: http://dx.doi.org/10.1787/9789264194830-en An explanation of social
Back injuries at work, 1982-1990
 Autumn 1992 (Vol. 4, No. 3) Article No. 4 Back injuries at work, 1982-1990 Cynthia Haggar-Guénette and Joanne Proulx Work injuries not only cause physical, financial and emotional hardships for workers
Appendix D (Online Only) Detailed Description of Canadian Financial Aid Rules and Assumptions in our Aid Calculations
 Detailed Description of Canadian Financial Aid Rules and Assumptions in our Aid Calculations") Appendix D (Online Only) Detailed Description of Canadian Financial Aid Rules and Assumptions in our Aid Calculations This is a companion (online) appendix to Post-Secondary Attendance by Parental Income
Appendix D (Online Only) Detailed Description of Canadian Financial Aid Rules and Assumptions in our Aid Calculations This is a companion (online) appendix to Post-Secondary Attendance by Parental Income
Business Immigrants Self-employed Findings from the Longitudinal Immigration Database (IMDB)
") IMDB 2008 Research Series Economic Class For internal use only IMDB 2008 Immigration Category Profiles Business Immigrants Findings from the Longitudinal Immigration Database (IMDB) March 2012 Economic
IMDB 2008 Research Series Economic Class For internal use only IMDB 2008 Immigration Category Profiles Business Immigrants Findings from the Longitudinal Immigration Database (IMDB) March 2012 Economic
1934-36. United States
 1934 36 United States Trends identified in earlier decades, such as the aging and urbanization of the U.S. population, continued into the 19s. In 19, the population exceeded 122 million, a gain of 16.1
Business Immigrants Entrepreneurs Findings from the Longitudinal Immigration Database (IMDB)
") IMDB 2008 Research Series Economic Class For internal use only IMDB 2008 Immigration Category Profiles Business Immigrants Entrepreneurs Findings from the Longitudinal Immigration Database (IMDB) March
IMDB 2008 Research Series Economic Class For internal use only IMDB 2008 Immigration Category Profiles Business Immigrants Entrepreneurs Findings from the Longitudinal Immigration Database (IMDB) March
AFFIDAVIT IN SUPPORT OF APPLICATION FOR SETTLEMENT
 Financial Service Commission of Ontario Commission des services financiers de l'ontario AFFIDAVIT IN SUPPORT OF APPLICATION FOR SETTLEMENT THE MOTOR VEHICLE ACCIDENT CLAIMS ACT R.S.O. 1990, CHAPTER M.41,
Economic Impacts of MLS Home Sales and Purchases in Canada and the Provinces
 Economic Impacts of MLS Home Sales and Purchases in Canada and the Provinces Economic Impacts of MLS Home Sales and Purchases in Canada and the Provinces Prepared for: The Canadian Real Estate Association
Now and Tomorrow Excellence in Everything We Do
 Now and Tomorrow Excellence in Everything We Do Disability in Canada: A 2006 Profile ISSD-042-02-11 You can order this publication by contacting: Publishing Services Human Resources and Skills Development
ONTARIO Court File Number. Form 13.1: Financial Statement (Property and Support Claims) sworn/affirmed. Applicant(s) Respondent(s)
 sworn/affirmed. Applicant(s) Respondent(s)") ONTARIO Court File Number at (Name of court) Court office address Form 13.1: Financial Statement (Property and sworn/affirmed Applicant(s) Full legal name & address for service street & number, municipality,
ONTARIO Court File Number at (Name of court) Court office address Form 13.1: Financial Statement (Property and sworn/affirmed Applicant(s) Full legal name & address for service street & number, municipality,
Social Security: Vital to Retirement Security for 35 Million Women and Men
 IWPR Publication #D487 March 2010 Social Security: Vital to Retirement Security for 35 Million Women and Men Jeff Hayes, Heidi Hartmann, and Sunhwa Lee This Briefing Paper examines major sources of income
John and Jane Client June 2015
 John and Jane Client June 2015 Table Of Contents About This Plan 2 Assumptions 3 About You 4 Your Goals & Objectives 5 Opportunities, Concerns & Notes 6 Net Worth Statement 7 Sources of Income 8 Lifestyle
Money Management Test - MoneyPower
 Money Management Test - MoneyPower Multiple Choice Identify the choice that best completes the statement or answers the question. 1. A person s debt ratio shows the relationship between debt and net worth.
A Comparative Analysis of Income Statistics for the District of Columbia
 Occasional Studies A Comparative Analysis of Income Statistics for the District of Columbia ACS Income Estimates vs. DC Individual Income Tax Data Jayron Lashgari Office of Revenue Analysis Office of the
Repair and Maintenance Services
 Catalogue no. 63-247-X. Service bulletin Repair and Maintenance Services 2010. Highlights The repair and maintenance services industry earned $22.5 billion in operating revenues in 2010, an increase of
Volume URL: http://www.nber.org/books/feld87-2. Chapter Title: Individual Retirement Accounts and Saving
 This PDF is a selection from an out-of-print volume from the National Bureau of Economic Research Volume Title: Taxes and Capital Formation Volume Author/Editor: Martin Feldstein, ed. Volume Publisher:
pages is accurate to the best of my knowledge and belief and sets out the financial situation as of (give date for which information is accurate)
") ONTARIO Court File Number at (Name of Court) Court office address Form 13: Financial Statement (Support Claims) sworn/affirmed Applicant(s) Full legal name & address for service street & number, municipality,
ONTARIO Court File Number at (Name of Court) Court office address Form 13: Financial Statement (Support Claims) sworn/affirmed Applicant(s) Full legal name & address for service street & number, municipality,
Table 8.1.1: Comparison of Education Expenditures with Other Government Sectors, 1991/92-1997/98
 8. Cost of Education 8.1 How do educational expenditures compare with expenditures for other major government sectors? The total government expenditure for the year 1995/96, the last year for which actual
Remarriage in the United States
 Remarriage in the United States Poster presented at the annual meeting of the American Sociological Association, Montreal, August 10-14, 2006 Rose M. Kreider U.S. Census Bureau [email protected]
INDIVIDUALS -- 2000 DEPARTMENT OF TAXATION -- STATE OF HAWAII
 hawaii income patterns INDIVIDUALS -- 2000 DEPARTMENT OF TAXATION -- STATE OF HAWAII STATE OF HAWAII Benjamin J. Cayetano, Governor DEPARTMENT OF TAXATION Marie Y. Okamura, Director Grant B. Tanimoto,
Elderly Immigrants in Canada: Income Sources and Self-Sufficiency SUMMARY
 Elderly Immigrants in Canada: Income Sources and Self-Sufficiency SUMMARY Prepared for the 2005 Economic Conference, Ottawa May 10 th, 2005 Colleen Dempsey Strategic Research and Statistics Citizenship
OBSERVATION. TD Economics. COMPARING AND CONTRASTING CANADIAN AND AMERICAN CONSUMERS Some Stylized Facts
 OBSERVATION TD Economics December 18, 213 COMPARING AND CONTRASTING CANADIAN AND AMERICAN CONSUMERS Some Stylized Facts A recent trend over the past decade has been a greater push for companies to span
STATEMENT OF CURRENT MONTHLY INCOME AND MEANS TEST CALCULATION FOR USE IN CHAPTER 7 ONLY
 Form B22A (Chapter 7) (10/05) In re Debtor(s) Case Number: (If known) According to the calculations required by this statement: The presumption arises. The presumption does not arise. (Check the box as
Control and sale of alcoholic beverages, for the year ending March 31, 2013 Released at 8:30 a.m. Eastern time in The Daily, Thursday, April 10, 2014
 Control and sale of alcoholic beverages, for the year ending March 31, 2013 Released at 8:30 a.m. Eastern time in The Daily, Thursday, April 10, 2014 Beer and liquor stores and agencies sold $21.4 billion
Pharmacist Workforce, 2012 Provincial/Territorial Highlights
 pic pic Pharmacist Workforce, 2012 Provincial/Territorial Highlights Spending and Health Workforce Our Vision Better data. Better decisions. Healthier Canadians. Our Mandate To lead the development and
The Retirement Income Equation
 The Retirement Income Equation Understanding how to arrive at a target replacement rate By Marlena I. Lee, PhD Vice President Dimensional Fund Advisors June 2013 THE RETIREMENT INCOME EQUATION 1 INTRODUCTION
Methodology For Calculating Damages in the Victim Compensation Fund
 Methodology For Calculating Damages in the Victim Compensation Fund The calculation of presumed economic loss will generally follow the guidelines established in the original VCF. The Special Master will
Tax Planning Opportunities Involving Professional Corporations
 Tax Planning Opportunities Involving Professional Corporations A Discussion Paper Prepared by: Alan Koop, CA Prepared for: The Saskatchewan Provincial Court Judges Association Table of Contents Executive
Self-employment tends to increase during
 Sébastien LaRochelle-Côté Self-employment in the downturn Self-employment tends to increase during recessions (Picot and Heisz 2000). The recent downturn has been no exception. Between October 2008 and
Profile of Canadian Environmental Employment
 Profile of Canadian Environmental Employment LABOUR MARKET RESEARCH STUDY 2010 ECO CANADA ECO Canada develops programs that help individuals build meaningful environmental careers, provides employers with
Operating revenue for the accounting services industry totaled $15.0 billion, up 4.8% from 2011.
 Catalogue no. 63-256-X. Service bulletin Accounting Services 2012. Highlights Operating revenue for the accounting services industry totaled $15.0 billion, up 4.8% from 2011. Accounting, bookkeeping and
Life insurance. Shedding light on. a practical guide to helping you achieve a lifetime of financial security
 Shedding light on Life insurance a practical guide to helping you achieve a lifetime of financial security Learn more about: Safeguarding your loved ones Protecting your future Ensuring your dreams live
STATEMENT OF CURRENT MONTHLY INCOME AND CALCULATION OF COMMITMENT PERIOD AND DISPOSABLE INCOME
 Form B22C (Chapter 13) (10/05) In re Debtor(s) Case Number: (If known) According to the calculations required by this statement: The applicable commitment period is 3 years. The applicable commitment period
PARAMETERS OF THE PERSONAL INCOME TAX SYSTEM FOR 2015. November 2014
 PARAMETERS OF THE PERSONAL INCOME TAX SYSTEM FOR 2015 November 2014 PARAMETERS OF THE PERSONAL INCOME TAX SYSTEM FOR 2015 Legal deposit November 2014 Bibliothèque et Archives nationales du Québec ISBN
Your Guide to Retirement Income Planning
 Your Guide to Retirement Income Planning Your Guide to Retirement Income Planning 3 Your retirement income plan How to create secure income in retirement Your retirement will be as unique as you are. Travel,
Unemployment and Unemployment Insurance: a tale of two sources
 Winter 1989 (Vol. 1, No. 3) Unemployment and Unemployment Insurance: a tale of two sources Jean-Mare Lévesque In 1988, unemployment averaged over one million, based on results from the Labour Force Survey
EMPLOYEE BENEFITS IN THE UNITED STATES MARCH 2015
 For release 10:00 a.m. (EDT) Friday, July 24, 2015 USDL-15-1432 Technical information: Media contact: (202) 691-6199 [email protected] www.bls.gov/ebs (202) 691-5902 [email protected] EMPLOYEE BENEFITS
The traditional work schedule for an
 A time to work: recent trends in work and flexible schedules Numerous U.S. workers have work schedules different from the standard 9 a.m.-to-5 p.m., Monday-through-Friday, work ; the demands of the industry
CONTRIBUTING PERSPECTIVE DEMOGRAPHIC TRENDS
 CONTRIBUTING PERSPECTIVE DEMOGRAPHIC TRENDS June 2013 Canadian Bar Association 865 Carling Avenue, Suite 500 Ottawa, ON K1S 5S8 Tel.: (613) 237-2925 / (800) 267-8860 Fax: (613) 237-0185 E-mail: [email protected]
Demographic Analysis of the Salt River Pima-Maricopa Indian Community Using 2010 Census and 2010 American Community Survey Estimates
 Demographic Analysis of the Salt River Pima-Maricopa Indian Community Using 2010 Census and 2010 American Community Survey Estimates Completed for: Grants & Contract Office The Salt River Pima-Maricopa
UNITED STATES DISTRICT COURT for the District of
 Page 1 of 5 UNITED STATES DISTRICT COURT for the District of Plaintiff/Petitioner v. Civil Action No. Defendant/Respondent APPLICATION TO PROCEED IN DISTRICT COURT WITHOUT PREPAYING FEES OR COSTS (Long
ECONOMIC ANALYSIS OF CLAIM COSTS
 ECONOMIC ANALYSIS OF CLAIM COSTS Prepared by Associated Economic Consultants Ltd. August 30, 2000 Table of Contents 1. INTRODUCTION...1 FIGURE 1...4 2. DEMOGRAPHIC AND ECONOMIC FACTORS...5 2.1 Population,
ENGINEERING LABOUR MARKET
 ENGINEERING LABOUR MARKET in Canada Projections to 2025 JUNE 2015 ENGINEERING LABOUR MARKET in Canada Projections to 2025 Prepared by: MESSAGE FROM THE CHIEF EXECUTIVE OFFICER Dear colleagues: Engineers
Why Some Tax Units Pay No Income Tax
 Why Some Tax Units Pay No Income Tax Rachel Johnson, James Nunns, Jeffrey Rohaly, Eric Toder, Roberton Williams Urban-Brookings Tax Policy Center July 2011 ABSTRACT About 46 percent of American households
How Equal Pay for Working Women would Reduce Poverty and Grow the American Economy*
 IWPR #C411 January 2014 How Equal Pay for Working Women would Reduce Poverty and Grow the American Economy* Heidi Hartmann, Ph.D., Jeffrey Hayes, Ph.D., and Jennifer Clark Persistent earnings inequality
ONTARIO Court File Number. Form 13.1: Financial Statement (Property and Support Claims) sworn/affirmed. Applicant(s) Respondent(s)
 sworn/affirmed. Applicant(s) Respondent(s)") ONTARIO Court File Number at (Name of court) Court office address Form 13.1: Financial Statement (Property and sworn/affirmed Applicant(s) Full legal name & address for service street & number, municipality,
ONTARIO Court File Number at (Name of court) Court office address Form 13.1: Financial Statement (Property and sworn/affirmed Applicant(s) Full legal name & address for service street & number, municipality,