Customer Satisfaction Survey of Indian Tribal Governments. Office of Indian Tribal Governments Tax Exempt Government Entities Division
|
|
|
- Constance Bell
- 8 years ago
- Views:
Transcription
1 Customer Satisfaction Survey of Indian Tribal Governments Office of Indian Tribal Governments Tax Exempt Government Entities Division March 2011

2 TABLE OF CONTENTS 2011 ITG CUSTOMER SATISFACTION SURVEY... 1 Balanced Measures and the Office of Indian Tribal Governments...1 Purpose...1 Background...2 Response Rate...2 Response Bias...4 FINDINGS FROM 2011 ITG CUSTOMER SATISFACTION SURVEY... 4 The Questionnaire Scale...4 Survey Results...5 Special Analysis...10 RECOMMENDATIONS APPENDIX INDEX OF TABLES Table 1 Survey Responses by ITG Field Group... 3 Table ITG Customer Satisfaction Survey Results - by Question Order... 5 Table ITG Customer Satisfaction Survey Results - by Rank (1-26)... 6 Table ITG Customer Satisfaction Survey Results - by Rank (28-41)... 7 Table ITG Customer Satisfaction Survey Scores - by Area of Customer Satisfaction... 8 Table 6 ITG Customer Satisfaction Survey Scores - by ITG Field Group... 9 Table 7 ITG Customer Satisfaction Survey Scores - Special Analysis... 10
... 6 Table 4 2011 ITG Customer Satisfaction Survey Results - by Rank (28-41).")
3 2011 ITG Customer Satisfaction Survey Balanced Measures and the Office of Indian Tribal Governments The Office of Indian Tribal Governments (ITG) is located within the Tax Exempt/ Government Entities (TE/GE) Business Unit. ITG s customers are 565 federally recognized tribes. ITG seeks to provide all of the services that tribes need in order to fully administer federal tax laws and to provide tribes with information they require to further their economic development without risk of federal tax concerns. As part of the Internal Revenue Service (IRS), ITG is required to utilize balanced measures for employee satisfaction, business results, and customer satisfaction. The use of measures across these three areas allows the organization to better assess the effectiveness of its programs. The balanced measure Customer Satisfaction is one of the five levers of change identified by former Commissioner Rossotti to modernize the IRS. Each of the Balanced Measures is supported by three strategic goals: Service to Each Taxpayer; Service to All Taxpayers; and Productivity through a Quality Work Environment. This research will allow us to determine the level of customer satisfaction espoused by our customers. It will also allow us to evaluate our programs to see where we need to improve our performance. Purpose ITG conducted the 2011 Customer Satisfaction Survey to obtain feedback from our customers that will allow us to measure customer satisfaction with our products and services. This research is an important part of measuring our performance within the context of the aforesaid Customer Satisfaction balanced measure. This report summarizes the findings ITG obtained from the survey. The information collected from this survey is important for several reasons. One, it will enable ITG to identify program areas where we are meeting our customers expectations as well as those areas where improvement is needed. The survey feedback will allow ITG to reallocate/assign resources within our annual Work Plan to produce and/or improve those products/ services that are important to our customers. Two, it will allow us to contrast the level of customer satisfaction espoused by our customers with the results from similar surveys conducted in previous years. This annual assessment will create opportunities for us to identify areas where our initiatives are working or have failed, and will allow ITG to modify and/or design new programs and initiatives to better address our customers needs. 1

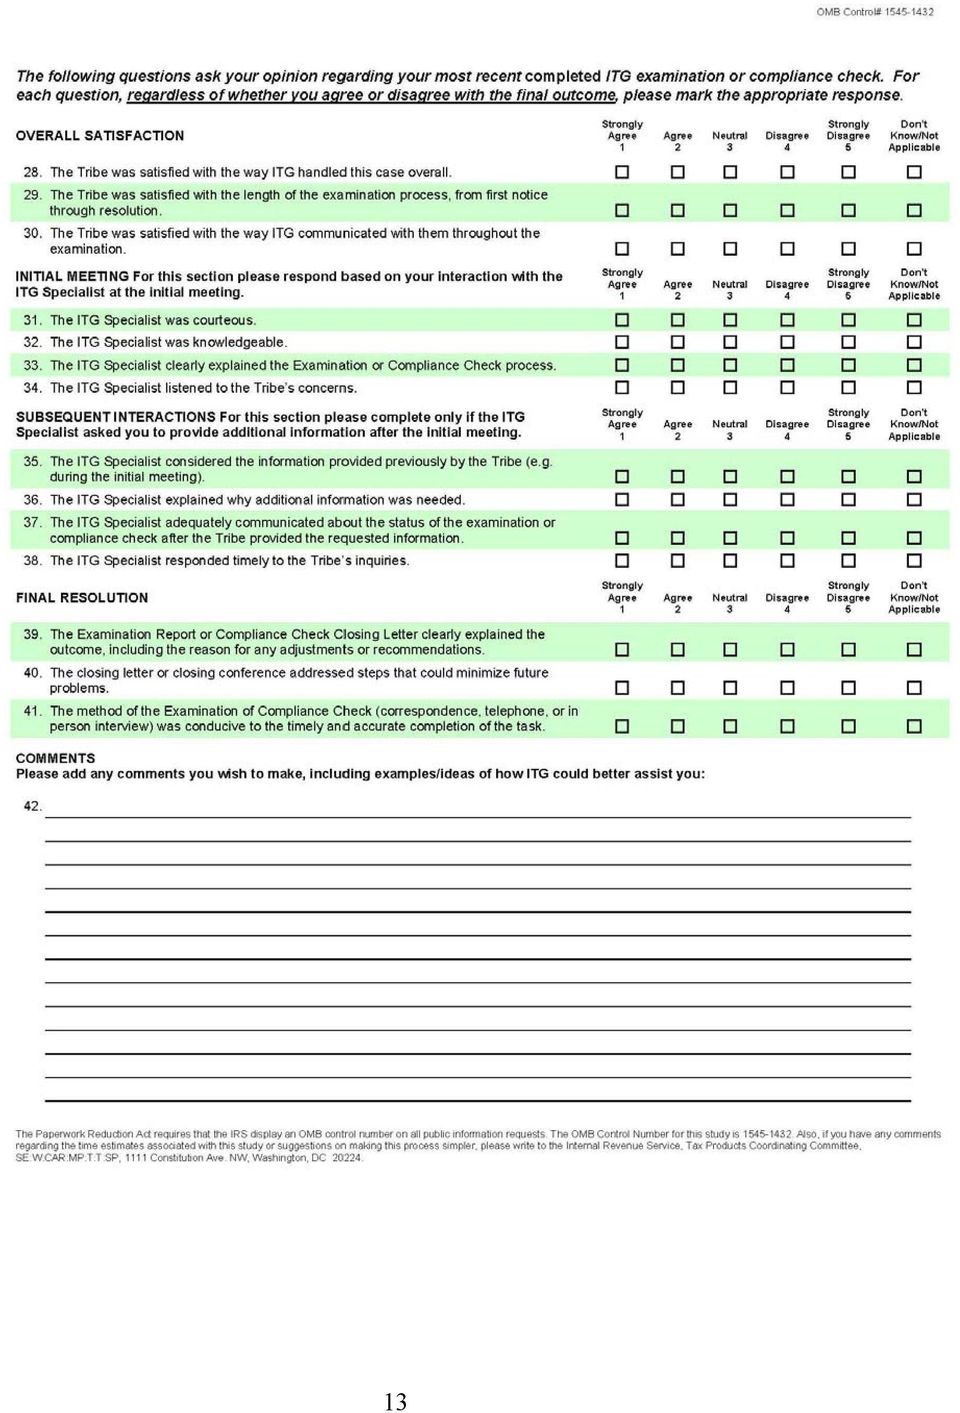
4 Background Our research began in April 2001, when a group of our employees met in a brainstorming session to develop a list of products and services that we thought were important to the tribal governments. We broke the list down to find the positive aspects and negative attributes of each product/service and created measures. The measures were then ranked in terms of the perceived importance to the tribes. Next, we met with representatives of the Five Civilized Tribes for a focus group to determine their needs and concerns. 1 After studying the results of the focus group we changed the ranking of our measures, as our perception of the tribes needs was slightly different from their perception. As part of this effort, we prioritized and selected the measures best suited to fit the needs of our customers. The aforementioned measures were then used to develop a customer satisfaction questionnaire. The questionnaire was slightly modified over the years, largely to provide additional clarity to certain questions. A copy of the 2011 survey questionnaire is included in the Appendix. An implementation plan for the survey was drafted that included the questionnaire. A copy of the implementation plan can be obtained by calling the ITG Staff Assistant. The implementation plan was subsequently approved by the Office of Management and Budget. Finally, we conducted a mail survey this past fall with our customers. Starting with the FY 2008 survey, ITG added several questions measuring the success of our contacts with customers who had undergone any type of compliance action (e.g Compliance Check, Examination, etc) in the past year. This year forty-two respondents answered these additional Compliance Action questions. Due to realignment of the survey schedule from the summer to late fall, there was no survey conducted in Response Rate The questionnaire was mailed out to 565 federally recognized tribes, as well as 110 Navajo Chapters 2, beginning on October 18, The survey officially ended on December 17th. The following actions were taken by ITG to boost our response rate: ITG management reminded the tribes about the survey, and encouraged their participation in the survey during various meetings that were held prior to the survey effort. ITG Specialists asked tribes to participate during all contacts with tribes during the period of the survey The ITG internet site headline reported that the surveys had gone out and responses were due. 1 The Five Civilized tribes are located in Oklahoma. 2 The Navajo Chapters, as well as Alaska Villages and Tribes are unique subsets within the context of ITG and are measured separately. 2

5 ITG News issuances for July 2010 contained a national article on the pending survey, and October 2010 saw the director promoting the survey in her quarterly message. The Director, ITG signed a cover letter that accompanied each survey mailed to tribes in which she asked for their participation. Telephone and contacts were made with tribal designees to alert them to the mailing of the survey and to encourage them to respond. ITG received 151 responses from the tribes during this period. This results in a response rate of 22%. From "The Survey Research Handbook," by Alreck and Settle, the researchers state, "Mail surveys with response rates over 30 percent are rare. Response rates are often only about 5 or 10 percent." 3 Previous contact with the North American Indian Housing Council indicated they have customers and mainly deal with the housing authority within federally recognized tribes. Our contact said they have conducted many surveys and they usually receive a response rate between 7-13%. Based upon our historical response rates, ITG is disappointed with a response rate of 22% (down from 31% in 2009), yet still striving to reach previous response levels such as the 35% received in Table 1 Survey Responses by ITG Field Group 2011 ITG Customer Satisfaction Survey Results % % % % % Alaska 48 21% Navajo Chapters 11 10% Total % Our market segments have traditionally been broken out by three levels: tribes located in Alaska, tribes located outside of Alaska without gaming, tribes located outside of Alaska with gaming. When determining our customer satisfaction levels, we need to break out the Navajo Chapters as well, since both the Navajo Chapters and Alaska Villages present unique circumstances and special needs for assistance, outreach and compliance issues. 3 Page ITG recognizes the Office of Management and Budget standards are higher. ITG will continue to look for ways to improve our response rate. 3

6 Response Bias There are a number of ways the results from a survey may contain some bias. One example might include the survey instrument itself, the questionnaire, which may be written in a manner that yields biased responses. ITG has made several efforts to try and eliminate the possibility that our survey results are biased. Some of these efforts were included in the design of the questionnaire and/or the implementation of the survey (e.g. allowing the respondents to the survey to maintain their anonymity). ITG cannot say definitively that these and other actions have precluded any response bias. Rather, ITG can say that concrete steps were taken to try and minimize the potential for response bias. Yet another type of bias is called non-response bias. This situation may occur when the opinions, values, etc. expressed by the respondents are quite different from those held by the customers who did not reply. If the non-response bias is severe enough, it can render the results of the survey invalid. In other words, the results reported from the survey do not accurately reflect the opinions, values, etc. the survey researcher intended to measure for the survey group. In this survey, we are cognizant of the possibility that the opinions of the tribes that did respond to our survey may be more favorable than the opinions of tribes that did not respond. Given that nearly 3/4ths of our customers did not respond, the reader is advised the opinions reflected in our responses may be slightly more favorable than those opinions held by tribes that did not respond. ITG has made an effort to discern if our respondents are generally representative of the different market segments of tribes that we have previously defined in our market segmentation report. Findings From 2011 ITG Customer Satisfaction Survey The Questionnaire Scale A Likert Scale was used for most of the questions. On this scale, a 1 indicated the respondent strongly agreed with the statement. A response of 5 indicated the respondent strongly disagree with the statement. A response of 3 indicated the respondent was neutral on their agreement/disagreement with the proposed statement. For purposes of analysis, we have lumped together the 1s with the 2s and the 4s with the 5s. The reader is also reminded that some of the proposed questions (statements) were written such that an answer of 5-strongly disagree was a good response. We have reversed the results from these statements to ensure they are readily comparable to statements that were written in the affirmative to maintain a consistent presentation of our findings. This change is reflected in the tables. The lumping of scores together is an approach the IRS has used to evaluate scores received during its Employee Satisfaction Survey. We hope the consistent use of this approach will make it easier to understand the results from our Customer Satisfaction Survey and enhance their usefulness. 4
.")
7 Survey Results The results from the survey are summarized in the following Tables 2 and 3. We created a measure equal to the difference between the aggregate number of good and bad scores. This measure is shown in the right columns of Tables 2 and 3, with results from the current survey contrasted to the results from the FY 2009 and FY 2008 surveys. The lower the difference the greater the perceived dissatisfaction expressed by our customers. The difference is a useful measure in that it allows one to quickly identify those areas where ITG has pronounced differences in customer satisfaction. Table 2 reflects the response rates in order of the questions (statements) asked on the questionnaire. Table ITG Customer Satisfaction Survey Results - by Question Order Question Questionnaire Response Scores (percentages) (Good-Bad) FY 2011 (Good-Bad) FY 2009 (Good-Bad) FY 2008 Good Neutral Bad

8 One can see that in Table 3 we have taken the questions in Table 2 and rearranged them by ascending order of those that have the smallest difference between the good (1/2) and bad (4/5) scores. The narrower the difference the greater the need to address the issue raised within the question (statement). For example the lowest figure calculated in the difference column in Table 3 was 66, which occurred with question (statement) 12. Question 12 reads, Assistance given by the Office of ITG interferes with Tribal Sovereignty. This is one area where ITG might reexamine its products/services and the way they are delivered to see if any changes can be made that would improve the tribes satisfaction with our performance in this area. Question Table ITG Customer Satisfaction Survey Results - by Rank (1-26) Questionnaire Response Scores (percentages) (Good- Bad) FY 2011 Rank FY 2011 (Good- Bad) FY 2009 Rank FY 2009 (Good- Bad) FY 2008 Good Neutral Bad Rank FY

9 Conversely, in Table 3 one can observe the widest difference was 132, which occurred with question (statement) 5. Question 5 reads, Forms, Publications and other written materials are available on the IRS internet site". ITG scored relatively high in this area. It would be a good idea to share this information within the ITG organization to let the employees know where ITG is performing relatively well. Table 3 also shows relative consistency of responses between the last 3 surveys. For example, question 10 has ranked in the top 5 in each of the surveys, indicating that ITG still needs to effect improvements in the opinion of their customers. Conversely, ITG has made significant progress over the past 3 surveys in areas relating to questions 22 and 15. ITG should review the issues/actions that relate to those areas to see if it can leverage from those efforts to effect similar improvements in other areas. In Table 4, we have similarly ranked the 14 Compliance Action questions. The lowest figure calculated in the difference column in Table 4 was 23, which occurred with questions (statements) 35 and 37. These questions concern the communication from the ITG specialist in regards to the case status. This might be area where ITG could focus efforts to increase the satisfaction of the customers. It is interesting to note that in past surveys, the questions contained in the Final Resolution section always ranked at the top. This year the dissatisfaction seems to be focused toward the Subsequent Interactions section, with all the questions in that section making it to the top four. Question Table ITG Customer Satisfaction Survey Results-by Rank (28-41) Questionnaire Response Scores (percentages) (Good- Bad) FY 2011 Rank FY 2011 (Good- Bad) FY 2009 Rank FY 2009 (Good- Bad) FY 2008 Rank FY 2008 Good Neutral Bad In examining those areas that have relatively low scores, ITG should consider several factors in evaluating what type of follow-up action is warranted. These factors include: The degree of control ITG has on the aforesaid area (e.g., ITG has less control over the ease of understanding forms and publications) 7

10 The amount of resources needed to make an improvement(s) in one area where ITG scored low vis-à-vis other areas with similar scores The perceived impact on the IRS mission from making an improvement(s) in a given area The impact external factors have on customer satisfaction within the given area (e.g., tribes may view certain legislation passed by the U.S. Congress as unfair and a sign ITG does not want to work with them even though ITG had little if any influence over the legislation) Table ITG Customer Satisfaction Survey Scores - by Area of Customer Satisfaction Questionnaire Response Scores (percentages) Questionnaire Response Scores (percentages) Area* FY 2011 FY 2009 Good Neutral Bad Good Neutral Bad Burden/Delivery of Information 76% 16% 8% 74% 17% 8% Collaborate 65% 24% 10% 64% 23% 13% Recognition 75% 20% 5% 74% 20% 6% Protocol/Horizontal Equity 75% 22% 3% 76% 19% 4% Accuracy/Timeliness/Honesty 73% 20% 7% 68% 23% 8% Compliance-Overall Satisfaction 90% 9% 2% 69% 24% 7% Compliance-Initial Meeting 91% 5% 4% 82% 16% 2% Compliance-Subsequent Interactions 81% 15% 4% 72% 24% 3% Compliance-Final Resolution 82% 14% 4% 66% 28% 7% *See the ITG Balanced Measures Task Force Report for a detailed explanation of these areas. In Table 5, we have provided the survey findings broken out among the nine components that make up our customer satisfaction measures. Of the original five measures used by ITG, favorable ratings have increased for four, and decreased for one. The lowest scores once again are shown in areas Collaborate and Accuracy, Timeliness and Honesty. The specific questions in these areas with the lowest scores are questions 12 and 25. These are prime areas for further study and remedial action by ITG. While the original compliance measures mostly show slight increased satisfaction rates, the compliance measures have rebounded tremendously, with increases ranging from 9% to 21%. Finally, in Table 6 we have provided the survey results broken out by ITG Field Group. From Table 6, one can see that the Pacific Northwest (7282), Navajo Chapters and Southwest (7282) have significantly increased their rating of overall satisfaction by 21%, 20% and 19% respectively. These three groups are also showing dissatisfaction rates of 0%. Conversely, Central (7281) dropped significantly from 90% to 68%, though it appears these customers are not so much dissatisfied, but opted to report as neutral. Interestingly, overall dissatisfied ratings fell from 5% in 2009 to 3% in 2011, with neutral ratings of 18% for both years. Overall satisfied ratings rose slightly, from 76% to 78%. 8
 Questionnaire Response Scores (percentages) Area* FY 2011 FY 2009 Good Neutral Bad Good Neutral Bad Burden/Delivery of Information")
11 Table 6 ITG Customer Satisfaction Survey Scores - by ITG Field Group AK NAV Burden/ Delivery of Information Satisfied 89% 87% 88% 70% 73% 80% 82% 80% 67% 73% 73% 77% 49% 50% Neutral 8% 8% 8% 20% 18% 13% 11% 15% 17% 22% 20% 15% 35% 26% Dissatisfied 3% 5% 4% 10% 9% 6% 7% 5% 17% 5% 7% 8% 17% 24% Collaborate Satisfied 79% 75% 84% 57% 61% 71% 66% 64% 46% 64% 64% 67% 45% 50% Neutral 14% 18% 11% 31% 23% 19% 18% 21% 32% 28% 25% 23% 38% 42% Dissatisfied 7% 8% 5% 12% 16% 10% 16% 14% 22% 8% 12% 10% 17% 8% Recognition Satisfied 90% 78% 93% 76% 72% 85% 82% 76% 82% 57% 73% 78% 50% 55% Neutral 9% 19% 7% 19% 28% 5% 12% 19% 10% 39% 23% 18% 40% 40% Dissatisfied 1% 3% 0% 4% 0% 10% 6% 5% 8% 4% 4% 4% 10% 5% Protocol/ Horizontal Equity Satisfied 74% 84% 87% 74% 78% 67% 83% 81% 54% 65% 75% 73% 70% 58% Neutral 24% 13% 6% 25% 19% 31% 15% 18% 38% 35% 20% 20% 22% 36% Dissatisfied 2% 4% 7% 1% 3% 2% 2% 1% 8% 0% 5% 6% 8% 6% Accuracy/ Timeliness/ Honesty Satisfied 80% 81% 86% 69% 61% 64% 74% 71% 51% 69% 70% 80% 46% 45% Neutral 18% 15% 10% 27% 33% 19% 15% 22% 36% 31% 25% 14% 34% 37% Dissatisfied 2% 5% 4% 4% 6% 17% 12% 6% 13% 0% 4% 6% 20% 18% Overall Satisfaction Satisfied 82% 74% 90% 68% 71% 90% 87% 79% 50% 71% 81% 85% 50% 70% Neutral 18% 22% 10% 26% 21% 10% 8% 18% 40% 29% 18% 11% 36% 30% Dissatisfied 0% 4% 0% 5% 7% 0% 5% 4% 10% 0% 2% 4% 14% 0% Compliance Action - Overall Satisfaction Satisfied 93% 94% 73% 100% 81% 100% 74% 88% 53% 83% 63% 80% 67% 100% Neutral 0% 0% 20% 0% 19% 0% 19% 12% 16% 17% 36% 17% 27% 0% Dissatisfied 7% 6% 7% 0% 0% 0% 7% 0% 32% 0% 2% 3% 6% 0% Compliance Action - Initial Meeting Satisfied 95% 88% 100% 100% 89% 100% 91% 100% 92% 100% 67% 70% 74% 100% Neutral 0% 0% 0% 0% 11% 0% 4% 0% 4% 0% 32% 20% 26% 0% Dissatisfied 5% 13% 0% 0% 0% 0% 5% 0% 4% 0% 1% 10% 0% 0% Compliance Action - Subsequent Interactions Satisfied 88% 92% 85% 92% 79% 100% 84% 81% 74% 75% 57% 60% 71% 100% Neutral 13% 0% 15% 8% 21% 0% 10% 19% 16% 25% 41% 27% 27% 0% Dissatisfied 0% 8% 0% 0% 0% 0% 6% 0% 11% 0% 3% 13% 2% 0% Compliance Action - Final Resolution Satisfied 83% 75% 75% 100% 57% 100% 78% 82% 67% 92% 55% 64% 61% 100% Neutral 17% 19% 0% 0% 43% 0% 14% 18% 6% 8% 42% 25% 39% 0% Dissatisfied 0% 6% 25% 0% 0% 0% 8% 0% 28% 0% 3% 11% 0% 0% 9

12 Special Analysis Past analysis of the ITG customer base revealed similarities between the Alaska Native Villages and the Navajo Chapters. Both segments tend to be remotely located, have smaller government structures, few large business or gaming operations, and meager staff resources. In 2006, ITG implemented several initiatives in Alaska to increase our visibility and impact among those taxpayers, resulting in a greatly increased satisfaction rate among the Alaska customers. In 2008 ITG applied lessons learned in Alaska to the Navajo Chapters, with the same result of increased satisfaction from the Navajo Chapters. Table 7 shows the results of these continued efforts. The satisfaction ratings for both Alaska and the Navajo Chapters have increased in every category. In comparison, ratings for the rest of the US have all decreased in the past year. Since Alaska and Navajo customers are responding positively to the specialized attention, continued focus on these customers is required in order to meet their needs. Table 7 ITG Customer Satisfaction Survey Scores - Special Analysis ALASKA NAVAJO CHAPTERS ALL OTHERS FY 2009 FY 2011 FY 2009 FY 2011 FY 2009 FY 2011 Burden/Delivery of Information Satisfied 73% 77% 49% 50% 82% 79% Neutral 20% 15% 35% 26% 11% 15% Dissatisfied 7% 8% 17% 24% 7% 6% Collaborate Satisfied 64% 67% 45% 50% 70% 66% Neutral 25% 23% 38% 42% 18% 23% Dissatisfied 12% 10% 17% 8% 12% 11% Recognition Satisfied 69% 78% 51% 55% 83% 76% Neutral 24% 18% 37% 40% 13% 19% Dissatisfied 6% 4% 13% 5% 5% 5% Protocol/Horizontal Equity Satisfied 73% 73% 50% 58% 85% 78% Neutral 23% 20% 40% 36% 12% 21% Dissatisfied 4% 6% 10% 6% 3% 2% Accuracy/Timeliness/Honesty Satisfied 70% 80% 46% 45% 73% 72% Neutral 25% 14% 34% 37% 19% 22% Dissatisfied 4% 6% 20% 18% 8% 6% Overall Satisfaction Satisfied 81% 85% 50% 70% 81% 76% Neutral 18% 11% 36% 30% 15% 21% Dissatisfied 2% 4% 14% 0% 4% 3% 10

13 Recommendations ITG should take the following actions relevant to Customer Satisfaction: Post the results of the survey on the ITG web site Share the results with all ITG employees Reconsider the timing of the survey (moving it from summer to late fall) in relation to the low response rate received this year Review areas where ITG scored relatively low, revisit the corresponding program/ services relevant to those areas, and develop actions to implement methods to improve performance Review areas where ITG scored relatively high to see what program /services are working and if any best practices might be ascertained Utilize the regional Consultation Listening meetings (four per year are scheduled in differing BIA regions) in areas where further study is needed to ascertain the reasons for responses/response rates Continue to implement innovative alternative approaches for delivering products/services to tribes located in Alaska and Navajo Chapters Review the processes for actions measured in Compliance - Subsequent Interactions to determine ways to keep the customers better informed Develop and implement communication mechanisms to address the issue of horizontal equity, through ITG News and Consultation Listening meetings Review the effectiveness of the survey effort to determine what changes should be made for next year s survey 11
 in areas where further study is needed to ascertain the")
14 Appendix 12

15 13
DEPARTMENT OF HEALTH AND HUMAN SERVICES STATEMENT OF MR. GARY J. HARTZ, DIRECTOR DIVISION OF ENVIRONMENTAL HEALTH
 DEPARTMENT OF HEALTH AND HUMAN SERVICES STATEMENT OF MR. GARY J. HARTZ, DIRECTOR DIVISION OF ENVIRONMENTAL HEALTH OFFICE OF ENVIRONMENTAL HEALTH AND ENGINEERING INDIAN HEALTH SERVICE BEFORE THE SUBCOMMITTEE
U.S. Department of Education Office of the Chief Financial Officer Fiscal Year 2013 Grantee Satisfaction Survey
 U.S. Department of Education Office of the Chief Financial Officer Fiscal Year 2013 Grantee Satisfaction Survey Final Report December 2013 Department of Education Office of the Chief Financial Officer
OCJS CUSTOMER SATISFACTION SURVEY SUMMARY
 OCJS CUSTOMER SATISFACTION SURVEY SUMMARY Ohio Office of Criminal Justice Services 1970 W. Broad Street, 4th Floor Columbus, Ohio 43223 Toll-Free: (888) 448-4842 Telephone: (614) 466-7782 Fax: (614) 466-0308
Regional Tribal Tax Meeting May 17-18, 2012
 Regional Tribal Tax Meeting May 17-18, 2012 National Congress of American Indians Intertribal Tax Initiative Update & The General Welfare Exclusion as Applied to Indian Tribes Intertribal Tax Initiative
Customer Experience Survey Report
 O F F I C E O F I N S P E C T O R G E N E R A L OFFICE OF INSPECTOR GENERAL EXPORT-IMPORT BANK of the UNITED STATES Customer Experience Survey Report Summary Report Only - Please contact the Office of
Hosting Motivation and Satisfaction Study:
 Hosting Motivation and Satisfaction Study: Feedback from 2006-07 Long-Term Exchange Students, Host Families, and Host School Conducted by surveying a random selection of participants from exchange programs
TREASURY INSPECTOR GENERAL FOR TAX ADMINISTRATION
 TREASURY INSPECTOR GENERAL FOR TAX ADMINISTRATION A Statistical Portrayal of the Taxpayer Advocate Service for Fiscal Years 2005 Through 2009 August 16, 2010 Reference Number: 2010-10-081 This report has
2014 IANA FUNCTIONS CUSTOMER SERVICE SURVEY RESULTS. Survey by Ebiquity Report by Leo Vegoda & Marilia Hirano
 2014 IANA FUNCTIONS CUSTOMER SERVICE SURVEY RESULTS Survey by Ebiquity Report by Leo Vegoda & Marilia Hirano November 2014 Table of Contents Survey objective 1 Executive summary 2 Methodology 4 General
JEFFREY A. LOWE, ESQ. Global Practice Leader - Law Firm Practice Managing Partner - Washington, D.C.
 JEFFREY A. LOWE, ESQ. Global Practice Leader - Law Firm Practice Managing Partner - Washington, D.C. TABLE OF CONTENTS Background... 4 The Survey... 4 Methodology... 5 Statistical Terms Used... 6 Key Findings...
Client Satisfaction Quality Improvement Tool and Sample Surveys
 Client Satisfaction Quality Improvement Tool and Sample Surveys August 2011 Prepared For California Department of Public Health, Office of Family Planning Family PACT Technical Assistance and Training
GAO IRS MANAGEMENT. Challenges Facing the National Taxpayer Advocate
 GAO United States General Accounting Office Testimony Before the Subcommittee on Oversight Committee on Ways and Means House of Representatives For Release on Delivery Expected at 2:30 p.m., EST on Wednesday
MULTNOMAH COUNTY IT HELP DESK SURVEY
 MULTNOMAH COUNTY IT HELP DESK SURVEY JULY 2004 A REPORT FOR THE DEPARTMENT OF BUSINESS SERVICES INFORMATION TECHNOLOGY DIVISION REPORT #006-04 REPORT PREPARED BY: YUKO SPOFFORD ANALYST INTERN BUDGET OFFICE
political Campaign Intervention and Review of 2012 Tax-Elected Applications
 TREASURY INSPECTOR GENERAL FOR TAX ADMINISTRATION Inappropriate Criteria Were Used to May 14, 2013 Reference Number: 2013-10-053 This report has cleared the Treasury Inspector General for Tax Administration
2013 IANA Functions Customer Service Survey Results
 2013 IANA Functions Customer Service Survey Results Survey by Ebiquity Report by Leo Vegoda Please see Errata attached at the end of this document. Revised Version effective March 2015 2013 IANA Functions
A Report on. Customer Service. for Texas Parks and Wildlife Department
 A Report on Customer Service for Texas Parks and Wildlife Department Submitted June 1, 2014 WHAT IS A CUSTOMER? Customers are the most important people in this office. Customers are not dependent on us...
Council of Ambulance Authorities
 Council of Ambulance Authorities Patient Satisfaction Survey 2013 Prepared for: Mojca Bizjak-Mikic Manager, Data & Research The Council of Ambulance Authorities Prepared by: Natasha Kapulski Research Associate
Matrix Analysis of Satisfaction Measures Used by the FASD Diagnostic Teams in the State of Alaska
 Matrix Analysis of Satisfaction Measures Used by the FASD Diagnostic Teams in the State of Alaska FAS Technical Report No. 20 Submitted by: Alaska Comprehensive and Specialized Evaluation Services (ACSES)
2015 Smithsonian Employee Perspective Survey Highlights
 2015 Smithsonian Employee Perspective Survey Highlights Background The Smithsonian has been conducting annual Smithsonian Employee Perspective Surveys (SEPS) since 2007 Survey was administered by Office
TREASURY INSPECTOR GENERAL FOR TAX ADMINISTRATION
 TREASURY INSPECTOR GENERAL FOR TAX ADMINISTRATION Inappropriate Criteria Were Used to May 14, 2013 Reference Number: 2013-10-053 This report has cleared the Treasury Inspector General for Tax Administration
Strategic Uses of Ongoing Fast Feedback Customer Satisfaction Studies
 ABSTRACT Strategic Uses of Ongoing Fast Feedback Customer Satisfaction Studies Joseph Forcillo, Consumers Energy, Jackson, MI Jill Steiner, Cadmus, Lansing, MI Historically, utilities have relied upon
Defining the Customer in a Regulatory Agency
 I. Introduction Defining the Customer in a Regulatory Agency A white paper from the FDA Quality Resource and Development Team September 15, 2004 I. Introduction II. Types of Customers A. Internal Customers
HR Service Survey 2010. UBCC and Executive Presentation SEPTEMBER 2010
 HR Service Survey 2010 UBCC and Executive Presentation SEPTEMBER 2010 Why? HR conducted its last service survey in 2005. The findings resulted in various improvements. It was time to revisit satisfaction
2009-10 Recent Graduate Survey Executive Summary
 2009-10 Recent Graduate Survey Executive Summary Introduction: The purpose of the Recent Graduate Survey was to determine the academic level of preparedness and satisfaction with Penn State Berks programs
PME Inc. Final Report. Prospect Management. Legal Services Society. 2007 Tariff Lawyer Satisfaction Survey
 PME Inc. Prospect Management 2007 Tariff Lawyer Satisfaction Survey Final Report October 2007 Table of Contents 1. EXECUTIVE SUMMARY...6 2. BACKGROUND AND OBJECTIVES...9 3. METHODOLOGY...10 4. DETAILED
SURVEY RESEARCH AND RESPONSE BIAS
 SURVEY RESEARCH AND RESPONSE BIAS Anne G. Scott, Lee Sechrest, University of Arizona Anne G. Scott, CFR, Educ. Bldg. Box 513, University of Arizona, Tucson, AZ 85721 KEY WORDS: Missing data, higher education
Factors Influencing Cotton Producers Choice of Marketing Outlet
 Factors Influencing Cotton Producers Choice of Marketing Outlet E-1036 Oklahoma Cooperative Extension Service Division of Agricultural Sciences and Natural Resources Oklahoma State University Texas A&M
August 2009. Page 1 PSA-2014-00177
 August 2009. Page 1 Page 2 Citizens' Services (Kim Henderson) Introduction to Employee Engagement Engagement Scores at a Glance Your work unit Your organization 76 72 Employee engagement is a concept that
Semiannual Report to Congress. Office of Inspector General
 Semiannual Report to Congress Office of Inspector General Federal Election Commission 999 E Street, N.W., Suite 940 Washington, DC 20463 April 1, 2005 September 30, 2005 November 2005 TABLE OF CONTENTS
TABLE OF CONTENTS. Collection Agency Operations and Technology Survey Page 2 Copyright BillingTree insidearm.com
 Version 6.12.14 TABLE OF CONTENTS IMPACT POINTS... 4 INTRODUCTION... 6 METHODOLOGY... 7 COLLECTIONS DEMOGRAPHICS AND GROWTH TRENDS... 8 BUSINESS STRATEGY: OPPORTUNITIES AND RISKS... 10 IMPACT ON GROWTH/PROFITABILITY...
NACS s Initiatives Regarding Customer Satisfaction Management
 NACS s Initiatives Regarding Customer Satisfaction Management - Studies - Adriana Cîrciumaru National Agency of Civil Servants Romania Who we are The National Agency of Civil Servants (NACS) established
How To Measure An Rsp
 Rule 003 (Formerly EUB Directive 003) Regulated Service Provider (RSP) Service Standard and Reliability Performance, Monitoring, and Reporting Rules The Alberta Utilities Commission (AUC/Commission) has
Descriptive Methods Ch. 6 and 7
 Descriptive Methods Ch. 6 and 7 Purpose of Descriptive Research Purely descriptive research describes the characteristics or behaviors of a given population in a systematic and accurate fashion. Correlational
How to Develop an Effective Customer Satisfaction Survey
 WHITE PAPER DECEMBER 2005 How to Develop an Effective Customer Satisfaction Survey By Ira Kerns, Managing Director, GuideStar Research www.guidestarco.com, 212-426-2333 What to Measure A basic and effective
Deploying a CRM system in practice Understanding the user experience Received (in revised form): 5th February, 2007
: 5th February, 2007") Deploying a CRM system in practice Understanding the user experience Received (in revised form): 5th February, 2007 Yuksel Ekinci is one of the leading international academics in service quality and customer
Deploying a CRM system in practice Understanding the user experience Received (in revised form): 5th February, 2007 Yuksel Ekinci is one of the leading international academics in service quality and customer
2015 IANA Functions Customer Service Survey Results
 2015 IANA Functions Customer Service Survey Results Report on the third annual customer service satisfaction survey administered by Ebiquity Marilia Hirano November 2015 Contents Survey objective... 3
Satisfaction Survey Results
 Satisfaction Survey Results FY 2013-2014 4th Quarter Support Incorporated believes stakeholder satisfaction is essential to effective community collaboration and delivery of behavioral health services.
Council of Ambulance Authorities
 Council of Ambulance Authorities National Patient Satisfaction Survey 2015 Prepared for: Mojca Bizjak-Mikic Manager, Data & Research The Council of Ambulance Authorities Prepared by: Dr Svetlana Bogomolova
REPORT. compete with top health plans. As they achieve their objectives they continually set tougher and more ambitious
 INSIGHT Highly successful health plans set high standards REPORT for themselves, aligning their goals to compete with top health plans. As they achieve their objectives they continually set tougher and
For further information contact:
 I This Code of Research Ethics model was developed for the purpose of guiding policies and procedures for collaborative research projects between academic institutions and Native American tribal communities.
2014 Washington State Health Care Authority Adult Medicaid Health Plan CAHPS Report
 State of Washington Health Care Authority 2014 Washington State Health Care Authority Adult Medicaid Health Plan CAHPS Report December 2014 3133 East Camelback Road, Suite 300 Phoenix, AZ 85016 Phone 602.264.6382
The University of Texas at Austin
 REPORT ID: 721 Introduction & Survey Framework... 1 Organization Profile & Survey Administration... 2 Overall Score & Participation... 3 Construct Analysis... 4 Areas of Strength... 5 Areas of Concern...
Deciding whether to move to an electronic health
 Contemplating the purchase of an EHR? Results of our informal survey may help. An EHR User-Satisfaction Survey: Advice From 408 Family Physicians Robert L. Edsall and Kenneth G. Adler, MD, MMM ROBIN JAREAUX
Satisfaction in the Workplace
 Satisfaction in the Workplace Sara Foshee This paper was written for Dr. Kraemer!s Survey Research course. Workplace satisfaction is a important issue for Human Resource and Company Wellness officers.
EXECUTIVE SUMMARY TRIBAL CONSULTATIONS APRIL/MAY 2012
 U.S. DEPARTMENT OF THE INTERIOR OFFICE OF THE ASSISTANT SECRETARY - INDIAN AFFAIRS EXECUTIVE SUMMARY TRIBAL CONSULTATIONS APRIL/MAY 2012 Bronner Group, LLC Executive Summary 2 This final report represents
Performance Management Handbook. City of American Canyon
 Performance Management Handbook City of American Canyon 1 TABLE OF CONTENTS Introduction 1 Background on performance management City Core competencies Performance management model Development of the Core
Admissions Division of Student Affairs & Enrollment Management Page 1 of 26
 Division of Student Affairs & Enrollment Management Office of Undergraduate Admissions Assessment Summary Report for FY08 FY12 January 2013 1. Executive Summary a. The Office of Undergraduate Admissions
Worst of the Worst Franchises
 FranchiseBusinessREVIEWTM Sharing the franchise experience Worst of the Worst Franchises 2007 Franchisee Satisfaction Study 2007 Franchise Business Review. All Rights Reserved. www.franchisebusinessreview.com
Texas Optometry Board
 Report on Customer Service June 2016 Texas Optometry Board Texas Optometry Board Report on Customer Service Page 1 Contents Report on Customer Service... 3 Categories of Customers Surveyed... 3 Categories
PERFORMANCE REPORT IOWA PUBLIC EMPLOYEES RETIREMENT SYSTEM. Performance Results Achieved for Fiscal Year 2005
 IOWA PUBLIC EMPLOYEES RETIREMENT SYSTEM PERFORMANCE REPORT Performance Results Achieved for Fiscal Year 2005 Submitted January 6, 2006 in compliance with the Iowa Accountable Government Act 1 TABLE OF
The History and Advantages of a Tribal Workers Compensation Program. Presented by Bob Dahl, TWC Program Manager
 The History and Advantages of a Tribal Workers Compensation Program Presented by Bob Dahl, TWC Program Manager Program Objectives Understanding of Workers Compensation The History of Tribal Workers Compensation
Consumer Advocate Tax Summit. Thomas H. Mattox Commissioner, New York State Department of Taxation and Finance
 Consumer Advocate Tax Summit Thomas H. Mattox Commissioner, New York State Department of Taxation and Finance Agenda Congratulations Advocacy feedback produces results New for 2014 tax filing season Customer
Staff Performance Evaluation Training. Office of Human Resources October 2014
 Staff Performance Evaluation Training Office of Human Resources October 2014 Documents Suggestion: Have copies of the following documents available during this presentation Core Competencies Staff Self-Evaluation
Our Lady of the Lake University
 Our Lady of the Lake University Executive Summary 2010 ID: 875 Executive Summary Table of Contents Introduction 1 Survey Framework & Administration 1 Organization Profile 2 Synthesis Score & Response Rates
Purchasing Performance Audit MARSHALL UNIVERSITY. 101 Southpointe Drive, Suite E Edwardsville, IL 62025 v.618.692.9085 f.618.692.
 Purchasing Performance Audit MARSHALL UNIVERSITY 101 Southpointe Drive, Suite E Edwardsville, IL 62025 v.618.692.9085 f.618.692.9086 Issue Date: January 4, 2011 TABLE OF CONTENTS 1. INTRODUCTION AND EXECUTIVE
Michigan State University Human Resources
 MSU Human Resources Customer Experience Survey 2013 Survey of MSU Faculty & Staff Summary Report prepared by Michigan State University Human Resources March 2014 Survey conducted by Office for Survey Research
ABC COMPANY EMPLOYEE PERCEPTION SURVEY
 ABC COMPANY EMPLOYEE PERCEPTION SURVEY Prepared By SDS ABC Company,. Page 1 TABLE OF CONTENTS Overview 4 Summary 6 PAGE Conclusions and Recommendations 15 QUESTION BY QUESTION 17 Dept 18 Do you have employees
2015 CFPB annual employee survey
 2015 CFPB annual employee survey December 2015 Introduction Interpretation of results More than 79 percent of the CFPB employee population responded to the fourth annual employee survey conducted by the
DGS Customer Satisfaction Survey An action plan to improve customer service
 DGS Customer Satisfaction Survey An action plan to improve customer service One of the Department of General Services (DGS ) primary objectives is to continuously strengthen its culture of customer service.
2014 CFPB annual employee survey
 2014 CFPB annual employee survey December 2014 Introduction Interpretation of results More than 83 percent of the CFPB employee population responded to the third annual employee survey conducted by the
UNH Graduate Education Department. Quarterly Assessment Report
 First Quarter Assessment Report UNH Graduate Education Department Quarterly Assessment Report First Quarter i First Quarter Assessment Report Table of Contents Introduction... Section - Purpose of the
Tarleton State University 2015
 REPORT ID: 713 Introduction & Survey Framework... 1 Organization Profile & Survey Administration... 2 Overall Score & Participation... 3 Construct Analysis... 4 Areas of Strength... 5 Areas of Concern...
Table of Contents. FY 2013-2018 BLS Strategic Plan... 2. Our Strategies and Goals... 6. Strategy Framework... 8. Strategy 1 (Products)...
...") Table of Contents FY 2013-2018 BLS Strategic Plan... 2 Our Strategies and Goals... 6 Strategy Framework... 8 Strategy 1 (Products)... 8 Strategy 2 (Product and Process Improvement)...10 Strategy 3 (Customers)...12
Table of Contents FY 2013-2018 BLS Strategic Plan... 2 Our Strategies and Goals... 6 Strategy Framework... 8 Strategy 1 (Products)... 8 Strategy 2 (Product and Process Improvement)...10 Strategy 3 (Customers)...12
BUREAU OF INDIAN EDUCATION COMMUNICATIONS PLAN
 BUREAU OF INDIAN EDUCATION COMMUNICATIONS PLAN SEPTEMBER 2015 Background The Bureau of Indian Education (BIE), formerly known as the Office of Indian Education Programs, is housed within the U.S. Department
Results & Key Findings
 Results & Key Findings Sample Customer Service Assessment (Overview) 310.652.5678 fax 310.652.5677 www.profitablesolutions.com TABLE OF CONTENTS METHODOLOGY.. ii EXECUTIVE SUMMARY Alignment Comparison..
OFFICE OF INSPECTOR GENERAL
 Department of Health and Human Services OFFICE OF INSPECTOR GENERAL MEDICARE BENEFICIARY SATISFACTION WITH DMERC SERVICES JUNE GIBBS BROWN Inspector General JUNE 1997 OEI-02-96-00200 EXECUTIVE SUMMARY
How To Write An Appraisal Program
 Table of Contents Introduction 2 Instructions 3 Glossary 4 Program Information 5 1. Coverage 5 2. Appraisal Period 6 3. Minimum Appraisal Period 6 4. Summary Levels 7 5. Element Appraisal (Expectations)
Drivers of Client Satisfaction in Retirement Markets
 Drivers of Client Satisfaction in Retirement Markets Embracing Retention as a Driver of Growth Providing Actionable Market Research to the World s Leading Financial Services Firms Introduction to Chatham
GAO PERFORMANCE MANAGEMENT SYSTEMS. IRS s Systems for Frontline Employees and Managers Align with Strategic Goals but Improvements Can Be Made
 GAO United States General Accounting Office Report to Congressional Requesters July 2002 PERFORMANCE MANAGEMENT SYSTEMS IRS s Systems for Frontline Employees and Managers Align with Strategic Goals but
CDPHP CAHPS 4.0 Adult Medicaid Health Plan Survey
 CAHPS 4.0 Adult Medicaid Health Plan Survey Continuous Quality Improvement Report February 2012 3975 Research Park Drive Ann Arbor, MI 48108 Table of Contents Background 1 Executive Summary 2 CAHPS 4.0
Sample Satisfaction Surveys
 Continuous Quality Improvement Tool Kit Sample Satisfaction Surveys Page 15 Emergency Services Satisfaction Survey [Organization] strives to treat all clients with dignity, respect and fairness. We also
Objectives 3/27/12. Process Improvement: The Customer is Not the Problem. Rosa West PhD, MBA, LMHC, LMFT. Westcare Wellness & ConsulHng, LLC
 Process Improvement: The is Not Process Improvement: The is not the Problem Rosa West PhD, MBA, LMHC, LMFT This product was supported by the Florida Department of Children & Families Substance Abuse and
Office of the Inspector General U.S. Department of Justice
 Office of the Inspector General U.S. Department of Justice Audit of the Office on Violence Against Women Tribal Domestic Violence and Sexual Assault Coalitions Grants Awarded to the Native Alliance Against
A study of Native American small business ownership: opportunities for entrepreneurs
 ABSTRACT A study of Native American small business ownership: opportunities for entrepreneurs Martin S. Bressler Southeastern Oklahoma State University Kitty Campbell Southeastern Oklahoma State University
Revenue Administration: Performance Measurement in Tax Administration
 T e c h n i c a l N o t e s a n d M a n u a l s Revenue Administration: Performance Measurement in Tax Administration William Crandall Fiscal Affairs Department I n t e r n a t i o n a l M o n e t a r
Welcome. Taxpayer Advocate Service. Your Voice at the IRS. Our Mission
 Taxpayer Advocate Service Your Voice at the IRS 1 Welcome 2 Our Mission We help taxpayers resolve problems with the IRS and recommend changes to prevent the problems 3 1 TAS Leadership Nina E. Olson National
Taxpayer Advocate Service. Your Voice at the IRS
 Taxpayer Advocate Service Your Voice at the IRS 1 1 Welcome 2 2 Our Mission We help taxpayers resolve problems with the IRS and recommend changes to prevent the problems 3 3 TAS Leadership Nina E. Olson
Office of the Attorney General Washington, D.C. 20530
 Office of the Attorney General Washington, D.C. 20530 DEPARTMENT OF JUSTICE POLICY ON INDIAN SOVEREIGNTY AND GOVERNMENT-TO-GOVERNMENT RELATIONS WITH INDIAN TRIBES PURPOSE: To reaffirm the Department's
Employee Surveys as a Management Tool. Dr. Mark Ellickson Opinion Research Specialists, LLC
 Employee Surveys as a Management Tool Dr. Mark Ellickson Opinion Research Specialists, LLC Employee Surveys are Used to Improve Organizational Effectiveness Key Indicators Job Satisfaction & Commitment
IMLEMENTATION OF TOTAL QUALITY MANAGEMENT MODEL IN CROATIAN BUREAU OF STATISTICS
 IMLEMENTATION OF TOTAL QUALITY MANAGEMENT MODEL IN CROATIAN BUREAU OF STATISTICS CONTENTS PREFACE... 5 ABBREVIATIONS... 6 INTRODUCTION... 7 0. TOTAL QUALITY MANAGEMENT - TQM... 9 1. STATISTICAL PROCESSES
Prepared for: Your Company Month/Year
 Prepared for: Your Company Month/Year Insightlink Communications 80 South Lake Ave., Suite 680 Pasadena, California 91101 USA T: 866-802-8095 E: info@insightlink.com Web: www.insightlink.com 1 WHAT TO
Arts. Education. In Public Elementary and Secondary Schools 1999 2000 and 2009 10
 Arts Education In Public Elementary and Secondary Schools 1999 2000 and 2009 10 NCES 2012-014 U.S. Department of Education Arts Education In Public Elementary and Secondary Schools 1999 2000 and 2009 10
Office of Information Management
 2012 Annual Consumer Survey Report December 2012 Office of Information Management Arizona Department of Health Services Division of Behavioral Health Services Bureau of Quality Management Operations TABLE
Policies, Procedures, Guidelines and Protocols
 Policies, Procedures, Guidelines and Protocols Document Details Title Complaints and Compliments Policy Trust Ref No 1353-29025 Local Ref (optional) N/A Main points the document This policy and procedure
Customer Care Centers
 Customer Care Centers Audit Report Report Number MS-AR-15-006 June 11, 2015 Highlights Residential and business customers contact the U.S. Postal Service through various toll-free telephone numbers for
ASSESSMENT PLAN UNDERGRADUATE MAJOR IN POLITICAL SCIENCE. Mission Statement
 ASSESSMENT PLAN UNDERGRADUATE MAJOR IN POLITICAL SCIENCE Mission Statement The Department of Political Science aims to provide instruction that enables students completing the major to acquire a college-level
Centre for Policy Studies,
 Centre for Policy Studies University College Cork National University of Ireland Working Paper Series CPS WP: 13-003 Collecting Earnings Statistics using Payroll Software Lessons from Ireland Steve MacFeely,
Cable Television Community Needs and Interests Assessment Fort Collins, Colorado. By Constance Ledoux Book, Ph.D.
 Cable Television Community Needs and Interests Assessment Fort Collins, Colorado By Constance Ledoux Book, Ph.D. January 2004 CABLE TELEVISION COMMUNITY NEEDS AND INTERESTS SURVEY 1 Executive Summary In
Mission Statement Vision Statement:
 Mission Statement: The mission of the New Mexico Division of Vocational Rehabilitation is to encourage and assist the efforts of New Mexicans with disabilities to reach their goals for working and living
NHSScotland Staff Survey 2015. National Report
 National Report November 2015 Contents 1 Introduction... 3 2 Background... 3 2.1 Survey purpose... 3 2.2 Policy context... 4 3 Survey methodology... 5 4 Response rates... 6 5 Notes to aid interpretation...
Superintendent of Schools
 BOARD OF EDUCATION REQUESTED ANNUAL OPERATING BUDGET Superintendent of Schools Communications Constituent Services General Counsel Appeals Office Prince George s County Public Schools Page 95 BOARD OF
NATIONAL COUNCIL OF NURSING EXECUTIVE SUMMARY OF THE 1998 IHS NURSE SURVEY
 NATIONAL COUNCIL OF NURSING EXECUTIVE SUMMARY OF THE 1998 IHS NURSE SURVEY Introduction The National Council of Nursing (NCON) is a nationwide consortium made up of nurse leaders from the 12 Areas of Indian
Office of Taxpayer Assistance
 Office of Taxpayer Assistance September 17, 2009 The Montana Legislature enacted the Taxpayer Bill of Rights and established the Office of Taxpayer Assistance within the Department of Revenue in 1991.
Management and Budget Customer Survey Overall Satisfaction Ratings
 OFFICE OF THE VICE PRESIDENT FOR MANAGEMENT AND BUDGET Management and Budget Customer Survey Executive Summary In the spring of 0, the Vice President for Management and Budget invited 8 customers, members
Implementation and Effectiveness of the Small Business Health Care Tax Credit
 HEARING BEFORE THE COMMITTEE ON WAYS AND MEANS SUBCOMMITTEE ON OVERSIGHT U.S. HOUSE OF REPRESENTATIVES Implementation and Effectiveness of the Small Business Health Care Tax Credit November 15, 2011 Washington,
NEW YORK STATE OFFICE OF THE STATE COMPTROLLER
 NEW YORK STATE OFFICE OF THE STATE COMPTROLLER H. Carl McCall STATE COMPTROLLER NEW YORK CITY DEPARTMENT OF CITYWIDE ADMINISTRATIVE SERVICES OFFICE OF FLEET ADMINISTRATION MONITORING OF THE VEHICLE MAINTENANCE
Holistic Response Management of Business Surveys at Statistics Canada
 Holistic Response Management of Business Surveys at Statistics Canada Janet Sear, Janet Hughes, Lucie Vinette, Wilf Bozzato Statistics Canada Abstract Statistics Canada (STC) has adopted a strategy for
U.S. Office of Personnel Management 2015 Federal Employee Viewpoint Survey Results for the U.S. Environmental Protection Agency
 1 U.S. Office of Personnel Management 2015 Federal Employee Viewpoint Survey Results for the U.S. Environmental Protection Agency The Office of Personnel Management s Federal Employee Viewpoint Survey
Special Report Sales Tax Study
 Special Report Sales Tax Study February 2001 City Auditor s Office City of Kansas City, Missouri 13-2001 February 7, 2001 Honorable Mayor and Members of the City Council: We conducted this study to identify
Demystifying Data Collection ANA WEBINAR SERIES-MAY 21, 2015
 Demystifying Data Collection ANA WEBINAR SERIES-MAY 21, 2015 acf.hhs.gov/ana HelpDesk (877) 922-9262 Eastern Region Training & Technical Assistance Center www.anaeastern.org 1 (888) 221-9686 A Resource
executive summary permanent tsb
 2014 permanent tsb executive summary The permanent tsb research continues to highlight the lack of mobility in the banking sector relative to the previous research in January 2014. Only 1-in-10 (11%) banking