Back injuries at work,
|
|
|
- Valerie Walters
- 8 years ago
- Views:
Transcription
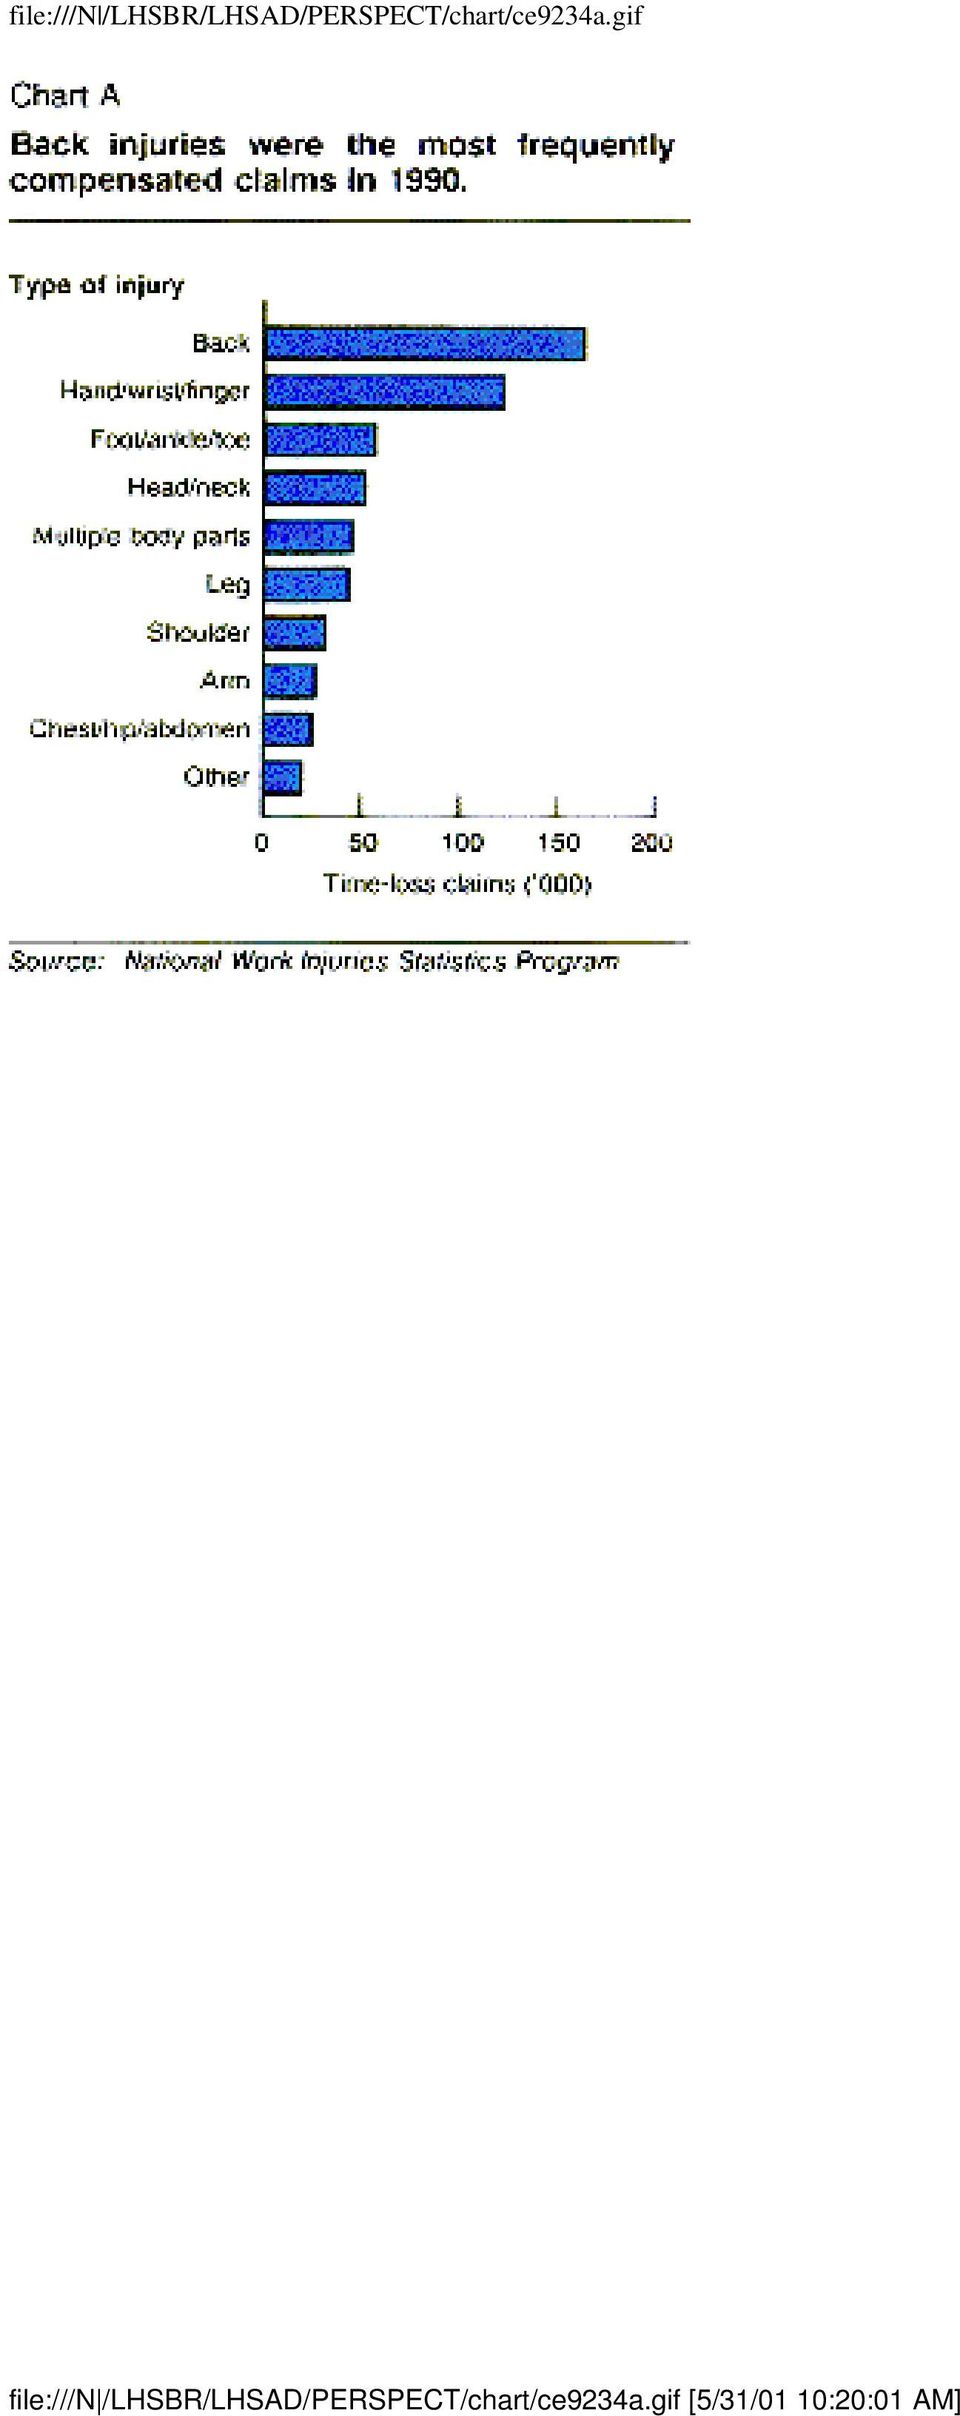
1 Autumn 1992 (Vol. 4, No. 3) Article No. 4 Back injuries at work, Cynthia Haggar-Guénette and Joanne Proulx Work injuries not only cause physical, financial and emotional hardships for workers and their families, but they also reduce employee productivity and morale. Each year, Workers' Compensation Boards in Canada accept more than half a million time-loss claims due to work accidents. More than one-quarter of these claims are for back injuries. (1) Work-related back injuries may be caused, for example, by a single instance of overexertion or develop as a result of repeated motion over time. All workers, however, are not equally likely to sustain back injuries, as some occupations and industries expose men and women to greater risks than do others. This article traces the pattern of growth in the number of back-injury claims accepted by Workers' Compensation Boards during the last decade. It also outlines the characteristics of workers filing those claims, and describes the nature of their injuries and the circumstances in which they occurred. (2) Most common injury Throughout the past decade, back injuries accounted for more Workers' Compensation claims than injuries to any other body part. In 1990, for example, Workers' Compensation Boards across Canada paid lost time benefits to workers for 164,000 back injuries. (3) The next most common claims were for hand, wrist or finger injuries (122,000). The number of other time-loss claims ranged from 56,000 for foot, ankle or toe injuries down to 25,000 for injuries to the chest, hips or abdomen (Chart A). Chart A Back injuries were the most frequently compensated claims in Source: National Work Injuries Statistics Program file:///n /LHSBR/LHSAD/PERSPECT/Pe9234.htm (1 of 8) [5/31/01 10:19:18 AM]

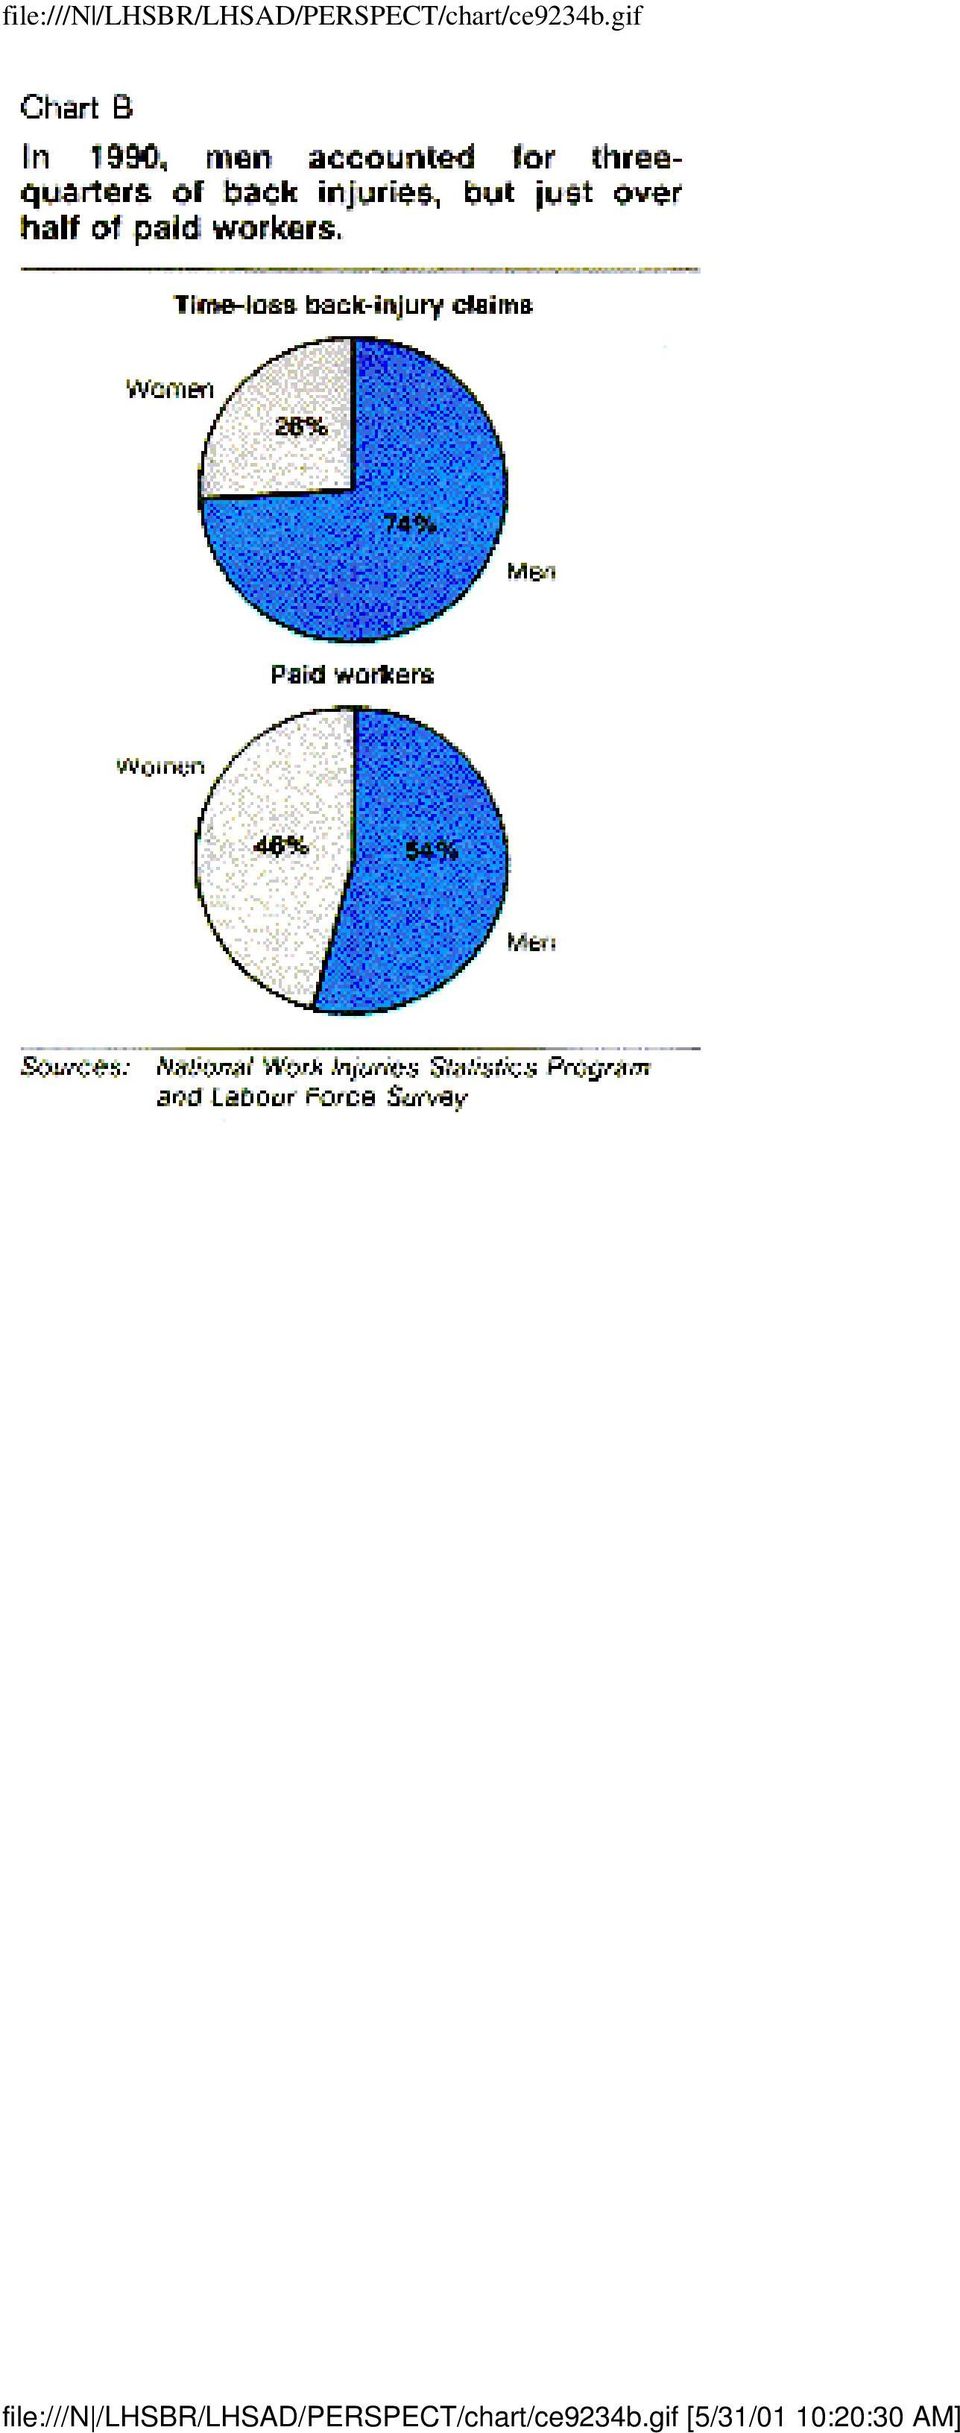
2 During the 1980s, claims for back injuries rose faster than claims for other injuries. Back-injury claims grew 33% between 1982 and 1990, while other injury claims increased only 18%. Thus, back injuries constituted a gradually rising share of compensated work injuries: 28% in 1990, compared with 26% in (Note: The drop in claims for all types of injuries between 1989 and 1990 (Table 1) may be partly attributed to plant closures and layoffs stemming from the economic recession.) (4) Table 1 Time-loss claims by sex, 1982 to 1990.* Source: National Work Injuries Statistics Program * The Yukon is excluded from work injuries data. Men make most back-injury claims Far more men than women suffer work-related back injuries (121,000 compared with 42,000 in 1990). This undoubtedly reflects the concentration of men in industries and occupations where accidents tend to occur. In 1990, men accounted for 74% of all time-loss back-injury claims, although they comprised 54% of paid workers (5) (Chart B). Chart B In 1990, men accounted for three-quarters of back injuries, but just over half of paid workers. Source: National Work Injuries Statistics Program and Labour Force Survey However, among people filing claims, women were more likely than men to have injured their backs. Nearly one-third of women's time-loss claims in 1990 were for back injuries, compared with just over one-quarter of men's claims. As well, women's share of back-injury claims increased throughout the 1980s. By 1990, 26% of backinjury claims were made by women, compared with just 18% in 1982 (Table 1). Much of this rise mirrors the increase in women's labour force participation, as well as expansion of Workers' Compensation coverage to the service sector, (6) where many women are employed and where most of their claims file:///n /LHSBR/LHSAD/PERSPECT/Pe9234.htm (2 of 8) [5/31/01 10:19:18 AM]
 (4) Table 1 Time-loss claims by sex, 1982 to 1990.* Source: National Work Injuries Statistics Program * The Yukon is excluded from work injuries data.")
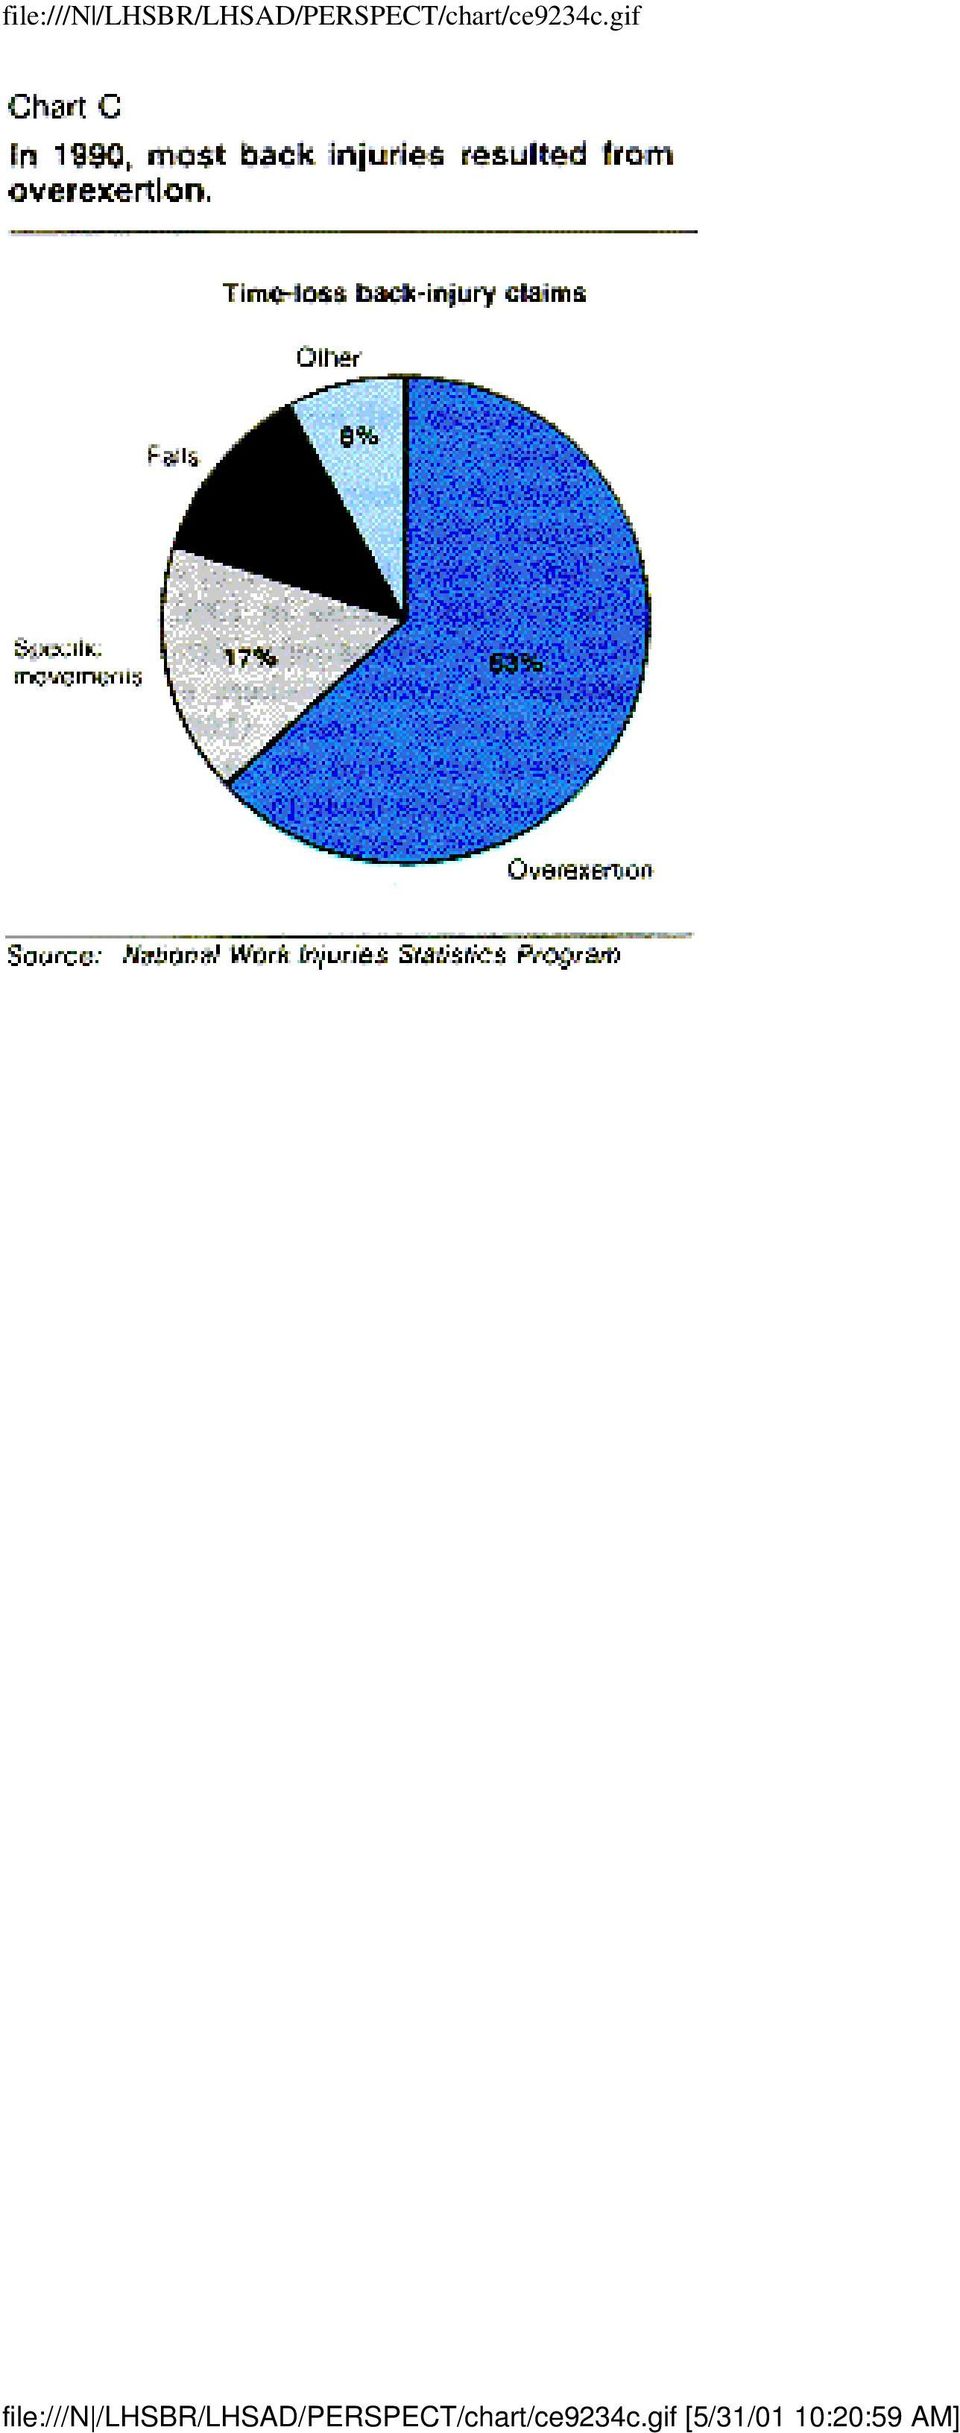
3 originate. Different age patterns for men and women Overall, back-injury claims tend to be made by younger workers. But this general trend is a reflection of men's back injuries, which constitute three-quarters of all claims. In fact, the ages at which male and female workers are likely to experience back injuries differ. The majority of male workers who made back-injury claims in 1990 were under age 35. That year, 37% of men with back-injury claims were aged 25 to 34, surpassing the proportion of employed men in this age range (29%). Another 17% were aged 15 to 24, roughly the same as their share of paid workers (18%). On the other hand, fewer than half (46%) of men making back-injury claims were aged 35 and over, although 53% of employed men were in this age group (Table 2). Table 2 Back-injury time-loss claims and paid workers by selected characteristics, Source: National Work Injuries Statistics Program and Labour Force Survey Men make most back-injury claims Women making back-injury claims tend to be older. Fully 54% of women with back injuries were aged 35 and over, whereas this age group represented 50% of female workers. Just under a third (31%) of women with back-injury claims were aged 25 to 34, closely matching the proportion of female workers in this age group (30%). The remaining 15% of women making claims were aged 15 to 24, even though this age group represented 20% of female workers. Overexertion is main cause In 1990, almost all back injuries were sprains or strains (83%). Another 5% were impact injuries, while a variety of other conditions, such as inflammations and multiple injuries, made up the remaining 12%. Overexertion was the major cause of back injuries (Chart C). Nearly two-thirds (63%) of all job-related back injuries sustained by both men and women in 1990 were due to overexertion, usually while lifting heavy objects. (7) Another 17% of back injuries were the result of specific movements (for example, file:///n /LHSBR/LHSAD/PERSPECT/Pe9234.htm (3 of 8) [5/31/01 10:19:18 AM]
.")
4 stretching to move a patient in bed) or involuntary movements (for instance, recovering from a slip on a wet floor). Falls accounted for about 12% of all back injuries. Most of the falls experienced by women were from the same level (onto floors or against objects), but about half of those experienced by men were from elevations, such as ladders, stairs, or vehicles. Chart C In 1990, most back injuries resulted from overexertion. Source: National Work Injuries Statistics Program Risk related to industry Not surprisingly, back-injury claims are distributed unevenly among industries because of variations in the physical effort required to produce different goods and services. In addition, coverage of workers in high-risk industries, such as forestry and construction, may vary by province. In 1990, 29% of back-injury claims originated in manufacturing, although these industries employed just 17% of the paid workforce. The pattern was similar in health and social services, (8) the source of 13% of claims, but just 10% of the paid workforce. As well, in construction, the proportion of claims for back injuries (9%) exceeded that industry's share of paid workers (6%). By contrast, industries normally associated with little physical effort accounted for relatively few backinjury claims. For instance, the proportion of claims originating in education (2%) was far surpassed by the percentage of workers employed in this industry (7%). Injury-prone occupations Of course, the probability of experiencing a back injury is directly linked to a worker's occupation and the related daily tasks. Much of the difference in the prevalence of back-injury claims among industries, and indeed, between men and women, is attributable to the clustering of occupations within industries and also to the relative concentration of men and women in these occupations. Among men, six blue-collar occupation groups accounted for over 70% of back-injury claims: product fabricating, assembling and repairing; construction trades; transport equipment operating; material handling; processing; and machining. However, together these occupations represented only 39% of male workers. More specifically, back-injury claims were most common among men employed in occupations that file:///n /LHSBR/LHSAD/PERSPECT/Pe9234.htm (4 of 8) [5/31/01 10:19:18 AM]

5 involve lifting, for example, truck drivers, (9) longshoremen, construction labourers, and motor vehicle mechanics and repairmen. By contrast, back injuries were rare among men in most white-collar occupations. For instance, just 1% of back-injury claims were made by men in managerial or administrative positions, whereas 15% of male workers were employed in these occupations. The pattern was similar in natural sciences, social sciences, and teaching, as well as in clerical and sales occupations. Among women, the distribution of back-injury claims by occupation differed from that of men. Fully 33% of women with claims for back injuries in 1990 worked in health-related occupations, far above the proportion of female workers employed in this occupation group (10%). Service occupations accounted for another 22% of back-injury claims made by women, whereas 15% of women worked in such jobs. And although few women have blue-collar occupations, they represented a relatively large share of back injuries. In 1990, 15% of the women who made back-injury claims worked in product fabricating, assembling and repairing, processing, or material handling, yet just 6% of female workers were employed in these occupations. As is the case for men, back injuries tend to be experienced by women in jobs that require considerable physical exertion. For instance, nurses, chefs and cooks, waitresses, janitors and cleaners accounted for relatively large shares of women's back-injury claims. A small number of back-injury claims in some occupations does not necessarily mean that few workers are being injured. Instead, it may reflect a low level of coverage by Workers' Compensation. For example, many workers in beauty and barber shops, and laundries and cleaners are excluded from coverage under some provincial Workers' Compensation Acts. Summary Throughout the 1980s, back injuries increased faster than other compensable injuries, so that by 1990 they constituted 28% of time-loss claims. Despite rapid growth in the number of women filing such claims, they were still far outnumbered by men. Men in blue-collar occupations such as fabricating, assembling and repairing, construction trades, transport equipment operating, and material handling were over-represented among back-injury claimants. On the other hand, among women those working in health-related and service occupations accounted for the highest proportions of back injuries. Given the nature of work in these occupations, it is not surprising that the majority of these injuries were sprains or strains due to overexertion. file:///n /LHSBR/LHSAD/PERSPECT/Pe9234.htm (5 of 8) [5/31/01 10:19:18 AM]

6 Time-loss injury claims A time-loss work injury or illness is one that is serious enough for an individual to take time off work to recover. Time-loss injuries and illnesses may result from accidents, the environment, or specific working conditions. Employees injured at work must apply to provincial Workers' Compensation Boards to receive compensation for lost wages. The level of compensation differs by province. The National Work Injuries Statistics Program (NWISP) collects data from administrative records on time-loss claims accepted by all Workers' Compensation Boards in Canada, except the Yukon. NWISP publishes the age and sex of an injured worker, the occupation and industry, the nature and source of the injury, the body part injured, and the accident that resulted in the injury. Data are not collected on the benefits paid to injured workers, and claims for medical expenses that did not involve time off work are excluded. Notes Note 1 Back injuries include injuries to the back muscles, spine, spinal cord, thoracic spine, lumbar spine, sacrum and coccyx. Note 2 No national data are available on the number of days lost from work specifically because of back injuries. The Absence from Work Survey (AWS), an annual supplement to Statistics Canada's Labour Force Survey, collects data on all work absences of two or more weeks. According to the AWS, 49% of individuals receiving Workers' Compensation in 1990 were absent from work for two to five weeks. (Contact Mike Sivyer at (613) for more information.) In addition, Labour Canada (1991) estimates that in the 1990s, injured workers will lose an average of 30 days per year for work-related accidents or illnesses. Little national information is available on the cost of back injuries to Workers' Compensation Boards or to workers sustaining these injuries. Labour Canada publishes the cost of benefits paid to injured workers for medical aid, hospitalization, pensions, and lost earnings, but does not have such data for back injuries specifically. Approximately $1.8 billion was paid by Workers' Compensation Boards for lost earnings (time-loss claims) out of a total of $3.9 billion in total benefits paid in 1989 (Labour Canada, 1991). According to Statistics Canada's General Social Survey, in 1987, injured workers spent an average of $1,112 per work accident on non-reimbursable out-of-pocket expenses (Millar and Adams, 1991). file:///n /LHSBR/LHSAD/PERSPECT/Pe9234.htm (6 of 8) [5/31/01 10:19:18 AM]
 collects data from administrative records on time-loss claims accepted by all Workers' Compensation Boards in Canada, except the Yukon.")
7 Note 3 Not all work injuries are reported to Workers' Compensation Boards. The General Social Survey found that fewer than half of work accidents causing injury were reported to Workers' Compensation in 1987 (unpublished data). Decisions by supervisors, health staff, or workers themselves, in addition to the paperwork involved, may result in non-reporting (Webb et al., 1989). Note 4 The drop in work injuries in 1990 is partly attributable to the decline in manufacturing jobs in Ontario and Quebec. Note 5 Paid workers are working owners of incorporated businesses or employed persons who work in an employer-employee relationship. Note 6 Since the early 1980s, several provinces have extended universal coverage to hospitals and other healthrelated organizations. Note 7 A summary of guidelines for weight limits when manually lifting objects is given in Drewczynski (1989). For a discussion of repetitive motion injuries, see Bertolini and Drewczynski (1990), and for a discussion of injuries among women, see Messing (1991). Note 8 See "Focus on three occupations in hospitals" in the highlights section of Work injuries, (Statistics Canada, December 1991). Note 9 See "Focus on truck drivers" in the highlights section of Work injuries, (Statistics Canada, February 1991). References Bertolini, R. and A. Drewczynski. Repetitive motion injuries (RMI), Catalogue CC273-2/90-21E. Ottawa: Canadian Centre for Occupational Health and Safety, Drewczynski, A. "Manual materials handling" (draft). Ottawa: Canadian Centre for Occupational file:///n /LHSBR/LHSAD/PERSPECT/Pe9234.htm (7 of 8) [5/31/01 10:19:18 AM]

8 Health and Safety, April Unpublished study. Haggar-Guénette, C. "Work injuries in Canada, 1982 to 1986." The labour force, Monthly, Catalogue , March Ottawa: Statistics Canada, pp Labour Canada. Occupational injuries and their cost in Canada, , Catalogue L /91B. Ottawa: Occupational Health and Safety Branch, Messing, K. Occupational safety and health concerns of Canadian women: a background paper, Catalogue L /91E. Ottawa: Women's Bureau, Labour Canada, Millar, W. and O. Adams. Accidents in Canada. General Social Survey Analysis Series, No. 3, Catalogue E. Ottawa: Statistics Canada, February Statistics Canada. Work injuries, , Annual, Catalogue Ottawa, February Work injuries, , Annual, Catalogue Ottawa, December Webb, G.R., S. Redman, C. Wilkinson and R.W. Sanson-Fisher. "Filtering effects in reporting work injuries." Accident analysis and prevention, Vol. 21, no. 2, Great Britain, 1989, pp Author Cynthia Haggar-Guénette and Joanne Proulx is with the Labour Division of Statistics Canada. Source Perspectives on Labour and Income, Autumn 1992, Vol. 4, No. 3 (Statistics Canada, Catalogue E). This is the fourth of five articles in the issue. file:///n /LHSBR/LHSAD/PERSPECT/Pe9234.htm (8 of 8) [5/31/01 10:19:18 AM]

9 file:///n /LHSBR/LHSAD/PERSPECT/chart/ce9234a.gif file:///n /LHSBR/LHSAD/PERSPECT/chart/ce9234a.gif [5/31/01 10:20:01 AM]
10 TE92341 Table 1 Time-loss claims by sex, 1982 to 1990* Work injuries Back injuries Total** Men Women Total** Men Women Source: National Work Injuries Statistics Program * The Yukon is excluded from work injuries data. ** Includes claims where sex was not reported. file:///n /LHSBR/LHSAD/PERSPECT/table/te92341.htm [5/31/01 10:20:19 AM]

11 file:///n /LHSBR/LHSAD/PERSPECT/chart/ce9234b.gif file:///n /LHSBR/LHSAD/PERSPECT/chart/ce9234b.gif [5/31/01 10:20:30 AM]
12 TE92342 Table 2 Back-injury time-loss claims and paid workers by selected characteristics, 1990 Back injuries Paid workers Total Men Women Total Men Women All ages ( 000) 162* ,353 6,179 5,174 (%) years years years years years and over All industries ( 000) 163** ,353 6,179 5,174 (%) Agriculture, fishing, forestry, and mining Manufacturing Construction Transportation, communication and other utilities Trade Finance, insurance and real estate Education Health and social services Accommodation, food and beverage services Business services and other services Government services All occupations ( 000) ,353 6,179 5,174 (%) Managerial and administrative Natural science Social science Religion file:///n /LHSBR/LHSAD/PERSPECT/table/te92342.htm (1 of 2) [5/31/01 10:20:49 AM]

13 TE92342 Teaching Medicine and health Artistic Clerical Sales Service Farming, fishing, forestry, and mining Processing Machining Fabricating, assembling and repairing Construction trades Transport equipment operating Material handling Other crafts Sources: National Work Injuries Statistics Program and Labour Force Survey * Excludes 2,072 claims where age was not reported. ** Excludes 1,286 claims where industry was not reported. Excludes 21,655 claims where occupation was not reported. file:///n /LHSBR/LHSAD/PERSPECT/table/te92342.htm (2 of 2) [5/31/01 10:20:49 AM]

14 file:///n /LHSBR/LHSAD/PERSPECT/chart/ce9234c.gif file:///n /LHSBR/LHSAD/PERSPECT/chart/ce9234c.gif [5/31/01 10:20:59 AM]
Discouraged workers - where have they gone?
 Autumn 1992 (Vol. 4, No. 3) Article No. 5 Discouraged workers - where have they gone? Ernest B. Akyeampong One of the interesting but less publicized labour market developments over the past five years
Australian Workers Compensation Statistics, 2012 13
 Australian Workers Compensation Statistics, 2012 13 In this report: Summary of statistics for non-fatal workers compensation claims by key employment and demographic characteristics Trends in serious claims
Creative Commons. Disclaimer. 978-1-74361-779-3 (pdf) 978-1-74361-795-3 (docx)
 978-1-74361-795-3 (docx)") 2011 12 Australian Workers Compensation Statistics In this report: >> Summary of statistics for non-fatal workers compensation claims by key employment and demographic characteristics >> Profiles of claims
2011 12 Australian Workers Compensation Statistics In this report: >> Summary of statistics for non-fatal workers compensation claims by key employment and demographic characteristics >> Profiles of claims
7. Work Injury Insurance
 7. Work Injury Insurance A. General Work injury insurance provides an insured person who is injured at work a right to receive a benefit or other defined assistance, in accordance with the nature of the
MANITOBA WORKPLACE INJURY AND ILLNESS STATISTICS REPORT FOR 2000-2004
 MANITOBA WORKPLACE INJURY AND ILLNESS STATISTICS REPORT FOR 2000-2004 OCTOBER 2005 Manitoba Workplace Injury and Illness Statistics Report for 2000-2004 October 2005 Manitoba Labour and Immigration Workplace
INJURIES by Kathryn Wilkins and Evelyn Park
 Injuries 43 INJURIES by Kathryn Wilkins and Evelyn Park In 2000/01, an estimated 3.4 million Canadians aged 12 or older (13%) were seriously injured (Table A). That is, they sustained an injury severe
Working After Age 65
 ALTERNATIVE FEDERAL BUDGET 2012 TECHNICAL PAPER Working After Age 65 What is at Stake? Angella MacEwen Highlights The OAS and GIS combined today provide one third of the income of all seniors aged over
Employment and Wages for Alberta Workers with a Post-Secondary Education
 Employment and Wages for Alberta Workers with a Post-Secondary Education Abstract Between 2013 and 2017, Alberta s economy is expected to add approximately 163,000 new jobs. 1 In addition, approximately
In 1992, Canadians were stunned
 A job to job die for to die for Katherine Marshall In 1992, Canadians were stunned when 26 miners were buried alive in the Westray Mine in Nova Scotia. Accidental death related to work happens to relatively
WORK-RELATED INJURIES RESULTING IN HOSPITALISATION JULY 2006 TO JUNE 2009
 WORK-RELATED INJURIES RESULTING IN HOSPITALISATION JULY 2006 TO JUNE 2009 February 2013 Safe Work Australia Work-related injuries resulting in hospitalisation July 2006 to June 2009 February 2013 Disclaimer
ON LABOUR AND INCOME. JUNE 2002 Vol. 3, No. 6 HOUSING: AN INCOME ISSUE PENSIONS: IMMIGRANTS AND VISIBLE MINORITIES.
 Catalogue no. 75-001-XIE ON LABOUR AND INCOME JUNE 2002 Vol. 3, No. 6 HOUSING: AN INCOME ISSUE PENSIONS: IMMIGRANTS AND VISIBLE MINORITIES Statistics Canada Statistique Canada Sophie Lefebvre HOUSING IS
Highlights... 3. 1. Introduction... 5. 2. Occupational Health and Safety Initiatives... 6. 6. Demographics of Injured Workers... 49. References...
 TABLE OF CONTENTS Notes About this Report... 2 Highlights... 3 1. Introduction... 5 2. Occupational Health and Safety Initiatives... 6 3. Provincial Summary... 9 4. Industry Sector Summary... 13 5. Industry
Unemployment and Unemployment Insurance: a tale of two sources
 Winter 1989 (Vol. 1, No. 3) Unemployment and Unemployment Insurance: a tale of two sources Jean-Mare Lévesque In 1988, unemployment averaged over one million, based on results from the Labour Force Survey
Work-related injuries experienced by young workers in Australia, 2009 10
 Work-related injuries experienced by young workers in Australia, 2009 10 March 2013 SAFE WORK AUSTRALIA Work-related injuries experienced by young workers in Australia, 2009 10 March 2013 Creative Commons
OCCUPATIONAL INJURIES AND DISEASES IN ALBERTA. Lost-Time and Disabling Injury Claims. Young Workers. 2002 to 2006
 OCCUPATIONAL INJURIES AND DISEASES IN ALBERTA Lost-Time and Disabling Injury Claims Young Workers 2002 to 2006 Summer 2007 TABLE OF CONTENTS Highlights... 2 1. Introduction... 5 2. Young Worker Summary...
Report on Falls from Non-Moving Vehicles
 Report on Falls from Non-Moving Vehicles Trucking Safety Council of BC Earl Galavan, Safety Advisor Table of Contents 1. Introduction 4 2. Background 4 3. Summary Statistics 5 4. General Trucking 6 Jump/Step
Nebraska Occupational Health Indicator Report, 2013
 Occupational Health Indicator Report, 213 Occupational Safety and Health Surveillance Program Department of Health and Human Services Web: www.dhhs.ne.gov/publichealth/occhealth/ Phone: 42-471-2822 Introduction
How To Calculate Lost Time Claim Rate For The Alberta Construction Safety Association (Acsa) In 2006
 In 2006") OCCUPATIONAL INJURIES AND DISEASES IN ALBERTA Lost-Time Claims, Disabling Injury Claims and Claim Rates Alberta Construction Safety Association Industries 2002 to 2006 Summer 2007 TABLE OF CONTENTS Highlights...
OCCUPATIONAL INJURIES AND DISEASES IN ALBERTA Lost-Time Claims, Disabling Injury Claims and Claim Rates Alberta Construction Safety Association Industries 2002 to 2006 Summer 2007 TABLE OF CONTENTS Highlights...
WORK-RELATED INJURIES
 009 10 WORK-RELATED INJURIES 634.0 AUSTRALIA EMBARGO: 11.30AM (CANBERRA TIME) WED NOV 011 CONTENTS Notes... Conceptual framework... Summary of findings... page 3 4 TABLES List of tables... Persons aged
Did you know that you can securely file Form 7 online with our eservices?
 Did you kw that you can securely file Form online with our eservices? eform offers a fast, effective solution for managing your Form reports with the WSIB. To submit an eform, visit our eservices site.
Statistical Bulletin 2008/09. New South Wales Workers Compensation
 Statistical Bulletin 2008/09 New South Wales Workers Compensation This publication is available for download from the WorkCover website: http://www.workcover.nsw.gov.au The WorkCover Assistance Service
A Labour Economic Profile of New Brunswick
 A Labour Economic Profile of New Brunswick January 2016 Table of Contents New Brunswick Highlights........................... 2 Current Business Environment....................... 3 GDP Snapshot....................................
Health risks at work. Statistisches Bundesamt, Wiesbaden, 2009 Author: Page 1. www.destatis.de/kontakt. Destatis, 1 September 2009
 Health risks at work Destatis, 1 September 2009 In 2007, about 2.4 million persons in employment in Germany (6.3%) suffered from work-related health problems, according to information provided by them.
This article answers the question, To what
 Overqualified? Recent graduates, employer needs Marc Frenette This article answers the question, To what extent, if any, have the education levels of graduates surpassed the needs of employers? In other
Early retirement trends
 Patrick Kieran IN THE EARLY 197S, one in five Canadians was 5 or older. By 8, one in three will fall into this age group. This reality has led many researchers to focus on the potential consequences of
Safety at Work data from the Bureau of Labor Statistics. Chart 1
 Safety at Work data from the Bureau of Labor Statistics Chart 1 Safety at Work: Fatal Injuries 2011: 4,609 fatal work injuries Older workers are 4 times more likely to be killed on the job. Over 90 percent
Occupational Injuries and Diseases in Canada, 1996 2008
 Fair, Safe and Productive Workplaces Labour Occupational Injuries and Diseases in Canada, 1996 2008 Injury Rates and Cost to the Economy Jaclyn Gilks and Ron Logan Research and Analysis, Occupational Health
Occupational accident statistics 2010
 Labour Market 2012 Occupational accident statistics 2010 The number of accidents at work in Finland 135,000 in 2010 A total of 135,000 accidents at work occurred in Finland in 2010. Around 124,000 of these
Accidents at Work: Q4/2014
 3 February 2015 1100 hrs 023/2015 Accidents at Work: Q4/2014 Claims in respect of non-fatal accidents at work in the fourth quarter of last year decreased by 29, or 3.7 per cent, compared to the corresponding
Workplace Falls Census of Fatal Occupational In- juries
 Workplace Falls Falls resulting in fatal and nonfatal injuries are a serious safety concern in the workplace. In 997, workplace falls took 75 lives and inflicted 33,335 injuries involving a work absence.
Slipping and Falling on Ice A Serious Workplace Hazard. Injuries to Maine Workers, 2012-2013
 Slipping and Falling on Ice A Serious Workplace Hazard Injuries to Maine Workers, 2012-2013 November 2013 Introduction Snow and ice cover Maine for most of the cold months, transforming our state into
Occupational accident statistics 2008
 Labour Market 2010 Occupational accident statistics 2008 158,000 accidents at work occurred in Finland in 2008 Slightly more than 153,000 accidents at work occurred in Finland in 2008. early 142,000 of
Highlights... 2. 1. Industry Sector Summary... 4. 2. Industry Sector Analysis... 6. 3. Demographics of Injured Workers... 11
 T A B L E O F C O N T E N T S Highlights... 2 1. Industry Sector Summary... 4 2. Industry Sector Analysis... 6 3. Demographics of Injured Workers... 11 4. Injury and Disease Analysis... 13 5. Occupational
7. Work Injury Insurance
 Chapter 3: Benefits: Work Injury Insurance 1 7. Work Injury Insurance A. Work Injury Branch Benefits Work injury insurance is intended to compensate insureds 1 who have been injured at work, in an accident
Accidents at work 2012
 Labour Market 2014 Accidents at work 2012 umber of accidents at work in Finland 139,000 in 2012 A total of 139,000 accidents at work occurred in Finland during 2012. Around 128,000 of these occurred to
Labour Market Bulletin
 Labour Market Bulletin Nova Scotia This Labour Market Bulletin provides an analysis of Labour Force Survey results for the province of Nova Scotia, including the regions of Annapolis Valley, Cape Breton,
2015 Annual Alberta Labour Market Review. Employment. Unemployment. Economic Regions. Migration. Indigenous People. Industries
 2015 Annual Alberta Labour Market Review Employment. Unemployment. Economic Regions Migration. Indigenous People. Industries Occupations. Education. Demographics Employment Despite the economic downturn,
The traditional work schedule for an
 A time to work: recent trends in work and flexible schedules Numerous U.S. workers have work schedules different from the standard 9 a.m.-to-5 p.m., Monday-through-Friday, work ; the demands of the industry
Injured at Work. What workers compensation data reveal about work-related musculoskeletal disorders (WMSDs)
") Injured at Work What workers compensation data reveal about work-related musculoskeletal disorders (WMSDs) Summary of Technical Report Number 40-8a-2004, Work-related Musculoskeletal Disorders in the Neck,
Injured at Work What workers compensation data reveal about work-related musculoskeletal disorders (WMSDs) Summary of Technical Report Number 40-8a-2004, Work-related Musculoskeletal Disorders in the Neck,
Highlights... 2. 1. Introduction... 5. 2. Workplace Health and Safety Initiatives... 6. 6. Demographics of Injured Workers... 51. References...
 TABLE OF CONTENTS Highlights... 2 1. Introduction... 5 2. Workplace Health and Safety Initiatives... 6 3. Provincial Summary... 9 4. Industry Sector Summary... 14 5. Industry Sector Analysis... 17 6. Demographics
Individual Donors to Arts and Culture Organizations in Canada in 2007
 Individual Donors to Arts and Culture Organizations in Canada in 2007 www.hillstrategies.com info@hillstrategies.com Statistical insights on the arts, Vol. 8 No. 3 Hill Strategies Research Inc., February
RISK RESPONSIBILITY REALITY APPENDIX D AUTOMOBILE INSURANCE IN CANADA
 The appendix includes relevant clauses drawn from the Compulsory Minimum Insurance Coverage for Private Passenger Vehicles as prepared by the Insurance Bureau of Canada (FACTS 2005 p. 12-15) used with
A Patient s Guide to Diffuse Idiopathic Skeletal Hyperostosis (DISH)
") A Patient s Guide to Diffuse Idiopathic Skeletal Hyperostosis (DISH) Introduction Diffuse Idiopathic Skeletal Hyperostosis (DISH) is a phenomenon that more commonly affects older males. It is associated
A Patient s Guide to Diffuse Idiopathic Skeletal Hyperostosis (DISH) Introduction Diffuse Idiopathic Skeletal Hyperostosis (DISH) is a phenomenon that more commonly affects older males. It is associated
7. Work Injury Insurance
 Chapter 3: Benefits: Work Injury Insurance 1 7. Work Injury Insurance A. Benefits Work Injury insurance is intended to compensate insured persons 1 who have been injured at work, in an accident 2, or contracted
Saskatchewan Small Business Profile 2015
 Saskatchewan Small Business Profile 2015 October 2015 Ministry of the Economy Performance and Strategic Initiatives Division economy.gov.sk.ca Table of Contents INTRODUCTION... 1 KEY FACTS... 3 1. SMALL
For release 10:00 a.m. (EST) Tuesday, November 26, 2013 USDL-13-2257
 Tuesday, November 26, 2013 USDL-13-2257") For release 10:00 a.m. (EST) Tuesday, November 26, 2013 USDL-13-2257 Technical information: (202) 691-6170 iifstaff@bls.gov www.bls.gov/iif/oshcdnew.htm Media contact: (202) 691-5902 PressOffice@bls.gov
For release 10:00 a.m. (EST) Tuesday, November 26, 2013 USDL-13-2257 Technical information: (202) 691-6170 iifstaff@bls.gov www.bls.gov/iif/oshcdnew.htm Media contact: (202) 691-5902 PressOffice@bls.gov
A WHITE PAPER PRESENTED BY SPECIALIZING IN WORKERS COMPENSATION
 THE TRUTH HURTS A Closer Look At Back Injuries In The Workforce A WHITE PAPER PRESENTED BY SPECIALIZING IN WORKERS COMPENSATION WHY ARE SO MANY WORKERS SUFFERING SO MANY DEBILITATING BACK INJURIES? You
Article. Work absences in 2011. by Maria Dabboussy and Sharanjit Uppal
 Component of Statistics Canada Catalogue no. 75-001-X Perspectives on Labour and Income Article Work absences in 2011 by Maria Dabboussy and Sharanjit Uppal April 20, 2012 Statistics Canada Statistique
Administrative Procedures Memorandum A4007
 Page 1 of 9 Date of Issue May 2015 Original Date of Issue March 2011 Subject WORKPLACE SAFETY AND INSURANCE BOARD (WSIB) CLAIMS References Links Contact Workplace Safety & Insurance Act (Ontario) Human
Employee benefits are an important aspect
 Health and retirement benefits: data from two BLS surveys Both the household-based Current Population Survey and the establishment-based Employee Benefits Survey have strengths and limitations with respect
Workplace Nonfatal. Injuries and Illnesses. Illinois, 1998
 Workplace Nonfatal Injuries and Illnesses Illinois, 1998 A Publication of the Illinois Department of Public Health Division of Epidemiologic Studies Springfield, IL 62761 July 2000 This project was supported
Injury Analysis Report
 Instructions for Injury Analysis Sheet Section A Input all company information into this section, including the firm and rate group number. Ensure that the reporting period is filled out, and is consistent
Rate Group DR. 2007-2011 Profile. Prepared by: Business Information and Analysis (BIA) 2012/07/19
 2012/07/19") 2007-2011 Profile Prepared by: Business Information and Analysis (BIA) 2012/07/19 Base Rates Classification Unit # CU Description 2007 2008 2009 2010 2011 2012 % Change from 2011 to 2012 703003 Cable or
2007-2011 Profile Prepared by: Business Information and Analysis (BIA) 2012/07/19 Base Rates Classification Unit # CU Description 2007 2008 2009 2010 2011 2012 % Change from 2011 to 2012 703003 Cable or
Highlights...2. 1. Industry Sector Summary...4. 2. Industry Sector Analysis...7. 3. Demographics of Injured Workers...13
 TABLE OF CONTENTS Highlights...2 1. Industry Sector Summary...4 2. Industry Sector Analysis...7 3. Demographics of Injured Workers...13 4. Injury and Disease Analysis...15 5. Occupational Fatalities...21
Sickness absence from work in the UK
 Sickness absence from work in the UK 149 Sickness absence from work in the UK By Catherine Barham and Nasima Begum, Labour Market Division, Office for National Statistics Key points In the three months
Which Pays Better: Public or Private Sector Jobs?
 Canadian Centre for Policy Alternatives Ontario July 2014 Which Pays Better: Public or Private Sector Jobs? Settling the Debate Richard Shillington www.policyalternatives.ca RESEARCH ANALYSIS SOLUTIONS
Attachment: Occupational Health and Safety Results 2013 1
 Attachment: Occupational Health and Safety Results 2013 1 Table 1: Injury claims and claim rates, Alberta 2011 to 2013 2011 2012 2013 Change 2011 to 2012 Change 2012 to 2013 Person-Years 1,813,356 1,951,724
Mapping the Non-profit Sector
 Mapping the Non-profit Sector Kathryn McMullen Grant Schellenberg Executive Summary December 2002 Document No. 1 CPRN Research Series on Human Resources in the Non-profit Sector, available at http://www.cprn.org
Manitoba Workplace Injury and Illness Statistics Report
 Manitoba Workplace Injury and Illness Statistics Report 2000-20072007 Index 2.3 Occupations Disease Fatalities... 21 Table 5 - Occupational Disease Fatalities Accepted by the WCB, 2000 to 2007.21 Table
Saskatchewan Small Business Profile 2012
 Saskatchewan Small Business Profile 2012 October 2013 Economic and Competitive Analysis Branch www.economy.gov.sk.ca Table of Contents INTRODUCTION... 1 KEY FACTS... 3 1. SMALL BUSINESS SECTOR... 4 2.
COMPENDIUM OF WORKERS COMPENSATION STATISTICS AUSTRALIA 2006 07. March 2009
 COMPENDIUM OF WORKERS COMPENSATION STATISTICS AUSTRALIA 2006 07 March 2009 Australian Safety and Compensation Council Compendium of Workers Compensation Statistics Australia 2006 07 March 2009 Disclaimer
Men retiring early: How How are they doing? Dave Gower
 Men retiring early: How retiring are they doing? early: How are they doing? Dave Gower During the first half of this century, men generally stayed in the labour force until at least age 65. In the second
ONE INTERESTING DEVELOPMENT in the labour
 Health-related insurance for the self-employed Ernest B. Akyeampong and Deborah Sussman ONE INTERESTING DEVELOPMENT in the labour market in the 199s was the rapid growth of self-employment relative to
Accidents at Work: Q4/2015
 3 February 2016 1100 hrs 019/2016 Accidents at Work: Q4/2015 Claims in respect of non-fatal accidents at work in the fourth quarter of 2015 decreased marginally by 11 when compared with the corresponding
SAFECARE BC MEMBERS INJURY TRENDS PROFILE BY ORGANIZATION SIZE
 SAFECARE BC MEMBERS INJURY TRENDS PROFILE BY ORGANIZATION SIZE March 2015 Page 1 of 36 TABLE OF CONTENTS About SafeCare BC...3 Executive Summary...4 Purpose...5 Limitations...5 Industry Snapshot: Long
Construction Industry Profile
 Construction Industry Profile KEY FACTS 30% of falls injuries were caused by ladders 31% decrease in the rate of serious claims in the construction industry between 2001 02 and 2011 12 20% of serious claims
How To Claim Benefits From The Work Safety And Insurance Board
 F O R M 6 W O R K E R s r e p o r t o f i n j u r y / d i s e a s e R e f e r e n c e G u i d e f o r W O R K E R s PRINT GUIDE ENTER GUIDE Table of Contents What To Do If You have An Accident at Work...........
COMPENDIUM OF WORKERS COMPENSATION STATISTICS AUSTRALIA 2010 11
 COMPENDIUM OF WORKERS COMPENSATION STATISTICS AUSTRALIA 2010 11 March 2013 February 2013 Safe Work Australia Compendium of Workers Compensation Statistics Australia 2010 11 March 2013 Disclaimer The information
Over the past three decades, the share of middle-skill jobs in the
 The Vanishing Middle: Job Polarization and Workers Response to the Decline in Middle-Skill Jobs By Didem Tüzemen and Jonathan Willis Over the past three decades, the share of middle-skill jobs in the United
Workplace Nonfatal. Injuries and Illnesses. Illinois, 2001
 Workplace Nonfatal Injuries and Illnesses Illinois, 2001 A Publication of the Illinois Department of Public Health Division of Epidemiologic Studies Springfield, IL 62761 July 2003 This project was supported
Access to meaningful, rewarding and safe employment is available to all.
 Home Previous Reports Links Downloads Contacts The Social Report 2002 te purongo oranga tangata 2002 Introduction Health Knowledge and Skills Safety and Security Paid Work Human Rights Culture and Identity
The proportion of all nonfatal
 Restricted work due to workplace injuries: a historical perspective In anticipation of upcoming data on worker characteristics and on case circumstances surrounding workplace injuries that result in job
CONTRACT RESEARCH REPORT. Workplace injuries and workforce trends HSE
 HSE Health & Safety Executive Workplace injuries and workforce trends Prepared by the Institute for Employment Research for the Health and Safety Executive CONTRACT RESEARCH REPORT 281/2001 HSE Health
Accidents at Work: Q2/2015
 20 August 2015 1100 hrs 152/2015 Accidents at Work: Q2/2015 Claims in respect of non-fatal accidents at work in the second quarter of 2015 decreased by 125, or 14.6 per cent, compared to the corresponding
EMPLOYMENT PROJECTIONS 2012-2022
 For release 10:00 a.m. (EST) Thursday, December 19, 2013 USDL-13-2393 Technical information: (202) 691-5700 ep-info@bls.gov www.bls.gov/emp Media contact: (202) 691-5902 PressOffice@bls.gov EMPLOYMENT
TRADE UNION MEMBERSHIP 2014. Statistical Bulletin JUNE 2015
 TRADE UNION MEMBERSHIP 2014 Statistical Bulletin JUNE 2015 Contents Contents... 2 Introduction... 3 Key findings... 5 1. Long Term Trends... 6 2.Private and Public Sectors. 12 3. Personal and job characteristics...
Truckies, posties and warehouse workers top the list of Australia s most dangerous jobs
 Press release FOR EMBARGOED RELEASE ON Monday October 20, 2014 Michelle Hutchison Head of PR & Money Expert finder.com.au +61403 192 994 +61 2 9299 7602 Michelle@finder.com.au Truckies, posties and warehouse
FATAL WORK INJURIES IN MINNESOTA 2012
 MIDWEST INFORMATION OFFICE Chicago, Ill. For release: Thursday, November 21, 2013 13-2155-CHI Technical information: (312) 353-1880 Media contact: (312) 353-1138 BLSInfoChicago@bls.gov www.bls.gov/ro5
Trends in part-time and temporary work
 Trends in part-time and temporary work This analysis has been carried out using the latest available quarterly data from the Labour Force Survey. This was used to examine trends in temporary and part-time
THE NEED FOR PROTECTION A DISABILITY CAN HAPPEN TO ANYONE...AT ANY TIME.
 THE NEED FOR PROTECTION A DISABILITY CAN HAPPEN TO ANYONE...AT ANY TIME. In the last 10 minutes, 490 Americans became disabled. In 2008, there were 2.1 million disabling injuries caused by a motor vehicle
Return to Work Rates & Other Selected Characteristics of Workers Compensation Claimants
 Return to Work Rates & Other Selected Characteristics of Workers Compensation Claimants Data Supplement to Report of the Commissioner on Return to Work Pursuant to Section 35 of the Workers Compensation
Jobs in Canada are increasingly characterized
 Is the workplace becoming safer? F. Curtis Breslin, Peter Smith, Mieke Koehoorn and Hyunmi Lee Jobs in Canada are increasingly characterized by brain power rather than brawn. Despite the recent resurgence
Self-employment tends to increase during
 Sébastien LaRochelle-Côté Self-employment in the downturn Self-employment tends to increase during recessions (Picot and Heisz 2000). The recent downturn has been no exception. Between October 2008 and
Injuries at work are fewer among older employees
 Injuries at work are fewer among older employees Previous studies offer conflicting results in determining the age groups more prone to accidents on the job; but new data show young workers are hurt more,
Jobs of Persons Working After Receiving Retired-Worker Benefits
 Jobs of Persons Working After Receiving Retired-Worker Benefits by Howard M. Iams* This article describes the jobs of new Social Security retired-worker beneficiaries about 2 years after they received
Back Safety Program POLICY AND PROCEDURE
 Back Safety Program POLICY AND PROCEDURE This is (Enter Company Name Here) Back Safety Program. It meets all OSHA requirements and applies to all our work operations. (Enter Name Here) will be responsible
Accidents at Work: Q3/2015
 4 November 2015 1100 hrs 202/2015 Claims in respect of non-fatal accidents at work in the third quarter of 2015 remained almost at par with the corresponding quarter in 2014 increasing by just one case.
Keeping the Aging Worker Productive and Injury Free
 Keeping the Aging Worker Productive and Injury Free Peter Goyert PT CCPE Senior Ergonomist WorkSafeBC Aging Some say aging is > 30 years. Everybody is aging. Generally aging workers refer to those in last
Competitive Analysis Economic Vision for the City of Burlington
 Competitive Analysis Economic Vision for the City of Burlington Burlington Economic Development Corporation DRAFT 1 Millier Dickinson Blais ACKNOWLEDGEMENT This report has been supported by the Ministry
Ergonomics In The Laundry / Linen Industry
 Ergonomics In The Laundry / Linen Industry Ergonomics is a key topic of discussion throughout industry today. With multiple changes announced, anticipated, and then withdrawn the Occupational Safety and
Peter Smith School of Public Health and Preventive Medicine, Monash University
 The ageing workforce and its implications for occupational health and safety prevention programs and work-injury compensation systems: A Canadian perspective Peter Smith School of Public Health and Preventive
Workplace Safety Prosecutions Fines and Fatalities
 Workplace Safety Prosecutions Fines and Fatalities LAW Review Penalties: Stated in the Act Fines: $500,000; $1,000,000 Jail terms: 6 months; 1 year Alternative penalties Administrative fines Authority
Almost 20 percent1 of all the workplace
 Occupational Occupational fatalities: self-employed and wage Although making up just 7.4 percent of the U.S. civilian workforce in 2001 self-employed incurred almost 20 percent of workplace fatalities
Table 1. Demographic characteristics of persons in first job after award of DI benefits, by industry [In percents]
![Table 1. Demographic characteristics of persons in first job after award of DI benefits, by industry [In percents]](/thumbs/39/18223047.jpg "Table 1. Demographic characteristics of persons in first job after award of DI benefits, by industry [In percents]") Industry, Occupation, and Disability Insurance Beneficiary Work Return by Evan S. Schechter* This article uses the New Beneficiary Data System to describe the first job held after award of Disability Insurance
Industry, Occupation, and Disability Insurance Beneficiary Work Return by Evan S. Schechter* This article uses the New Beneficiary Data System to describe the first job held after award of Disability Insurance
1960-61. United States
 61-61 United States By, the U.S. population had surpassed 179 million, a gain of 19.0 percent from. The median age had decreased to 29.5 (28.7 for men and.3 for women), the first decline since 1900. The
Injury Prevention: Overexertion
 Injury Prevention: Overexertion Injury Prevention Overexertion Introduction: This is the second in a series of four injury prevention campaigns that will focus on the most common types of injuries in the
By Melissa S. Kearney, Brad Hershbein, and Elisa Jácome The Hamilton Project
 PROFILES OF CHANGE: EMPLOYMENT, EARNINGS, AND OCCUPATIONS FROM 1990-2013 April 20, 2015 By Melissa S. Kearney, Brad Hershbein, and Elisa Jácome The Hamilton Project There has been tremendous focus in recent
Historical Trends in the Epidemiology of Injury and. Industrial Disease at the B.C. Worker's Compensation Board (1950-1996).
.") Historical Trends in the Epidemiology of Injury and Industrial Disease at the B.C. Worker's Compensation Board (1950-1996). A Report Prepared for the B.C. Royal Commission on the Worker's Compensation
Historical Trends in the Epidemiology of Injury and Industrial Disease at the B.C. Worker's Compensation Board (1950-1996). A Report Prepared for the B.C. Royal Commission on the Worker's Compensation