ICC September 2009 Original: French. Study. International Coffee Council 103 rd Session September 2009 London, England
|
|
|
- Colin Jefferson
- 8 years ago
- Views:
Transcription
1 ICC September 2009 Original: French Study E International Coffee Council 103 rd Session September 2009 London, England Coffee price volatility Background In the context of its programme of activities, the Organization pays particular attention to price volatility which has consequences for the earnings of producers and the profit margins of operators all along the coffee chain. This document contains a study of coffee price volatility and its underlying factors. Action The Council is requested to take note of this document.

2 COFFEE PRICE VOLATILITY Introduction 1. Price volatility is a source of uncertainty in regard to export earnings for exporting countries, making it difficult to plan and carry out effective sales policies. It is also a major source of economic vulnerability for many developing countries dependent on primary commodity exports. In importing countries, particularly in the case of roasters, price volatility makes it difficult to control production costs. For traders and holders of stocks volatility affects profit margins, increasing their exposure to the risk factors inherent in their activities. On the other hand, for investment fund managers or pure speculators volatility is an investment criterion to the extent that active or marked volatility offers a possibility of significant and rapid profits allied with heightened risk. Speculators have an opportunity to arbitrate between risk and profitability in terms of an anticipated profit. The concept of volatility is, therefore, one of the main portfolio management tools for publicly traded assets and options since it is defined as a measure of the uncertainty of the profitability of an asset. 2. In the case of primary commodities, market prices reflect the balance of physical transactions and are determined by a number of factors, which can be ranked in hierarchical order of importance. The fundamental factors determining coffee prices are production, consumption and stocks. At the same time, however, less fundamental issues come into play in trading activities, and may superimpose themselves on underlying supply and demand factors in such a way as to influence price behaviour and volatility. This report provides an analysis of coffee prices since 1990, particularly in relation to their volatility since the end of the market regulation system. In other words, it seeks to determine whether coffee prices have become more volatile in recent years and whether changes in the value of the United States dollar, which is the reference currency for transactions, affect coffee price volatility. The following points will be covered: I. Definition, measurement and origins of volatility II. Development of the coffee market since 1990 III. Comparative analysis of coffee price volatility IV. Impact of exchange rates on coffee price volatility

3 - 2 - I. Definition, measurement and origins of volatility A. Definition and measurement of price volatility 3. Generally speaking, volatility refers to the tendency for prices to change in an unforeseen manner over time, usually in response to new information or to an external impact that can affect the situation of fundamental market factors for the underlying commodity or stock. Volatility measures the degree of the increase or decrease in prices in the short term. It is not defined in terms of price levels, but by their degree of variation. High price levels do not mean that prices are highly volatile since low prices can also present marked volatility. In other words, the volatility level is not dependent on absolute prices. Financial analysis of publicly traded assets distinguishes two types of volatility: historical volatility and implied volatility. Evaluation of these two types of volatility depends on calculation methods based on a number of different econometric models, including the Black-Scholes model Historical volatility is based on past behaviour, namely past variations of a financial asset. It shows the volatility level observed in the past on the basis of fluctuations in the price of underlying asset. Historical volatility is determined by using a statistical tool known as standard deviation. Implied volatility derives from market forecasts of future variations in the price or premium of the underlying asset. Evaluation of the premium for an option is based on market fundamentals including the underlying asset price, the option exercise price, interest rates, number of days until expiration, dividends and volatility. The only unknown component is volatility, or so-called implied volatility. A number of mathematical and econometric methods have been developed to estimate this volatility component on the basis of the Black-Scholes model. Measurements of historical and future volatilities have an impact on evaluations and profits of a number of financial products, particularly in the case of interest rates, futures contracts and options. Volatility measurements are regarded as a barometer of investor sentiment. A high volatility level generally indicates an extremely nervous market while a low volatility level indicates a low-risk market and a consequent tendency for risk-taking. The main volatility index is the Chicago Board Options Exchange Volatility Index, known as the VIX, which is often referred to on Wall Street as the investor fear gauge. This implied volatility index is an indication of short-term global investment returns in the United States stock market. In other words, the VIX and the US stock market move in opposite directions. 1 The Black-Scholes model is a mathematical model for evaluation of market decision-making that makes it possible to calculate the theoretical value of a European option on the basis of the following data: the current price of the underlying stock, the time until expiration, the option exercise price, the interest rate, and the volatility.

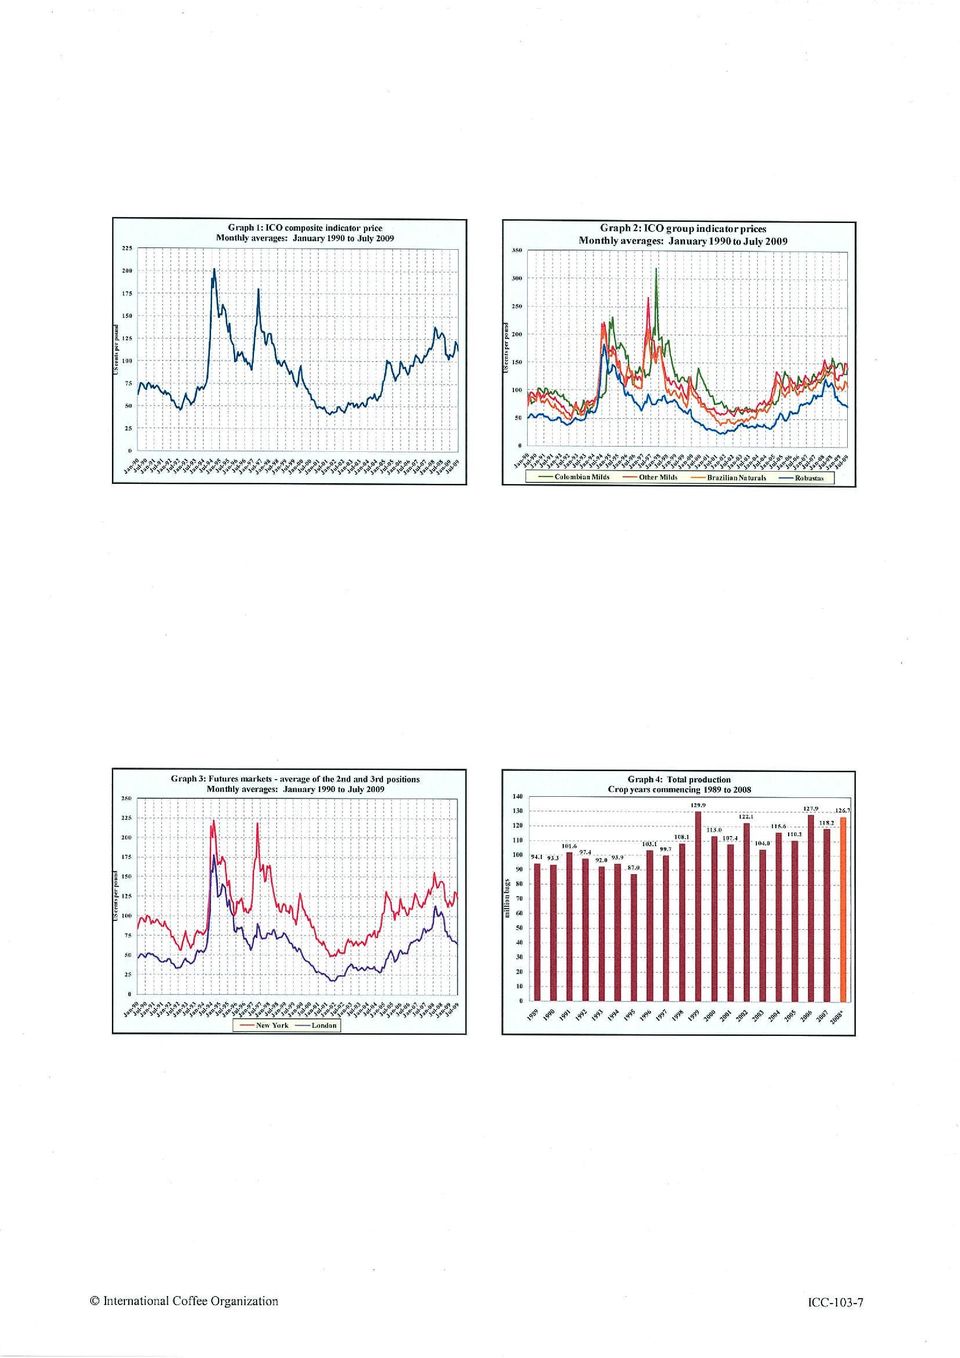
4 - 3 - II. Development of the coffee market since A. Behaviour of prices 5. Graph 1 shows the evolution of the ICO composite indicator price during the period from January 1990 to July 2009, covering a period of 234 months. Graphs 2 to 3 show, respectively, the ICO group indicator prices and the average of the 2 nd and 3 rd positions in the New York and London futures markets during the same period. This lengthy price series allows us to distinguish four main sub-periods in the behaviour of coffee prices. The first subperiod extends from January 1990, following the suspension of the economic clauses of the 1983 International Coffee Agreement in July 1989, to March During this sub-period, prices remained low with the ICO composite indicator price falling to US cents per lb in August Prices of the four groups of coffee and the average of the 2 nd and 3 rd positions on the London and New York futures markets showed similar movements during this sub-period. The recovery in prices that began in April 1994 was subsequently consolidated, with prices reaching peaks during the first semester of 1994 and the first half of 1997 before falling steadily. Prices during this second sub-period, extending from April 1994 to December 1998, recorded high levels even though these were interspersed with downward corrections, particularly in 1995 and The third sub-period corresponds to the recent crisis of low prices lasting from January 2000 to October During this third sub-period prices recorded their lowest levels for many decades. The fourth sub-period, from November 2004 to the present, is characterized by a relative firmness in prices, which could qualify as a recovery, despite some downward corrections in recent months, specifically in June and July B. Market fundamentals 6. The coffee economy has undergone a number of changes since 1989, the first being the absence, in the 1994, 2001 and 2007 International Coffee Agreements, of any regulatory mechanism to permit the correction or attenuation of a market disequilibrium through the application of export quotas. The second significant change was the gradual liberalization of the coffee chain in most exporting countries with the abolition of semi-public bodies responsible for the control and management of internal and external marketing. The evolution in market fundamentals related to supply (production, exports, and stocks in exporting countries) is shown in Graphs 4 to 6. As in the case of most agricultural commodities, coffee production is subject to variations related to agricultural and climatic conditions. Market fundamentals linked to demand, namely imports by importing countries and world consumption, are shown in Graphs 7 and 8. 2 The period chosen coincides with the free market era as a number of studies have already covered price volatility analysis during the market regulated period. These studies include Christopher Gilbert The long run impact of the ending of coffee control, World Bank, September 2005, and ICO previous studies - (EB-3638/97, EB 3629/97, EB3678/98, EB3708/99 and ICC-94-5 )

5 - 4 - C. Other sources of coffee price volatility 7. Coffee price volatility is essentially influenced by the conditions of coffee supply and demand. The supply situation is determined by the production cycle in exporting countries and variations in stock levels. In the case of coffee the short-term price-elasticity of supply is weak, which means that supply is slow to respond to changes in price. The price-elasticity of demand is equally weak since the final price of the consumer product does not reflect a significant part of the price of the underlying raw materials. Price volatility is influenced by exogenous impacts affecting supply and demand conditions. In the case of supply, these conditions relate mainly to factors affecting production, such as climatic problems (drought, floods, hurricanes, El Niño) or social problems (regional conflicts, etc.), as well as short-term events affecting exports (strikes, social unrest, export restrictions). Factors that can impact on demand include the economic and industrial cycle, which affects mineral products far more than agricultural commodities like coffee. III. Comparative analysis of coffee price volatility 8. Historical volatility is appropriate for evaluating coffee price volatility since it provides for an analysis of past and current price variations. Our approach will be based on observation of daily variations in price during the period from January 1990 to July Volatility is calculated by multiplying the standard deviation of price variations by the square root of the number of days of transactions during the month concerned. The measurement will be based, therefore, on the following equations: Equation 1: Var (P j, P j-1 ) = Ln (P j /P j-1 ) Var = variation in price from one day to the next P j = price on day P j-1 = price on previous day Ln = Naperian logarithm Equation 2: σ = [ΣLn(P j /P j-1 )] J=1 N = square root N = Total number of days of transaction σ = standard deviation for the month Volatility = σ multiplied by the square root of N

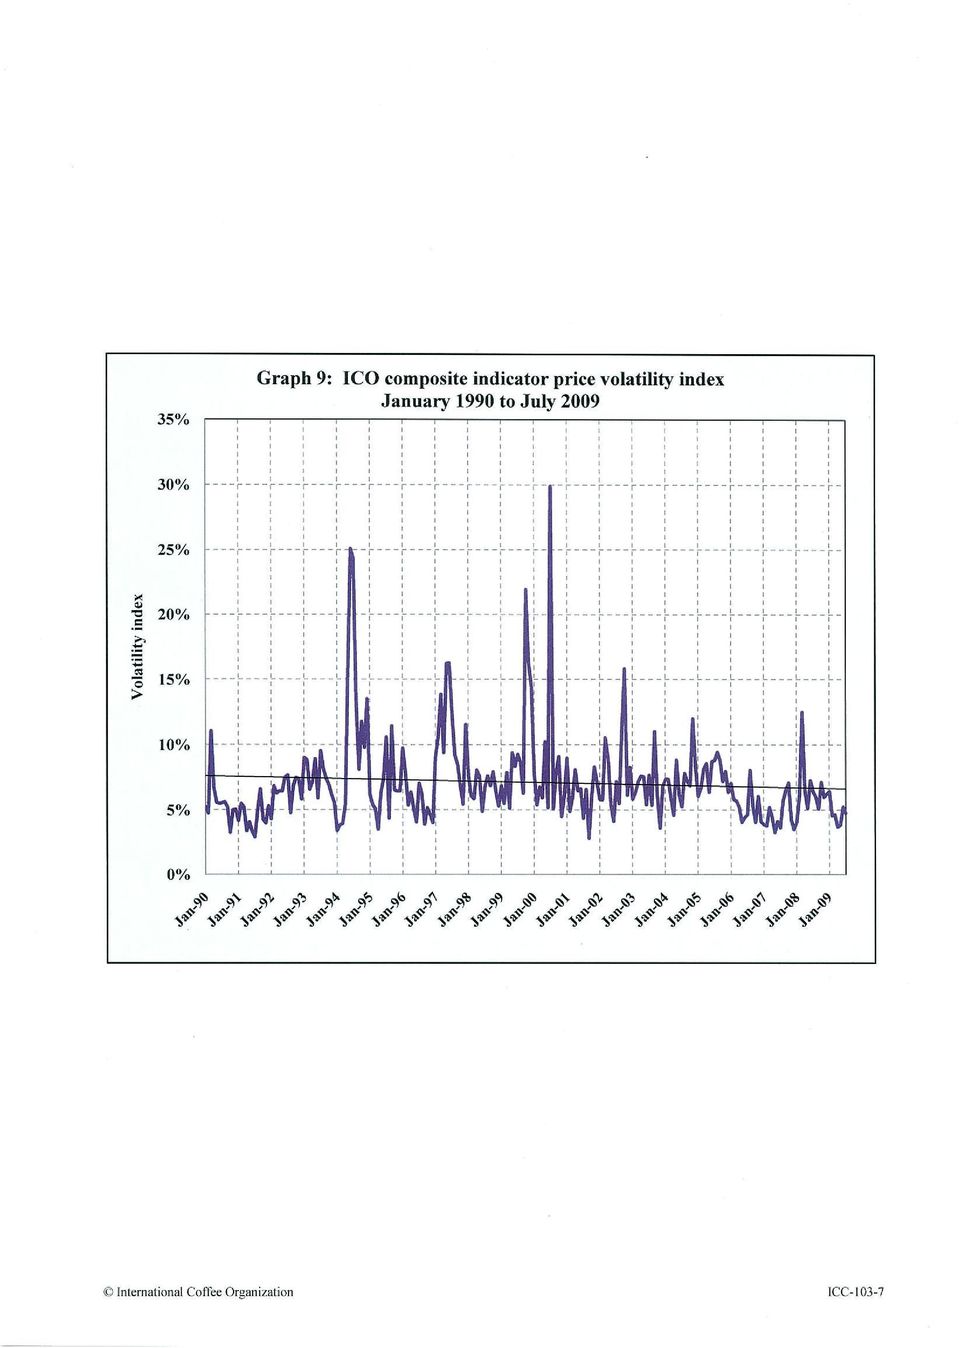
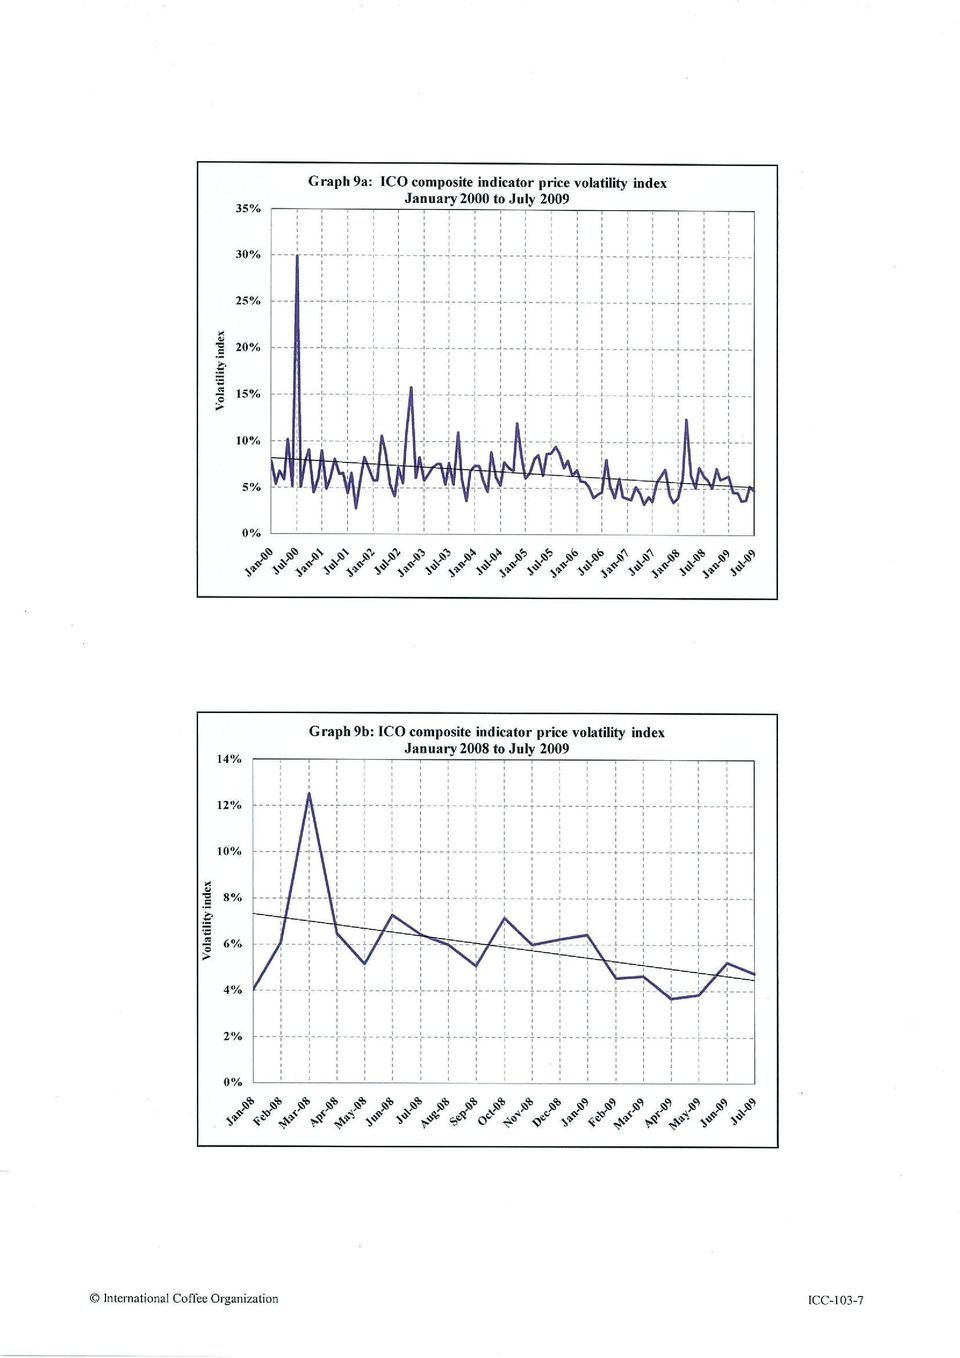
6 Graphs 9, 9a and 9b show volatility indexes for the ICO composite indicator price in the period January 1990 to July 2009; January 2000 to July 2009 and January 2008 to July 2009, respectively. Graphs 10 to 15 show the volatility index for the group indicator prices, and for the average of the 2 nd and 3 rd positions on the New York (ICE) and London (LIFFE) futures markets for the period January 1990 to July Apart from a slight peak in March 1990, the period between January 1990 and the beginning of 1994 shows relative stability in prices since volatility was low recorded marked price volatility with indexes reaching high levels, particularly between May and August Frosts in Brazil occurred in June and July It is evident therefore, that adverse climatic events contributed to increased price volatility. The volatility index was 25% and 24%, respectively, in June and July Robusta price volatility recorded its highest level in Following a downturn in 1995 and 1996, volatility increased in 1997 but at a level lower than in Nevertheless, volatility indexes for Arabicas were greater than 20%. Following a slackening between 1998 and the first half of 1999, the volatility index for Arabica prices rose to new records from July 1999 to 2000, then in 2002 and, to a lesser extent, in November 2004 and March Despite the peak in July 2000, coffee price volatility has been relatively weak from the latter half of 2000 to July The period from January 1990 to July 2009 has been sub-divided into four subperiods, as indicated in the table below, in order to allow an expansion of this analysis. The average of the volatility index is summarized in the table below. Volatility index January 1990 to July 2009 Average in the 4 sub-periods Average of 2 nd and 3 rd positions Period ICO Composite Colombian Milds Other Milds Brazilian Naturals Robustas New York London Jan/90-Jul/ % 8.18% 8.04% 9.87% 7.21% 9.34% 8.12% Jan/90-Dec/ % 8.82% 7.99% 10.23% 7.46% 8.86% 8.49% Jan/95-Dec/ % 9.89% 9.61% 11.60% 7.55% 10.62% 8.29% Jan/00-Dec/ % 7.78% 8.19% 10.86% 6.46% 9.58% 7.72% Jan/05-Jul/ % 6.06% 6.20% 6.49% 7.40% 8.19% 7.97% Average 7.11% 8.14% 8.00% 9.80% 7.22% 9.31% 8.12% 12. It should be noted that, on the whole, price volatility has not changed in recent years. The general trend has been towards a reduction in volatility despite a few occasional peaks that appear as a short-term response to exogenous impacts. Even these peaks are relatively weak compared to the situation in previous years.

7 - 6 - IV. Impact of exchange rates on coffee price volatility 13. In order to determine the relation between coffee price volatility and changes in the exchange rates in relation to the US dollar, the reference currency for most coffee transactions, the behaviour of these two variables has been analysed. The Euro/US$ rate was chosen given the importance of the coffee market in the Euro Zone, its biggest consuming market. Graph 16 shows, on a monthly basis, the percentage variations in the Euro/US$ exchange rate from February 2002 to June In addition, a correlation test between these variations and those of average monthly ICO composite indicator prices and prices on futures markets was introduced to measure the strength and direction of a linear relationship between the two variations. The table below shows the different correlation coefficients. All four groups of coffee showed negative correlation coefficients, indicating an inverse and weak relation between variations in the Euro/US$ exchange rate and coffee prices. Correlation CORRELATION COEFFICIENTS BETWEEN VARIATIONS IN THE EURO/US$ EXCHANGE RATE AND COFFEE PRICES Exchange rate /US$ ICO composite Colombian Milds (CM) Other Milds (OM) Brazilian Naturals (BN) Robustas Average of 2 nd and 3 rd New York Average of 2 nd and 3 rd London /US$ ICO Composite CM OM BN Robustas New York London Graph 17 shows the variations in exchange rates together with the variations of the ICO composite. Graph 18 and 19 show the exchange rate variations with the variations of the averages of the 2 nd and 3 rd positions in the New York and London futures markets, respectively. Conclusion 15. It should be noted that the volatility recorded from 2000 to the present is not more marked than in previous years. The general trend is rather towards reduced volatility despite the emergence of occasional peaks from time to time as a short-term response to exogenous impacts. These exogenous impacts on market fundamentals, particularly those attributable to

8 - 7 - climatic problems, are phenomena that have always contributed to increased volatility following the creation of an imbalance between supply and demand. It would seem that in absence of any significant supply-side shocks, such as frosts, droughts and floods, price volatility is relatively attenuated. 16. As for the influence of fluctuations in exchange rates, partial analysis based on monthly variations indicates that a fall in the value of the dollar in relation to the Euro entails an increase in coffee prices. A more in-depth analysis would, however, make it possible to draw clearer conclusions.

9 INDEX OF GRAPHS Graph 1: ICO composite indicator price monthly averages: January 1990 to July 2009 Graph 2: ICO group indicator prices monthly averages: January 1990 to July 2009 Graph 3: Average of the 2 nd and 3 rd positions in New York and London futures markets: Monthly averages: January 1990 to July 2009 Graph 4: Total production Crop years 1989/90 to 2008/09 Graph 5: Total exports to all destinations Calendar years 1990 to 2008 Graph 6: Gross opening stocks in exporting countries Crop years 1989/90 to 2008/09 Graph 7: Imports of all forms of coffee from all sources calendar years 1990 to 2008 Graph 8: World consumption Calendar years 1990 to 2008 Graph 9: ICO composite indicator price and volatility index (+ trend line) monthly: January 1990 to July 2009 Graph 9a: ICO composite indicator price and volatility index (+ trend line) monthly: January 2000 to July 2009 Graph 9b: ICO composite indicator price and volatility index (+ trend line) monthly: January 2008 to July 2009 Graph 10: Colombian Milds indicator price and volatility index (+ trend line) monthly: January 1990 to July 2009 Graph 11: Other Milds indicator price and volatility index (+ trend line) monthly: January 1990 to July 2009 Graph 12: Brazilian Naturals indicator price and volatility index (+ trend line) monthly: January 1990 to July 2009 Graph 13: Robustas indicator price and volatility index (+ trend line) monthly: January 1990 to July 2009 Graph 14: Average of the 2 nd and 3 rd positions of the New York futures market and volatility index (+ trend line) monthly: January 1990 to July 2009 Graph 15: Average of the 2 nd and 3 rd positions of the London futures market and volatility index (+ trend line) monthly: January 1990 to July 2009 Graph 16: Monthly variations of the /US$ rate: February 2002 to June 2009 Graph 17: Monthly variations of the /US$ rate and the ICO composite indicator price: February 2002 to June 2009 Graph 18: Monthly variations of the /US$ rate and the average of the 2 nd and 3 rd positions in the New York futures market: February 2002 to June 2009 Graph 19: Monthly variations of the /US$ rate and the average of the 2 nd and 3 rd positions in the London futures market: February 2002 to June 2009
 monthly: January 1990 to July 2009 Graph 9a: ICO")
10
11

12
13
14

15

16

17

Coffee Year 2014-15 Futures Trading Analysis
 Lower coffee exports lend support to Robusta prices The coffee market rallied slightly in June, led in most part by a recovery in Robusta prices. For the sixth month in a row exports were lower than last
Coffee prices fall to 18-month low as supply concerns fade
 Coffee prices fall to 18-month low as supply concerns fade The coffee market registered further decreases in July with prices reacting to the depreciation in the Brazilian exchange rate, which dropped
Coffee year 2014/15 ends with prices at 20-month low
 Coffee year 2014/15 ends with prices at 20-month low The coffee market slumped further in September, following a slight rally in August, with the weakness of the real and peso again proving the most influential
Coffee prices fall but Brazilian production estimated lower
 Coffee prices fall but production estimated lower Coffee prices continued their decline as speculation over the current 2015/16 crop suggests that the market has no immediate supply concerns. Indeed, one
MONTHLY COFFEE MARKET REPORT
 E MONTHLY COFFEE MARKET REPORT March 2013 Coffee prices stabilized in March 2013, with the monthly average of the ICO composite indicator price essentially unchanged on the previous month. Contrasting
EXECUTE SUCCESS. {at work}
 EXECUTE SUCCESS TM {at work} VIX T H E C B O E V O L A T I L I T Y I N D E X 1 W H AT I S V I X & W H AT D O E S I T M E A S U R E? T H E I N D U S T R Y S TA N D A R D I N V O L AT I L I T Y MEASUREMENT
9 Hedging the Risk of an Energy Futures Portfolio UNCORRECTED PROOFS. Carol Alexander 9.1 MAPPING PORTFOLIOS TO CONSTANT MATURITY FUTURES 12 T 1)
") Helyette Geman c0.tex V - 0//0 :00 P.M. Page Hedging the Risk of an Energy Futures Portfolio Carol Alexander This chapter considers a hedging problem for a trader in futures on crude oil, heating oil and
Helyette Geman c0.tex V - 0//0 :00 P.M. Page Hedging the Risk of an Energy Futures Portfolio Carol Alexander This chapter considers a hedging problem for a trader in futures on crude oil, heating oil and
Compare and Contrast of Option Decay Functions. Nick Rettig and Carl Zulauf *,**
 Compare and Contrast of Option Decay Functions Nick Rettig and Carl Zulauf *,** * Undergraduate Student (rettig.55@osu.edu) and Professor (zulauf.1@osu.edu) Department of Agricultural, Environmental, and
How To Understand The Risks Of Financial Instruments
 NATURE AND SPECIFIC RISKS OF THE MAIN FINANCIAL INSTRUMENTS The present section is intended to communicate to you, in accordance with the Directive, general information on the characteristics of the main
A comparison between different volatility models. Daniel Amsköld
 A comparison between different volatility models Daniel Amsköld 211 6 14 I II Abstract The main purpose of this master thesis is to evaluate and compare different volatility models. The evaluation is based
Project LINK Meeting New York, 20-22 October 2010. Country Report: Australia
 Project LINK Meeting New York, - October 1 Country Report: Australia Prepared by Peter Brain: National Institute of Economic and Industry Research, and Duncan Ironmonger: Department of Economics, University
Theories of Exchange rate determination
 Theories of Exchange rate determination INTRODUCTION By definition, the Foreign Exchange Market is a market 1 in which different currencies can be exchanged at a specific rate called the foreign exchange
INSIGHT SPECIAL: Coffee Futures 101
 COFFEE DIVISION OF ED&F MAN December 2011 INSIGHT SPECIAL: Coffee Futures 101 CBS&A Coffee Business Ser vices & Academy, a Volcafe Initiative Highlights All commodity markets tend to be volatile. Agricultural
EB 3776/01 Rev. 1. 28 March 2002 Original: English. Rules on Statistics. Indicator prices
 EB 3776/01 Rev. 1 Organización Internacional del Café Organização Internacional do Café Organisation Internationale du Café 28 March 2002 Original: English PROCEDURES FOR THE COLLECTION, TRANSMISSION,
THE IMPACT OF MACROECONOMIC FACTORS ON NON-PERFORMING LOANS IN THE REPUBLIC OF MOLDOVA
 Abstract THE IMPACT OF MACROECONOMIC FACTORS ON NON-PERFORMING LOANS IN THE REPUBLIC OF MOLDOVA Dorina CLICHICI 44 Tatiana COLESNICOVA 45 The purpose of this research is to estimate the impact of several
FORECASTING MODEL FOR THE PRODUCTION AND CONSUMPTION OF COTTON FIBER VERSUS POLYESTER
 1 FORECASTING MODEL FOR THE PRODUCTION AND CONSUMPTION OF COTTON FIBER VERSUS POLYESTER Elisa Mauro Gomes Otávio Lemos de Melo Celidonio Daniel Latorraca Ferreira Leandro Gustavo Alves Johnnattann Pimenta
Financial Instruments Traded on the Commodity Exchange
 Financial Instruments Traded on the Commodity Exchange Using the Financial Markets A cotton trader will almost always prefer to manage his price risk through physical positions and contracts for cotton,
Fuzzy logic decision support for long-term investing in the financial market
 Fuzzy logic decision support for long-term investing in the financial market Abstract This paper discusses the use of fuzzy logic and modeling as a decision making support for long-term investment decisions
Option Portfolio Modeling
 Value of Option (Total=Intrinsic+Time Euro) Option Portfolio Modeling Harry van Breen www.besttheindex.com E-mail: h.j.vanbreen@besttheindex.com Introduction The goal of this white paper is to provide
Fundamentals of Futures and Options (a summary)
") Fundamentals of Futures and Options (a summary) Roger G. Clarke, Harindra de Silva, CFA, and Steven Thorley, CFA Published 2013 by the Research Foundation of CFA Institute Summary prepared by Roger G.
Fundamentals of Futures and Options (a summary) Roger G. Clarke, Harindra de Silva, CFA, and Steven Thorley, CFA Published 2013 by the Research Foundation of CFA Institute Summary prepared by Roger G.
Predicting the US Real GDP Growth Using Yield Spread of Corporate Bonds
 International Department Working Paper Series 00-E-3 Predicting the US Real GDP Growth Using Yield Spread of Corporate Bonds Yoshihito SAITO yoshihito.saitou@boj.or.jp Yoko TAKEDA youko.takeda@boj.or.jp
II- Review of the Literature
 A Model for Estimating the Value Added of the Life Insurance Market in Egypt: An Empirical Study Dr. N. M. Habib Associate Professor University of Maryland Eastern Shore Abstract The paper is an attempt
Experience with external active fixed income managers - NBIM
 Page 1 of 5 Experience with external active fixed income managers This article summarises nearly five years experience with external fixed income managers. During this period, net excess return in relation
ICC 111-5 Rev. 1. 24 February 2014 Original: French
 ICC 111-5 Rev. 1 24 February 214 Original: French E International Coffee Council 112 th Session 3 7 March 214 London, United Kingdom World coffee trade (1963 213): A review of the markets, challenges and
Derivative Users Traders of derivatives can be categorized as hedgers, speculators, or arbitrageurs.
 OPTIONS THEORY Introduction The Financial Manager must be knowledgeable about derivatives in order to manage the price risk inherent in financial transactions. Price risk refers to the possibility of loss
Explanation beyond exchange rates: trends in UK trade since 2007
 Explanation beyond exchange rates: trends in UK trade since 2007 Author Name(s): Michael Hardie, Andrew Jowett, Tim Marshall & Philip Wales, Office for National Statistics Abstract The UK s trade performance
Unaudited Half Year Financial Report January June 2013. Creating career prospects and deploying targeted professional skills.
 Creating career prospects and deploying targeted professional skills Amadeus FiRe AG Unaudited Half Year Financial Report January June 2013 Unaudited Half Year Financial Report, January June 2013 1 Unaudited
What Determines Exchange Rates? In the Short Run In the Long Run
 What Determines Exchange Rates? In the Short Run In the Long Run Selected Exchange Rates Selected Exchange Rates Determinants of the Exchange Rate in the Short Run In the short run, movements of currency
VDAX -NEW. Deutsche Börse AG Frankfurt am Main, April 2005
 VDAX -NEW Deutsche Börse AG Frankfurt am Main, April 2005 With VDAX -NEW, Deutsche Börse quantifies future market expectations of the German stock market Overview VDAX -NEW Quantifies the expected risk
A Primer on Forecasting Business Performance
 A Primer on Forecasting Business Performance There are two common approaches to forecasting: qualitative and quantitative. Qualitative forecasting methods are important when historical data is not available.
www.optionseducation.org OIC Options on ETFs
 www.optionseducation.org Options on ETFs 1 The Options Industry Council For the sake of simplicity, the examples that follow do not take into consideration commissions and other transaction fees, tax considerations,
1. HOW DOES FOREIGN EXCHANGE TRADING WORK?
 XV. Important additional information on forex transactions / risks associated with foreign exchange transactions (also in the context of forward exchange transactions) The following information is given
How To Know Market Risk
 Chapter 6 Market Risk for Single Trading Positions Market risk is the risk that the market value of trading positions will be adversely influenced by changes in prices and/or interest rates. For banks,
Correlation of International Stock Markets Before and During the Subprime Crisis
 173 Correlation of International Stock Markets Before and During the Subprime Crisis Ioana Moldovan 1 Claudia Medrega 2 The recent financial crisis has spread to markets worldwide. The correlation of evolutions
Sensex Realized Volatility Index
 Sensex Realized Volatility Index Introduction: Volatility modelling has traditionally relied on complex econometric procedures in order to accommodate the inherent latent character of volatility. Realized
X. INTERNATIONAL ECONOMIC DEVELOPMENT 1/
 1/ X. INTERNATIONAL ECONOMIC DEVELOPMENT 1/ 10.1 Overview of World Economy Latest indicators are increasingly suggesting that the significant contraction in economic activity has come to an end, notably
About Volatility Index. About India VIX
 About Volatility Index Volatility Index is a measure of market s expectation of volatility over the near term. Volatility is often described as the rate and magnitude of changes in prices and in finance
The Long-Run Performance of the New Zealand Stock Markets: 1899-2012
 The Long-Run Performance of the New Zealand Stock Markets: 1899-2012 Bart Frijns * & Alireza Tourani-Rad Auckland Centre for Financial Research (ACFR) Department of Finance, Faculty of Business and Law,
Inflation Target Of The Lunda Krona
 Inflation Targeting The Swedish Experience Lars Heikensten We in Sweden owe a great debt of thanks to the Bank of Canada for all the help we have received in recent years. We have greatly benefited from
Volatility Trading For Gold: Hedging Global Instability
 METALS Volatility Trading For Gold: Hedging Global Instability APRIL 2012 BOB BIOLSI Director, Energy & Metals Research & Product Development VOLATILITY TRADING FOR GOLD: HEDGING GLOBAL INSTABILITY This
Study on the Volatility Smile of EUR/USD Currency Options and Trading Strategies
 Prof. Joseph Fung, FDS Study on the Volatility Smile of EUR/USD Currency Options and Trading Strategies BY CHEN Duyi 11050098 Finance Concentration LI Ronggang 11050527 Finance Concentration An Honors
Investing in International Financial Markets
 APPENDIX 3 Investing in International Financial Markets http:// Visit http://money.cnn.com for current national and international market data and analyses. The trading of financial assets (such as stocks
Buying Commodity In A Volatile Market: The Best Strategy
 Buying in a volatile market: variable or fixed price? Jan Telgen Professor of Purchasing Management University of Twente UTIPS P.O. Box 217 7500 AE Enschede +31(0)53-4894532 j.telgen@utwente.nl Merijn
Paper 2. Derivatives Investment Consultant Examination. Thailand Securities Institute November 2014
 Derivatives Investment Consultant Examination Paper 2 Thailand Securities Institute November 2014 Copyright 2014, All right reserve Thailand Securities Institute (TSI) The Stock Exchange of Thailand Page
General Forex Glossary
 General Forex Glossary A ADR American Depository Receipt Arbitrage The simultaneous buying and selling of a security at two different prices in two different markets, with the aim of creating profits without
Effective downside risk management
 Effective downside risk management Aymeric Forest, Fund Manager, Multi-Asset Investments November 2012 Since 2008, the desire to avoid significant portfolio losses has, more than ever, been at the front
Diageo reports strong sales momentum
 Diageo reports strong sales momentum 29 June 2006 Diageo plc Diageo will announce preliminary results for the year ending 30 June 2006 on 31 August 2006 and has today issued the following statement. Summary
Introduction to Futures Contracts
 Introduction to Futures Contracts September 2010 PREPARED BY Eric Przybylinski Research Analyst Gregory J. Leonberger, FSA Director of Research Abstract Futures contracts are widely utilized throughout
Understanding Volatility
 Options Trading Forum October 2 nd, 2002 Understanding Volatility Sheldon Natenberg Chicago Trading Co. 440 S. LaSalle St. Chicago, IL 60605 (312) 863-8004 shellynat@aol.com exercise price time to expiration
11-1. Framework of Analysis. Global Economic Considerations. Figure 12.1 Change in Real Exchange Rate: Dollar Versus Major Currencies.
 Framework of Analysis CHAPTER 12 Macroeconomic and Industry Analysis Fundamental Analysis Approach to Fundamental Analysis Domestic and global economic analysis Industry analysis Company analysis Why use
Index Volatility Futures in Asset Allocation: A Hedging Framework
 Investment Research Index Volatility Futures in Asset Allocation: A Hedging Framework Jai Jacob, Portfolio Manager/Analyst, Lazard Asset Management Emma Rasiel, PhD, Assistant Professor of the Practice
Answers to Concepts in Review
 Answers to Concepts in Review 1. Puts and calls are negotiable options issued in bearer form that allow the holder to sell (put) or buy (call) a stipulated amount of a specific security/financial asset,
SPREAD BETTING OPTIONS (cash)
") SPREAD BETTING OPTIONS (cash) Market Symbol Dealing Spread Tradefair IM Factor Trading (Margin Req) Hours Min margin per stake (applicable to all short positions) Contract Months Last Dealing Day Basis
SPREAD BETTING OPTIONS (cash) Market Symbol Dealing Spread Tradefair IM Factor Trading (Margin Req) Hours Min margin per stake (applicable to all short positions) Contract Months Last Dealing Day Basis
percentage points to the overall CPI outcome. Goods price inflation increased to 4,6
 South African Reserve Bank Press Statement Embargo on Delivery 28 January 2016 Statement of the Monetary Policy Committee Issued by Lesetja Kganyago, Governor of the South African Reserve Bank Since the
Investing In Volatility
 Investing In Volatility By: Anish Parvataneni, CFA Portfolio Manager LJM Partners Ltd. LJM Partners, Ltd. is issuing a series a white papers on the subject of investing in volatility as an asset class.
Session IX: Lecturer: Dr. Jose Olmo. Module: Economics of Financial Markets. MSc. Financial Economics
 Session IX: Stock Options: Properties, Mechanics and Valuation Lecturer: Dr. Jose Olmo Module: Economics of Financial Markets MSc. Financial Economics Department of Economics, City University, London Stock
Brookfield financial Review q2 2010
 Brookfield financial Review q2 2010 Overview Operating cash flow and gains totalled $327 million in the second quarter or $0.53 per share compared to $294 million in the prior year. This brings operating
Is the Forward Exchange Rate a Useful Indicator of the Future Exchange Rate?
 Is the Forward Exchange Rate a Useful Indicator of the Future Exchange Rate? Emily Polito, Trinity College In the past two decades, there have been many empirical studies both in support of and opposing
Experian Business Debt Index (BDI) Results. Q2 2015
 Results. Q2 2015") Experian Business Debt Index (BDI) Results. Q2 2015 Analysis Econometrix +27 11 483 1421 ilsef@econometrix.co.za Enquiries Experian +27 11 799 3400 BDIreport@experian.co.za EXPERIAN BUSINESS DEBT INDEX
Experian Business Debt Index (BDI) Results. Q2 2015 Analysis Econometrix +27 11 483 1421 ilsef@econometrix.co.za Enquiries Experian +27 11 799 3400 BDIreport@experian.co.za EXPERIAN BUSINESS DEBT INDEX
Today s bond market is riskier and more volatile than in several generations. As
 Fixed Income Approach 2014 Volume 1 Executive Summary Today s bond market is riskier and more volatile than in several generations. As interest rates rise so does the anxiety of fixed income investors
Integrated Resource Plan
 Integrated Resource Plan March 19, 2004 PREPARED FOR KAUA I ISLAND UTILITY COOPERATIVE LCG Consulting 4962 El Camino Real, Suite 112 Los Altos, CA 94022 650-962-9670 1 IRP 1 ELECTRIC LOAD FORECASTING 1.1
Valuing Stock Options: The Black-Scholes-Merton Model. Chapter 13
 Valuing Stock Options: The Black-Scholes-Merton Model Chapter 13 Fundamentals of Futures and Options Markets, 8th Ed, Ch 13, Copyright John C. Hull 2013 1 The Black-Scholes-Merton Random Walk Assumption
Don t be Intimidated by the Greeks, Part 2 August 29, 2013 Joe Burgoyne, OIC
 Don t be Intimidated by the Greeks, Part 2 August 29, 2013 Joe Burgoyne, OIC www.optionseducation.org 2 The Options Industry Council Options involve risks and are not suitable for everyone. Prior to buying
Is Gold Worth Its Weight in a Portfolio?
 Is Gold Worth Its Weight in a Portfolio? During a weak global economy and uncertain financial markets, many investors tout the benefits of holding gold. Some proponents claim that gold deserves a significant
Section 1. Introduction to Option Trading
 Section 1. Introduction to Option Trading Trading stock options is a much different game from trading the underlying stocks. When options are traded for appreciation, it is a game of leverage, with big
www.medirectbank.be Quarterly Report Wealth Management All content 2016 MeDirect More information visit www.medirectbank.be July - September 2015
 www.medirectbank.be Quarterly Report Wealth Management July - September 2015 All content 2016 MeDirect More information visit www.medirectbank.be In a volatile year such as 2015, a good asset manager proves
02/04/2012. Economic Research
 02/04/2012 Economic Research Commodity currencies: Australian dollar The Dukascopy Bank research department continues its research on commodity currencies. In the first issue we have established that the
No. 03/11 BATH ECONOMICS RESEARCH PAPERS
 Sovereign Credit Default Swaps and the Macroeconomy Yang Liu and Bruce Morley No. 03/11 BATH ECONOMICS RESEARCH PAPERS Department of Economics 1 Sovereign Credit Default Swaps and the Macroeconomy Yang
PERSONAL RETIREMENT SAVINGS ACCOUNT INVESTMENT REPORT
 PENSIONS INVESTMENTS LIFE INSURANCE PERSONAL RETIREMENT SAVINGS ACCOUNT INVESTMENT REPORT FOR PERSONAL RETIREMENT SAVINGS ACCOUNT () PRODUCTS WITH AN ANNUAL FUND MANAGEMENT CHARGE OF 1% - JULY 201 Thank
A BRIEF HISTORY OF BRAZIL S GROWTH
 A BRIEF HISTORY OF BRAZIL S GROWTH Eliana Cardoso and Vladimir Teles Organization for Economic Co operation and Development (OECD) September 24, 2009 Paris, France. Summary Breaks in Economic Growth Growth
The challenge of Brazilian pension funds imposed by the international crises
 Brazilian Economic Insights Nº. 68 August 3, 2009 The challenge of Brazilian pension funds imposed by the international crises By Adriana Inhudes, André Albuquerque Sant Anna, Ernani Teixeira Torres Filho
CBOE would like to thank Sandy Rattray and Devesh Shah of Goldman, Sachs & Co. for their significant contributions to the development of the New VIX
 CBOE would like to thank Sandy Rattray and Devesh Shah of Goldman, Sachs & Co. for their significant contributions to the development of the New VIX calculation. THE NEW CBOE VOLATILITY INDEX - VIX In
Disclosure on risks relating to Online Trading
 Disclosure on risks relating to Online Trading 1) General risks Under no circumstances will orders sent through the Online Trading Service be examined by the Bank or its employees prior to execution. The
Chapter 9. The Valuation of Common Stock. 1.The Expected Return (Copied from Unit02, slide 39)
") Readings Chapters 9 and 10 Chapter 9. The Valuation of Common Stock 1. The investor s expected return 2. Valuation as the Present Value (PV) of dividends and the growth of dividends 3. The investor s required
Readings Chapters 9 and 10 Chapter 9. The Valuation of Common Stock 1. The investor s expected return 2. Valuation as the Present Value (PV) of dividends and the growth of dividends 3. The investor s required
Lisbon Office Market Outlook. 4th Quarter 2009
 (data on ) Contacts: Pedro Pimentel pedrop@prea.pt 214406420 Research & Market Analysis Dept. www.prea.pt Outlook Following a major downturn in economic performance office space demand continues to be
We have seen in the How
 : Examples Using Hedging, Forward Contracting, Crop Insurance, and Revenue Insurance To what extent can hedging, forward contracting, and crop and revenue insurance reduce uncertainty within the year (intrayear)
Short-Term Energy Outlook Market Prices and Uncertainty Report
 February 2016 Short-Term Energy Outlook Market Prices and Uncertainty Report Crude Oil Prices: The North Sea Brent front month futures price settled at $34.46/b on February 4 $2.76 per barrel (b) below
Whether you re new to trading or an experienced investor, listed stock
 Chapter 1 Options Trading and Investing In This Chapter Developing an appreciation for options Using option analysis with any market approach Focusing on limiting risk Capitalizing on advanced techniques
Relationship among crude oil prices, share prices and exchange rates
 Relationship among crude oil prices, share prices and exchange rates Do higher share prices and weaker dollar lead to higher crude oil prices? Akira YANAGISAWA Leader Energy Demand, Supply and Forecast
16 : Demand Forecasting
 16 : Demand Forecasting 1 Session Outline Demand Forecasting Subjective methods can be used only when past data is not available. When past data is available, it is advisable that firms should use statistical
Absolute return strategies offer modern diversification
 February 2015» White paper Absolute return strategies offer modern diversification Key takeaways Absolute return differs from traditional stock and bond investing. Absolute return seeks to reduce market
VIANELLO FORENSIC CONSULTING, L.L.C.
 VIANELLO FORENSIC CONSULTING, L.L.C. 6811 Shawnee Mission Parkway, Suite 310 Overland Park, KS 66202 (913) 432-1331 THE MARKETING PERIOD OF PRIVATE SALES TRANSACTIONS By Marc Vianello, CPA, ABV, CFF 1
Chapter 9. The Valuation of Common Stock. 1.The Expected Return (Copied from Unit02, slide 36)
") Readings Chapters 9 and 10 Chapter 9. The Valuation of Common Stock 1. The investor s expected return 2. Valuation as the Present Value (PV) of dividends and the growth of dividends 3. The investor s required
Readings Chapters 9 and 10 Chapter 9. The Valuation of Common Stock 1. The investor s expected return 2. Valuation as the Present Value (PV) of dividends and the growth of dividends 3. The investor s required
Target Retirement Funds
 Prospectus March 1, 2015 Target Retirement Funds Institutional Class Administrative Class Investor Class Harbor Target Retirement Income Fund HARAX HARBX HARCX Harbor Target Retirement 2015 Fund HARGX
NOTES ON THE BANK OF ENGLAND OPTION-IMPLIED PROBABILITY DENSITY FUNCTIONS
 1 NOTES ON THE BANK OF ENGLAND OPTION-IMPLIED PROBABILITY DENSITY FUNCTIONS Options are contracts used to insure against or speculate/take a view on uncertainty about the future prices of a wide range
Volatility at Karachi Stock Exchange
 The Pakistan Development Review 34 : 4 Part II (Winter 1995) pp. 651 657 Volatility at Karachi Stock Exchange ASLAM FARID and JAVED ASHRAF INTRODUCTION Frequent crashes of the stock market reported during
OPTIONS CALCULATOR QUICK GUIDE. Reshaping Canada s Equities Trading Landscape
 OPTIONS CALCULATOR QUICK GUIDE Reshaping Canada s Equities Trading Landscape OCTOBER 2014 Table of Contents Introduction 3 Valuing options 4 Examples 6 Valuing an American style non-dividend paying stock
BUSM 411: Derivatives and Fixed Income
 BUSM 411: Derivatives and Fixed Income 2. Forwards, Options, and Hedging This lecture covers the basic derivatives contracts: forwards (and futures), and call and put options. These basic contracts are
VIANELLO FORENSIC CONSULTING, L.L.C.
 VIANELLO FORENSIC CONSULTING, L.L.C. 6811 Shawnee Mission Parkway, Suite 310 Overland Park, KS 66202 (913) 432-1331 THE MARKETING PERIOD OF PRIVATE SALE TRANSACTIONS Updated for Sales through 2010 By Marc
A Review of Cross Sectional Regression for Financial Data You should already know this material from previous study
 A Review of Cross Sectional Regression for Financial Data You should already know this material from previous study But I will offer a review, with a focus on issues which arise in finance 1 TYPES OF FINANCIAL
TRANSAMERICA SERIES TRUST Transamerica Vanguard ETF Portfolio Conservative VP. Supplement to the Currently Effective Prospectus and Summary Prospectus
 TRANSAMERICA SERIES TRUST Transamerica Vanguard ETF Portfolio Conservative VP Supplement to the Currently Effective Prospectus and Summary Prospectus * * * The following replaces in their entirety the
GAMMA.0279 THETA 8.9173 VEGA 9.9144 RHO 3.5985
 14 Option Sensitivities and Option Hedging Answers to Questions and Problems 1. Consider Call A, with: X $70; r 0.06; T t 90 days; 0.4; and S $60. Compute the price, DELTA, GAMMA, THETA, VEGA, and RHO
Industrial Alliance Continues to Grow its Net Income in the First Quarter of 2008
 Industrial Alliance Continues to Grow its Net Income in the First Quarter of 2008 Quebec City, May 7, 2008 Industrial Alliance Insurance and Financial Services Inc. ("Industrial Alliance" or "the Company")
University of Essex. Term Paper Financial Instruments and Capital Markets 2010/2011. Konstantin Vasilev Financial Economics Bsc
 University of Essex Term Paper Financial Instruments and Capital Markets 2010/2011 Konstantin Vasilev Financial Economics Bsc Explain the role of futures contracts and options on futures as instruments
Interest Rates and Inflation: How They Might Affect Managed Futures
 Faced with the prospect of potential declines in both bonds and equities, an allocation to managed futures may serve as an appealing diversifier to traditional strategies. HIGHLIGHTS Managed Futures have
Implied Volatility for FixedResets
 Implied Volatility for FixedResets In this essay I explain the calculation of Implied Volatility for FixedResets, in accordance with a spreadsheet I have developed which is publicly available at http://www.prefblog.com/xls/impliedvolatility.xls.
Working Papers. Cointegration Based Trading Strategy For Soft Commodities Market. Piotr Arendarski Łukasz Postek. No. 2/2012 (68)
") Working Papers No. 2/2012 (68) Piotr Arendarski Łukasz Postek Cointegration Based Trading Strategy For Soft Commodities Market Warsaw 2012 Cointegration Based Trading Strategy For Soft Commodities Market
Working Papers No. 2/2012 (68) Piotr Arendarski Łukasz Postek Cointegration Based Trading Strategy For Soft Commodities Market Warsaw 2012 Cointegration Based Trading Strategy For Soft Commodities Market
Section A. Index. Section A. Planning, Budgeting and Forecasting Section A.2 Forecasting techniques... 1. Page 1 of 11. EduPristine CMA - Part I
 Index Section A. Planning, Budgeting and Forecasting Section A.2 Forecasting techniques... 1 EduPristine CMA - Part I Page 1 of 11 Section A. Planning, Budgeting and Forecasting Section A.2 Forecasting
Financial Markets of Emerging Economies Part I: Do Foreign Investors Contribute to their Volatility? Part II: Is there Contagion from Mature Markets?
 1 Financial Markets of Emerging Economies Part I: Do Foreign Investors Contribute to their Volatility? Part II: Is there Contagion from Mature Markets? Martin T. Bohl Westfälische Wilhelms-University Münster,