Computer and Internet Use in the United States: 2003
|
|
|
- Dorthy Morgan
- 8 years ago
- Views:
Transcription
1 Computer and Internet Use in the United States: 2003 Special Studies Issued October 2005 P Introduction This report provides information about the characteristics of households and people who have and have not adopted use of computers and the Internet. The findings in this report are based on data collected in a supplement to the October 2003 Current Population Survey that included questions about computer and Internet use at home, school, and work. 1 The has asked questions in the Current Population Survey to assess computer use since 1984 and Internet use since The first part of this report examines computer and Internet use in households. The second and third parts of the report deal with computer and Internet use among children and adults, respectively. COMPUTERS AND INTERNET ACCESS IN HOUSEHOLDS Prevalence of Personal Computers and Internet Access The majority of households have personal computers and Internet access. In 2003, 70 million American households, or 62 percent, had one or more computers, up from 56 percent in 2001 (Figure 1). 2 In 1984, the proportion of households with a computer was 8 percent. Current Population Reports By Jennifer Cheeseman Day, Alex Janus, and Jessica Davis Figure 1. Households With a Computer and Internet Access: 1984 to 2003 (In percent) Households with a computer Households with Internet access Source:, Current Population Survey, 1984, 1989, 1993, 1997, 1998, 2000, 2001, The data in this report are from the Computer and Internet Use Supplement to the October 2003 Current Population Survey. The population represented (the population universe) is the civilian noninstitutionalized population living in the United States. 2 The estimates in this report (which may be shown in text, figures, and tables) are based on responses from a sample of the population and may differ from actual values because of sampling variability or other factors. As a result, apparent differences between the estimates for two or more groups may not be statistically significant. All comparative statements have undergone statistical testing and are significant at the 90-percent confidence level unless otherwise noted. U S C E N S U S B U R E A U Helping You Make Informed Decisions U.S. Department of Commerce Economics and Statistics Administration U.S. CENSUS BUREAU

2 2

3 Sixty-two million households, or The presence of a school-aged child puter and 31 percent had Internet 55 percent, had Internet access, up also influenced whether a house- access. from 50 percent in 2001, and more hold had a computer or Internet than triple the proportion of house- access. More than three-quarters of Households Without Internet holds with Internet access in 1997 households with a school-aged child Access (18 percent). Most households with (6 to 17 years) had a computer, and a computer also had Internet access 67 percent had Internet access. In Forty-five percent of households did (88 percent). 3 In 1997, less than comparison, 57 percent of house- not have Internet access at home half of households with computers holds without a school-aged child in The three most comhad someone using the Internet. had a computer, and 50 percent had mon reasons were don t need it, Internet access. not interested (39 percent), costs While computer ownership and are too high, and no computer or home Internet access have been High-income households were more computer inadequate (each at adopted widely, some groups had likely to have a computer or Internet 23 percent, Table B). A few houselower adoption rates. For instance, access. Among family households holds had access elsewhere 35 percent of households with with incomes of $100,000 or more (2 percent). Language barriers, householders aged 65 and older, during the 12 months prior to the concern that children will access inabout 45 percent of households survey, 95 percent had at least one appropriate sites, and privacy and with Black or Hispanic household- computer and 92 percent had Inter- security concerns were rarely given ers, and 28 percent of households net access at home. Among family as reasons (each 1 percent). 7 with householders who had less households with incomes below than a high school education had a $25,000, 41 percent had a com- Among households without the Incomputer (Table A). 4 In addition, ternet, more than 4 out of 5 also did 41 percent of one-person households and 46 percent of nonfamily Hereafter, this report uses the term non- The percent of households with comput- 5 households owned a computer. 5 Hispanic White to refer to people who reported ers with either Black or Hispanic householders they are White only and not Hispanic or La- is not significantly different from the percent Differences among households in tino. The term Black is used to refer to people of nonfamily households with computers. Internet access mirror those for who reported the single race Black or African 6 The Current Population Survey asked why American, the term Asian refers to people who computer ownership. respondents did not have Internet access. It reported the single race Asian, and the term did not ask reasons for not having a home Hispanic refers to people who are Hispanic or computer. Latino. Because Hispanics may be any race, 3 7 Twelve percent of households with a data in this report for Hispanics overlap slight- The value for language barriers is staly with data for the Black population and for tistically different from the values for concern computer did not have Internet access, and another one-half million (less than 1 percent) the Asian population. Based on the October that children will access inappropriate sites without a computer accessed the Internet us Current Population Survey, 3.6 percent and privacy and security concerns. ing some other device. of the single-race Black population 3 years and older and 1.0 percent of the single-race Asian population 3 years and older were Hispanic. 3
 had a computer, and a computer also had Internet access 67 percent had Internet access. In Forty-five percent of households did (88 percent).")
4 not have a computer (83 percent). holds had Internet access. Southern proportions of Internet access in the For 41 percent of these computer- households had the lowest rates of home: about 40 percent. 8 less households, don t need it, not access: 59 percent had a computer interested was the primary reason and 52 percent had an Internet for not having Internet access. For connection. COMPUTER AND INTERNET about one-fourth of these house- USE AMONG CHILDREN holds, the lack of a computer was Since 2000, rates of computer use the primary reason. have become more uniform across Historically, access to computer the country, narrowing the technol- and Internet technology has been As shown in Figure 2, disinterest in ogy gap between the West and discussed separately from its actual the Internet is related to the age of the South. The difference between use. Since almost 9 in 10 children the householder. Of the 20 million the two regions decreased from living in a household with a comhouseholders who stated they were 10 percentage points in 2000 puter used it in 2003, the difference not interested in the Internet, over (57 percent in the West and between access and use is mini- 60 percent (12.7 million) were aged 47 percent in the South) to mal (Table C). The percentage of 55 and older. Householders aged 8 percentage points in children living in a household with 15 to 44 without Internet access a computer who used it increased most frequently cited costs are too Households in Utah, Alaska, New from 75 percent in 1993 to high as the reason. Hampshire, and Washington were 86 percent in among those with the highest rates of computer ownership (about Regional and State Rates of 72 percent, Figure 3), while the Utah s rate of computer ownership was Computer and Internet Access higher than that of other states except for rates in Mississippi, Arkansas, and Alaska, New Hampshire, and Washington. While households in the West had Louisiana were among the lowest Mississippi s rate of computer ownership was lower than that of other states except the highest rates of access to these (about 50 percent). Alaska and New for Arkansas and Louisiana. Alaska s rate of technologies, households in the Hampshire were also among the Internet access was higher than that of other states except for New Hampshire. Mississtates with the highest proportions sippi s rate of Internet access was lower than Northeast, Midwest, and South were close behind (Table A). In 2003, of households with access to the that of other states except for Arkansas. 67 percent of households in the Internet (about 65 percent). House- 9 For more information on computer use in 1993, see the detailed tables at <www West had at least one computer in holds in Mississippi and Arkansas.census.gov/population/www/socdemo the home, and 59 percent of house- were among those with the lowest /computer/computer93.html>. Figure 2. Selected Reasons for No Internet Access in Household by Age of Householder: 2003 (In millions) 5.6 Don t need it, not interested Costs are too high No computer or computer inadequate Under and over Source:, Current Population Survey, October

5 Figure 3. Households With a Computer and Internet Access by Region and State: 2003 (In percent) REGION West Northeast Midwest South Households with Internet access 90-percent confidence interval Midpoint STATE Utah Alaska New Hampshire Washington Colorado Connecticut Idaho Minnesota Maine Oregon Virginia Nebraska California Maryland Vermont Wyoming New Jersey Iowa Arizona Delaware Massachusetts Wisconsin Kansas Hawaii Rhode Island South Dakota United States North Dakota Nevada Florida Georgia Missouri Pennsylvania Illinois Michigan New York Montana Indiana District of Columbia Texas Ohio Kentucky North Carolina Tennessee Oklahoma South Carolina West Virginia New Mexico Alabama Louisiana Arkansas Mississippi Source:, Current Population Survey, October Households with a computer 90-percent confidence interval Midpoint 5

6 6
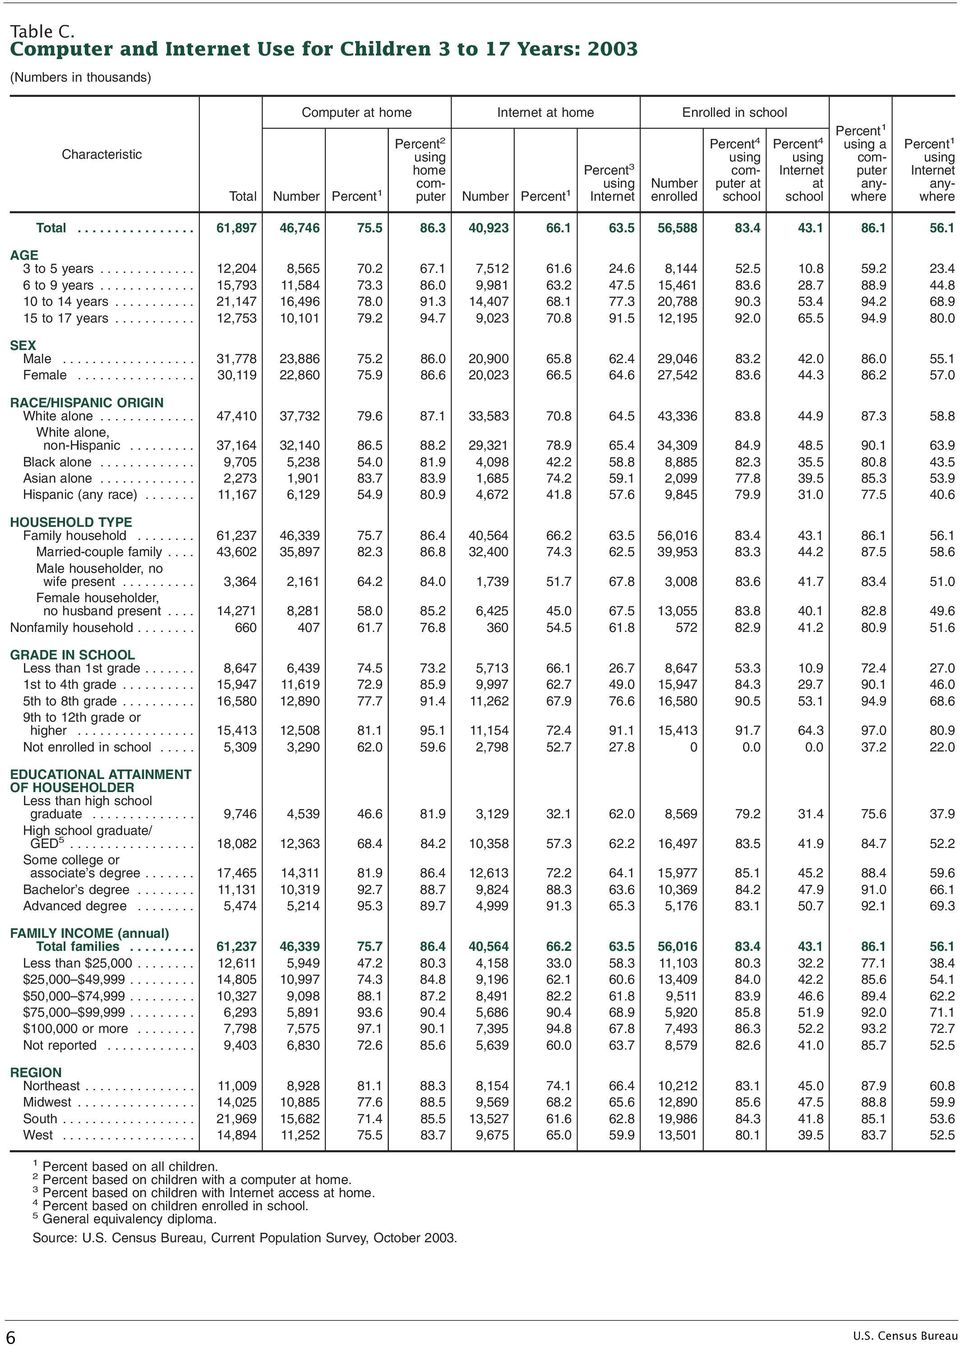
7 Children s access to a computer at home and at school has increased in recent years. In 1993, 32 percent of children had access to a computer at home and 61 percent used a computer at school. In 2003, about three-quarters (76 percent) of all children 3 to 17 years lived in a household with a computer, and 83 percent of the 57 million enrolled children used a computer at school, giving this generation more exposure to technology than their predecessors. Despite these increases, rates of access to and use of computers continued to vary among groups (Table C). In 2003, the percentage of children living in homes with a computer ranged from 70 percent for young children (aged 3 to 5) to 79 percent for older teenagers (aged 15 to 17). Among children who lived in a home with a computer, older children were more likely than younger children to use the computer usage was nearly universal among older children, 95 percent, compared with 67 percent of younger children. Rates of children s home computer access and use varied by race and Hispanic origin. Non-Hispanic White or Asian children (each about 85 percent) were more likely to have a computer at home than Black or Hispanic children (each about 54 percent). Among those who lived in households with a computer, the differences in usage rates within those households were 88 percent for non-hispanic Whites and about 82 percent each for Blacks, Asians, and Hispanics. Educational attainment of the householder continued to show a relationship to the presence of a computer in the household. While 47 percent of children living with a householder who had less than a high school education had a computer, 94 percent of the children in households where the householder had a bachelor s degree or more education had a computer available to them at home. The difference in computer use rates between these at home and at school. Among groups with access to a computer children who used a computer in was 82 percent and 89 percent, one location, more used a computer respectively. at school than at home, 24 percent compared with 6 percent. Adding Children s family income had a all three groups (at home, at school, similar relationship to computer in both locations) together, more presence in the household. Forty- than 9 in 10 schoolchildren used a seven percent of children with computer somewhere, leaving family incomes under $25,000 lived 7 percent who did not use a comin a household with a computer, puter in any location. compared with 97 percent of those with family incomes of at least Schools give computer access to $100,000. Eighty percent of chil- children who do not have it at dren in families with lower incomes home. As illustrated in Figure 5, used the computer if one was schools provided computer access in the household, compared with to all groups regardless of family 90 percent of children from families income, race, and Hispanic origin. with higher incomes. Children from family households with incomes of $100,000 or more Computer Use at School and at enrolled in kindergarten through Home 12th grade had the highest rates School affects children s access of home computer use, 92 percent, to and use of computers. Among compared with 41 percent of chilschoolchildren enrolled in kinder- dren from households with incomes garten through 12th grade (K 12), below $25,000, a difference of about 8 in 10 used a computer at about 50 percentage points. At home, and about 9 in 10 used a school, 91 percent of children from computer at school in 2003 families with the highest incomes (Figure 4). used a computer, compared with 84 percent of those with the lowest More than half (64 percent) of incomes, a difference of 6 percentschoolchildren used computers both age points. Figure 4. Use of Computers Among Children Enrolled in Grades K 12: 2003* (In percent) Use at home Use at school Use at both home and school Use only at school Use only at home No use * The percentages for home and school computer use differ from the corresponding percentages in Table C because this figure excludes children who were not enrolled in grades K 12. Source:, Current Population Survey, October
 to 79 percent for older teenagers (aged 15 to 17).")
8 Figure 5 illustrates a similar effect among children by race and Hispanic origin. The highest and lowest rates for computer use at home differed by 33 percentage points, with 80 percent of non-hispanic White children using a computer at home, compared with about 48 percent each of Black children and Hispanic children. At school, the differences diminished, with 89 percent of non- Hispanic White children and about 85 percent of Black and Hispanic children using computers there. Figure 5. Computer Use at Home and School Among Children Enrolled in Grades K 12 by Family Income, Race and Hispanic Origin, and Type of School: 2003 (In percent) Computer use by family income* Home use School use More than $100,000 $75,000 to $99,999 $50,000 to $74,999 $25,000 to $49,999 Less than $25,000 Total use Computer use by race and Hispanic origin Home use White alone, non-hispanic Asian alone Black alone Hispanic (any race) School use Total use Computer use by type of school Home use Attends private school Attends public school School use Total use *Among children in families. Source:, Current Population Survey, October

9 The 15-percentage-point difference between public and private schoolchildren in home computer-use rates disappeared when the children were at school. The percentage of students who used a computer at public school was marginally higher than that of children who used a computer at private school (87 percent compared with 85 percent), reversing a historical trend. 10 Figure 6. Types of Computer Use at Home for Children 3 to 17 Years by Age: 2003 (Percentage of children who use a computer at home) School assignments Eighty-three percent of children aged 3 to 17 with a computer at home used it to play games, the most common single use, followed by school assignments (66 percent) and connecting to the Internet (64 percent, Figure 6). Children used a broader range of computer applications as they aged. Playing games was the most frequent activity among the youngest children (85 percent). For the oldest children, school assignments and accessing the Internet were more common activities (91 percent and 86 percent, respectively). Internet Play games Children who accessed the Internet, whether at home, school, or elsewhere, most often used online connectivity to complete school assignments (75 percent). The next most common Internet use among children was playing games (65 percent), followed by or instant messaging (60 percent). 11 Word processing COMPUTER AND INTERNET USE AMONG ADULTS Overall, use of computers by adults (people 18 years and older) was less prevalent than use by children. Sixty-four percent of adults used a computer at some location (home, school, or work) in 2003, compared with 86 percent of children (Tables C and D). Due to the large proportion of very young children who Graphics or manipulate audios* Spreadsheets* Manage household finances* *Asked only of children aged 15 to 17. Source:, Current Population Survey, October to 17 years 3 to 5 years 6 to 9 years 10 to 14 years 15 to 17 years 10 For more information on computer use in earlier years, see < /population/www/socdemo/computer.html>. 11 For more information on children s activites on the Internet, see the 2003 Detailed Table 9A at < /www/socdemo/computer.html>. used a computer and did not use the Internet, a larger proportion of adults than children used the Internet at some location (60 percent compared with 56 percent). Over the past two decades, the proportion of adults (people 18 years and over) using a computer anywhere has grown, from 18 percent in 1984, to 36 percent in 1993, to 9
 and connecting to the Internet")
10 10
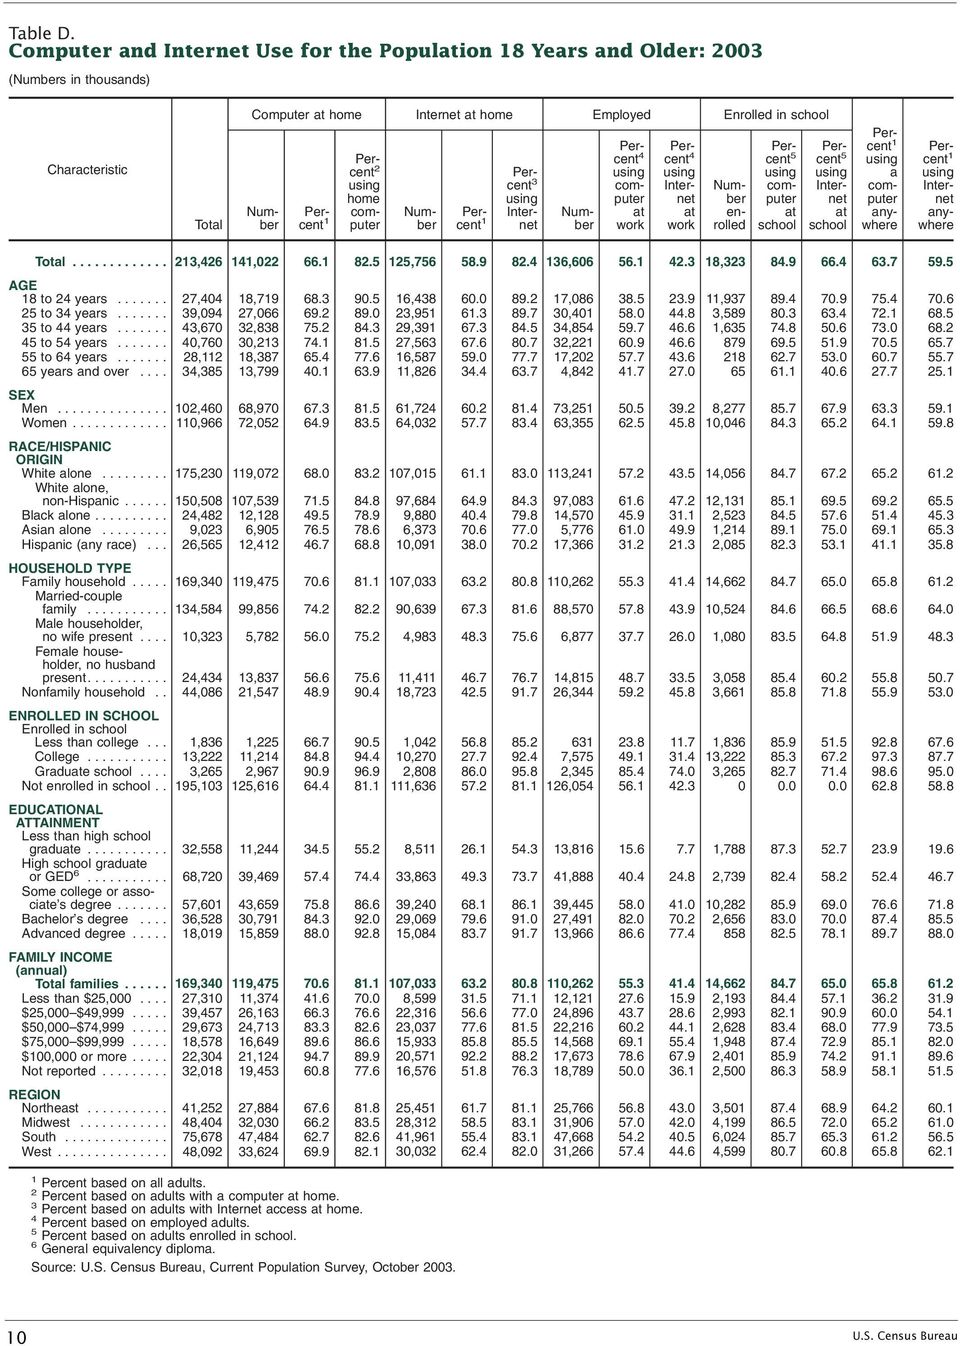
11 64 percent in From 1997 (the first year in which the CPS collected information on Internet use) to 2003, use of the Internet among adults jumped from 22 percent to 60 percent. Among adults, two-thirds (66 percent) had a computer at home, and among those, 83 percent used the computer. Fifty-nine percent of adults had Internet access at home, and 82 percent of them used it. More than half of working adults used a computer at work (56 percent), and 42 percent used the Internet on the job. Among adult students, 85 percent said they used a computer at school, and 66 percent used the Internet there. As was the case for children, adults use of these technologies varied with their socioeconomic and demographic characteristics. Adults with an advanced degree, for example, had the highest rates of computer use anywhere. Asian or non-hispanic White adults (about 69 percent each) were more likely to use a computer than Blacks or Hispanics (51 percent and 41 percent, respectively). People 65 and older had lower rates of computer use (28 percent) and Internet use (25 percent) than was the case for other age groups. Adults 18 to 24 years of age were most likely to use a computer or the Internet someplace (75 percent and 71 percent, respectively). Computer Use by Sex In 2003, more women than men used a computer at home by a small margin, reversing the computer use gender gap exhibited during the 1980s and 1990s. 12 In 1984, men s home computer use was 20 percentage points higher than that of women (Figure 7). This gap decreased to 3 percentage points in 12 For more information on computer use by sex in the 1980s and 1990s, see Computer Use in the United States: 1984, Computer Use in the United States: 1989, and Computer Use in the United States: 1997, at < Figure 7. Population 18 Years and Older Using a Computer at Home by Sex: 1984 to 2003 (In percent) 83.5 Men Women Source:, Current Population Survey, October and reversed in 2001, favoring women by 2 percentage points. Similarly, women s Internet use at home exceeded men s in At work, women have had higher rates of computer use than men since the CPS first collected data on computer use in 1984, when 29 percent of working women used a computer on the job, compared with 21 percent of working men. In 2003, 63 percent of women and 51 percent of men used a computer at work. Forty-seven percent of women and 39 percent of men used the Internet on the job in 2003 (Table E). Some of the historically higher rates of women s computer use at work may derive in part from the type of jobs they have held. In 2003, the technology use-intensive office and administrative support occupations accounted for 23 percent of all working women and 6 percent of working men. While office and administrative support occupations accounted for 7 percent of men using computers on the job, this category accounted for 29 percent of all women using computers at work. The percentages of women and men who use computers at work also differ by occupation group. Among men, the group with the highest percentage of workers using a computer was professional occupations. For women, the most computer users were in the management, business, and financial occupations. Internet Use for Communication and Commerce Over the last few years, computer and Internet technologies have merged into a communications device for both home and work life. By 2003, more adult computer users accessed the Internet than performed any other computing task: 89 percent of home users and 75 percent of those at work (Table F). Nearly 9 in 10 adult Internet users (88 percent) used the Internet to send or receive , and nearly 8 in 10 (78 percent) used the Internet to get information on products or services. 11

12 12

13 The proportions of the population performing tasks online, and the activities they choose, demonstrate some of the ways the technology is affecting society: The Internet has become a major venue for the dissemination of news. In 6 years, the proportion of adults who used the Internet to find information on news, weather, or sports increased from 7 percent in 1997 to 40 percent in 2003 (Figure 8), and the proportion using the Internet to find information on government or health services increased from 12 percent to 33 percent. 13 Figure 8. Population 18 Years and Older Using the Internet for a Specific Task: 1997, 2001, and 2003 (In percent) Total using Internet Information on products or services News, weather, sports information The Internet is also changing interpersonal communication. More than half (55 percent) of all adults used or instant messaging in 2003, compared with 12 percent of adults in Information on government/ health services* Purchase products or services** The Internet has become an integral part of the economy. Eighteen percent of adults conducted banking online in Twelve percent of adults used the Internet to search for a job. Nearly half of adults (47 percent) used the Internet to find information on products or services. About one-third of adults (32 percent) actually purchased a product or service online, compared with 2.1 percent of adults who used the Internet for shopping in SOURCE OF THE DATA The population represented (the population universe) in the Computer and Internet Use Supplement to the October 2003 Current Population Survey is the civilian noninstitutionalized population living in the United States. The institutionalized population, which is excluded from the population universe, is com- 13 Data from 1997 derive from the answer Search for information such as government, business, health, education to the question What do you use the Internet for at home? In 2001 and 2003, household members were asked about specific uses of the Internet anywhere, not at home. Play games Bank online View TV or movies, listen to radio Search for a job School assignments Trade stocks, mutual funds Take a course online Telephone calls *Data from 1997 derive from the answer Search for information such as government, business, health, education. **Data from 1997 derive from the answer Shopping. Note: Data from 1997 derive from the question What do you use the Internet for at home? Source:, Current Population Survey, October 1997, September 2001, and October

14 posed primarily of the population in correctional institutions and nursing homes (91 percent of the 4.1 million institutionalized people in Census 2000). Most estimates in this report come from data obtained in October 2003 from the Current Population Survey (CPS). Some estimates are based on data obtained from the CPS in earlier years, including October 1984, October 1989, October 1993, October 1997, December 1998, August 2000, and September The conducts this survey every month. ACCURACY OF THE ESTIMATES Statistics from surveys are subject to sampling error and nonsampling error. All comparisons presented in this report have taken sampling error into account and are significant at the 90-percent confidence level. This means the 90-percent confidence level for the difference between estimates being compared does not include zero. Nonsampling error in surveys may be attributed to a variety of sources, such as how the survey was designed, how respondents interpret questions, how able and willing respondents are to provide correct answers, and how accurately answers are coded and classified. To minimize these errors, the Census Bureau employs quality control procedures in sample selection, the wording of questions, interviewing, coding, data processing, and data analysis. The Current Population Survey weighting procedure uses ratio estimation whereby sample estimates are added to independent estimates of the national population by age, race, sex, and Hispanic origin. This weighting partially corrects for bias due to undercoverage, but biases may still be present when people who are missed by the survey differ from those interviewed in ways other than age, race, sex, and Hispanic origin. How this weighting procedure affects other variables in the survey is not precisely known. All of these considerations affect comparisons across different surveys or data sources. For further information on the source of the data and accuracy of the estimates, including standard errors and confidence intervals, contact Jana Shepherd of the Demographic Statistical Methods Division via at <dsmd.source.and.accuracy@census.gov>. MORE INFORMATION Detailed tabulations with characteristics of households, children, and adults by computer presence in the home, computer use, Internet use, and other variables are available on the Internet at the Census Bureau s Web site < Once on the site, in the Subjects A-Z area, click on C, and then on Computer Use and Ownership. CONTACT For additional information on these topics, contact Jessica Davis, Education and Social Stratification Branch, or via at <Jessica.W.Davis@census.gov>. USER COMMENTS The Census Bureau welcomes the comments and advice of data and report users. If you have any suggestions or comments, please write to: Chief, Population Division Washington, DC or send to: pop@census.gov 14

15 U.S. Department of Commerce Economics and Statistics Administration U.S. CENSUS BUREAU Washington, DC FIRST-CLASS MAIL POSTAGE & FEES PAID Permit No. G-58 OFFICIAL BUSINESS Penalty for Private Use $300

Educational Attainment in the United States: 2003
 Educational Attainment in the United States: 2003 Population Characteristics Issued June 2004 P20-550 The population in the United States is becoming more educated, but significant differences in educational
Home Computers and Internet Use in the United States: August 2000
 Home Computers and Internet Use in the United States: August 2000 Special Studies Issued September 2001 P23-207 Defining computer and Internet access All individuals living in a household in which the
Three-Year Moving Averages by States % Home Internet Access
 Three-Year Moving Averages by States % Home Internet Access Alabama Alaska Arizona Arkansas California Colorado Connecticut Delaware Florida Georgia Hawaii Idaho Illinois Indiana Iowa Kansas Kentucky Louisiana
STATE DATA CENTER. District of Columbia MONTHLY BRIEF
 District of Columbia STATE DATA CENTER MONTHLY BRIEF N o v e m b e r 2 0 1 2 District Residents Health Insurance Coverage 2000-2010 By Minwuyelet Azimeraw Joy Phillips, Ph.D. This report is based on data
Public School Teacher Experience Distribution. Public School Teacher Experience Distribution
 Public School Teacher Experience Distribution Lower Quartile Median Upper Quartile Mode Alabama Percent of Teachers FY Public School Teacher Experience Distribution Lower Quartile Median Upper Quartile
NON-RESIDENT INDEPENDENT, PUBLIC, AND COMPANY ADJUSTER LICENSING CHECKLIST
 NON-RESIDENT INDEPENDENT, PUBLIC, AND COMPANY ADJUSTER LICENSING CHECKLIST ** Utilize this list to determine whether or not a non-resident applicant may waive the Oklahoma examination or become licensed
BUSINESS DEVELOPMENT OUTCOMES
 BUSINESS DEVELOPMENT OUTCOMES Small Business Ownership Description Total number of employer firms and self-employment in the state per 100 people in the labor force, 2003. Explanation Business ownership
Impacts of Sequestration on the States
 Impacts of Sequestration on the States Alabama Alabama will lose about $230,000 in Justice Assistance Grants that support law STOP Violence Against Women Program: Alabama could lose up to $102,000 in funds
Workers Compensation State Guidelines & Availability
 ALABAMA Alabama State Specific Release Form Control\Release Forms_pdf\Alabama 1-2 Weeks ALASKA ARIZONA Arizona State Specific Release Form Control\Release Forms_pdf\Arizona 7-8 Weeks by mail By Mail ARKANSAS
MAINE (Augusta) Maryland (Annapolis) MICHIGAN (Lansing) MINNESOTA (St. Paul) MISSISSIPPI (Jackson) MISSOURI (Jefferson City) MONTANA (Helena)
 Maryland (Annapolis) MICHIGAN (Lansing) MINNESOTA (St. Paul) MISSISSIPPI (Jackson) MISSOURI (Jefferson City) MONTANA (Helena)") HAWAII () IDAHO () Illinois () MAINE () Maryland () MASSACHUSETTS () NEBRASKA () NEVADA (Carson ) NEW HAMPSHIRE () OHIO () OKLAHOMA ( ) OREGON () TEXAS () UTAH ( ) VERMONT () ALABAMA () COLORADO () INDIANA
HAWAII () IDAHO () Illinois () MAINE () Maryland () MASSACHUSETTS () NEBRASKA () NEVADA (Carson ) NEW HAMPSHIRE () OHIO () OKLAHOMA ( ) OREGON () TEXAS () UTAH ( ) VERMONT () ALABAMA () COLORADO () INDIANA
Census Data on Uninsured Women and Children September 2009
 March of Dimes Foundation Office of Government Affairs 1146 19 th Street, NW, 6 th Floor Washington, DC 20036 Telephone (202) 659-1800 Fax (202) 296-2964 marchofdimes.com nacersano.org Census Data on Uninsured
Chex Systems, Inc. does not currently charge a fee to place, lift or remove a freeze; however, we reserve the right to apply the following fees:
 Chex Systems, Inc. does not currently charge a fee to place, lift or remove a freeze; however, we reserve the right to apply the following fees: Security Freeze Table AA, AP and AE Military addresses*
Englishinusa.com Positions in MSN under different search terms.
 Englishinusa.com Positions in MSN under different search terms. Search Term Position 1 Accent Reduction Programs in USA 1 2 American English for Business Students 1 3 American English for Graduate Students
Data show key role for community colleges in 4-year
 Page 1 of 7 (https://www.insidehighered.com) Data show key role for community colleges in 4-year degree production Submitted by Doug Lederman on September 10, 2012-3:00am The notion that community colleges
Licensure Resources by State
 Licensure Resources by State Alabama Alabama State Board of Social Work Examiners http://socialwork.alabama.gov/ Alaska Alaska Board of Social Work Examiners http://commerce.state.ak.us/dnn/cbpl/professionallicensing/socialworkexaminers.as
Changes in Self-Employment: 2010 to 2011
 Changes in Self-Employment: 2010 to 2011 American Community Survey Briefs By China Layne Issued January 2013 ACSBR/11-21 INTRODUCTION From December 2007 to June 2009, the United States experienced an economic
Young-Adult Voting: An Analysis of Presidential Elections, 1964 2012
 Young-Adult Voting: An Analysis of Presidential Elections, 1964 2012 Population Characteristics By Thom File Issued April 2014 P20-573 INTRODUCTION Voting is arguably the most important civic opportunity
American C.E. Requirements
 American C.E. Requirements Alaska Board of Nursing Two of the following: 30 contact hours 30 hours of professional nursing activities 320 hours of nursing employment Arizona State Board of Nursing Arkansas
High Risk Health Pools and Plans by State
 High Risk Health Pools and Plans by State State Program Contact Alabama Alabama Health 1-866-833-3375 Insurance Plan 1-334-263-8311 http://www.alseib.org/healthinsurance/ahip/ Alaska Alaska Comprehensive
State Tax Information
 State Tax Information The information contained in this document is not intended or written as specific legal or tax advice and may not be relied on for purposes of avoiding any state tax penalties. Neither
Net-Temps Job Distribution Network
 Net-Temps Job Distribution Network The Net-Temps Job Distribution Network is a group of 25,000 employment-related websites with a local, regional, national, industry and niche focus. Net-Temps customers'
April 2014. For Kids Sake: State-Level Trends in Children s Health Insurance. A State-by-State Analysis
 April 2014 For Kids Sake: State-Level Trends in Children s Health Insurance A State-by-State Analysis 2 STATE HEALTH ACCESS DATA ASSISTANCE CENTER Contents Executive Summary... 4 Introduction... 5 National
State Tax Information
 State Tax Information The information contained in this document is not intended or written as specific legal or tax advice and may not be relied on for purposes of avoiding any state tax penalties. Neither
State-Specific Annuity Suitability Requirements
 Alabama Alaska Arizona Arkansas California Colorado Connecticut Delaware District of Columbia Effective 10/16/11: Producers holding a life line of authority on or before 10/16/11 who sell or wish to sell
million 0.6 million 7.1 million
 KEY STATS Number of Americans who volunteer mainly with arts groups: 1 million volunteer secondarily with arts groups: 0.6 million provide free artistic services to non-arts groups: 7.1 million Research
NAIC ANNUITY TRAINING Regulations By State
 Select a state below to display the current regulation and requirements, or continue to scroll down. Light grey text signifies states that have not adopted an annuity training program. Alabama Illinois
THE 2013 HPS SALARY SURVEY
 THE 2013 HPS SALARY SURVEY Stephen L. Bump Introduction The 2013 Health Physics Society (HPS) survey data was collected by having health physicists (HPs) submit their responses to survey questions on a
Real Progress in Food Code Adoption
 Real Progress in Food Code Adoption The Association of Food and Drug Officials (AFDO), under contract to the Food and Drug Administration, is gathering data on the progress of FDA Food Code adoptions by
STATISTICAL BRIEF #137
 Medical Expenditure Panel Survey STATISTICAL BRIEF #137 Agency for Healthcare Research and Quality August 26 Treatment of Sore Throats: Antibiotic Prescriptions and Throat Cultures for Children under 18
THE 2012 HPS SALARY SURVEY
 THE 2012 HPS SALARY SURVEY Gary Lauten Introduction The 2012 Health Physics Society (HPS) survey data was collected by having health physicists (HPs) submit their responses to survey questions on a webbased
School Enrollment: 2000
 School Enrollment: 2000 Census 2000 Brief Issued August 2003 C2KBR-26 According to Census 2000, more than onefourth of the U.S. population aged 3 and older attended in the spring of 2000. The 76.6 million
State Pest Control/Pesticide Application Laws & Regulations. As Compiled by NPMA, as of December 2011
 State Pest Control/Pesticide Application Laws & As Compiled by NPMA, as of December 2011 Alabama http://alabamaadministrativecode.state.al.us/docs/agr/mcword10agr9.pdf Alabama Pest Control Alaska http://dec.alaska.gov/commish/regulations/pdfs/18%20aac%2090.pdf
Attachment A. Program approval is aligned to NCATE and is outcomes/performance based
 Attachment A The following table provides information on student teaching requirements across several states. There are several models for these requirements; minimum number of weeks, number of required
APPENDIX A. Tables. Appendix A Tables 119
 118 The Condition of Education 2012 APPENDIX A Tables Appendix A Tables 119 Indicator 1 Enrollment Trends by Age Table A-1-1. Percentage of the population ages 3 34 enrolled in school, by age group: October
STATE-SPECIFIC ANNUITY SUITABILITY REQUIREMENTS
 Alabama Alaska Arizona Arkansas California This jurisdiction has pending annuity training legislation/regulation Annuity Training Requirement Currently Effective Initial 8-Hour Annuity Training Requirement:
$7.5 appropriation $6.5 2011 2012 2013 2014 2015 2016. Preschool Development Grants
 School Readiness: High-Quality Early Learning Head Start $10.5 $9.5 $10.1 +$1.5 +17.7% $8.5 $7.5 +$2.1 +27.0% $6.5 for fiscal year 2010 Included in the budget is $1.078 billion to ensure that every Head
State Specific Annuity Suitability Requirements updated 10/10/11
 Alabama Alaska Ai Arizona Arkansas California This jurisdiction has pending annuity training legislation/regulation Initial 8 Hour Annuity Training Requirement: Prior to selling annuities in California,
What to Know About State CPA Reciprocity Rules. John Gillett, PhD, CPA Chair, Department of Accounting Bradley University, Peoria, IL
 What to Know About State CPA Reciprocity Rules Paul Swanson, MBA, CPA Instructor of Accounting John Gillett, PhD, CPA Chair, Department of Accounting Kevin Berry, PhD, Assistant Professor of Accounting
Q1 2009 Homeowner Confidence Survey. May 14, 2009
 Q1 2009 Homeowner Confidence Survey Results May 14, 2009 The Zillow Homeowner Confidence Survey is fielded quarterly to determine the confidence level of American homeowners when it comes to the value
STATISTICAL BRIEF #117
 Medical Expenditure Panel Survey STATISTICAL BRIEF #117 Agency for Healthcare Research and Quality March 2006 Children s Dental Visits and Expenses, United States, 2003 Erwin Brown, Jr. Introduction Regular
STATISTICAL BRIEF #273
 STATISTICAL BRIEF #273 December 29 Employer-Sponsored Health Insurance for Employees of State and Local Governments, by Census Division, 28 Beth Levin Crimmel, M.S. Introduction Employees of state and
Educational Attainment: 2000
 Educational Attainment: 2000 Census 2000 Brief Issued August 2003 C2KBR-24 The education levels of the United States population reached an alltime high, according to Census 2000. 1 Of the 182.2 million
February 2015 STATE SUPPLEMENT. Completing College: A State-Level View of Student Attainment Rates
 8 February 2015 STATE SUPPLEMENT Completing College: A State-Level View of Student Attainment Rates Completing College: A State-Level View of Student Attainment Rates In the state supplement to our eighth
********************
 THE SURETY & FIDELITY ASSOCIATION OF AMERICA 1101 Connecticut Avenue, N.W., Suite 800 Washington, D. C. 20036 Phone: (202) 463-0600 Fax: (202) 463-0606 Web page: www.surety.org APPLICATION Application
In 2013, 75.9 million workers age 16 and older in the. Characteristics of Minimum Wage Workers, 2013. Highlights CONTENTS
 U.S. BUREAU OF LABOR STATISTICS M A R C H 2 0 1 4 R E P O R T 1 0 4 8 Characteristics of Minimum Wage Workers, 2013 below the figure of 13.4 percent in 1979, when data were first collected on a regular
The Obama Administration and Community Health Centers
 The Obama Administration and Community Health Centers Community health centers are a critical source of health care for millions of Americans particularly those in underserved communities. Thanks primarily
A Study About Identity Theft
 A Study About Identity Theft Prepared For: The National Foundation for Credit Counseling Prepared By: Harris Interactive Inc. Public Relations Research 1 INTRODUCTION AND METHODOLOGY This Identity Theft
THE CHARACTERISTICS OF PERSONS REPORTING STATE CHILDREN S HEALTH INSURANCE PROGRAM COVERAGE IN THE MARCH 2001 CURRENT POPULATION SURVEY 1
 THE CHARACTERISTICS OF PERSONS REPORTING STATE CHILDREN S HEALTH INSURANCE PROGRAM COVERAGE IN THE MARCH 2001 CURRENT POPULATION SURVEY 1 Charles Nelson and Robert Mills HHES Division, U.S. Bureau of the
State by State Summary of Nurses Allowed to Perform Conservative Sharp Debridement
 State by State Summary of Nurses Allowed to Perform Conservative Sharp Debridement THE FOLLOWING ARE ONLY GENERAL SUMMARIES OF THE PRACTICE ACTS EACH STATE HAS REGARDING CONSERVATIVE SHARP DEBRIDEMENT
We do require the name and mailing address of each person forming the LLC.
 Topic: LLC Managers/Members Question by: Jeff Harvey : Idaho Date: March 7, 2012 Manitoba Corporations Canada Alabama Alaska Arizona Arkansas California Colorado Arizona requires that member-managed LLCs
NAIC Annuity Suitability Requirements by State
 NAIC Annuity Suitability Requirements by Specific Alabama Alaska 10/16/2011 TBD Arizona Arkansas If you obtained a life insurance license prior to 10/16/11, you must complete the NAIC course by 4/16/12.
NOTICE OF PROTECTION PROVIDED BY [STATE] LIFE AND HEALTH INSURANCE GUARANTY ASSOCIATION
![NOTICE OF PROTECTION PROVIDED BY [STATE] LIFE AND HEALTH INSURANCE GUARANTY ASSOCIATION](/thumbs/25/5402451.jpg "NOTICE OF PROTECTION PROVIDED BY [STATE] LIFE AND HEALTH INSURANCE GUARANTY ASSOCIATION") NOTICE OF PROTECTION PROVIDED BY This notice provides a brief summary of the [STATE] Life and Health Insurance Guaranty Association (the Association) and the protection it provides for policyholders. This
NOTICE OF PROTECTION PROVIDED BY This notice provides a brief summary of the [STATE] Life and Health Insurance Guaranty Association (the Association) and the protection it provides for policyholders. This
Overview of School Choice Policies
 Overview of School Choice Policies Tonette Salazar, Director of State Relations Micah Wixom, Policy Analyst CSG West Education Committee July 29, 2015 Who we are The essential, indispensable member of
JOINT ECONOMIC COMMITTEE DEMOCRATS
 JOINT ECONOMIC COMMITTEE DEMOCRATS SENATOR JACK REED (D-RI) RANKING DEMOCRAT ECONOMIC POLICY BRIEF SEPTEMBER 2005 THE NUMBER OFAMERICANS WITHOUT HEALTH INSURANCE GREW BY 860,000 IN 2004, INCREASING FOR
EMBARGOED UNTIL 6:00 AM ET WEDNESDAY, NOVEMBER 30, 2011
 A State-by-State Look at the President s Payroll Tax Cuts for Middle-Class Families An Analysis by the U.S. Department of the Treasury s Office of Tax Policy The President signed into law a 2 percentage
List of State Residual Insurance Market Entities and State Workers Compensation Funds
 List of State Residual Insurance Market Entities and State Workers Compensation Funds On November 26, 2002, President Bush signed into law the Terrorism Risk Insurance Act of 2002 (Public Law 107-297,
Highlights and Trends: ASHA Counts for Year End 2009
 Highlights and Trends: ASHA Counts for Year End 2009 Constituents -- How many are there? How have the numbers changed? v ASHA currently represents 140,039 speech-language pathologists, audiologists, and
States Ranked by Alcohol Tax Rates: Beer (as of March 2009) Ranking State Beer Tax (per gallon)
 Ranking State Beer Tax (per gallon)") States Ranked by Alcohol Tax Rates: Beer (as of March 2009) Ranking State Beer Tax (per gallon) Sales Tax Applied 1 Wyoming $0.02 4% 2 4 8 10 Missouri $0.06 4.225% Wisconsin $0.06 5% Colorado $0.08 2.9%
States Ranked by Alcohol Tax Rates: Beer (as of March 2009) Ranking State Beer Tax (per gallon) Sales Tax Applied 1 Wyoming $0.02 4% 2 4 8 10 Missouri $0.06 4.225% Wisconsin $0.06 5% Colorado $0.08 2.9%
STATISTICAL BRIEF #435
 STATISTICAL BRIEF #435 April 2014 Premiums and Employee Contributions for Employer-Sponsored Health Insurance: Private versus Public Sector, 2012 Karen E. Davis, MA Introduction Employer-sponsored health
recovery: Projections of Jobs and Education Requirements Through 2020 June 2013
 recovery: Projections of Jobs and Requirements Through June 2013 Projections of Jobs and Requirements Through This report projects education requirements linked to forecasted job growth by state and the
2014 INCOME EARNED BY STATE INFORMATION
 BY STATE INFORMATION This information is being provided to assist in your 2014 tax preparations. The information is also mailed to applicable Columbia fund non-corporate shareholders with their year-end
Nurse Aide Training Requirements, 2011
 Nurse Aide Training Requirements, 2011 Background Federal legislation (Omnibus Budget Reconciliation Act of 1987) and associated regulations (42 CFR 483.152) require that Medicare- and Medicaid-certified
In-state Tuition & Fees at Flagship Universities by State 2014-15 Rank School State In-state Tuition & Fees Penn State University Park Pennsylvania 1
 In-state Tuition & Fees at Flagship Universities by State 2014-15 Rank School State In-state Tuition & Fees Penn State University Park Pennsylvania 1 $18,464 New New Hampshire 2 Hampshire $16,552 3 Vermont
Schedule B DS1 & DS3 Service
 Schedule B DS1 & DS3 Service SCHEDULE B Private Line Data Services DS1 & DS3 Service... 2 DS-1 Local Access Channel... 2 DS-1 Local Access Channel, New Jersey... 2 DS-1 Local Access Channel, Out-of-State...
A/B MAC Jurisdiction 1 Original Medicare Claims Processor
 A/B MAC Jurisdiction 1 Jurisdiction 1 - American Samoa, California, Guam, Hawaii, Nevada and Northern Mariana Islands Total Number of Fee-For-Service Beneficiaries: 3,141,183 (as of Total Number of Beneficiaries
Healthcare. State Report. Anthony P. Carnevale Nicole Smith Artem Gulish Bennett H. Beach. June 2012
 Healthcare State Report June 2012 Anthony P. Carnevale Nicole Smith Artem Gulish Bennett H. Beach B Table of Contents Healthcare: State Level Analysis... 3 Alabama... 12 Alaska... 14 Arizona... 16 Arkansas...
Current State Regulations
 Current State Regulations Alabama: Enacted in 1996, the state of Alabama requires all licensed massage therapists to * A minimum of 650 classroom hours at an accredited school approved by the state of
Real Progress in Food Code Adoption
 Real Progress in Food Code Adoption August 27, 2013 The Association of Food and Drug Officials (AFDO), under contract to the Food and Drug Administration, is gathering data on the progress of FDA Food
University System of Georgia Enrollment Trends and Projections to 2018
 University System of Georgia Enrollment Trends and Projections to 2018 Introduction: Projections of USG Headcount Enrollment Enrollment projections use past trends and information on other variables to
How To Vote For The American Health Insurance Program
 ACEP HEALTH INSURANCE POLL RESEARCH RESULTS Prepared For: American College of Emergency Physicians September 2015 2015 Marketing General Incorporated 625 rth Washington Street, Suite 450 Alexandria, VA
SECTION 109 HOST STATE LOAN-TO-DEPOSIT RATIOS. The Board of Governors of the Federal Reserve System (Board), the Federal Deposit
, the Federal Deposit") SECTION 109 HOST STATE LOAN-TO-DEPOSIT RATIOS The Board of Governors of the Federal Reserve System (Board), the Federal Deposit Insurance Corporation (FDIC), and the Office of the Comptroller of the Currency
SECTION 109 HOST STATE LOAN-TO-DEPOSIT RATIOS The Board of Governors of the Federal Reserve System (Board), the Federal Deposit Insurance Corporation (FDIC), and the Office of the Comptroller of the Currency
Population, by Race and Ethnicity: 2000 and 2011
 Table 1 Population, by Race and Ethnicity: 2000 and 2011 Universe: 2000 and 2011 resident population 2011 population 2000 population Percent, 2011 Percent, 2000 Hispanic 51,927,158 35,204,480 16.7 12.5
Recruitment and Retention Resources By State List
 Recruitment and Retention Resources By State List Alabama $5,000 rural physician tax credit o http://codes.lp.findlaw.com/alcode/40/18/4a/40-18-132 o http://adph.org/ruralhealth/index.asp?id=882 Area Health
Nurse Aide Training Requirements, October 2014
 Nurse Aide Training Requirements, October 2014 Background Federal legislation (Omnibus Budget Reconciliation Act of 1987) and associated regulations (42 CFR 483.152) require that Medicare- and Medicaid-certified
SECTION 109 HOST STATE LOAN-TO-DEPOSIT RATIOS. or branches outside of its home state primarily for the purpose of deposit production.
 SECTION 109 HOST STATE LOAN-TO-DEPOSIT RATIOS The Board of Governors of the Federal Reserve System, the Federal Deposit Insurance Corporation, and the Office of the Comptroller of the Currency (the agencies)
Population, by Race and Ethnicity: 2000 and 2010
 Table 1 Population, by Race and Ethnicity: 2000 and 2010 Universe: 2000 and 2010 resident population 2010 population 2000 population Percent, 2010 Percent, 2000 Hispanic 50,729,570 35,204,480 16.4 12.5
DOT HS 811 523 August 2011. Time of Day and Demographic Perspective Of Fatal Alcohol-Impaired-Driving Crashes. Time of Day
 TRAFFIC SAFETY FACTS Research Note DOT HS 811 523 August 2011 Time of Day and Demographic Perspective Of Fatal Alcohol-Impaired-Driving Crashes Alcohol-impaired driving continues to be one of the major
Changes in the Cost of Medicare Prescription Drug Plans, 2007-2008
 Issue Brief November 2007 Changes in the Cost of Medicare Prescription Drug Plans, 2007-2008 BY JOSHUA LANIER AND DEAN BAKER* The average premium for Medicare Part D prescription drug plans rose by 24.5
Question for the filing office of Texas, Re: the Texas LLC act. Professor Daniel S. Kleinberger. William Mitchell College of Law, Minnesota
 Topic: Question by: : Question for the filing office of Texas, Re: the Texas LLC act Professor Daniel S. Kleinberger William Mitchell College of Law, Minnesota Date: March 18, 2012 Manitoba Corporations
NAIC Annuity Suitability Requirements by State
 NAIC Annuity Suitability Requirements by Specific Alabama Alaska 10/16/2011 TBD Arizona Arkansas If you obtained a life insurance license prior to 10/16/11, you must complete the NAIC course by 4/16/12.
Question by: Karon Beyer. Date: March 28, 2012. [LLC Question] [2012-03-29]
![Question by: Karon Beyer. Date: March 28, 2012. [LLC Question] [2012-03-29]](/thumbs/39/18786001.jpg "Question by: Karon Beyer. Date: March 28, 2012. [LLC Question] [2012-03-29]") Topic: LLC Question Question by: Karon Beyer : Florida Date: March 28, 2012 Manitoba Corporations Canada Alabama Alaska Arizona Arkansas California Colorado Arizona uses "manager" or "member," but not
Topic: LLC Question Question by: Karon Beyer : Florida Date: March 28, 2012 Manitoba Corporations Canada Alabama Alaska Arizona Arkansas California Colorado Arizona uses "manager" or "member," but not
LPSC Renewable Energy Pilot y RFPs issued by Utility Companies by Order of Commission, November 2010
 Renewable Energy LPSC Renewable Energy Pilot y RFPs issued by Utility Companies by Order of Commission, November 2010 y Searching for various forms of renewable energy and their actual cost in Louisiana
Social Media: Understanding User Patterns and Compliance Issues. June 2011. Electronic copy available at: http://ssrn.com/abstract=1859443
 Social Media: Understanding User Patterns and Compliance Issues June 2011 Electronic copy available at: http://ssrn.com/abstract=1859443 TABLE OF CONTENTS I. Executive Summary....3 II. Key Findings of
Health Insurance Coverage of Children Under Age 19: 2008 and 2009
 Health Insurance Coverage of Children Under Age 19: 2008 and 2009 American Community Survey Briefs Issued September 2010 ACSBR/09-11 IntroductIon Health insurance, whether private or public, improves children
State Tax of Social Security Income. State Tax of Pension Income. State
 State Taxation of Retirement Income The following chart shows generally which states tax retirement income, including and pension States shaded indicate they do not tax these forms of retirement State
Estimates of Children Involved in Bullying State by State
 Estimates of Children Involved in Bullying State by State Research by Brenda High Director, Bully Police USA, Inc. (www.bullypolice.org) (Percentages taken from the 2000 Census and the Norwegian Study,
Employment and Earnings of Registered Nurses in 2010
 Employment and Earnings of Registered Nurses in 2010 Thursday, May 25, 2011 The Bureau of Labor Statistics (BLS) released 2010 occupational employment data on May 17, 2011. This document provides several
Library ebook Survey hosted by OverDrive
 Library ebook Survey hosted by OverDrive ebook survey hosted by OverDrive and American and Library American Association Library (ALA) Association (ALA) 1. State of residency: Alabama 0.8% 583 Alaska 0.5%
Supplier Business Continuity Survey - Update Page 1
 Supplier Business Continuity Survey - Update Page 1 Supplier Business Continuity Survey A response is required for every question General Information Supplier Name: JCI Supplier Number: Supplier Facility
Facing Cost-Sensitive Shoppers, Health Plan Providers Must Demonstrate Value
 w Reports: Health Insurance Marketplace Exchange Enrollment Satisfaction Improves Significantly in Second Year Facing Cost-Sensitive Shoppers, Health Plan Providers Must Demonstrate Value WESTLAKE VILLAGE,
Sources of Health Insurance Coverage in Georgia 2007-2008
 Sources of Health Insurance Coverage in Georgia 2007-2008 Tabulations of the March 2008 Annual Social and Economic Supplement to the Current Population Survey and The 2008 Georgia Population Survey William
REPORT OF FINDINGS NURSING FACILITY STAFFING SURVEY 2010
 REPORT OF FINDINGS NURSING FACILITY STAFFING SURVEY 2010 October, 2011 ABSTRACT Approximately 2 million workers were employed at nursing facilities across the United States in 2010. 1.3 million nursing
Please contact test@test.com if you have any questions regarding this survey.
 1. Which of the following best describes your position within the company? - CEO/owner - Partner/senior executive - Professional (consultant, legal, medical, architect) - Finance/accounting/purchasing
2009-10 STATE AND LOCAL GOVERNMENT TAX AND REVENUE RANKINGS. By Jacek Cianciara
 2009-10 STATE AND LOCAL GOVERNMENT TAX AND REVENUE RANKINGS By Jacek Cianciara Wisconsin Department of Revenue Division of Research and Policy December 12, 2012 TABLE OF CONTENTS Key Findings 3 Introduction
Age and Health Insurance: Pricing Out the Decades of Adult Life Looking at the difference in health insurance premiums between ages 20 and 60.
 Age and Health Insurance: Pricing Out the Decades of Adult Life Looking at the difference in health insurance premiums between ages 20 and 60. Contents 2 3 3 4 4 5 6 7 7 8 9 10 11 12 13 14 Table of Contents
FALLING THROUGH THE NET II: NEW DATA ON THE DIGITAL DIVIDE NATIONAL TELECOMMUNICATIONS AND INFORMATION ADMINISTRATION PROJECT COORDINATORS
 FALLING THROUGH THE NET II: NEW DATA ON THE DIGITAL DIVIDE NATIONAL TELECOMMUNICATIONS AND INFORMATION ADMINISTRATION PROJECT COORDINATORS James W. McConnaughey, Senior Economist Office of Policy Analysis
14-Sep-15 State and Local Tax Deduction by State, Tax Year 2013
 14-Sep-15 State and Local Tax Deduction by State, Tax Year 2013 (millions) deduction in state dollars) claimed (dollars) taxes paid [1] state AGI United States 44.2 100.0 30.2 507.7 100.0 11,483 100.0
Consent to Appointment as Registered Agent
 Consent to Appointment as Registered Agent This form is used by the person or business entity that agrees to act as the registered agent for a limited liability company. Every person or business entity
Fuel Taxes: December 2012. A State-by-State Comparison
 Fuel Taxes: A -by- Comparison December 2012 The 18th Amendment to the Washington Constitution dedicates motor fuel tax collections to highway purposes. Strategic Planning and Finance Number of s Fuel