BULL'S EYE TRADING. by Joe Duffy. A trading champion's guide to pinpointing tops and bottoms in any market
|
|
|
- Ada Boone
- 8 years ago
- Views:
Transcription
1

2 BULL'S EYE TRADING A trading champion's guide to pinpointing tops and bottoms in any market by Joe Duffy Trading futures and options does involve financial risk. Contact us for a discussion of the potential risks and rewards.

3 ABOUT THE AUTHOR Joe Duffy began his career in the investment business as a stock and commodity broker in After five years of trading, he entered the U.S. Trading and Investing Championships on three separate occasions. He finished in the Top Ten every year he entered, with annualized returns of 121%, 243% and 432%. As a direct result of his performance in the trading contests, he was contacted by a publisher to reveal his strategies and market analysis. He subsequently wrote The Trading Advantage and Turning Point Analysis. Both books have appeared on Futures magazine's list of "Best Books for Traders." From 1991 to 1996, Joe worked as a proprietary trader and technical analyst for a large multinational institution where he initiated and managed multi-million dollar positions. A the end of 1996, he made the decision to leave his prestigious position to pursue his goal of trading from home and editing a newsletter for traders. Joe appears regularly at seminars on trading and market analysis and he edits a nightly newsletter for traders called Joe Duffy's KeyPoint Advisory Service."

4 INTRODUCTION By writing this booklet, my goal is to provide you with the most information possible and explain each concept as best as I can. I hope I am able to balance these two factors for your maximum benefit. As a suggestion, however, I believe you will get more out of the information in this booklet if you read it several times. What you are about to read is only a small fraction of the methods I use in my market analysis. You will be interested to know that some of the strategies in this booklet are the same one I use to finish in the Top Ten in the U.S. Trading & Investing Championship three different times. Recently, I've been developing some exciting new strategies that I believe are so good, I'll never reveal them to anyone at any price. Even so, I want you to possess a basic understanding of some of the techniques and strategies I use in my personal trading. The contents of this booklet are not intended for general circulation. For that reason, I must ask that you please hold the information in these pages in the strictest of confidence. WHAT WE ARE GOING TO COVER What I am about to show you is just part of what I use to trade every day. There are many different styles of trading and, in my opinion, no one style is right or wrong. If you read Jack Schwager's Market Wizards books (which I recommend highly), you will learn that there are literally dozens of different ways to make money in the financial market. The unfortunate corollary for this is that there are also many ways to lose it! I'm telling you this to help you understand how I trade. My way may or may not be the way you want to trade. It may be close to your style, or it may be just close enough that you may only want to use a few of my ideas. My point is that there is no right or wrong way to trade. I am not telling you this is the best way to trade it just happens to be what works best for me. I thoroughly enjoy teaching others how to trade. However, there is another important reason why I decided to share some of my ideas: writing them down helps me improve my trading results. 1

5 Sharing my knowledge forces me to organize my concepts and thought completely so they can be passed on to people who are seeing them for the first time. By organizing my thoughts, I am able to stay more focused during my own trading. This raises an important point about writing things down. Each day you should physically write down your potential support and resistance points. I also like to write down other reasons why I want to take a trade. Once I write it down, however, I almost never back out by second guessing my decision during the trading day. Writing things down helps me summarize what is important, and what I must do is follow my plan. This is absolutely vital to your trading success. To conclude my introduction, I'd once again like to reiterate that what I am teaching you here are techniques, not systems. One of the best analogies I have heard compares successful trading to gourmet cooking. There is always a recipe, but the dish is always different depending on what ingredients are available. With that in mind, my method of trading features definable, empirical things that I look for. However, it also allows for some personal input in deciding exactly what combination of ingredients I will use. This concept should become more clear as we progress. And as you will soon see, there will be some trades that will seem obvious to you those being the high confidence, high-probability "no-brainer trades!" Now let's move on to the nuts and bolts of some of my trading techniques. IDENTIFYING HIGH PROBABILITY SUPPORT AND RESISTANCE ZONES The main focus of this booklet is to show you how I identify high probability support and resistance zones. High probability support zones are low risk places to buy. High probability resistance zones are low risk places to sell short. It really is as simple as it sounds. The philosophy I use to identify high probability points is also simple: I look to integrate techniques and integrate time frames. The techniques in this booklet are the simplest and most direct. 2

6 When I combine them on different time frames, I look for a confluence of evidence at the same approximate price level. This confluence of evidence is an important concept that should become very clear as we progress. PIVOT POINTS The first technique I will show you is the "Floor Trader Pivot Points." These points have been around for years and every floor trader knows precisely where they are. You should too. The formulas are as follows: Pivot Point = (High + Low + Close)/3 1 st High Pivot = Pivot Point + (Pivot Point - Low) 1 st Low Pivot = Pivot Point - (High - Pivot Point) 2 nd High Pivot = Pivot Point + 2(Pivot Point - Low) 2 nd Low Pivot = Pivot Point - 2(High - Pivot Point) 3 rd High Pivot = Pivot Point + 2(Pivot Point - Low) 3 rd Low Pivot = Low - 2(High - Pivot Point) Most any technical analysis software package can be set up to calculate these numbers for you. (If you are trading only one or two markets, however, an old fashioned hand calculator works just as well). I calculate each of these points using daily, weekly, and monthly data. Obviously, when using monthly data, the calculations only need to be done at the start of a new month. When using weekly data, the calculations are done at the beginning of each week. The daily calculations are done each day. Again, it is important to integrate time frames. If we have 2 or more pivots from different times that are the same or very close to each other, this is a good setup from which to start. If you have 3 pivots, that is all you need. 3
/3 1 st High Pivot = Pivot Point + (Pivot Point - Low) 1 st Low Pivot = Pivot Point - (High - Pivot Point) 2 nd High Pivot = Pivot Point")
7 PIVOT POINT CHANNEL What you are about to learn is something that is being introduced for the very first time. It is completely new material and I truly believe it is the very best channel or trading band method there is. I say this (is) because it combines the best features of the different types of channel indicators that are currently most popular with traders. The band is smooth like a straight moving average trading band, but it also has the ability to adjust for market volatility like a Bollinger band. Notice in the accompanying charts how the width of the trading band increases gradually as the market becomes more volatile. This smooth and controlled self adjustment is key. Some of those reading this may be familiar with the pivot point techniques discussed in the last section. Now I will take this technique one more step and use it in a broader context to create the Pivot Point Channels. To create the Pivot Point Channels, I use a 7-day exponential moving average of the Pivot Points as a base. An exponential Moving Average is a little more sensitive to recent data than a straight simple moving average, however the basic principle is the same. Next, calculate the average difference between the first Pivot Low 4

8 and the first Pivot High for each of the last 7 days. To do this, you subtract the first Pivot Low value from the first Pivot High value for each of the last 7 days. You then add up the difference and divide by 7. This gives you the average value of the difference between the first high and the first low pivots. The final step involves adding this average of the differences to the moving average of the pivots to get the resistance line. As well, you subtract the average of the differences from the moving average of the pivots to get the support line. This creates a channel for the first support and resistance. You can use the same technique to calculate a 20-day exponential moving average of the Pivot Points. This time, instead of averaging the first Low Pivot and the first High Pivot, employ the average difference between the second Low Pivot and the second High Pivot. This will give you a second wide trading channel for support and resistance. (see chart) The Pivot Channel boundaries can be used as support and resistance just as the Pivot Points themselves are used. The Pivot Channels also lend themselves to other strategies, including identifying markets that are likely to be in a trending mode for a while. We do not have enough space to cover this subject fully, but some of it should be more clear by looking at the charts. As Yogi Berra once said, "You can see a lot just by looking!" Finally, remember that almost any of today's popular software programs have a formula builder that will calculate and display this information on your chart. 5

9 MARKET SYMMETRY Basically, this concept involves using simple trendlines to determine potential support and resistance. I do this two different ways. First, I use just the last two bars to draw trendlines. I join the last two highs and the last two lows, as well as the low to high and high to low. These lines are extended to give me our potential support and resistance points for the next day, week, or month, depending on the chart on which I was working. To emphasize again, I integrate time frames by using this technique on the daily, weekly and monthly charts. The second way I look for straight line symmetry in the market is by looking for old fashioned trendlines. I do this particularly on the 1/2 day chart. The 1/2 day chart seems to highlight the potentially significant support and resistance very well. As with any trendline technique, a trendline with more points is a potentially stronger support or resistance level. And remember that old support lines, once broken, become resistance and vice versa. As always, I make a written list of the potential support and resistance point using the monthly, weekly, daily and 1/2 day charts. Again, it is extremely important to integrate time frames to see if there are any levels that are the same. If there are two or more levels clustered together, this level is potentially a more powerful support or resistance level. One final important thing about trendline(s) is that I never look for them to break. They are always either potential support or potential resistance and, therefore, I expect they will hold. This way of looking at things takes away the anxiety and questions traders often feel as the market approaches a trendline (and relieving this question is no small benefit, believe me). Before I act on any trendline, however, I need to see a convergence of evidence from other techniques and time frames. Trendlines represent a straight line symmetry or geometry in the markets. Markets do follow repetitive patterns and markets often display symmetry. The concept of trendlines is so basic that it often is forgotten or overlooked by the majority of traders. (Who do you know who actually trades off of trendlines?). This is simple, but very effective. The next few pages provide more examples of the type of situations I look for in the market. 6

10 7
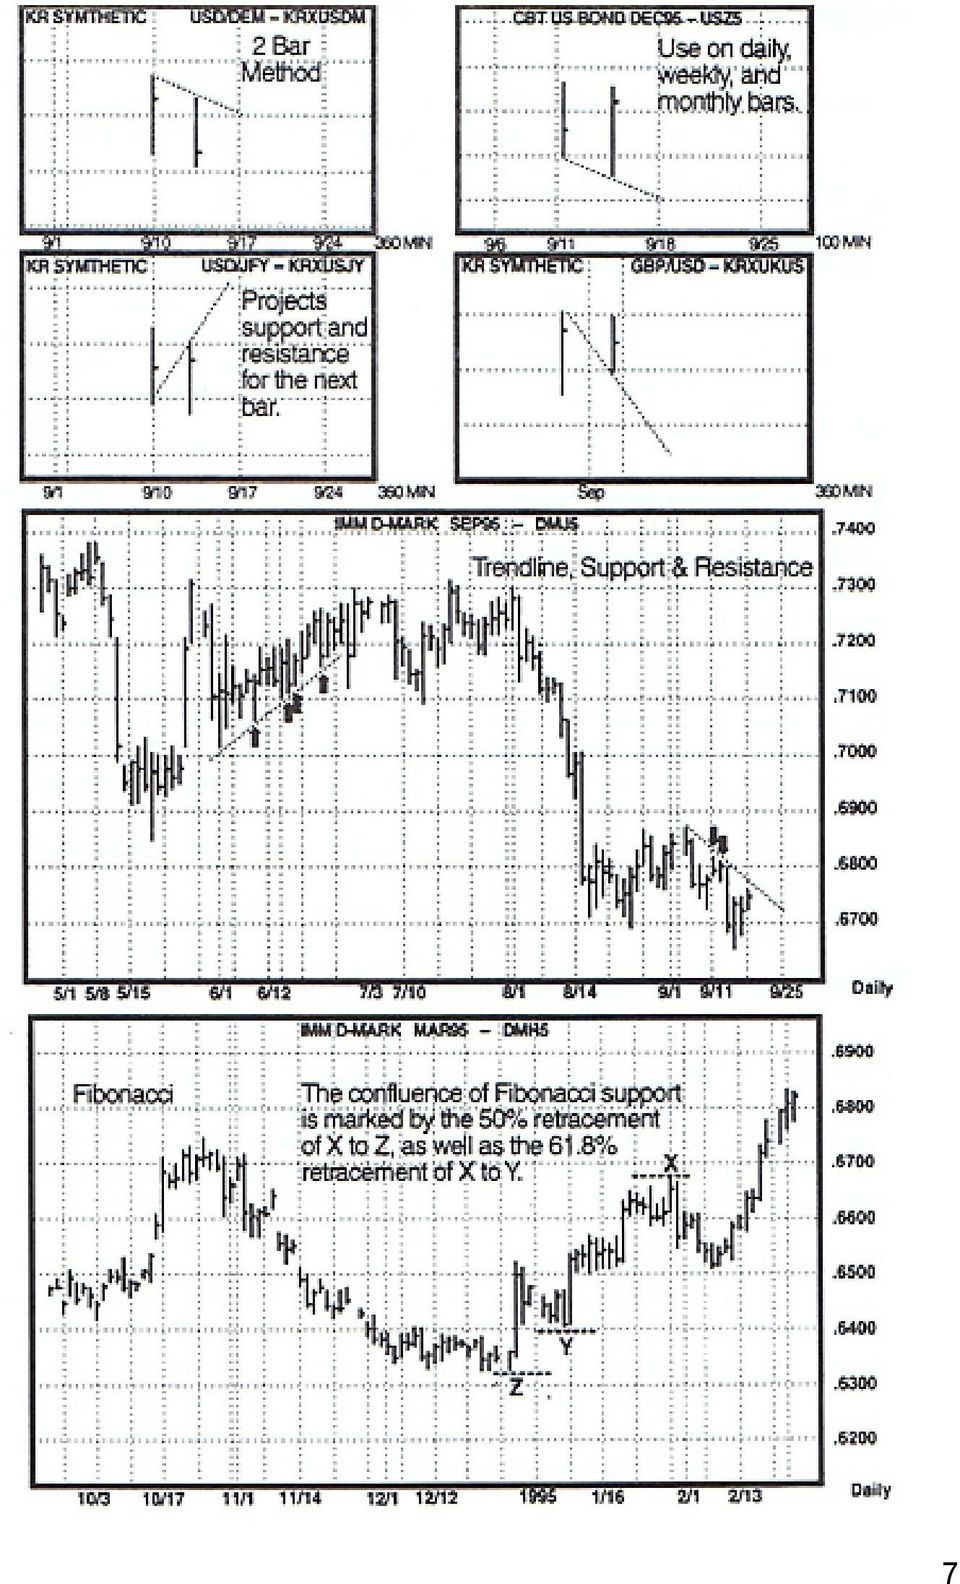
11 FIBONACCI Leonardo Fibonacci was a 13 th century mathematician who discovered what is known as the Fibonacci ratio. The Fibonacci ratio is the division of any space into a 61.8% and 38.2% division. I also look for a 50% and 50% division of space. It really is as simple as that. The Fibonacci ratio and related concepts are found repeatedly in nature. In financial markets we simply borrow the concept. To use the Fibonacci ratios in trading, I simply look for a market to retrace 38.2%, 50% or 21.8% of a previous move. The chart example illustrates this straightforward concept. In using retracements, I again go back to the basic concept of confluence and integration to make this method useful. I like this method best when I can find a confluence of two different retracements coming in at the same level. The chart example I've included illustrates this point well. Again, I look to integrate Fibonacci retracement levels with potential support or resistance levels using other techniques. If I can get additional evidence to indicate support or resistance at the Fibonacci retracement levels, then I have a high probability trade in the works. Once in a while you will get three Fibonacci retracement(s) coming in all at the same level. When that happens, you do not need much else. REAL-TIME TRADING EXAMPLES Examples of some actual trade set-ups follow. The first example is the trade set-up from page 3 that says, "How to Buy Here!" You'll notice that virtually everything I have taught you in this booklet so far is setting up at that low. I hope you agree that anyone who knows this material would almost have certainly bought here! The great set-ups like these do not occur very often. It is worth noting, however, that the amount of evidence supporting a potential high or low is directly related to the confidence level of success. In other words, set-ups like these have an extraordinary high ratio of probability. Therefore, you should try to avoid the marginal trades and concentrate on the good setups with the largest confluence of technical evidence. This is especially true when you are starting out. 8

12 Here is an example of a real trade in the D-Mark. The following techniques indicated support at these levels: Monthly Low Pivot = 6607 Daily Low Pivot = 6498 Short-Term Pivot Channel = % Retracement = 6505 Natural Squared = N/A Weekly Low Pivot = 6505 Long-Term Pivot Channel = Day Low to Low = % Retracement = 6499 Cardinal/Corner = /2 From this we see a real confluence of support around Look to buy just above that support or 6510 or so. The low was 6507 and away we go! The logical stop loss on this trade is the furthest support number in the area which is the Cardinal/Corner at

13 Here is an actual example of a trade. It is not the ideal set-up of the previous one, however it is more like what you are going to get most of the time. Daily High Pivot = /32 Weekly Pivot Point = /32 Gann Cardinal Corner = /32 Trendline Horizontal Resistance = /32 50% Retracement = /32 I am selling around /32. I am using a stop above the next resistance level at /32. The latter is both the 3 rd high pivot and the 61.8% Fibonacci retracement. The high for the day was /32. Subsequently, the bonds dropped to /32 that day and opened the next day at /32 and traded /32 within a half hour. 10

14 Here is another trade from the same week. Once again, it turned out to be a successful one. Daily Low Pivot = 6980 Weekly Pivot Point = 6972 Daily Low to Low = (%) Retracement = 6973 Gann Cardinal Corner = 6973 This is a marginal situation as there are enough potential areas, but they are spread apart more than we would like. However, we have to make a little allowance for this as the D-Mark has been so volatile. My strategy here was to buy near the top of the range of support at the daily low pivot of The stop would be below the bottom of the range of support at 6962, so use a stop of 6950 or so. 11

15 DAY-TRADING SECRETS Finding support and resistance for a day-trader can keep him alive in a volatile market. Here's one idea, implemented with others, to find those target areas. My personal preference for day-trading and short-term trading is to buy dips and sell rallies. Two components are needed to make this strategy work. First, you have to be trading in the direction that gives you the best chance of success. Second, you have to be able to identify potential support or resistance for that trading day. I'll discuss one technique from each of these components that make up my day-trading approach. The first step is to determine which way the market is likely to go today in other words, is the trend up, down or sideways? One method to determine the market trend involves a couple of old standby technical indicators that are available on virtually any charting software: the Moving Average Convergence Divergence (MACD) and the stochastic indicators. These oldies but goodies really can be useful if used in the proper combination. Look at both the MACD and the Slow Stochastic on a daily chart to determine in which direction you want to trade the next day. For the MACD, I use a little longer time value for my inputs than the standard say, around a exponential moving average combination. I also use a slow stochastic indicator with an input value of somewhere around 20 days. Both of these indicators should be displayed together under the price data. Look for situations when both the MACD indicator and the stochastic indicator are on the same side of the signal line. If both are above their respective signal lines, then trade the buy side. If both are below their respective signal lines, trade the sell side. Quite often you'll find the MACD and the stochastic indicators are on the opposite sides of their respective signal lines. In these cases, avoid the market. The accompanying charts show this simple combination eliminates a lot of noise from the market and identifies those times when the market has the best chance to make a trend move. Throw these indicators up on any chart together, and you will see this combination works infinitely better than either indicator alone. 12

16 The alignment of the MACD and stochastic indicators together shows you the market trend. When both indicators are below the strength line, as they were in early December for both the S&P 500 Index and T-Bonds, you should be a seller; if both are above the signal line, as they were in early February, you should be a buyer. Once you've determined the direction to trade, the next step is to find support if you want to buy or resistance if you want to sell. There are several ways to do this, and my usual strategy is to employ several methodologies to come up with a confluence or a "keypoint" highprobability trading zone. Here is one methodology that is being described for the first time. Unfortunately, there is no neat name for this indicator, so I'll just call it the 3x5ATR. To construct it: 13

17 By combining the five-day average true range with simple three-day moving averages of the highs and lows, you can create the 3x5ATR indicator to find support and resistance areas that can be used in a day-trading strategy of buying on dips and selling on rallies. The S&P charts above and the above, left T-Bonds chart show examples of support lines using the 3x5ATR. 1. Add up the true ranges for the last five days and divide by five. This is the 5ATR. 2. Calculate a three-day simple moving average of the highs and a threeday simple moving average of the lows. 3. To calculate the 3x5ATR for potential resistance, add the 5ATR to the three-day averages of the highs. 4. To calculate the 3x5ATR for support, subtract the 5ATR from the threeday averages of the highs. An important point is that this is not a total day-trading strategy. Look to combine other techniques that identify potential support and resistance points. A good rule to live by is to look for a confluence of support or res istance by integrating analysis techniques and integrating time frames. 14

18 2001 Joe Duffy All rights reserved TradeWins Publishing P.O. Box 1010 Wilkes-Barre, PA

Chapter 2.3. Technical Analysis: Technical Indicators
 Chapter 2.3 Technical Analysis: Technical Indicators 0 TECHNICAL ANALYSIS: TECHNICAL INDICATORS Charts always have a story to tell. However, from time to time those charts may be speaking a language you
CHART TRADING GUIDE 1
 CHART TRADING GUIDE 1 How to understand chart trading This guide is designed to teach you the basics of chart trading- the chart patterns that are covered in this booklet can be used for short and medium
Chapter 2.3. Technical Indicators
 1 Chapter 2.3 Technical Indicators 0 TECHNICAL ANALYSIS: TECHNICAL INDICATORS Charts always have a story to tell. However, sometimes those charts may be speaking a language you do not understand and you
How I Trade Profitably Every Single Month without Fail
 How I Trade Profitably Every Single Month without Fail First of all, let me take some time to introduce myself to you. I am Kelvin and I am a full time currency trader. I have a passion for trading and
The Secret Science of the Stock Market By Michael S. Jenkins
 The Secret Science of the Stock Market By Michael S. Jenkins Michael S. Jenkins new and greatest book The Secret Science of the Stock Market is finally done. In this book Mr. Jenkins gives a start to finish
BROKER SERVICES AND PLATFORM
 BROKER SERVICES AND PLATFORM A broker is an individual who executes buy and sell orders and get commission in the form of SPREAD (I will talk about SPREAD in the subsequent lessons). You trade through
Table of Contents. Preface. Chapter 1: TRADING BASICS. Chapter 2: BASIC TOOLS. Chapter 3: ADX. Chapter 4: ACCUMULATION LINE
 Table of Contents Preface Chapter 1: TRADING BASICS Chapter 2: BASIC TOOLS Chapter 3: ADX Chapter 4: ACCUMULATION LINE Chapter 5: AVERAGE TRUE RANGE Chapter 6: CANDLESTICKS Chapter 7: MACD Chapter 8: MOVING
TOMORROW'S TRADING TECHNOLOGY. 100% automated Fibonacci support and resistance levels that you can count on every single trading day in an instant.
 TOMORROW'S TRADING TECHNOLOGY 100% automated Fibonacci support and resistance levels that you can count on every single trading day in an instant. ProTrader Table of Contents 1. Areas A. Fibonacci Confluence
THE CYCLE TRADING PATTERN MANUAL
 TIMING IS EVERYTHING And the use of time cycles can greatly improve the accuracy and success of your trading and/or system. THE CYCLE TRADING PATTERN MANUAL By Walter Bressert There is no magic oscillator
FOREX analysing made easy
 FOREX analysing made easy UNDERSTANDING TECHNICAL ANALYSIS An educational tool by Blackwell Global Contents Technical Analysis 2 Line Chart 3 Bar Chart 4 Candlestick Chart 5 Support and Resistance 6 Fibonacci
The Ultimate Fibonacci Guide By Fawad Razaqzada, technical analyst at FOREX.com
 The Ultimate Fibonacci Guide By Fawad Razaqzada, technical analyst at FOREX.com Who is Fibonacci? Leonardo Bonacci also known as Leonardo Fibonacci was an Italian mathematician in the 12 th century. He
A Day Trader Search for Profits Written By: John L. Person, CTA www.nationalfutures.com
 Buy low sell high, buy high and sell higher or sell low and buy lower. Whatever your method is, the results need to be profitable or a trader s career will be cut short. Most investors, whether that is
Microeconomics Topic 2: Explain the principle of comparative advantage and how it leads to specialization and gains from trade.
 Microeconomics Topic 2: Explain the principle of comparative advantage and how it leads to specialization and gains from trade. Reference: Gregory Mankiw s Principles of Microeconomics, 2 nd edition, Chapter
Award Winning Education
 Award Winning Education Market Timing in XLT Low risk, high reward, and high probability Trading Sam Seiden Vice President of Education Online Trading Academy www.tradingacademy.com Who REALLY Makes Money?
Technical Indicators Tutorial - Forex Trading, Currency Forecast, FX Trading Signal, Forex Training Cour...
 Page 1 Technical Indicators Tutorial Technical Analysis Articles Written by TradingEducation.com Technical Indicators Tutorial Price is the primary tool of technical analysis because it reflects every
Trading Binary Options Strategies and Tactics
 Trading Binary Options Strategies and Tactics Binary options trading is not a gamble or a guessing game. By using both fundamental and technical market analysis, you are able to get a better understanding
Retracement Or Reversal. Kennsei Trading, Inc. Chief Trader Dinger dinger@kennseitrading.com www.hotstocksforincome.com
 Retracement Or Reversal Kennsei Trading, Inc. Chief Trader Dinger dinger@kennseitrading.com www.hotstocksforincome.com Retracement Or Reversal Most of us have wondered, at some point, whether a decline
The 5 Exit Heroes. Exiting Your Forex Trades For Maximum Profits
 The 5 Exit Heroes Exiting Your Forex Trades For Maximum Profits IMPORTANT : As an added bonus for downloading this report, you also received additional free training videos. To access your bonuses, go
The Professional S&P 500 E-Mini Trading Course
 The Vector Traders Consortium and The Inside Technician are proud to present this Pre-recorded Live Event entitled: The Professional S&P 500 E-Mini Trading Course This professional S&P 500 E-Mini Trading
Professional Trader Series: Moving Average Formula & Strategy Guide. by John Person
 Professional Trader Series: Moving Average Formula & Strategy Guide by John Person MOVING AVERAGE FORMULAS & STRATEGY GUIDE In an online seminar conducted for the Chicago Board of Trade, I shared how to
Trading Lessons from the Intraday Frame (study)
") 1 Daily "Idealized Trades" Report Trading Lessons from the Intraday Frame (study) 1 2 SPY's 1-min Power Trend Chart (Additional Trades) 2 3 Lessons to Learn from Today's Trading Day Let's start as usual
1 Daily "Idealized Trades" Report Trading Lessons from the Intraday Frame (study) 1 2 SPY's 1-min Power Trend Chart (Additional Trades) 2 3 Lessons to Learn from Today's Trading Day Let's start as usual
FOREIGN EXCHANGE CYCLES:
 January 1999 FOREIGN EXCHANGE CYCLES: Get Ready to Sell the Upcoming Cycle Top in the Dollar versus the Deutschemark Trade Sell the Dollar-Mark on a break below last week's low of 1.6625 and look for 5
Using Bollinger Bands. by John Bollinger
 Article Text Copyright (c) Technical Analysis Inc. 1 Stocks & Commodities V. 10:2 (47-51): Using Bollinger Bands by John Bollinger Using Bollinger Bands by John Bollinger Trading bands, which are lines
Prediction The Evidence it Doesn't Work and a Popular Theory that Leads to Losses
 Forex Trading Strategy Mistakes 3 X Common Trading Errors Which Cause Losses We all know that 95% of all Forex traders lose money and most of these traders have no hope of winning because they base their
JOURNAL THE BASIC GANN SWING PLAN FOR STOCKS QUESTIONS ROBERT KRAUSZ'S. Volume 1, Issue 4
 ROBERT KRAUSZ'S JOURNAL Volume 1, Issue 4 THE BASIC GANN SWING PLAN FOR STOCKS T his issue of the Fibonacci Trader Journal will focus on trading stocks. Some traders, those who focus on just stocks, have
A Beginner s Guide to Financial Freedom through the Stock-market. Includes The 6 Steps to Successful Investing
 A Beginner s Guide to Financial Freedom through the Stock-market Includes The 6 Steps to Successful Investing By Marcus de Maria The experts at teaching beginners how to make money in stocks Web-site:
Trading Pivot Points Forex-Breakout-System
 Trading Pivot Points Forex-Breakout-System Pivot points are rarely understood, and they are rarely used by the Forex trader. The first chapter explores the question, What are Pivot Points? and the reasoning
Click on the below banner to learn about my revolutionary method to trade the forex market:
 By Avi Frister http://www.forex-trading-machine.com Click on the below banner to learn about my revolutionary method to trade the forex market: Copyright 2008 The Forex Navigator System. All rights reserved
The 12 Cardinal Mistakes Of Commodity Trading...AND HOW TO OVERCOME THEM By Walter Bressert
 The 12 Cardinal Mistakes Of Commodity Trading...AND HOW TO OVERCOME THEM By Walter Bressert 1. Lack of a Game Plan. 2. Lack of Money Management 3. Failure to Use Protective Stop Loss Orders 4. Taking Small
As a professional floor trader at the Chicago Board of Figure 1 Trade, I have studied many trading
 Article Text Copyright (c) Technical Analysis Inc. 1 Stocks & Commodities V. 4:5 (194-197): A mechanical trading system by William F. Eng A mechanical trading system by William F. Eng As a professional
Chapter 1 Introduction Disclaimer: Forex Involves risk. So if you lose money you can't blame us we told you trading involves risk.
 By Casey Stubbs -Winners Edge Trading.com Table of Contents Chapter 1. Introduction Chapter 2.. Trading Plan Chapter 3.. Money Management Chapter 4. Moving Average Strategy Chapter 5. Stochastic Strategy
High Probability Trading Triggers for Gold & Silver
 Welcome to a CBOT Online Seminar High Probability Trading Triggers for Gold & Silver Presented by: John Person Sponsored by Interactive Brokers Live Presentation Starts at 3:30 PM Chicago Time NOTE: Futures
Trading. focus. Helping you achieve your trading goals. Trading Tips
 TEHNICAL ANALYSIS... 2 Fall 2014 What Chart?... 3 Paper Trading... 4 Trading H E L P I N G F O R E X T R A D E R S A C H I E V E T H E I R G O A L S focus We exist to provide the finest charting system
Trend Determination - a Quick, Accurate, & Effective Methodology
 Trend Determination - a Quick, Accurate, & Effective Methodology By; John Hayden Over the years, friends who are traders have often asked me how I can quickly determine a trend when looking at a chart.
Chapter 28 LIQUIDATION
 Chapter 28 LIQUIDATION Knowing when to liquidate a trade is at least as important as knowing when to enter a trade. Since most traders are on the right side of a trade going in, then the problem would
So, if you are going to scalp the Forex market, you need to be very strategic with your or you will get eaten for breakfast
 IMPORTANT: This is an added bonus for being our client. If you need more trading strategies that included: Beginners-Intermediate Trading Strategies Intermediate-Advance Trading Strategies Elliott Wave
These Two Words Just Made Us 37% In 3 Months. "These Two Words. Just Made Us 37% In 3 Months"
 These Two Words Just Made Us 37% In 3 Months "These Two Words Just Made Us 37% In 3 Months" Using these "two words" in your 401k, IRA or any other investment account can make you very wealthy... What are
Leon Wilson Trading Success
 Leon Wilson Trading Success A talk given by Mary de la Lande to the BullCharts User Group Meeting on 13 February 2008 1. Who is Leon Wilson? His Books and where to get them. 2. Book 1: The Business of
The Magic Momentum Method of Trading the Forex Market
 The Magic Momentum Method of Trading the Forex Market WELCOME! Welcome to one of the easiest methods of trading the Forex market which you can use to trade most currencies, most time frames and which can
Thinking Man s Trader
 Thinking Man s Trader Advanced Trader s Package Trading is a three dimensional world and the Advanced Trader s Package covers all three. Dimension three: Market Dynamics, conditions and change of conditions
New York Traders Expo 2012
 New York Traders Expo 2012 with JAMES CHEN, CTA, CMT Director of Technical Research and Education All rights reserved, FXDD Inc. 2010 Today s Topic: High Probability Strategies for Trading Forex www.fxdd.com
FOREX FOR BEGINNERS. www.mundomarkets.com
 FOREX FOR BEGINNERS CONTENT 01. 02. 03. 04. What is forex market and how it works? Forex market (page 2) Liquidity providers (page 3) Why acquiring knowledge is important in the forex market? Experience
Newsletter Structure and Content
 YOUR QUESTIONS ANSWERED ABOUT SWING TRADING By Alan Farley Editor's Note: Many of you have asked about the best way to use The Daily Swing Trade, Alan's swing trading newsletter. To address these questions,
Stock Breakout Profits Strategy
 Stock Breakout Profits Strategy Introduction Welcome and thank you for downloading the Stock Breakout Profits system. The Stock Breakout Profits is a complete trading strategy for trading not only the
Mastering the Markets
 www.mastermindtraders.com Presents Mastering the Markets Your Path to Financial Freedom DISCLAIMER Neither MasterMind Traders or any of its personnel are registered broker-dealers or investment advisors.
Swing Trading Using Candlestick charting with Pivot Point Analysis. Written by John L. Person
 Swing Trading, pg. 1 Swing Trading Using Candlestick charting with Pivot Point Analysis Written by John L. Person Introduction: This booklet was written with the intention of enlightening your knowledge
WINNING STOCK & OPTION STRATEGIES
 WINNING STOCK & OPTION STRATEGIES DISCLAIMER Although the author of this book is a professional trader, he is not a registered financial adviser or financial planner. The information presented in this
Trader s Guide. Updated March 2014
 Trader s Guide Updated March 2014 Welcome to this basic introduction to the Trigger Trade Report, FTMDaily s unique stock trading system. This simple guide will explain how to get started using our trading
Advanced Trading Systems Collection MACD DIVERGENCE TRADING SYSTEM
 MACD DIVERGENCE TRADING SYSTEM 1 This system will cover the MACD divergence. With this trading system you can trade any currency pair (I suggest EUR/USD and GBD/USD when you start), and you will always
Trading the Daniel Code Numbers
 Trading the Daniel Code Numbers INTRODUCTION... 2 ABOUT THE DC NUMBERS... 2 BEFORE YOU START... 2 GETTING STARTED... 2 Set-Up Bars... 3 DC Number Sequences... 4 Reversal Signals... 4 DC TRADING METHODOLOGY...
The Ten Commandments of Forex Target Trading
 The Ten Commandments of Forex Target Trading www.forextargettrading.com The 1st Commandment: Thou Shalt Always Protect Thy Capital Without capital, you have nothing with which to trade. Trading any currency,
Day Trading the Dow Jones, DJI
 Day Trading the Dow Jones, DJI Enter a trade on a confirmation of a break of the 100EMA, which is when the price pulls back towards the 100MA and then continues in the direction of the breakout. Stay in
The Logic Of Pivot Trading
 Stocks & Commodities V. 6: (46-50): The Logic Of Pivot Trading by Jim White This methodology takes advantage of the short-term trends in the market and applies a pivot trading technique to earn superior
The Shark Attack System
 The Shark Attack System by Ashwani Gujral Reviewed and recommended by Rita Lasker & Green Forex Group Disclaimer Please be aware of the loss, risk, personal or otherwise consequences of the use and application
TRADING EDUCATORS WELCOMES YOU TO OUR TRADERS UNIVERSITY
 TRADING EDUCATORS WELCOMES YOU TO OUR TRADERS UNIVERSITY The prerequisite for this material is having studied The Law of Charts. Study it thoroughly. You must know about 1-2-31 3 formations, Ledges, Consolidations,
BONUS REPORT#5. The Sell-Write Strategy
 BONUS REPORT#5 The Sell-Write Strategy 1 The Sell-Write or Covered Put Strategy Many investors and traders would assume that the covered put or sellwrite strategy is the opposite strategy of the covered
A SPECIAL TRADING REPORT
 LEE GETTESS ON DAY TRADING A SPECIAL TRADING REPORT LEE GETTES ON DAY TRADING A SPECIAL TRADING REPORT THE INFORMATION AND OPINIONS CONTAINED IN THIS REPORT ARE FOR INFORMATIONAL PURPOSES ONLY. THERE IS
How To Use Multiple Time Frames For Setups. by Chris Vermeulen
 by Chris Vermeulen A couple months ago I started providing more of my intraday charts in hopes to educate traders on current market conditions so they feel like they are "in the zone" for trading. It's
NEDBANK PRIVATE WEALTH STOCKBROKERS Graphical Analysis Manual
 This advanced charting application displays interactive, feature-rich, automatically-updated financial charts; The application also provides you with the ability to perform advanced technical analysis
Yes, and this is the approach most successful professional traders take.
 Page 1 Introduction to MTPredictor By: Steve Griffiths, MTPredictor developer April 2012 Welcome to this introduction to MTPredictor, where I would like to take a look at the automatic routines and advanced
Intraday Report for Wednesday, July 08, 2015 S&P 500 ETF: SPY. Corey Rosenbloom, CMT Afraid to Trade
 1 Daily "Idealized Trades" Report S&P 500 ETF: SPY 1 2 SPY 1-min 2 3 Real-World Lessons from Today s Trading Day Hey traders! First, please pardon the look and urgency of getting this report out I m away
How to Win the Stock Market Game
 How to Win the Stock Market Game 1 Developing Short-Term Stock Trading Strategies by Vladimir Daragan PART 1 Table of Contents 1. Introduction 2. Comparison of trading strategies 3. Return per trade 4.
How to see the market context using CCI Written by Buzz
 How to see the market context using CCI Written by Buzz Towards the end of September 2003, I decided to stop trading the S&P e-mini for a while and focus on the Russell 2000 e-mini. The swings seemed to
So, let's dive right into what you need to do to start.
 Welcome to the WADS System. This document contains the recommended steps to take in order to learn to trade. I created it with one thought in mind... making this as fun and easy to learn as possible. For
4 Hour MACD Forex Strategy
 4 Hour MACD Forex Strategy Welcome to the 4 Hour MACD Forex Strategy. This strategy is aimed at simplicity as well as high probability trades. I have been in the equity market for almost ten years now
INDEPENDENT. OBJECTIVE. RELIABLE. Options Basics & Essentials: The Beginners Guide to Trading Gold & Silver Options
 INDEPENDENT. OBJECTIVE. RELIABLE. 1 About the ebook Creator Drew Rathgeber is a senior broker at Daniels Trading. He has been heavily involved in numerous facets of the silver & gold community for over
Trading CFDs with Trader Dealer ABN 17 090 611 680 (AFSL NO 333297)
") Trading CFDs with Trader Dealer ABN 17 090 611 680 (AFSL NO 333297) Pages 1. Overview 3 2. What is a CFD? 3 3. Why Trade CFDs? 3 4. How Do CFDs Work? 4 4.1 Margin 4 4.2 Commission 5 4.3 Financing 6 4.4
Trading CFDs with Trader Dealer ABN 17 090 611 680 (AFSL NO 333297) Pages 1. Overview 3 2. What is a CFD? 3 3. Why Trade CFDs? 3 4. How Do CFDs Work? 4 4.1 Margin 4 4.2 Commission 5 4.3 Financing 6 4.4
Option Profit Basic Video & Ecourse
 Option Profit Basic Video & Ecourse The following is a brief outline of the training program I have created for you What Will You Learn? You will be taught how to profit when stocks go up and how to "really"
The Secret to Day Trading How to Use Multiple Time Frames for Pinpoint Entry and Exit Points
 The Secret to Day Trading How to Use Multiple Time Frames for Pinpoint Entry and Exit Points Now I m not going to advocate day trading. That isn t what this report is about. But there are some principles
Introduction... 4 A look at Binary Options... 5. Who Trades Binary Options?... 5. Binary Option Brokers... 5 Individual Investors...
 Table of Contents Introduction... 4 A look at Binary Options... 5 Who Trades Binary Options?... 5 Binary Option Brokers... 5 Individual Investors... 5 Benefits of Trading Binary Options... 6 Binary Option
I Really Trade. Trading Patterns for Stocks & Commodities. Introducing The False Break Buy and Sell Pattern
 2008 Trading Patterns for Stocks & Commodities It doesn t matter if you are a longterm investor, short swing trader or day trader, you are always looking for an advantageous spot to enter your position.
Forex Volatility Patterns
 Spotting Early Breakouts Forex Volatility Patterns BRUCE WALDMAN Want to catch 40 to 00 pips in each trade? Here s how you can find those entry and exit signals to make your forex trading a success. C
This tutorial was originally titled "Secrets to Successful Short-Term Trading" and was recorded at the Online Trading Expo
 This tutorial was originally titled "Secrets to Successful Short-Term Trading" and was recorded at the Online Trading Expo Day Trading Wizard Using High Probability Support and Resistance Levels with Tony
Santa Rally. Myth or Fact? ZaK MiR. why do you SpREadbEt? LESSonS FRoM HiStoRy. RESEaRCH in Motion update INTERVIEWS MR FTSE MARK AUSTIN
 S a xm n io it Ed the e-magazine created especially for active spreadbetters and CFd traders issue 11 - december 2012 Santa Rally Myth or Fact? ZaK MiR INTERVIEWS MR FTSE MARK AUSTIN why do you SpREadbEt?
Chapter 2. My Early Days Trading Forex
 Chapter 2 My Early Days Trading Forex I want to talk about my early days as a Forex trader because I m hoping that my story will be something you can relate to. So it doesn t really matter if you are brand
Reading Gaps in Charts to Find Good Trades
 Reading Gaps in Charts to Find Good Trades One of the most rewarding and challenging things I have done in my 40-year trading career is teach elementary school students the basics of technical analysis
Guidelines to use with Fibonacciqueen trade setups!!!
 Guidelines to use with Fibonacciqueen trade setups!!! Updated January 2014 As far as the price analysis that I run every day in the markets, there are three different types of Fibonacci price relationships
The Jim Berg Entry and Exit System. 1.
 The Jim Berg Entry and Exit System. 1. Note. The description below is given for educational purposes only in order to show how this may be used with AmiBroker charting software. As described here it is
Day Trade System EZ Trade FOREX
 Day Trade System The EZ Trade FOREX Day Trading System is mainly used with four different currency pairs; the EUR/USD, USD/CHF, GBP/USD and AUD/USD, but some trades are also taken on the USD/JPY. It uses
The Best Option: Trading Equities at High Speed
 The Best Option: Trading Equities at High Speed Chuck Hughes, a former U.S. Air Force and Commercial Airline Pilot, used his downtime to learn how to trade stock indexes with systems. He liked system trading
HOW I TRIPLED MY ACCOUNT IN 4 MONTHS WITH FXJAKE.COM
 HOW I TRIPLED MY ACCOUNT IN 4 MONTHS WITH FXJAKE.COM By Nicola McLaughlin IMPORTANT While we make every effort to ensure that we accurately represent all the products and services reviewed on this website
INTRODUCTION TO COTTON FUTURES Blake K. Bennett Extension Economist/Management Texas Cooperative Extension, The Texas A&M University System
 INTRODUCTION TO COTTON FUTURES Blake K. Bennett Extension Economist/Management Texas Cooperative Extension, The Texas A&M University System Introduction For well over a century, industry representatives
NEXGEN DEMO TRADING & EDUCATIONAL PLAN SIMPLIFIED
 NEXGEN DEMO TRADING & EDUCATIONAL PLAN SIMPLIFIED Please watch the intro Video so you understand Nexgen's expectations for your demo time and what you should expect from us during your demo. CLICK TO WATCH
INTRODUCTION TO FOREX TRADING PARTS WITHIN THE SYLLABUS
 Zillion Training C O U R S E S Y L L A B U S KEY NOTE to why we are successful: Our unparalleled learning program supports its traders throughout their trading career. You are entitled 24X7 support once
Retracements With TMV
 A Series Of Indicators Used As One Trade Breakouts And Retracements With TMV Making good trading decisions involves finding indicators that cut through the market noise. But how do you do it without collapsing
Chapter 3.4. Forex Options
 Chapter 3.4 Forex Options 0 Contents FOREX OPTIONS Forex options are the next frontier in forex trading. Forex options give you just what their name suggests: options in your forex trading. If you have
DAY TRADING WITH THE INSTITUTIONS by Jay Wireman
 DAY TRADING WITH THE INSTITUTIONS by Jay Wireman Welcome everyone to my top day trading setups. Below you will find my powerful techniques using my proprietary symmetry software package that I have developed
BULLS ON WALL ST. 60 DAY TRADING BOOTCAMP
 BULLS ON WALL ST. 60 DAY TRADING BOOTCAMP Lead Instructor Kunal Desai Assistant Instructors Maribeth Willoughby Dr. Andrew Menaker Course Description This 60 day course teaches a setup based system to
Ways to improve. your trading (Beginners) By Chan Jia He, Senior Analyst 1/1/2014. NUS Students Investment Society NATIONAL UNIVERSITY OF SINGAPORE
 By Chan Jia He, Senior Analyst 1/1/2014. NUS Students Investment Society NATIONAL UNIVERSITY OF SINGAPORE") Ways to improve 1/1/2014 your trading (Beginners) By Chan Jia He, Senior Analyst NUS Students Investment Society NATIONAL UNIVERSITY OF SINGAPORE Introduction More often than not, many individuals who
Ways to improve 1/1/2014 your trading (Beginners) By Chan Jia He, Senior Analyst NUS Students Investment Society NATIONAL UNIVERSITY OF SINGAPORE Introduction More often than not, many individuals who
Exit Strategies for Stocks and Futures
 Exit Strategies for Stocks and Futures Presented by Charles LeBeau E-mail clebeau2@cox.net or visit the LeBeau web site at www.traderclub.com Disclaimer Each speaker at the TradeStationWorld Conference
An Objective Leading Indicator Fibonacci Retracements
 An Objective Leading Indicator Fibonacci Retracements This article explains how to use Fibonacci as a leading indicator, combining it with other technical analysis tools to provide precise, objective entry
Before we start lets look at other forex trading robots for sale online and the reason most fail is a clue to why the one enclosed works.
 A Forex Trading System for Bigger Long Term Profits Introduction Here we are going to look at a simple mechanical trading system which will make sure that you are on the right side of every big trend.
Trading Soybean Spreads
 DERIVATIVES Trading Soybean Spreads Here are the basics of trading a soybean commodity spread using a seasonal strategy. by Scott W. Barrie T he price relationship between two or more given commodity contracts
More informed trading Technical Analysis: Trends, Support and Resistance
 Technical Analysis: Trends, Support and Resistance Beginner Level Introduction 1 Stocks prices are always moving up and down and fortunes rest on the ability to predict such movements. The trader s job
Class 2: Buying Stock & Intro to Charting. Buying Stock
 Class 2: Buying Stock & Intro to Charting Today s Class Buying Stock Intro to Charting Real World Analysis Buying Stock What Is a Stock? Share of ownership in a company Publicly traded Holds monetary value
In my three years of day trading markets in Chicago, not one person who opened an account strictly for
 Article Text Copyright (c) Technical Analysis Inc. 1 Day trading and short-term trading techniques Part 2 by Kent Calhoun In my three years of day trading markets in Chicago, not one person who opened
Whether you re new to trading or an experienced investor, listed stock
 Chapter 1 Options Trading and Investing In This Chapter Developing an appreciation for options Using option analysis with any market approach Focusing on limiting risk Capitalizing on advanced techniques
Larry Williams Setup Tools
 Larry Williams Setup Tools Here we have a basket of the tools I use in my trading These tools are the cornerstone of how I find what I call setup markets. I use these indicators on stocks and commodities.
2014 S&P500 Bulletin Review
 2015 I Am in Wall Street Ltd Registered in England No. 9440096 Director: Daniele Prandelli W: www.iaminwallstreet.com E: info@iaminwallstreet.com T: 0044 75 212 46 792 2014 S&P500 Bulletin Review +124
Fibonacci Trader. Robert Krausz s. 32-Bit, Version 3.01
 PRODUCT REVIEW Robert Krausz s Fibonacci Trader 32-Bit, Version 3.01 FIBONACCI TRADER CORPORATION 1835 US 1 South 119, Suite 352 St. Augustine, FL 32086 To order: 512 443-5751 Fax: 512 443-7119 Internet: