Energy and Carbon -- Managing the Risks
|
|
|
- Marshall Richardson
- 8 years ago
- Views:
Transcription
1 Energy and Carbon -- Managing the Risks ExxonMobil 1 engages in constructive and informed dialogue with a wide variety of stakeholders on a number of energy-related topics. This report seeks to address important questions raised recently by several stakeholder organizations on the topics of global energy demand and supply, climate change policy, and carbon asset risk. As detailed below, ExxonMobil makes long-term investment decisions based in part on our rigorous, comprehensive annual analysis of the global outlook for energy, an analysis that has repeatedly proven to be consistent with the International Energy Agency World Energy Outlook, the U.S. Energy Information Administration Annual Energy Outlook, and other reputable, independent sources. For several years, our Outlook for Energy has explicitly accounted for the prospect of policies regulating greenhouse gas emissions (GHG). This factor, among many others, has informed investments decisions that have led ExxonMobil to become the leading producer of cleaner-burning natural gas in the United States, for example. Based on this analysis, we are confident that none of our hydrocarbon reserves are now or will become stranded. We believe producing these assets is essential to meeting growing energy demand worldwide, and in preventing consumers especially those in the least developed and most vulnerable economies from themselves becoming stranded in the global pursuit of higher living standards and greater economic opportunity. 1 As used in this document, ExxonMobil means Exxon Mobil Corporation and/or one or more of its affiliated companies. Statements of future events or conditions in this report are forward-looking statements. Actual future results, including economic conditions and growth rates; energy demand and supply sources; efficiency gains; and capital expenditures, could differ materially due to factors including technological developments; changes in law or regulation; the development of new supply sources; demographic changes; and other factors discussed herein and under the heading Factors Affecting Future Results in the Investors section of our website at: The information provided includes ExxonMobil s internal estimates and forecasts based upon internal data and analyses, as well as publicly available information from external sources including the International Energy Agency. Citations in this document are used for purposes of illustration and reference only and any citation to outside sources does not necessarily mean that ExxonMobil endorses all views or opinions expressed in or by those sources. 1

2 1. Strong Correlation between Economic Growth and Energy Use The universal importance of accessible and affordable energy for modern life is undeniable. Energy powers economies and enables progress throughout the world. It provides heat for homes and businesses to protect against the elements; power for hospitals and clinics to run advanced, life-saving equipment; fuel for cooking and transportation; and light for schools and streets. Energy is the great enabler for modern living and it is difficult to imagine life without it. Given the importance of energy, it is little wonder that governments seek to safeguard its accessibility and affordability for their growing populations. It is also understandable that any restrictions on energy production that decrease its accessibility, reliability or affordability are of real concern to consumers who depend upon it. 2

3 2. World Energy Needs Keep Growing Each year, ExxonMobil analyzes trends in energy and publishes our forecast of global energy requirements in our Outlook for Energy. The Outlook provides the foundation for our business and investment planning, and is compiled from the breadth of the company s worldwide experience in and understanding of the energy industry. It is based on rigorous analyses of supply and demand, technological development, economics, and government policies and regulations, and it is consistent with many independent, reputable third-party analyses. ExxonMobil s current Outlook for Energy extends through the year 2040, and contains several conclusions that are relevant to questions raised by stakeholder organizations. Understanding this factual and analytical foundation is crucial to understanding ExxonMobil s investment decisions and approach to the prospect of further constraints on carbon. World population increases. Ultimately, the focus of ExxonMobil s Outlook for Energy indeed, the focus of our business is upon people, their economic aspirations and their energy requirements. Accordingly, our analysis begins with demographics. Like many independent analyses, ExxonMobil anticipates the world s population will add two billion people to its current total of seven billion by the end of the Outlook period. The majority of this growth will occur in developing countries. World GDP grows. The global economy will grow as the world s population increases, and it is our belief that GDP gains will outpace population gains over the Outlook period, resulting in higher living standards. Assuming sufficient, reliable and affordable energy is available, we see world GDP growing at a rate that exceeds population growth through the Outlook period, almost tripling in size from what it was globally in It is 2 We see global GDP approaching $120 trillion, as compared to $40 trillion of global GDP in 2000 (all in constant 2005 USA$ s). GDP per capita will also grow by about 80 percent between 2010 and 2040, despite the increase in population. 3


4 largely the poorest and least developed of the world s countries that benefit most from this anticipated growth. However, this level of GDP growth requires more accessible, reliable and affordable energy to fuel growth, and it is vulnerable populations who would suffer most should that growth be artificially constrained. Energy demand grows with population and GDP. As the world becomes more populous and living standards improve over the Outlook period, energy demand will increase as well. We see the world requiring 35 percent more energy in 2040 than it did in The pace of this energy demand increase is higher than the population growth rate, but less than global GDP growth rate. Greater energy efficiency is a key reason why energy demand growth trails economic growth. We see society implementing policy changes that will promote energy efficiency, which will serve to limit energy demand growth. We also see many governments adopting policies that promote the switch to less carbonintensive fuels, such as natural gas. As noted in the chart above, energy demand in 2040 could be almost double what it would be without the anticipated efficiency gains. 4


5 ExxonMobil believes that efficiency is one of the most effective tools available to manage greenhouse gas emissions, and accordingly our company is making significant contributions to energy efficiency, both in our own operations and in our products. Energy-related CO2 emissions stabilize and start decreasing. As the world s population grows and living standards increase, we believe GHG emissions will plateau and start decreasing during the Outlook period. In the OECD countries, energy-based GHG emissions have already peaked and are declining. Our views in this regard are similar to other leading, independent forecasts. 3 As part of our Outlook process, we do not project overall atmospheric GHG concentration, nor do we model global average temperature impacts. 4 However, we do project an energy-related CO2 emissions profile through 2040, and this can be compared 3 For example, the IEA predicts that energy-related emissions will grow by 20%, on trend but slightly higher than our Outlook. See 4 These would require data inputs that are well beyond our company s ability to reasonably measure or verify. 5


6 to the energy-related CO2 emissions profiles from various scenarios outlined by the Intergovernmental Panel on Climate Change (IPCC). When we do this, our Outlook emissions profile through 2040 would closely approximate the IPCC s intermediate RCP 4.5 emissions profile pathway in shape, but is slightly under it in magnitude. 5 All economic energy sources are needed to meet growing global demand. In analyzing the evolution of the world s energy mix, we anticipate renewables growing at the fastest pace among all sources through the Outlook period. However, because they make a relatively small contribution compared to other energy sources, renewables will continue to comprise about 5 percent of the total energy mix by Factors limiting further penetration of renewables include scalability, geographic dispersion, intermittency (in the case of solar and wind), and cost relative to other sources. 5 The IPCC RCP 4.5 scenario extends 60 years beyond our Outlook period to the year 2100, and incorporates a full carbon cycle analysis. The relevant time horizons differ and we do not forecast potential climate impacts as part of our Outlook, and therefore cannot attest to their accuracy. 6


7 The cost limitations of renewables are likely to persist even when higher costs of carbon are considered. 3. Climate Change Risk ExxonMobil takes the risk of climate change seriously, and continues to take meaningful steps to help address the risk and to ensure our facilities, operations and investments are managed with this risk in mind. Many governments are also taking these risks seriously, and are considering steps they can take to address them. These steps may vary in timing and approach, but regardless, it is our belief they will be most effective if they are informed by global energy demand and supply realities, and balance the economic aspirations of consumers. 7

8 4. Carbon Budget and Carbon Asset Risk Implications One focus area of stakeholder organizations relates to what they consider the potential for a so-called carbon budget. Some are advocating for this mandated carbon budget in order to achieve global carbon-based emission reductions in the range of 80 percent through the year 2040, with the intent of stabilizing world temperature increases not to exceed 2 degrees Celsius by 2100 (i.e., the low carbon scenario ). A concern expressed by some of our stakeholders is whether such a low carbon scenario could impact ExxonMobil s reserves and operations i.e., whether this would result in unburnable proved reserves of oil and natural gas. The low carbon scenario would require CO2 prices significantly above current price levels. In 2007, the U.S. Climate Change Science Program published a study that examined, among other things, the global CO2 cost needed to drive investments and transform the global energy system, in order to achieve various atmospheric CO2 stabilization pathways. The three pathways shown in the chart below are from the MIT IGSM model used in the study, and are representative of scenarios with assumed climate policies that stabilize GHGs in the atmosphere at various levels, from 650 ppm CO2 down to 450 ppm CO2, a level approximating the level asserted to have a reasonable chance at meeting the low carbon scenario. Meeting the 450 ppm pathway requires large, immediate reductions in emissions with overall net emissions becoming negative in the second half of the century. Non-fossil energy sources, like nuclear and renewables, along with carbon capture and sequestration, are deployed in order to transform the energy system. Costs for CO2 required to drive this transformation are modeled. In general, CO2 costs rise with more stringent stabilization targets and with time. Stabilization at 450 ppm would require CO2 prices significantly above current price levels, rising to over $200 per ton by By comparison, current EU Emissions Trading System prices are approximately $8 to $10 per ton of CO2. In the right section of the chart below, different levels of added CO2 are converted to estimated added annual energy costs for an average American family earning the median 8


9 income. For example, by 2030 for the 450ppm CO2 stabilization pathway, the average American household would face an added CO2 cost of almost $2,350 per year for energy, amounting to about 5 percent of total before-tax median income. These costs would need to escalate steeply over time, and be more than double the 2030 level by mid-century. Further, in order to stabilize atmospheric GHG concentrations, these CO2 costs would have to be applied across both developed and developing countries. In 2008, the International Energy Agency estimated that reducing greenhouse gas emissions to just 50 percent below 2005 levels by 2050 would require $45 trillion in added energy supply and infrastructure investments. 6 In this scenario, the IEA estimated that each year between 2005 and 2050 the world would need to construct 24 to 32 onethousand-megawatt nuclear plants, build 30 to 35 coal plants with carbon capture and 6 See IEA Energy Technology Perspectives 2008, Scenarios & Strategies to


10 sequestration capabilities, and install 3,700 to 17,800 wind turbines of four megawatt capacity. Transforming the energy system will take time. Energy use and mix evolve slowly due to the vast size of the global energy system. As shown in the chart below, biomass like wood was the primary fuel for much of humanity s existence. Coal supplanted biomass as the primary energy source around 1900; it was not until the middle of the 20 th century before oil overtook coal as the primary source of energy. We believe the transition to lower carbon energy sources will also take time, despite rapid growth rates for such sources. Traditional energy sources have had many decades to scale up to meet the enormous energy needs of the world. As discussed above, renewable sources, such as solar and wind, despite very rapid growth rates, cannot scale up quickly enough to meet global demand growth while at the same time displacing more traditional sources of energy. 10


11 A low carbon scenario will impact economic development. Another consideration related to the low carbon scenario is that capping of carbon-based fuels would likely harm those least economically developed populations who are most in need of affordable, reliable and accessible energy. 7 Artificially restricting supplies can also increase costs, and increasing costs would not only impact the affordability and accessibility of energy, especially to those least able to pay, it could impact the rate of economic development and living standards for all. Increasing energy costs leads to a scarcity of affordable, reliable and accessible energy and can additionally lead to social instability. While the risk of regulation where GHG emissions are capped to the extent contemplated in the low carbon scenario during the Outlook period is always possible, it is difficult to envision governments choosing this path in light of the negative implications for economic growth and prosperity that such a course poses, especially when other avenues may be available, as discussed further below. 7 According to the International Energy Agency, 2.6 billion people still rely on biomass for cooking and over 15% of the world s population lacks access to electricity ( 11

12 Even in a low carbon scenario, hydrocarbon energy sources are still needed. The IEA in its World Energy Outlook 2013 examined production of liquids from currentlyproducing fields, in the absence of additional investment, versus liquids demand, for both their lead New Policies Scenario and for a 450 Scenario. As shown in the chart above, in both scenarios, there remains significant liquids demand through 2035, and there is a need for ongoing development and investment. Without ongoing investment, liquids demand will not be met, leaving the world short of oil. ExxonMobil believes that although there is always the possibility that government action may impact the company, the scenario where governments restrict hydrocarbon production in a way to reduce GHG emissions 80 percent during the Outlook period is highly unlikely. The Outlook demonstrates that the world will require all the carbonbased energy that ExxonMobil plans to produce during the Outlook period. 8 Also, as discussed above, we do not anticipate society being able to supplant traditional carbonbased forms of energy with other energy forms, such as renewables, to the extent needed to meet this carbon budget during the Outlook period. 5. Managing the Risk ExxonMobil s actions. ExxonMobil addresses the risk of climate change in several concrete and meaningful ways. We do so by improving energy efficiency and reducing emissions at our operations, and by enabling consumers to use energy more efficiently through the advanced products we manufacture. In addition, we conduct and support extensive research and development in new technologies that promote efficiency and reduce emissions. 8 ExxonMobil s proved reserves at year-end 2013 are estimated to be produced on average within sixteen years, well within the Outlook period. See Exxon Mobil Corporation 2013 Financial & Operating Review, p. 22. It is important to note that this sixteen year average reserves-to-production ratio does not mean that the company will run out of hydrocarbons in sixteen years, since it continues to add proved reserves from its resource base and has successfully replaced more than 100% of production for many years. See Item 2 Financial Section of ExxonMobil s 2013 Form 10-K for ExxonMobil s proved reserves, which are determined in accordance with current SEC definitions. 12

13 In our operations, we apply a constant focus on efficiency that enables us to produce energy to meet society s needs using fewer resources and at a lower cost. For example, ExxonMobil is a leader in cogeneration at our facilities, with equity ownership in more than 100 cogeneration units at more than 30 sites with over 5200 megawatts of capacity. This capacity, which is equivalent to the electricity needs of approximately 2.5 million U.S. households, reduces the burden on outside power and grid suppliers and can reduce the resulting emissions by powering ExxonMobil s operations in a more efficient and effective manner. We also constantly strive to reduce the emission intensity of our operations. Cumulative savings, for example, between 2009 and 2012 amounted to 8.4 million metric tons of greenhouse gases. Many of ExxonMobil s products also enable consumers to be more energy efficient and therefore reduce greenhouse gas emissions. Advancements in tire liner technology developed by ExxonMobil allow drivers to save fuel. Our synthetic lubricants also improve vehicle engine efficiency. And lighter weight plastics developed by ExxonMobil reduce vehicle weights, further contributing to better fuel efficiency. 9 ExxonMobil is also the largest producer of natural gas in the United States, a fuel with a variety of consumer uses, including heating, cooking and electricity generation. Natural gas emits up to 60 percent less CO2 than coal when used as the source for power generation. Research is another area in which ExxonMobil is contributing to energy efficiency and reduced emissions. We are on the forefront of technologies to lower greenhouse gas emissions. For example, ExxonMobil operates one of the world s largest carbon capture 9 Using ExxonMobil fuel-saving technologies in one-third of U.S. vehicles, for example, could translate into a saving of about 5 billion gallons of gasoline, with associated greenhouse gas emissions savings equivalent to taking about 8 million cars off the road. 13

14 and sequestration (CCS) operations at our LaBarge plant in Wyoming. It is a co-venturer in another project, the Gorgon natural gas development in Australia, which when operational will have the largest saline reservoir CO2 injection facility in the world. The company is leveraging its experience with CCS in developing new methods for capturing CO2, which can reduce costs and increase the application of carbon capture for society. ExxonMobil also is actively engaged, both internally and in partnership with renowned universities and institutions, in research on new break-through technologies for energy. The company also engineers its facilities and operations robustly with extreme weather considerations in mind. Fortification to existing facilities and operations are addressed, where warranted due to climate or weather events, as part of ExxonMobil s Operations Integrity Management System. ExxonMobil routinely conducts life cycle assessments (LCAs), which are useful to understand whether a technology can result in environmental improvements across a broad range of factors. For example, in 2011 we conducted a LCA in concert with Massachusetts Institute of Technology and Synthetic Genomics Inc. to assess the impact of algal biofuel production on GHG emissions, land use, and water use. The study demonstrated the potential that algae fuels can be produced with freshwater consumption equivalent to petroleum refining, and enable lower GHG emissions. A more recent LCA demonstrated that well-to-wire GHG emissions from shale gas are about half that of coal, and not significantly different than emissions of conventional gas. In addition, ExxonMobil is involved in researching emerging technologies that can help mitigate the risk of climate change. For example, the company has conducted research into combustion fundamentals with automotive partners in order to devise concepts to improve the efficiency and reduce emissions of internal combustion engines. ExxonMobil has also developed technology for an on-board hydrogen-powered fuel cell that converts other fuels into hydrogen directly under a vehicle s hood, thereby eliminating the need for separate facilities for producing and distributing hydrogen. This 14

15 technology can be up to 80 percent more fuel efficient and emit 45 percent less CO2 than conventional internal combustion engines. The company is also a founding member of the Global Climate and Energy Project at Stanford University, a program that seeks to develop fundamental, game-changing scientific breakthroughs that could lower GHG emissions. Government policy. Addressing climate risks is one of many important challenges that governments face on an ongoing basis, along with ensuring that energy supplies are affordable and accessible to meet societal needs. Energy companies like ExxonMobil can play a constructive role in this decision-making process by sharing our insights on the most effective means of achieving society s goals given the workings of the global energy system and the realities that govern it. The introduction of rising CO2 costs will have a variety of impacts on the economy and energy use in every sector and region within any given country. Therefore, the exact nature and pace of GHG policy initiatives will likely be affected by their impact on the economy, economic competitiveness, energy security and the ability of individuals to pay the related costs. Governments constraints on use of carbon-based energy sources and limits on greenhouse gas emissions are expected to increase throughout the Outlook period. However, the impact of these rising costs of regulations on the economy we expect will vary regionally throughout the world and will not rise to the level required for the low carbon scenario. These reasonable constraints translate into costs, and these costs will help drive the efficiency gains that we anticipate will serve to curb energy growth requirements for society as forecasted over the Outlook period. We also see these reasonable constraints leading to a lower carbon energy mix over the Outlook period, which can serve to further reduce greenhouse gas emissions. For example, fuel switching to cleaner burning fuels such as natural gas has significantly 15

16 contributed to the United States reducing greenhouse gas emissions last year to levels not seen since Furthermore, the impact of efficiency is expected to help stabilize and eventually to reduce GHG emissions over the Outlook period, as discussed previously. These constraints will also likely result in dramatic global growth in natural gas consumption at the expense of other forms of energy, such as coal. We see the continued focus on efficiency, conservation and fuel switching as some of the most effective and balanced ways society can address climate change within the Outlook period in a manner that avoids the potentially harmful and destabilizing consequences that the artificial capping of needed carbon-based energy sources implied within the low carbon scenario can cause Planning Bases and Investments ExxonMobil is committed to disciplined investing in attractive opportunities through the normal fluctuations in business cycles. Projects are evaluated under a wide range of possible economic conditions and commodity prices that are reasonably likely to occur, and we expect them to deliver competitive returns through the cycles. We do not publish the economic bases upon which we evaluate investments due to competitive considerations. However, we apply prudent and substantial safety margins in our planning assumptions to help ensure robust returns. In assessing the economic viability of proved reserves, we do not believe a scenario consistent with reducing GHG emissions by 80 percent by 2050, as suggested by the low carbon scenario, lies within the reasonably likely to occur range of planning assumptions, since we consider the scenario highly unlikely. The company also stress tests its oil and natural gas capital investment opportunities, which provides an added margin of safety against uncertainties, such as those related to technology, costs, geopolitics, availability of required materials, services, and labor, etc. 10 Permitting the freer trade and export of natural gas is but one way, for example, where countries that rely on more carbon-intense forms of energy can increase their use of cleaner-burning fuels. 16

17 Such stress testing differs from alternative scenario planning, such as alternate Outlooks, which we do not develop, but stress testing provides us an opportunity to fully consider different economic scenarios in our planning and investment process. The Outlook is reviewed at least annually, and updated as needed to reflect changes in views and circumstances, including advances in technology. We also address the potential for future climate-related controls, including the potential for restriction on emissions, through the use of a proxy cost of carbon. This proxy cost of carbon is embedded in our current Outlook for Energy, and has been a feature of the report for several years. The proxy cost seeks to reflect all types of actions and policies that governments may take over the Outlook period relating to the exploration, development, production, transportation or use of carbon-based fuels. Our proxy cost, 17

18 which in some areas may approach $80/ton over the Outlook period 11, is not a suggestion that governments should apply specific taxes. It is also not the same as a social cost of carbon, which we believe involves countless more assumptions and subjective speculation on future climate impacts. It is simply our effort to quantify what we believe government policies over the Outlook period could cost to our investment opportunities. Perhaps most importantly, we require that all our business segments include, where appropriate, GHG costs in their economics when seeking funding for capital investments. We require that investment proposals reflect the climate-related policy decisions we anticipate governments making during the Outlook period and therefore incorporate them as a factor in our specific investment decisions. When governments are considering policy options, ExxonMobil advocates an approach that ensures a uniform and predictable cost of carbon; allows market prices to drive solutions; maximizes transparency to stakeholders; reduces administrative complexity; promotes global participation; and is easily adjusted to future developments in climate science and policy impacts. We continue to believe a revenue-neutral carbon tax is better able to accommodate these key criteria than alternatives such as cap-and-trade. Our views are based on our many years of successful energy experience worldwide and are similar to long-term energy demand forecasts of the International Energy Agency. As discussed previously, we see population, GDP and energy needs increasing for the world over the Outlook period, and that all economically viable energy sources will be required to meet these growing needs. We believe that governments will carefully balance the risk of climate change against other pressing social needs over the Outlook period, including the need for accessible, reliable and affordable energy, and that an artificial capping of carbon-based fuels to levels in the low carbon scenario is highly unlikely. 11 As noted in our Outlook, this amount varies from country to country, with that amount generally equating to OECD countries, and lower amounts applying to non-oecd countries. 18

19 7. Capital Allocation ExxonMobil maintains capital allocation discipline with rigorous project evaluation and investment selectivity, while consistently returning cash to our shareholders. Our capital allocation approach is as follows: I. Invest in resilient, attractive business opportunities II. Pay a reliable and growing dividend III. Return excess cash to shareholders through the purchase of shares. Although the company does not incorporate the low carbon scenario in its capital allocation plans, a key strategy to ensure investment selectivity under a wide range of economic assumptions is to maintain a very diverse portfolio of oil and gas investment opportunities. This diversity in terms of resource type and corresponding development options (oil, gas, NGLs, onshore, offshore, deepwater, conventional, unconventional, LNG, etc.) and geographic dispersion is unparalleled in the industry. Further, the company does not believe current investments in new reserves are exposed to the risk of stranded assets, given the rising global need for energy as discussed earlier. 8. Optional Reserves Disclosure under SEC Rules Some have suggested that ExxonMobil consider availing itself of an optional disclosure available to securities issuers under Item 1202 of SEC Regulation S-K. 12 That SEC item provides, among other things, that the registrant may, but is not required to, disclose, in the aggregate, an estimate of reserves estimated for each product type based on different price and cost criteria, such as a range of prices and costs that may reasonably be 12 The rules were subject to comment at the time that they were proposed. See Modernization of Oil and Gas Reporting, Securities and Exchange Commission, 17 CFR Parts 210, 211, 229, and 249 [Release Nos ; ; FR-78; File Nos. S ] at p. 66. ( ExxonMobil also provided comments to the proposed provision. See Letter of Exxon Mobil Corporation to Ms. Florence Harmon, Acting Secretary, Securities and Exchange Commission, September 5, 2008, File Number S Modernization of the Oil and Gas Reporting Requirements at p

20 achieved, including standardized futures prices or management s own forecasts. Proponents ask the company to use this option to identify the price sensitivity of its reserves, with special reference to long-lived unconventional reserves such as oil sands. We believe the public reporting of reserves is best done using the historical price basis as required under Item 1202(a) of Regulation S-K, rather than the optional sensitivity analysis under Item 1202(b), for several reasons. First and most importantly, historical prices are a known quantity and reporting on this basis provides information that can be readily compared between different companies and over multiple years. 13 Proved reserve reporting using historical prices is a conservative approach that gives investors confidence in the numbers being reported. Using speculative future prices, on the other hand, would introduce uncertainty and potential volatility into the reporting, which we do not believe would be helpful for investors. In fact, we believe such disclosure could be misleading. Price forecasts are subject to considerable uncertainty. While ExxonMobil tests its project economics to ensure they will be robust under a wide variety of possible future circumstances, we do not make predictions or forecasts of future oil and gas prices. If reserves determined on a speculative price were included in our SEC filings, we believe such disclosure could potentially mislead investors, or give such prices greater weight in making investment decisions than would be warranted. We are also concerned that providing the optional sensitivity disclosure could enable our competitors to infer commercial information about our projects, resulting in commercial harm to ExxonMobil and our shareholders. We note that none of our key competitors to our knowledge provide the Item 1202(b) sensitivity disclosure. 13 We note the rules under 1202(a) use an average of monthly prices over the year rather than a single spot price, thus helping to reduce the effects of short-term volatility that often characterize oil and gas prices. 20
, for several reasons.")
21 Lastly, we note that even when sensitivity disclosure under Item 1202(b) is included in a filing, the price and cost assumptions must be ones the company believes are reasonable. This disclosure item is therefore not intended or permitted to be a vehicle for exploring extreme scenarios. For all the above reasons, we do not believe including the sensitivity disclosure under Item 1202(b) in our SEC filings would be prudent or in the best interest of our shareholders. 9. Summary In summary, ExxonMobil s Outlook for Energy continues to provide the basis for our long-term investment decisions. Similar to the forecasts of other independent analysts, our Outlook envisions a world in which populations are growing, economies are expanding, living standards are rising, and, as a result, energy needs are increasing. Meeting these needs will require all economic energy sources, especially oil and natural gas. Our Outlook for Energy also envisions that governments will enact policies to constrain carbon in an effort to reduce greenhouse gas emissions and manage the risks of climate change. We seek to quantify the cumulative impact of such policies in a proxy cost of carbon, which has been a consistent feature of our Outlook for Energy for many years. We rigorously consider the risk of climate change in our planning bases and investments. Our investments are stress tested against a conservative set of economic bases and a broad spectrum of economic assumptions to help ensure that they will perform adequately, even in circumstances that the company may not foresee, which provides an additional margin of safety. We also require that all significant proposed projects include a cost of carbon which reflects our best assessment of costs associated with potential GHG regulations over the Outlook period when being evaluated for investment. 21
22 Our Outlook for Energy does not envision the low carbon scenario advocated by some because the costs and the damaging impact to accessible, reliable and affordable energy resulting from the policy changes such a scenario would produce are beyond those that societies, especially the world s poorest and most vulnerable, would be willing to bear, in our estimation. In the final analysis, we believe ExxonMobil is well positioned to continue to deliver results to our shareholders and deliver energy to the world s consumers far into the future. Meeting the economic needs of people around the world in a safe and environmentally responsible manner not only informs our Outlook for Energy and guides our investment decisions, it is also animates our business and inspires our workforce. 10. Additional Information There were additional information requests raised by some in the course of engagement with the groups with whom we have been dialoguing. These are addressed in the Appendix. 22
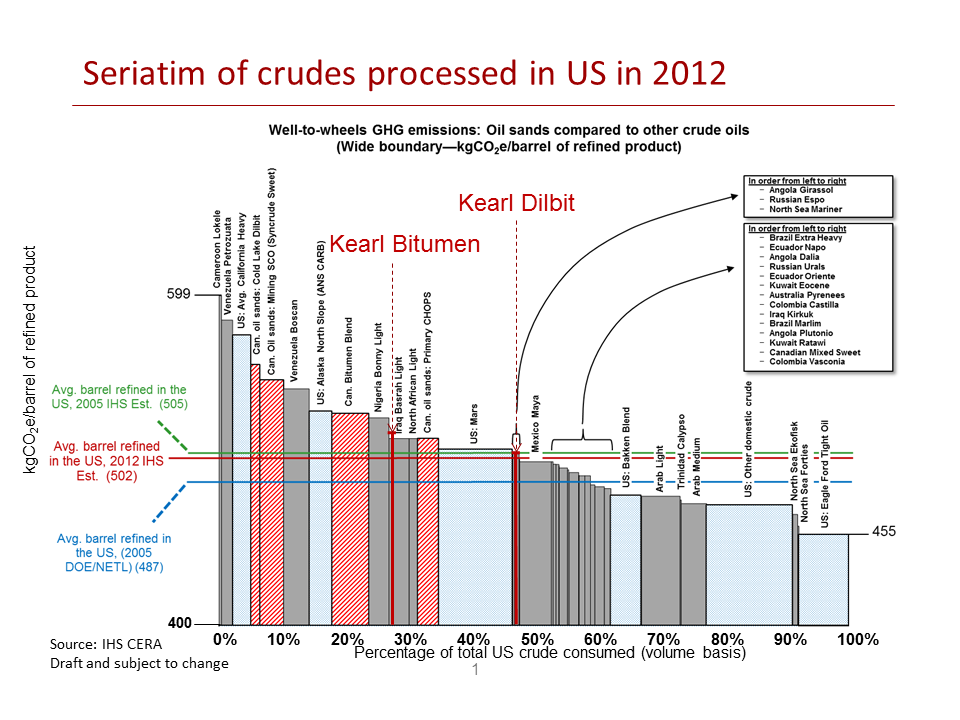
23 Appendix Topic Page Proved Reserves 24 Resource Base 25 Oil & Gas Production Outlook 26 CAPEX Outlook 27 Oil & Gas Exploration and Production Earnings and Unit Profitability 28 Production Prices and Production Costs 29 Wells-to-Wheels GHG emissions seriatim 30 23
24 EXXONMOBIL PROVED RESERVES - AT DECEMBER 31, 2013 United Canada/ Australia/ Canada/ Canada/ States S. Amer. (2) Europe Africa Asia Oceania Total Worldwide S. Amer. (2) S. Amer. (2) Total Crude Oil Natural Gas Liquids (2) Bitumen Synthetic Oil Total liquids proved reserves (1) (millions of barrels) 2, ,193 3, ,551 1,479 3, ,239 Natural Gas Total natural gas proved reserves (1) (billions of cubic feet) 26,301 1,235 11, ,248 7,515 71, ,860 Oil-Equivalent Total All Products (3) (millions of oil-equivalent barrels) 6, ,222 1,338 7,349 1,407 19,528 1,479 3, ,216 Proved Reserves Distribution (4) (percent, oil equivalent barrels) By Region By Resource Type By Hydrocarbon Type Australia/Oceania Africa Arctic Deepwater Europe Americas LNG Conventional Liquids Gas Asia Acid/Sour Heavy Oil/ Oil Sands Unconventional Gas & Oil (1) Source: ExxonMobil 2013 Form 10-K (pages 103 and 106). (2) Includes total proved reserves attributable to Imperial Oil Limited, in which there is a 30.4 percent noncontrolling interest. Refer to ExxonMobil 2013 Form 10-K (pages 103, 104, and 106) for more details. (3) Natural gas is converted to oil-equivalent basis at six million cubic feet per one thousand barrels. (4) Source: ExxonMobil 2013 Financial and Operating Review (page 22). 24
25 EXXONMOBIL RESOURCE BASE AT DECEMBER 31, 2013 (1) Billion Oil-Equivalent Barrels (BOEB) 90 Deepwater Arctic Acid / Sour Australia / Oceania Europe Africa LNG Gas Asia Evaluating 60 Heavy Oil / Oil Sands 30 Unconventional Gas & Oil Americas Design / Develop Liquids Conventional Proved 0 By Resource Type By Hydrocarbon Type By Region By Business Stage (1) Source: 2013 ExxonMobil Financial & Operating Review (page 21) and 2014 Analyst Meeting (slide 49). Note: ExxonMobil s resource base includes quantities of oil and gas that are not yet classified as proved reserves under SEC definitions, but that we believe will ultimately be developed. These quantities are also not intended to correspond to probable or possible reserves under SEC rules. 25
26 EXXONMOBIL OIL & GAS PRODUCTION OUTLOOK (1) Total Production Outlook (2) Millions Oil-Equivalent Barrels Per Day (MOEBD), net 2.4 Liquids Gas '13 '14 '15 '16 '17 Total Total production outlook 2014: Flat : up 2-3% per year Liquids outlook 2014: up 2% : up 4% per year Gas outlook 2014: down 2% : up 1% per year (1) Source 2014 ExxonMobil Analyst Meeting (slide 32). (2) 2013 production excludes the impact of UAE onshore concession expiry and Iraq West Qurna 1 partial divestment. Production outlook excludes impact from future divestments and OPEC quota effects. Based on 2013 average price ($109 Brent). 26
27 EXXONMOBIL CAPEX OUTLOOK (1) Capex by Business Line $B Acquisitions Chemical Downstream Upstream '13 '14 '15-'17 Average < $37B/year Expect to invest $39.8B in 2014 Reduced Upstream spending Selective Downstream and Chemical investments Average less than $37B per year from 2015 to 2017 (1) Source 2014 ExxonMobil Analyst Meeting (slide 33). 27
28 EXXONMOBIL OIL & GAS EXPLORATION AND PRODUCTION EARNINGS AND UNIT PROFITABILITY (1) The revenue, cost, and earnings data are shown both on a total dollar and a unit basis, and are inclusive of non-consolidated and Canadian oil sands operations. Total Revenues and Costs, Including Non-Consolidated Interests and Oil Sands Revenues and Costs per Unit of Sales or Production (2) Canada/ Canada/ United States South America Europe Africa Asia Australia/ Oceania Total United States South America Outside Americas Worldw ide 2013 (millions of dollars) (dollars per unit of sales) Revenue Liquids 13,350 7,558 6,751 18,811 28,440 1,596 76, Natural gas 3, , , , (dollars per barrel of net oil-equivalent production) Total revenue 17,230 7,918 18,135 18,817 41,917 2, , Less costs: Production costs excluding taxes 4,742 3,965 3,318 2,396 2, , Depreciation and depletion 5, ,050 3,269 2, , Exploration expenses , Taxes other than income 1, ,466 1,583 9, , Related income tax 1, ,956 6,841 14, , Results of producing activities 3,537 1,942 3,085 4,440 12, , Other earnings (3) 662 (495) (118) (4.00) Total earnings, excluding power and coal 4,199 1,447 3,387 4,499 12, , Power and coal (8) Total earnings 4,191 1,447 3,387 4,499 13, , Unit Earnings Excluding NCI Volumes (4) (1) Source: ExxonMobil 2013 Financial and Operating Review (page 56). (2) The per-unit data are divided into two sections: (a) revenue per unit of sales from ExxonMobil s own production; and, (b) operating costs and earnings per unit of net oil-equivalent production. Units for crude oil and natural gas liquids are barrels, while units for natural gas are thousands of cubic feet. The volumes of crude oil and natural gas liquids production and net natural gas production available for sale used in this calculation are shown on pages 48 and 49 of ExxonMobil s 2013 Financial & Operating Review. The volumes of natural gas were converted to oil-equivalent barrels based on a conversion factor of 6 thousand cubic feet per barrel. (3) Includes earnings related to transportation operations, LNG liquefaction and transportation operations, sale of third-party purchases, technical services agreements, other nonoperating activities, and adjustments for noncontrolling interests. (4) Calculation based on total earnings (net income attributable to ExxonMobil) divided by net oilequivalent production less noncontrolling interest (NCI) volumes. 28
29 EXXONMOBIL PRODUCTION PRICES AND PRODUCTION COSTS (1) The table below summarizes average production prices and average production costs by geographic area and by product type. United States Canada/ S. America Europe Africa Asia During 2013 (dollars per unit) Total Average production prices (2) (1) Source: ExxonMobil 2013 Form 10-K (page 9) (2) Revenue per unit of sales from ExxonMobil s own production. (See ExxonMobil s 2013 Financial & Operating Review, page 56.) Revenue in this calculation is the same as in the Results of Operations disclosure in ExxonMobil s 2013 Form 10-K (page 97) and does not include revenue from other activities that ExxonMobil includes in the Upstream function, such as oil and gas transportation operations, LNG liquefaction and transportation operations, coal and power operations, technical service agreements, other nonoperating activities and adjustments for noncontrolling interests, in accordance with Securities and Exchange Commission and Financial Accounting Standards Board rules. (3) Production costs per unit of net oil-equivalent production. (See ExxonMobil s 2013 inancial & Operating Review, page 56.) The volumes of natural gas were converted to oil-equivalent barrels based on a conversion factor of 6 thousand cubic feet per barrel. Production costs in this calculation are the same as in the Results of Operations disclosure in ExxonMobil s 2013 Form 10-K (page 97) and do not include production costs from other activities that ExxonMobil includes in the Upstream function, such as oil and gas transportation operations, LNG liquefaction and transportation operations, coal and power operations, technical service agreements, other nonoperating activities and adjustments for noncontrolling interests, in accordance with Securities and Exchange Commission and Financial Accounting Standards Board rules. Depreciation & depletion, exploration costs, and taxes are not included in production costs. Australia/ Oceania Crude oil, per barrel NGL, per barrel Natural gas, per thousand cubic feet Bitumen, per barrel Synthetic oil, per barrel Average production costs, per oil-equivalent barrel - total (3) Average production costs, per barrel - bitumen (3) Average production costs, per barrel - synthetic oil (3) Total 29
30 30
Energy and Climate. ExxonMobil 1 appreciates this opportunity to provide comments on the topics of global energy and climate change.
 Energy and Climate ExxonMobil 1 appreciates this opportunity to provide comments on the topics of global energy and climate change. The Importance of Energy Energy is everywhere and it transforms everything.
World Energy Outlook 2009. Presentation to the Press London, 10 November 2009
 World Energy Outlook 29 Presentation to the Press London, 1 November 29 The context The worst economic slump since the 2 nd World War & signs of recovery but how fast? An oil price collapse & then a rebound
Global Climate Disclosure Framework for Oil & Gas Companies
 Global Climate Disclosure Framework for Oil & Gas Companies An international initiative in partnership with: Europe North America Australia/New Zealand About IIGCC The Institutional Investors Group on
Global Energy Trends; 2030 to 2050
 Global Energy Trends; 2030 to 2050 Hilbre Consulting Limited, Heswall, Wirral, UK billwpyke@aol.com March 2012 This note synthesises and analyses the key conclusions from seven recent, authoritative studies
Financial Statements and Supplemental Information
 2013 Financial Statements and Supplemental Information For the Fiscal Year Ended December 31, 2013 FINANCIAL SECTION TABLE OF CONTENTS Business Profile 2 Financial Summary 3 Frequently Used Terms 4 Quarterly
Energy Megatrends 2020
 Energy Megatrends 2020 Esa Vakkilainen 1 NOTE The data included in the following is mainly based on International Energy Agency's (IEA) World Energy Outlook 2007 IEA is considered the most reliable source
Nuclear power is part of the solution for fighting climate change
 Nuclear power is part of the solution for fighting climate change "Nuclear for Climate" is an initiative undertaken by the members of the French Nuclear Energy Society (SFEN), the American Nuclear Society
Economic Impacts of Potential Colorado Climate Change Initiatives: Evidence from MIT and Penn State Analyses. July 2007
 Economic Impacts of Potential Colorado Climate Change Initiatives: Evidence from MIT and Penn State Analyses July 2007 Introduction California and other western states are actively pursuing a variety of
2015 SRI FIELD TRIP TO CANADA. ROYAL DUTCH SHELL September 15, 2015
 2015 SRI FIELD TRIP TO CANADA ROYAL DUTCH SHELL September 15, 2015 1 DEFINITIONS AND CAUTIONARY NOTE The New Lens Scenarios referred to in this presentation are part of an ongoing process used in Shell
Energy Projections 2006 2030 Price and Policy Considerations. Dr. Randy Hudson Oak Ridge National Laboratory
 Energy Projections 2006 2030 Price and Policy Considerations Dr. Randy Hudson Oak Ridge National Laboratory There is perhaps no single current topic so potentially impacting to all life on this planet
World Energy Outlook 2007: China and India Insights. www.worldenergyoutlook.org International Energy Agency
 World Energy Outlook 27: China and India Insights www.worldenergyoutlook.org International Energy Agency Why Focus on China & India? Increase in World Primary Energy Demand, Imports & Energy-Related CO
Levelized Cost and Levelized Avoided Cost of New Generation Resources in the Annual Energy Outlook 2015
 June 2015 Levelized Cost and Levelized Avoided Cost of New Generation Resources in the Annual Energy Outlook 2015 This paper presents average values of levelized costs for generating technologies that
MAKE MONEY. MAKE A DIFFERENCE. GETTING REAL ABOUT THE ENERGY TRANSITION
 MAKE MONEY. MAKE A DIFFERENCE. GETTING REAL ABOUT THE ENERGY TRANSITION WHAT IS THE CARBON BUBBLE? WHAT IS ENERGY TRANSITION? One of society s most complex and difficult problems is how to shift from a
Good afternoon, and thanks to the Energy Dialogue for your kind invitation to speak today.
 Good afternoon, and thanks to the Energy Dialogue for your kind invitation to speak today. Europe is at the forefront of a global transition to a cleaner energy economy. At the same time globally energy
Financial Statements and Supplemental Information
 2015 Financial Statements and Supplemental Information For the Fiscal Year Ended December 31, 2015 FINANCIAL SECTION TABLE OF CONTENTS Business Profile 2 Financial Summary 3 Frequently Used Terms 4 Quarterly
WORLD ENERGY INVESTMENT OUTLOOK 2014 FACTSHEET OVERVIEW
 OVERVIEW More than $1.6 trillion was invested in 2013 in energy supply, a figure that has more than doubled in real terms since 2000, and a further $130 billion to improve energy efficiency. Renewables
Financial strategy supports business plan
 Financial strategy supports business plan Ivor Ruste Executive Vice-President & Chief Financial Officer Investor Day Calgary December 7, 2011 Financial strategy supports business plan Support long-term
The Journal of Science Policy & Governance
 The Journal of Science Policy & Governance POLICY MEMO: INCREASING SUSTAINABLE BIOMASS THROUGH PRODUCTION TAX CREDITS BY Ashley Paulsworth ashley0paulsworth@gmail.com Executive Summary As various tax credits
Smarter Energy: optimizing and integrating renewable energy resources
 IBM Sales and Distribution Energy & Utilities Thought Leadership White Paper Smarter Energy: optimizing and integrating renewable energy resources Enabling industrial-scale renewable energy generation
2014 BP Madrid forum on energy & sustainability BP 2014
 14 BP Madrid forum on energy & sustainability BP 14 Contents Global energy trends Liquid fuels Refining implications European focus Energy Outlook 35 BP 14 Primary energy consumption growth slows and the
Nordea Asset Management. Our Approach on Climate Change
 Nordea Asset Management Our Approach on Climate Change Introduction Scientific fact base The Intergovernmental Panel on Climate Change (IPCC) Fifth Assessment Report concludes that Climate change and
Letter to Oil & Gas Companies from Investors
 September 9, 2013 Attention: [redacted] Letter to Oil & Gas Companies from Investors Re: Assessment of Carbon Asset Risk by [Company] Dear [redacted]: A number of publications over the last year have discussed
Communicating Your Commitment: Your Guide to Clean Energy Messaging
 Communicating Your Commitment: Your Guide to Clean Energy Messaging Congratulations on your recent purchase of clean energy from Renewable Choice! Whether you ve purchased green power in the form of renewable
International Energy Outlook 2007
 DOE/EIA-0484(2007) International Energy Outlook 2007 May 2007 Energy Information Administration Office of Integrated Analysis and Forecasting U.S. Department of Energy Washington, DC 20585 This publication
Economic Outcomes of a U.S. Carbon Tax. Executive Summary
 Economic Outcomes of a U.S. Carbon Tax Executive Summary [ Overview [ During the ongoing debate on how to address our nation s fiscal challenges, some have suggested that imposing a carbon tax would improve
Saving energy: bringing down Europe s energy prices
 Saving energy: bringing down Europe s energy prices Saving energy: bringing down Europe s energy prices By: Dr. Edith Molenbroek, Prof. Dr. Kornelis Blok Date: May 2012 Project number: BUINL12344 Ecofys
Plenary Session One. The New Geography of Energy: Business as Usual or a New Era for Energy Supply and Demand?
 Plenary Session One The New Geography of Energy: Business as Usual or a New Era for Energy Supply and Demand? 15 May 2014 Overview The pattern of global energy supply and demand that has prevailed over
Casper Wind Power Project Using Our Land Wisely
 Casper Wind Power Project Using Our Land Wisely Chevron Global Power Company The solutions are not either/or. It s not a choice between more drilling or more efficiency. It s not a choice between coal
Global Oil & Gas Suite
 IHS ENERGY Global Oil & Gas Suite Comprehensive analysis and insight on upstream opportunities, risk, infrastructure dynamics, and downstream markets Global Oil & Gas Suite Make optimal decisions about
Cutting Australia s Carbon Abatement Costs with Nuclear Power
 Cutting Australia s Carbon Abatement Costs with Nuclear Power Martin Nicholson, October 2011 Abstract The Australian Government Treasury modelling of a carbon price shows that Australia must purchase the
UNCONVENTIONAL HYDROCARBONS...
 UNCONVENTIONAL HYDROCARBONS... ... UNCONVENTIONAL THINKING RIVER OF SAND WARREGO: AN ABORIGINAL WORD MEANING RIVER OF SAND. A RIVER CLASS DESTROYER, BUILT IN SCOTLAND, AND SHIPPED TO AUSTRALIA, IN SECTIONS,
Climate Change and. Environment Position. Statement. and 2017 Action Plan. action. Statement. Action Plan. September 2014
 1 action September 2014 Westpac Group has a long-standing commitment to operating sustainably. 3 Helping future generations For us, this is about helping future generations live better lives in a healthy
Role of Natural Gas in a Sustainable Energy Future
 Role of Natural Gas in a Sustainable Energy Future Alexander Medvedev, Deputy Chairman of Gazprom Management Committee, Director General of Gazprom Export 2 nd Ministerial Gas Forum Doha, 30 November 2010
Netherlands National Energy Outlook 2014
 Netherlands National Energy Outlook 2014 Summary Michiel Hekkenberg (ECN) Martijn Verdonk (PBL) (project coordinators) February 2015 ECN-E --15-005 Netherlands National Energy Outlook 2014 Summary 2 The
Re: File Number S7-29-07 Concept Release on Possible revisions to the Disclosure Requirements relating to Oil and Gas Reserves
 Hugh L. Hooker Chief Compliance Officer, Corporate Secretary, Associate General Counsel Petro-Canada 37 th Floor, 150 6 th Avenue S.W. P.O. Box2844 Calgary, Alberta T2P 3E3 Telephone (403) 296-7778 Facsimile
CRS Report Summaries WORKING DRAFT
 CRS Report Summaries R40147 Green Buildings This is a definition and analysis of the cost and benefits of green buildings. It also cites agencies and laws that encourage the building of environmentally
March 2015 MEGATRENDS IN THE OIL AND GAS INDUSTRY
 March 2015 MEGATRENDS IN THE OIL AND GAS INDUSTRY Cautionary Statement The following presentation includes forward-looking statements. These statements relate to future events, such as anticipated revenues,
Institutional investors expectations of corporate climate risk management
 Institutional investors expectations of corporate climate risk management Institutional investors expectations of corporate climate risk management As institutional investors, we are major shareowners
Energy White Paper at a glance
 and Science Energy White Paper at a glance WWW. i Energy White Paper at a glance The Australian Government made an election commitment to deliver an Energy White Paper to give industry and consumers certainty
Statement for the Record
 Statement for the Record Kevin R. Hennessy Director Federal, State and Local Affairs New England Dominion Resources, Inc. Infrastructure Needs for Heat and Power Quadrennial Energy Review Task Force April
Announcement. Visiting Research Fellow Programme 2016
 Announcement Visiting Research Fellow Programme 2016 Objectives of the Visiting Research Fellow Programme The Visiting Research Fellow Programme (VRFP) is an innovative approach to human capacity development
Fossil Fuel Company Exposure in Representative Walden Client Portfolios
 Fossil Fuel Company Exposure in Representative Walden Client Portfolios Climate change is the world s foremost environmental challenge. As a portfolio manager who integrates environmental, social, and
Statement of Lawrence W. Kavanagh Vice President, Environment and Technology American Iron and Steel Institute Washington, D.C.
 Statement of Lawrence W. Kavanagh Vice President, Environment and Technology American Iron and Steel Institute Washington, D.C. Submitted for the Record Committee on Small Business U.S. House of Representatives
Energy BUSINESS PLAN 2015 18 ACCOUNTABILITY STATEMENT THE MINISTRY LINK TO GOVERNMENT OF ALBERTA STRATEGIC DIRECTION
 Energy BUSINESS PLAN 205 8 ACCOUNTABILITY STATEMENT This business plan was prepared under my direction, taking into consideration the government s policy decisions as of October 5, 205. original signed
310 Exam Questions. 1) Discuss the energy efficiency, and why increasing efficiency does not lower the amount of total energy consumed.
 Discuss the energy efficiency, and why increasing efficiency does not lower the amount of total energy consumed.") 310 Exam Questions 1) Discuss the energy efficiency, and why increasing efficiency does not lower the amount of total energy consumed. 2) What are the three main aspects that make an energy source sustainable?
310 Exam Questions 1) Discuss the energy efficiency, and why increasing efficiency does not lower the amount of total energy consumed. 2) What are the three main aspects that make an energy source sustainable?
Norwegian position on the proposed EU framework for climate and energy policies towards 2030
 Norwegian position on the proposed EU framework for climate and energy policies towards 2030 The EU plays an important role as a global leader in climate policy and has a fundamental interest in strengthening
Our financing of the energy sector in 2013
 Our financing of the energy sector in 213 rbs.com/sustainable About this document This report is the fourth Our financing of the energy sector briefing that we have produced since 21. The aim remains the
The Oil Market to 2030 Implications for Investment and Policy
 This article copyrighted by the International Association for Energy Economics The article first appeared in Economics of Energy & Environmental Policy (Vol. 1, No. 1). Visit this paper online at http://www.iaee.org/en/publications/eeepjournal.aspx
Energy [R]evolution vs. IEA World Energy Outlook scenario
![Energy [R]evolution vs. IEA World Energy Outlook scenario](/thumbs/35/17229912.jpg "Energy [R]evolution vs. IEA World Energy Outlook scenario") Energy [R]evolution vs. IEA World Energy Outlook scenario New set of scenarios takes climate crisis into account World Energy Outlook (WEO) 2008 for the first time takes the climate crisis really into
Energy [R]evolution vs. IEA World Energy Outlook scenario New set of scenarios takes climate crisis into account World Energy Outlook (WEO) 2008 for the first time takes the climate crisis really into
UNECE Energy Week Geneva. in Energy Security
 UNECE Energy Week Geneva Investing in Energy Security Committee on Sustainable Energy and related Meetings Wednesday 28 November 2007 Special Session: Investing in and Financing the Hydrocarbon Sector
Working Paper Research Unit Global Issues Stiftung Wissenschaft und Politik German Institute for International and Security Affairs.
 Working Paper Research Unit Global Issues Stiftung Wissenschaft und Politik German Institute for International and Security Affairs Friedemann Müller Paper presented at KAS CFIE CFISAE AHK International
The Burning Question. What would it take to. leave fuel worth trillions in the ground and is 12,000 10,000 8,000. 6,000 humanity up to it?
 The Burning Question 12,000 10,000 Global CO2 emissions (million tonnes carbon) What would it take to 8,000 leave fuel worth trillions in the ground and is 6,000 humanity up to it? 4,000 2,000 0 1850 1900
GLOBAL RENEWABLE ENERGY MARKET OUTLOOK 2013
 GLOBAL RENEWABLE ENERGY MARKET OUTLOOK 213 FACT PACK GUY TURNER HEAD OF ECONOMICS AND COMMODITIES APRIL 26, 213 GLOBAL RENEWABLE ENERGY MARKET OUTLOOK, 26 APRIL 213 1 INTRODUCTION This year s Global Renewable
Implications of Abundant Natural Gas
 Implications of Abundant Natural Gas JAE EDMONDS AND HAEWON MCJEON APRIL 2013 May 29, 2013 1 Background May 29, 2013 2 The natural gas revolution The application of technologies for accessing unconventional
ANALYSIS OF THE ADMINISTRATION S PROPOSED TAX INCENTIVES FOR ENERGY EFFICIENCY AND THE ENVIRONMENT
 June 28, 1999 ANALYSIS OF THE ADMINISTRATION S PROPOSED TAX INCENTIVES FOR ENERGY EFFICIENCY AND THE ENVIRONMENT INTRODUCTION A few months ago in the FY 2000 budget the President proposed a $3.6 billion
Resolution: Energy and climate. Year and Congress: November 2009, Barcelona. Category: Environment and Energy. Page: 1. Energy and climate change
 The European Liberal Democrat and Reform Party, convening in, Catalonia on 19th and 20th November 2009: Notes that: The EU is responsible for approximately 10 per cent of global greenhouse gas emissions
Natural Gas and LNG Fundamentals
 Natural Gas and LNG Fundamentals ExxonMobil Gas & Power Marketing Taking on the world s toughest energy challenges. This presentation includes forward-looking statements. Actual future conditions (including
Greenhouse Gas Offsets and Renewable Energy Certificates: Distinct Commodities in an Evolving Market The Climate Trust
 Greenhouse Gas Offsets and Renewable Energy Certificates: Distinct Commodities in an Evolving Market The Climate Trust Introduction The framework for future climate policy is emerging in the United States
Canada s Energy Sector in a Changing Global Market. Kristi Varangu Director, International Energy Division March 10, 2014
 Canada s Energy Sector in a Changing Global Market Kristi Varangu Director, International Energy Division March 10, 2014 2 Purpose Illustrate the profound changes that are taking place in global and North
Energy Options in a Carbon Constrained World. Martin Sevior, School of Physics, University of Melbourne http://nuclearinfo.net
 Energy Options in a Carbon Constrained World. Martin Sevior, School of Physics, University of Melbourne Energy underpins our Civilization Imagine one week without Electricity Imagine one week without Motorized
CO 2 Emissions from Electricity Generation and Imports in the Regional Greenhouse Gas Initiative: 2010 Monitoring Report
 CO 2 Emissions from Electricity Generation and Imports in the Regional Greenhouse Gas Initiative: 2010 Monitoring Report August 6, 2012 1 This report was prepared on behalf of the states participating
T a b l e. o f. C o n
 World Energy Outlo ok 2010 T a b l e PART A GLOBAL ENERGY TRENDS o f C o n te PART B OUTLOOK FOR RENEWABLE ENERGY PART C ACHIEVING THE 450 SCENARIO AFTER COPENHAGEN n t s PART D OUTLOOK FOR CASPIAN ENERGY
Oil Gas expo 2015 is comprised of 13 Main tracks and 131 sub tracks designed to offer comprehensive sessions that address current issues.
 OMICS Group cordially invites participants from all over the world to attend International Conference and Expo on Oil and Gas, scheduled during November, 16-18, 2015 at Dubai, UAE mainly focused on the
North American Natural Gas Midstream Infrastructure Through 2035: A Secure Energy Future
 North American Natural Gas Midstream Infrastructure Through 2035: A Secure Energy Future Updated Supply Demand Outlook Background Executive Summary June 28, 2011 Sufficient midstream natural gas infrastructure,
WORLD ENERGY OUTLOOK 2014 FACTSHEET How will global energy markets evolve to 2040?
 How will global energy markets evolve to 2040? In the New Policies Scenario, energy demand grows by 37% to 2040 on planned policies, an average rate of growth of 1.1%. Demand grew faster over the previous
How to Earn the LEED Green Power Credit
 3D EG REES WH ITE PAPER How to Earn the LEED Green Power Credit Using on-site and off-site renewable energy to mitigate the impact of greenhouse gas emissions associated with a LEED project s energy use
ECONOMIC OUTLOOK. Quantifying the Shale Gas Revolution s Impact on U.S. Industrial Energy Consumption MAY 2014
 MAY ECONOMIC OUTLOOK Quantifying the Shale Gas Revolution s Impact on U.S. Industrial Energy Consumption THE CARLYLE GROUP 1001 PENNSYLVANIA AVENUE, NW WASHINGTON, DC 20004-2505 202-729-5626 WWW.CARLYLE.COM
Working Paper #54. Greenhouse Gas Implications in Large Scale Infrastructure Investments in Developing Countries: Examples from China and India
 Greenhouse Gas Implications in Large Scale Infrastructure Investments in Developing Countries: Examples from China and India Mike Jackson, Sarah Joy, Thomas C. Heller, and David G. Victor Working Paper
CHEVRON REPORTS FOURTH QUARTER NET INCOME OF $3.1 BILLION, DOWN 37 PERCENT FROM $4.9 BILLION IN FOURTH QUARTER 2008
 Policy, Government and Public Affairs Chevron Corporation P.O. Box 6078 San Ramon, CA 94583-0778 www.chevron.com FOR RELEASE AT 5:30 AM PST JANUARY 29, 2010 CHEVRON REPORTS FOURTH QUARTER NET INCOME OF
Mobilizing capital towards a low-carbon economy
 Mobilizing capital towards a low-carbon economy Anthony Hobley CEO, Carbon Tracker Initiative Bruegel, Brussels 27 th April 2015 Who Are We? Identity Mission Strategy Carbon Tracker is a non profit financial
Making Coal Use Compatible with Measures to Counter Global Warming
 Making Use Compatible with Measures to Counter Global Warming The J-POWER Group is one of the biggest coal users in Japan, consuming approximately 2 million tons of coal per year at eight coal-fired power
Spectra Energy Reports First Quarter 2012 Results
 Media: Analysts: Wendy Olson (713) 627-4072 (713) 627-4747 (24-hour media line) John Arensdorf (713) 627-4600 Date: May 4, 2012 Spectra Energy Reports First Quarter 2012 Results Reported net income from
Fact Sheet on China s energy sector and Danish solutions
 Fact Sheet on China s energy sector and Danish solutions 1. EXPANSION WITH RENEWABLE ENERGY: China focuses on a massive expansion with non fossil energy that is renewable energy and nuclear energy. The
Accounting for High Carbon Intensity Crude Oils in Low Carbon Fuels Policies
 Accounting for High Carbon Intensity Crude Oils in Low Carbon Fuels Policies California Air Resources Board LCFS Advisory Panel Meeting July 1, 2011 Sacramento, CA Simon C. Mui, Ph.D. Scientist, Clean
How To Develop Hydrogen Fuel Cells
 EXECUTIVE SUMMARY 7 Executive Summary Innovation in energy technology has widespread implications for OECD economies. Although the energy sector accounts for a small share of GDP, the pervasive use of
Imperial Oil Limited 237 Fourth Avenue S.W. Calgary, Alberta T2P 3M9 imperialoil.ca
 Imperial Oil Limited 237 Fourth Avenue S.W. Calgary, Alberta T2P 3M9 imperialoil.ca Table of contents Our approach 1 About us 2 Our approach 4 Business segments 7 Outlook for energy to 2030 9 Safety 11
Long-term Vision and Medium-term Business Plan of the Osaka Gas Group
 Long-term Vision and Medium-term Business Plan of the Osaka Gas Group President Hiroshi Ozaki Field of Dreams 2020 Osaka Gas has formulated a long-term vision for the year 2020 to guide the Group s business
Third LAC Tax Policy Forum
 Third LAC Tax Policy Forum Cooperative Compliance - a business perspective Wilbert Huijbens; Tax Manager; Shell International BV Montevideo, Uruguay; DEFINITIONS AND CAUTIONARY NOTE Resources: Our use
Green Power Accounting Workshop: Concept Note For discussion during Green Power Accounting Workshop in Mexico City, May 13th 2011
 Introduction As more companies and government organizations prepare greenhouse gas (GHG) inventories that reflect the emissions directly and indirectly associated with their operations, they increasingly
Impact Investing TAILORED, TRANSPARENT SOLUTIONS
 We set the standard for Impact Investing and are the first-choice partner for asset owners seeking to understand and control their global impact. Build your impact strategy with us - see inside for details.
FORTNIGHTLY. Reliability Standards. PLUS A Role for Coal Falling Demand New York s Distributed Future
 FORTNIGHTLY PUBLIC UTILITIES Reliability Standards A fresh look at benefits, costs, and consequences. January 2015 ENERGY, MONEY, POWER PLUS A Role for Coal Falling Demand New York s Distributed Future
STEPS 2015-2018: Understanding Critical Transition Dynamics for Sustainable Transportation
 STEPS 2015-2018: Understanding Critical Transition Dynamics for Sustainable Transportation Technological innovations are transforming the energy and vehicle industries. The shale revolution is producing
Disclaimer. Energy Outlook 2030 2
 January 213 Disclaimer This presentation contains forward-looking statements, particularly those regarding global economic growth, population growth, energy consumption, policy support for renewable energies
SUSTAINABLE ENERGY BLUEPRINT
 SUSTAINABLE ENERGY BLUEPRINT A PLAUSIBLE STRATEGY FOR ACHIEVING A NO-NUCLEAR, LOW- CARBON, HIGHLY-EFFICIENT AND SUSTAINABLE ENERGY FUTURE The following statement outlines an ambitious but doable strategy
How To Plan For A New Power Plant In Manitoba
 Meeting Manitobans Electricity Manitoba is growing and is expected to continue doing so. Over the last years the province has enjoyed an expanding population and economy. These increases have led to many
ECONOMICS & COUNTRY RISK. Solution Overview for Manufacturing Companies
 ECONOMICS & COUNTRY RISK Solution Overview for Manufacturing Companies Shifting economic power and emerging risks creates uncertainty across global markets. In order to maintain a competitive advantage
Oil and Natural Gas Outlook: Implications for Alaska The Alliance Meet Alaska. Remarks by Marianne Kah Chief Economist
 Oil and Natural Gas Outlook: Implications for Alaska The Alliance Meet Alaska Remarks by Marianne Kah Chief Economist Cautionary Statement The following presentation includes forward-looking statements.
SOUTHEAST ENERGY EFFICIENCY ALLIANCE. Clean Energy Greenville, SC May 29, 2009
 SOUTHEAST ENERGY EFFICIENCY ALLIANCE Clean Energy Greenville, SC May 29, 2009 Who is SEEA? The Southeast Energy Efficiency Alliance builds regional partnerships to promote and achieve energy efficiency
Transforming America s Energy Future. Kentucky. Energy Statistics. Developed by
 Transforming America s Energy Future Kentucky Energy Statistics Developed by 2 2 Summary The first edition of Kentucky Energy Statistics is offered by the National Association for State Energy Officials
Greenhouse gas abatement potential in Israel
 Greenhouse gas abatement potential in Israel Israel s GHG abatement cost curve Translated executive summary, November 2009 1 Executive Summary Background At the December 2009 UNFCCC Conference in Copenhagen,
COMPANY UPDATE FIRST QUARTER 2016 RESULTS
 COMPANY UPDATE FIRST QUARTER 2016 RESULTS ROYAL DUTCH SHELL 4 MAY 2016 Copyright of Royal Dutch Shell plc May 4, 2016 1 SIMON HENRY CHIEF FINANCIAL OFFICER ROYAL DUTCH SHELL PLC 2 DEFINITIONS & CAUTIONARY
LNG Poised to Significantly Increase its Share of Global Gas Market David Wood February 2004 Petroleum Review p.38-39
 LNG Poised to Significantly Increase its Share of Global Gas Market David Wood February 2004 Petroleum Review p.38-39 For the past few years LNG has experienced high levels of activity and investment in
PRAXAIR, INC. Hydrogen: The Growth Story Continues. Charles Miller, Vice President Dan Yankowski, Vice President. February 9, 2005
 PRAXAIR, INC. Hydrogen: The Growth Story Continues Charles Miller, Vice President Dan Yankowski, Vice President February 9, 2005 Page 1 Deutsche Bank Houston, TX 2/9/05 Forward Looking Statements The forward-looking
Main Street. Economic information. By Jason P. Brown, Economist, and Andres Kodaka, Research Associate
 THE Main Street ECONOMIST: ECONOMIST Economic information Agricultural for the and Cornhusker Rural Analysis State S e Issue p t e m b2, e r 214 2 1 Feed de er ra al l RR e es se er rv ve e BBa an nk k
Macro-economic impact of Renewable Energy Production in Belgium. 21 October 2014
 Macro-economic impact of Renewable Energy Production in Belgium 21 October 2014 Context and objectives of the study Renewable energy deployment among key solutions for meeting energy challenges to be addressed
Oil, Natural Gas and YOUR FUTURE
 Oil, Natural Gas and YOUR FUTURE In the uncomfortably near future, the costs of oil and gas will not be measured in just dollars and cents. It will also be measured in the changes to our quality of life,
SaskPower CCS Global Consortium Bringing Boundary Dam to the World. Mike Monea, President Carbon Capture and Storage Initiatives
 SaskPower CCS Global Consortium Bringing Boundary Dam to the World Mike Monea, President Carbon Capture and Storage Initiatives 1 Purpose of Today A. CCS around the world B. What SaskPower is doing C.
Residential & Commercial Sectors Overview CLIMATE
 CLIMATE TECHBOOK Residential and Commercial Emissions in the United States Greenhouse gas (GHG) emissions data can be reported either by economic sector, which includes electric power generation as a separate
Effect of Increased Natural Gas Exports on Domestic Energy Markets
 Effect of Increased Natural Gas Exports on Domestic Energy Markets as requested by the Office of Fossil Energy January 2012 This report was prepared by the U.S. Energy Information Administration (EIA),
Public Comment to EPA on New Stationary Sources Rule Sam Batkins and Catrina Rorke Docket ID No. EPA-HQ-OAR-2013-0495 May 9, 2014
 Public Comment to EPA on New Stationary Sources Rule Sam Batkins and Catrina Rorke Docket ID No. EPA-HQ-OAR-2013-0495 May 9, 2014 Introduction We appreciate the opportunity to comment on the Environmental