How To Merge Multiple Reports In Jonas With Excel
|
|
|
- Justin Rose
- 3 years ago
- Views:
Transcription
1 New Report Tool Across Modules 12.1

2 Detailed Agenda History of Reporting in Jonas Merging Multiple Reports Using the Power of Excel Report Samples Simple Dashboard - Technician Hours and Work Order Productivity Information from other Sources - Cash Flow Information from multiple sources in Jonas - Customer Revenue/Cost Analysis

3 History of Reporting in Jonas How did we get here? Over the years people have been looking for more sophisticated ways of getting information out of their software. Jonas has responded by creating alternate ways of getting data out. Canned Reports with options to Print/View Report Generators in various modules to allow clients to choose what they want and how they want to see it Smartviewer Sending data to Excel Why Excel? This is a product that people use every day. It has built in calculation functions and Microsoft spends Billions of dollars enhancing it. Why try to write our own spreadsheet. Clients understand how to use Simple to update from Jonas Easy to build Pivot Tables and Charts Complex Calculations ability Cross Tab and Spreadsheet Integrations Ability to pull from any data source thus allowing reporting not only across Jonas modules but also across entire Client infrastructure.

4 Merging Multiple Reports Why would we want to do this? There are multiple reasons why a client would need information from more than one source. The report requires data from more than one module in Jonas There is some information that cannot be in Jonas and you want to use some Jonas data to help make some decisions You want to build a Dashboard for users that do not have access to Jonas or users you DO NOT want to have access to Jonas Using Silent Partner would automate the creation of these reports to allow them to be readily available when needed. How to do this in Jonas? 1. Setup Excel Spreadsheet in the desired location 2. Setup Reports in Jonas for the information you need 3. Add other information to excel manually or pull from other data sources if you are trying to create a report where all the data would not come from Jonas 4. Modify spreadsheet to get the desired results a. Merge tabs b. Create Pivot Report c. Create Graphs 5. Choose how you will update the spreadsheet a. Run ad-hoc from Jonas as required b. Setup a Silent Partner Schedule to update Jonas data

5 Using the Power of Excel Manipulating Data in Excel? Moving data from one cell to another Simple Calculations


6 Complex Calculations such as SUMIF Allow subtotaling of data Macros Allows You to record steps to run Use VBA Code for complex calculations Example of a Simple Macro to merge worksheets Found example through Google and Excel Help


7 Pivot Tables and Charts? 1. Select the table you wish to use 2. Click on Insert and choose Pivot Table or Pivot Chart 3. Choose Where you want the table to be 4. Select the Rows, Columns and any item you want to calculate on.


8 Report Samples Simple Dashboard- Technician Hours and Work Order Productivity Technician Hours Work Order Productivity


9 Excel Dashboard Information from Jonas and other sources Three Month Cash Flow Accounts Payable Aging Report Accounts Receivable Aging Report

10 Other Information Needed Bank Balance as of beginning period Potential Purchases/Deposits over the next 3 months Result in Excel Based on a 60 day pay, 60 day receive scenario in this example A/R and A/P come from Jonas Bank balance may be derived from Jonas but is typed in Asset Purchases and Other Deposits are just forecasts


11 Information from multiple sources in Jonas - Customer Revenue/Cost Analysis Job Cost Costs/Billings

12 Work Order Costs/Billings Results in Excel
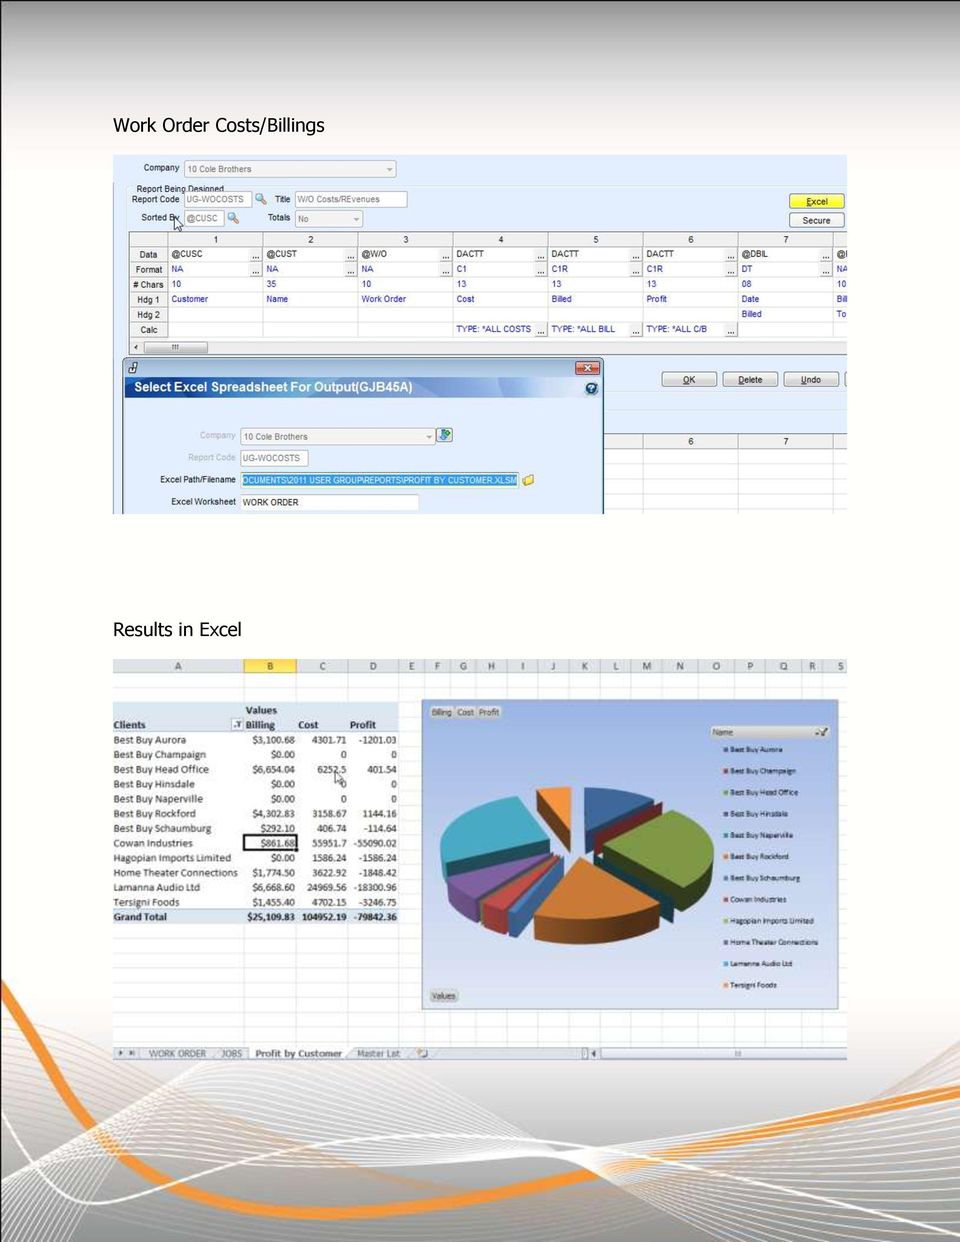
13 Clicking on values in Pivot Table will give you drill down capability on details Customer Name Work Cost Billed Profit BESTBUYR Best Buy Rockford W BESTBUYR Best Buy Rockford BESTBUYR Best Buy Rockford BESTBUYR Best Buy Rockford BESTBUYR Best Buy Rockford BESTBUYR Best Buy Rockford BESTBUYR Best Buy Rockford BESTBUYR Best Buy Rockford BESTBUYR Best Buy Rockford BESTBUYR Best Buy Rockford BESTBUYR Best Buy Rockford BESTBUYR Best Buy Rockford BESTBUYR Best Buy Rockford BESTBUYR Best Buy Rockford BESTBUYR Best Buy Rockford BESTBUYR Best Buy Rockford BESTBUYR Best Buy Rockford

Computer Skills: Levels of Proficiency
 Computer Skills: Levels of Proficiency September 2011 Computer Skills: Levels of Proficiency Because of the continually increasing use of computers in our daily communications and work, the knowledge of
New Report Tool Across Modules 12.2
 New Report Tool Across Modules 12.2 Detailed Agenda Future of Reporting in Jonas DataMart and SQL Reporting Tools Report Samples DataMart and Jonas Reports to Excel Cash Flow Dashboard - Job Cost Detailed
How To Create A Report In Excel
 Table of Contents Overview... 1 Smartlists with Export Solutions... 2 Smartlist Builder/Excel Reporter... 3 Analysis Cubes... 4 MS Query... 7 SQL Reporting Services... 10 MS Dynamics GP Report Templates...
Microsoft Courses. Microsoft Office 2007
 Microsoft Courses Course Overview With over 90% of UK businesses using Microsoft Office, it's the world's leading software package. Our Microsoft Office course will show you how to operate the three main
Sage PFW ERP Intelligence
 Sage PFW ERP Intelligence Sage PFW ERP Intelligence Standard Reports Get 6 ready-to-use reports that give you immediate insight into and across your business. Delivered in the familiar environment of Microsoft
Intelligence Reporting Standard Reports
 Intelligence Reporting Standard Reports Sage 100 ERP (formerly Sage ERP MAS 90 and 200) Intelligence Reporting empowers you to quickly and easily gain control and obtain the information you need from across
Basic Pivot Tables. To begin your pivot table, choose Data, Pivot Table and Pivot Chart Report. 1 of 18
 Basic Pivot Tables Pivot tables summarize data in a quick and easy way. In your job, you could use pivot tables to summarize actual expenses by fund type by object or total amounts. Make sure you do not
SMB Intelligence. Budget Planning
 SMB Intelligence Budget Planning Introduction As an Excel-based data entry tool with a flexible SQL Server database and a powerful companion report writer (SMB Intelligence Reporting), SMB Intelligence
Working with Spreadsheets
 osborne books Working with Spreadsheets UPDATE SUPPLEMENT 2015 The AAT has recently updated its Study and Assessment Guide for the Spreadsheet Software Unit with some minor additions and clarifications.
How To Create A Business Benefit Dashboard Analysis Report In Microsoft Excel
 Get 8 ready-to-use reports that give you immediate insight into and across your business. Delivered in the familiar environment of Microsoft Excel, the reports are fully customizable, and flexible with
Pastel Accounting Business Intelligence Centre
 Get 8 ready-to-use reports that give you immediate insight into and across your business. Delivered in the familiar environment of Microsoft Excel, the reports are fully customisable, and flexible with
As in the example above, a Budget created on the computer typically has:
 Activity Card Create a How will you ensure that your expenses do not exceed what you planned to invest or spend? You can create a budget to plan your expenditures and earnings. As a family, you can plan
Word 2010: Mail Merge to Email with Attachments
 Word 2010: Mail Merge to Email with Attachments Table of Contents TO SEE THE SECTION FOR MACROS, YOU MUST TURN ON THE DEVELOPER TAB:... 2 SET REFERENCE IN VISUAL BASIC:... 2 CREATE THE MACRO TO USE WITHIN
Tommy B. Harrington 104 Azalea Drive Greenville, NC 27858 Email: tommy@tommyharrington.com
 M o s t U s e f u l E x c e l C o m m a n d s Tommy B. Harrington 104 Azalea Drive Greenville, NC 27858 Email: tommy@tommyharrington.com Computer Training YOU Can Understand! Most Useful Excel Commands
PLANNING (BUDGETING)
") Accounting & Information Management System PLANNING (BUDGETING) Table of Contents AIMS/SAP Planning I. Periods/Versions/Profiles Fiscal Periods/Years... I-1 Plan Versions... I-1 Plan Profiles... I-2 II.
Accounting & Information Management System PLANNING (BUDGETING) Table of Contents AIMS/SAP Planning I. Periods/Versions/Profiles Fiscal Periods/Years... I-1 Plan Versions... I-1 Plan Profiles... I-2 II.
Overview of sharing and collaborating on Excel data
 Overview of sharing and collaborating on Excel data There are many ways to share, analyze, and communicate business information and data in Microsoft Excel. The way that you choose to share data depends
To reuse a template that you ve recently used, click Recent Templates, click the template that you want, and then click Create.
 What is Excel? Applies to: Excel 2010 Excel is a spreadsheet program in the Microsoft Office system. You can use Excel to create and format workbooks (a collection of spreadsheets) in order to analyze
CREATING FORMAL REPORT. using MICROSOFT WORD. and EXCEL
 CREATING a FORMAL REPORT using MICROSOFT WORD and EXCEL TABLE OF CONTENTS TABLE OF CONTENTS... 2 1 INTRODUCTION... 4 1.1 Aim... 4 1.2 Authorisation... 4 1.3 Sources of Information... 4 2 FINDINGS... 4
Abila MIP Fund Accounting
 Abila MIP Fund Accounting Module Overview Award-winning Abila MIP Fund Accounting (formerly Sage 100 Fund Accounting) is the financial management solution preferred by nonprofit and government organizations
How to Use the Cash Flow Template
 How to Use the Cash Flow Template When you fill in your cash flow you are trying to predict the timing of cash in and out of your bank account to show the affect and timing for each transaction when it
Reporting and Analysis Using Vivid Reports Flex
 Reporting and Analysis Using Vivid Reports Flex Presented By: Jim Lee Table of Contents Introduction... 3 Simplify... 3 Gain Insight... 3 Build Smarter... 3 Vivid Reports Flex... 4 Getting Started... 4
Search help. More on Office.com: images templates. Here are some basic tasks that you can do in Microsoft Excel 2010.
 Page 1 of 8 Excel 2010 Home > Excel 2010 Help and How-to > Getting started with Excel Search help More on Office.com: images templates Basic tasks in Excel 2010 Here are some basic tasks that you can do
How to Excel with CUFS Part 2 Excel 2010
 How to Excel with CUFS Part 2 Excel 2010 Course Manual Finance Training Contents 1. Working with multiple worksheets 1.1 Inserting new worksheets 3 1.2 Deleting sheets 3 1.3 Moving and copying Excel worksheets
Spreadsheet - Introduction
 CSCA0102 IT and Business Applications Chapter 6 Spreadsheet - Introduction Spreadsheet A spreadsheet (or spreadsheet program) is software that permits numerical data to be used and to perform automatic
NEXT-ANALYTICS lets you specify more than one profile View in a single query.
 NEXT-ANALYTICS lets you specify more than one profile View in a single query. For historical reasons, NEXT-ANALYTICS often uses the word Profile to refer to Google Analytics Views. Summary. Choose multiple
Oregon State Bar Software Standards 2005. Software Proficiency Expectations (Items in bold are to be demonstrated)
") Oregon State Bar Software Standards 2005 Computer Basics (all users) Software Proficiency Expectations (Items in bold are to be demonstrated) Touch typing (at least 25 words per minute). Starting, shutting
Oregon State Bar Software Standards 2005 Computer Basics (all users) Software Proficiency Expectations (Items in bold are to be demonstrated) Touch typing (at least 25 words per minute). Starting, shutting
Chapter Quarterly Financial Report Instructions (Quarterly Format)
") Chapter Quarterly Financial Report Instructions (Quarterly Format) Chapters are expected to maintain 100% compliance with reporting requirements to National. This is important because chapters are organized
Chapter Quarterly Financial Report Instructions (Quarterly Format) Chapters are expected to maintain 100% compliance with reporting requirements to National. This is important because chapters are organized
Instructions for E-PLAN Financial Planning Template
 Instructions for E-PLAN Financial Planning Template The EPLAN template will assist you in preparing financial projections for your existing business. The template uses Microsoft Excel to prepare your projected
SMB Intelligence. Reporting
 SMB Intelligence Reporting Introduction Microsoft Excel is one of the most popular business tools for data analysis and light accounting functions. The SMB Intelligence Reporting powered by Solver is designed
ProClarity Analyst Training
 ProClarity Analyst Training 50001: ProClarity Analyst Training (5 Days) About this Course This five-day instructor-led course provides students with the knowledge and skills to expand the capabilities
Microsoft Excel Training - Course Topic Selections
 Microsoft Excel Training - Course Topic Selections The Basics Creating a New Workbook Navigating in Excel Moving the Cell Pointer Using Excel Menus Using Excel Toolbars: Hiding, Displaying, and Moving
Additional information >>> HERE <<< Calendars and Calculators by Spreadsheet123 - Scam or Work?
 Additional information >>> HERE
MicroStrategy Desktop
 MicroStrategy Desktop Quick Start Guide MicroStrategy Desktop is designed to enable business professionals like you to explore data, simply and without needing direct support from IT. 1 Import data from
By: Peter K. Mulwa MSc (UoN), PGDE (KU), BSc (KU) Email: Peter.kyalo@uonbi.ac.ke
, PGDE (KU), BSc (KU) Email: Peter.kyalo@uonbi.ac.ke") SPREADSHEETS FOR MARKETING & SALES TRACKING - DATA ANALYSIS TOOLS USING MS EXCEL By: Peter K. Mulwa MSc (UoN), PGDE (KU), BSc (KU) Email: Peter.kyalo@uonbi.ac.ke Objectives By the end of the session, participants
SPREADSHEETS FOR MARKETING & SALES TRACKING - DATA ANALYSIS TOOLS USING MS EXCEL By: Peter K. Mulwa MSc (UoN), PGDE (KU), BSc (KU) Email: Peter.kyalo@uonbi.ac.ke Objectives By the end of the session, participants
Mail Merge. Course Description. Objectives: Design a Main Document. Design a Data Source. Directories. Merge the Main Document with the Data
 Mail Merge Course Description The Mail Merge feature allows you to combine items from a data source into a document. This allows you to create form letters, mailing labels, envelopes, etc. You also have
Streamlining Reports: A Look into Ad Hoc and Standardized Processes James Jenson, US Bancorp, Saint Paul, MN
 Working Paper 138-2010 Streamlining Reports: A Look into Ad Hoc and Standardized Processes James Jenson, US Bancorp, Saint Paul, MN Abstract: This paper provides a conceptual framework for quantitative
Microsoft Office 2010: Access 2010, Excel 2010, Lync 2010 learning assets
 Microsoft Office 2010: Access 2010, Excel 2010, Lync 2010 learning assets Simply type the id# in the search mechanism of ACS Skills Online to access the learning assets outlined below. Titles Microsoft
Sage Intelligence Report Designer Add-In
 Sage Intelligence Report Designer Add-In Q: What is Sage Intelligence Reporting? A: Sage Intelligence Reporting helps you to easily control, automate and analyze your data to make better informed decision,
Basic Microsoft Excel 2007
 Basic Microsoft Excel 2007 The biggest difference between Excel 2007 and its predecessors is the new layout. All of the old functions are still there (with some new additions), but they are now located
EUROPEAN COMPUTER DRIVING LICENCE. Module AM4, Spreadsheets, Advanced - Level
 EUROPEAN COMPUTER DRIVING LICENCE Module AM4, Spreadsheets, Advanced - Level Copyright ª 2001 The ECDL Foundation Ltd. All rights reserved. No part of this publication may be reproduced in any form except
Pastel Evolution Business Intelligence Centre
 Get 12 ready-to-use reports that give you immediate insight into and across your business. Delivered in the familiar environment of Microsoft Excel, the reports are fully customisable, and flexible with
3 What s New in Excel 2007
 3 What s New in Excel 2007 3.1 Overview of Excel 2007 Microsoft Office Excel 2007 is a spreadsheet program that enables you to enter, manipulate, calculate, and chart data. An Excel file is referred to
MS Excel. Handout: Level 2. elearning Department. Copyright 2016 CMS e-learning Department. All Rights Reserved. Page 1 of 11
 MS Excel Handout: Level 2 elearning Department 2016 Page 1 of 11 Contents Excel Environment:... 3 To create a new blank workbook:...3 To insert text:...4 Cell addresses:...4 To save the workbook:... 5
Microsoft Office Series
 Microsoft Office Series Microsoft Office is the office suite of desktop applications delivering the tools and services to get work done. Our Microsoft Office Quickcert offerings allow your key individuals
(KPIs) featuring a nancial analysis and Top 5
 featuring a nancial analysis and Top 5") Sage ERP Accpac Sage ERP Accpac Intelligence Standard Reports Sage ERP Accpac Intelligence empowers you to quickly and easily gain control and obtain the information you need from across your business.
Sage ERP Accpac Sage ERP Accpac Intelligence Standard Reports Sage ERP Accpac Intelligence empowers you to quickly and easily gain control and obtain the information you need from across your business.
CREATING EXCEL PIVOT TABLES AND PIVOT CHARTS FOR LIBRARY QUESTIONNAIRE RESULTS
 CREATING EXCEL PIVOT TABLES AND PIVOT CHARTS FOR LIBRARY QUESTIONNAIRE RESULTS An Excel Pivot Table is an interactive table that summarizes large amounts of data. It allows the user to view and manipulate
In search of Excellence Series Research - Study Material No. 18
 ACHIEVING EXCELLENCE IN AUDIT AND ACCOUNTS THROUGH DEVELOPING, IMPARTING, PRACTICING AND UPGRADING SKILLS AND COMPETENCES In search of Excellence Series Research - Study Material No. 18 Preface In Search
Accounts Receivable: Importing Remittance Data
 Updated December 2015 Contents...3 Getting Started...3 Configuring the Excel Spreadsheet...3 Importing the Data...5 2015 ECi Software Solutions, Inc. This feature lets you import check remittance information
CHAPTER 11: SALES REPORTING
 Chapter 11: Sales Reporting CHAPTER 11: SALES REPORTING Objectives Introduction The objectives are: Understand the tools you use to evaluate sales data. Use default sales productivity reports to review
How to use MS Excel to regenerate a report from the Report Editor
 How to use MS Excel to regenerate a report from the Report Editor Summary This article describes how to create COMPASS reports with Microsoft Excel. When completed, Excel worksheets and/or charts are available
Project Statistics Dashboard Users Guide
 Project Statistics Dashboard Users Guide Page 1 of 5 Project Statistics Dashboard Analyzing Projects The Project Statistics Dashboard provides an interactive view of projects at various stages of development.
Creating Pivot Tables
 Creating Pivot Tables Example Using CIA Inspection Information This is a step by step guide of how to create pivot tables using Microsoft Excel. You can create a pivot tables from any database you have
Sage 200 Business Intelligence Datasheet
 Sage 200 Datasheet provides you with full business wide analytics to enable you to make fast, informed desicions, complete with management dashboards. It helps you to embrace strategic planning for business
PivotTable and PivotChart Reports, & Macros in Microsoft Excel
 PivotTable and PivotChart Reports, & Macros in Microsoft Excel Theresa A Scott, MS Biostatistician III Department of Biostatistics Vanderbilt University theresa.scott@vanderbilt.edu Table of Contents 1
Moving Data Between Access and Excel
 Moving Data Between Access and Excel This document provides basic techniques for exchanging data between Microsoft Access and Excel. Transferring from Excel to Access To bring data into Access from Excel,
Accounts Receivable Reconciliation Instructions. Using Reconciliation Template in Excel
 Accounts Receivable Reconciliation Instructions Using Reconciliation Template in Excel 1 Log in to E-Print and print out the report called "FBM092_DelTo" for the month which you are reconciling 2 In the
What is the difference between simple and compound interest and does it really matter?
 Module gtf1 Simple Versus Compound Interest What is the difference between simple and compound interest and does it really matter? There are various methods for computing interest. Do you know what the
Microsoft Office Word 2010: Level 1
 Microsoft Office Word 2010: Level 1 Workshop Objectives: In this workshop, you will learn fundamental Word 2010 skills. You will start by getting acquainted with the Word user interface, creating a new
SAP BW - Excel Pivot Chart and Pivot Table report (Excel)
") SAP BW - Excel Pivot Chart and Pivot Table report (Excel) Applies to: SAP BI Consultants. For more information, visit the EDW HomePage. Summary Document explains to create Excel Pivot Chart and Pivot Table
SAP BW - Excel Pivot Chart and Pivot Table report (Excel) Applies to: SAP BI Consultants. For more information, visit the EDW HomePage. Summary Document explains to create Excel Pivot Chart and Pivot Table
Overview What is a PivotTable? Benefits
 Overview What is a PivotTable? Benefits Create a PivotTable Select Row & Column labels & Values Filtering & Sorting Calculations Data Details Refresh Data Design options Create a PivotChart Slicers Charts
EXCEL EXERCISE #8: Consolidating and Linking Spreadsheets
 EXCEL EXERCISE #: Consolidating and Linking Spreadsheets. Enter the following information onto Sheet. Double click on the tab for the worksheet and rename it: East. (It represents sales in $000.) 0 Record
Excel 2003 Tutorials - Video File Attributes
 Using Excel Files 18.00 2.73 The Excel Environment 3.20 0.14 Opening Microsoft Excel 2.00 0.12 Opening a new workbook 1.40 0.26 Opening an existing workbook 1.50 0.37 Save a workbook 1.40 0.28 Copy a workbook
Excel 2010: Create your first spreadsheet
 Excel 2010: Create your first spreadsheet Goals: After completing this course you will be able to: Create a new spreadsheet. Add, subtract, multiply, and divide in a spreadsheet. Enter and format column
Creating and Using Automated Dashboards for Teachers. June 10, 2014
 Creating and Using Automated Dashboards for Teachers June 10, 2014 Agenda Introduction to Dashboards Automation Process Demonstration 4 steps: 1. Design a dashboard 2. Create Word Template with Bookmarks
HOW TO COLLECT AND USE DATA IN EXCEL. Brendon Riggs Texas Juvenile Probation Commission Data Coordinators Conference 2008
 HOW TO COLLECT AND USE DATA IN EXCEL Brendon Riggs Texas Juvenile Probation Commission Data Coordinators Conference 2008 Goals To be able to gather and organize information in Excel To be able to perform
Data Analysis with Microsoft Excel 2003
 Data Analysis with Microsoft Excel 2003 Working with Lists: Microsoft Excel is an excellent tool to manage and manipulate lists. With the information you have in a list, you can sort and display data that
Advanced Excel Charts : Tables : Pivots : Macros
 Advanced Excel Charts : Tables : Pivots : Macros Charts In Excel, charts are a great way to visualize your data. However, it is always good to remember some charts are not meant to display particular types
How to Create a Data Table in Excel 2010
 How to Create a Data Table in Excel 2010 Introduction Nicole Bernstein Excel 2010 is a useful tool for data analysis and calculations. Most college students are familiar with the basic functions of this
Intermediate. Microsoft Excel 2007- Tables and Printing
 John W. Jacobs Technology Center 450 Exton Square Parkway Exton, PA 19341 610.280.2666 ccljtc@ccls.org www.ccls.org Facebook.com/ChesterCountyLibrary Intermediate Microsoft Excel 2007- Tables and Printing
How To Write A Powerpoint Report On An Orgwin Database On A Microsoft Powerpoint 2.5 (Pg2) Or Gpl (Pg3) On A Pc Or Macintosh (Pg4) On An Ubuntu 2.2
 Or Gpl (Pg3) On A Pc Or Macintosh (Pg4) On An Ubuntu 2.2") SQL Excel Report Library Setup and Utilization Table of Contents Introduction... 3 Exporting Data to SQL... 3 Downloading the SQL Reports... 5 SQL Settings Configuration... 6 Site Options Configuration:...
SQL Excel Report Library Setup and Utilization Table of Contents Introduction... 3 Exporting Data to SQL... 3 Downloading the SQL Reports... 5 SQL Settings Configuration... 6 Site Options Configuration:...
Data Dashboards Using Excel and MS Word. Dr. Rosemarie O Conner Gabriel Hartmann
 Data Dashboards Using Excel and MS Word Dr. Rosemarie O Conner Gabriel Hartmann Agenda Introduction to Dashboards Automation Process Demonstration 4 steps: 1. Design a dashboard 2. Create Word Template
Microsoft Office Topics per Course
 Microsoft Office Topics per Course This document contains: List of courses Details of what is covered in each course Registration links Please review prerequisites and topics before registering. MS Office
Getting Started with Access 2007
 Getting Started with Access 2007 1 A database is an organized collection of information about a subject. Examples of databases include an address book, the telephone book, or a filing cabinet full of documents
Desktop Computing in Skillport Finding Approved Folders and Printing Certificates of Completion
 Desktop Computing in Skillport Finding Approved Folders and Printing Certificates of Completion 1. Log in to Skillport http://e-learningcenter.skillport.com/skillportfe/login.action 2. Click on the CATALOG
Microsoft Excel 2010 Training. Use Excel tables to manage information
 Microsoft Excel 2010 Training Use Excel tables to manage information Overview: Help with data management In this course, you ll learn how to manage information by using tables in Excel. Tables make it
CHAPTER 6: ANALYZE MICROSOFT DYNAMICS NAV 5.0 DATA IN MICROSOFT EXCEL
 Chapter 6: Analyze Microsoft Dynamics NAV 5.0 Data in Microsoft Excel CHAPTER 6: ANALYZE MICROSOFT DYNAMICS NAV 5.0 DATA IN MICROSOFT EXCEL Objectives The objectives are: Explain the process of exporting
Together we can build something great
 Together we can build something great Financial Reports, Ad Hoc Reporting and BI Tools Joanna Broszeit and Dawn Stenbol Education Track Boston Room Monday, May 2nd 2:40 pm Reporting Options with NAV ERP
Provider Data Extract Reports
 Provider Data Extract Reports 510 Admission/Discharges... 2 511 CSI Data... 3 512 Demographic Information Report... 4 513 Service Information Report... 5 How to export from Avatar to an excel spreadsheet:...
ODBC (Open Database Connectivity) for MS-Excel Microsoft OLE DB Provider for ODBC Drivers (Legitronic v3.6.2 & Later)
 for MS-Excel Microsoft OLE DB Provider for ODBC Drivers (Legitronic v3.6.2 & Later)") ODBC (Open Database Connectivity) for MS-Excel Microsoft OLE DB Provider for ODBC Drivers (Legitronic v3.6.2 & Later) Open Database Connectivity (ODBC) is a standard or open application-programming interface
ODBC (Open Database Connectivity) for MS-Excel Microsoft OLE DB Provider for ODBC Drivers (Legitronic v3.6.2 & Later) Open Database Connectivity (ODBC) is a standard or open application-programming interface
MODULE 7: FINANCIAL REPORTING AND ANALYSIS
 MODULE 7: FINANCIAL REPORTING AND ANALYSIS Module Overview Businesses running ERP systems capture lots of data through daily activity. This data, which reflects such things as the organization's sales
The following provides information on using some of the new/enhanced functionality in Excel 2013.
 Excel 2013 Tips & Tricks The following provides information on using various features and functionality in Microsoft Excel 2013 and some of the difference between the 2010 version and the 2013 version.
APPLYING BENFORD'S LAW This PDF contains step-by-step instructions on how to apply Benford's law using Microsoft Excel, which is commonly used by
 APPLYING BENFORD'S LAW This PDF contains step-by-step instructions on how to apply Benford's law using Microsoft Excel, which is commonly used by internal auditors around the world in their day-to-day
Acceptum Business Software Examples Index
 1 Acceptum Business Software Examples Index 1. A New Company 2 2. Accounts Information 6 3. Trial Balance and Financial Reports 11 4. Projects/Job Costing 15 5. Sales Orders and Customer Payments 22 6.
Creating Pivot Tables and Diagrams with Microsoft Excel, Visio and SQL Server 2008
 Creating Pivot Tables and Diagrams with Microsoft Excel, Visio and SQL Server 2008 CIS 3730 Designing and Managing Data J.G. Zheng Fall 2010 1 Overview Using Excel 2007 to created a pivot table and chart
EXCEL Tutorial: How to use EXCEL for Graphs and Calculations.
 EXCEL Tutorial: How to use EXCEL for Graphs and Calculations. Excel is powerful tool and can make your life easier if you are proficient in using it. You will need to use Excel to complete most of your
Computer Skills Microsoft Excel Creating Pie & Column Charts
 Computer Skills Microsoft Excel Creating Pie & Column Charts In this exercise, we will learn how to display data using a pie chart and a column chart, color-code the charts, and label the charts. Part
Using Microsoft Excel to Manage and Analyze Data: Some Tips
 Using Microsoft Excel to Manage and Analyze Data: Some Tips Larger, complex data management may require specialized and/or customized database software, and larger or more complex analyses may require
Mail Merge Creating Mailing Labels 3/23/2011
 Creating Mailing Labels in Microsoft Word Address data in a Microsoft Excel file can be turned into mailing labels in Microsoft Word through a mail merge process. First, obtain or create an Excel spreadsheet
DESKTOP PRODUCTIVITY SOFTWARE
 USING WINDOWS 8 UNIT 1: INTRODUCTION TO COMPUTERS Topic A: Overview of computers Topic B: How computers work Topic C: Starting the computer UNIT 2: INPUT DEVICES Topic A: Mouse and keyboard basics Topic
Excel: Analyze PowerSchool Data
 Excel: Analyze PowerSchool Data Trainer Name Trainer/Consultant PowerSchool University 2012 Agenda Welcome & Introductions Organizing Data with PivotTables Displaying Data with Charts Creating Dashboards
Financial Modeling using Microsoft Excel
 Module 1A: Valuation modeling Part 1 Introduction to valuation modeling Understanding integrated financial models - Basic valuation techniques: accounting-based, market-based and cash-flow based - Revenue
MODULE 2: SMARTLIST, REPORTS AND INQUIRIES
 MODULE 2: SMARTLIST, REPORTS AND INQUIRIES Module Overview SmartLists are used to access accounting data. Information, such as customer and vendor records can be accessed from key tables. The SmartList
EUROPEAN COMPUTER DRIVING LICENCE / INTERNATIONAL COMPUTER DRIVING LICENCE ADVANCED SPREADSHEETS
 EUROPEAN COMPUTER DRIVING LICENCE / INTERNATIONAL COMPUTER DRIVING LICENCE ADVANCED SPREADSHEETS The European Computer Driving Licence Foundation Ltd. Portview House Thorncastle Street Dublin 4 Ireland
Computer Training Centre University College Cork. Excel 2013 The Quick Analysis Tool
 Computer Training Centre University College Cork Excel 2013 The Quick Analysis Tool Quick Analysis Tool The quick analysis tool is new to Excel 2013. This tool enables the user to quickly access features
Word Processing Features. Creating Tables. Steps to Create a Table. Word Processing Features PowerPoint Handout 3.A.1
 Word Processing Features PROFITT Curriculum Basic Computer Skills Module 3 Introduction to Microsoft Word Adapted from CTAERN Curriculum Creating Tables Table an arrangement of text or numbers in rows
Microsoft Office 2007
 Microsoft Office 2007 Getting Started With Excel 2007 Anjal Smidt Computing Services Table of Contents PRELUDE TO EXCEL 2007... 3 NEW FILE FORMAT AND EXTENSIONS... 3 WORKING WITH DIFFERENT VERSIONS OF
Quantrix & Excel: 3 Key Differences A QUANTRIX WHITE PAPER
 Quantrix & Excel: 3 Key Differences A QUANTRIX WHITE PAPER Abstract This whitepaper is designed to educate spreadsheet users about three key conceptual and practical differences between Quantrix Modeler
Quick Cash Flow Projections
 Quick Cash Flow Projections The Quick Cash Flow Projections tool assists farm operators in projecting cash needs, farm profitability, and debt servicing capabilities. The program also aids users in performing
Using Excel for your assignments
 [Type here] Using Excel for your assignments This document covers the basics of using Excel to perform simple data analysis and represent that data visually. Excel is a very powerful data analysis tool.
Tips and Tricks for Printing an Excel Spreadsheet
 Tips and Tricks for Printing an Excel Spreadsheet Microsoft Excel provides the following ways to view your spreadsheet and adjust how it will look printed: Normal view This is the default view and is best