A Message From Governor Quinn
|
|
|
- Abraham Ira Webster
- 10 years ago
- Views:
Transcription
1 A Message From Governor Quinn Pat Quinn, Governor Greetings, As Governor of the State of Illinois, I am committed to making Illinois roads safer. The 2012 Illinois Crash Facts & Statistics presents crash data to help the traveling public make better decisions while on Illinois roadways and also provides information about legislative actions affecting travel in Illinois. As you will note, motor vehicle crashes and non-fatal injuries both have continued to decline. Meanwhile, fatal injuries are down from the most recent five-year average and have remained under 1,000 for the fourth consecutive year. This is a true testament to our motor vehicle safety programs and the motoring public s diligence in safe driving. Distracted driving continues to be a contributory cause of many motor vehicle crashes in Illinois. This year, in addition to laws prohibiting cell phone use in construction or maintenance speed zones, I have signed new legislation that will ban the use of all hand-held cell phones and texting devices while driving, beginning Jan. 1, Motorists can use cell phones in voice-operated mode, which includes the use of a headset or cell phones used with single button activation. I also signed legislation making texting or using a cell phone while driving a commercial motor vehicle a serious traffic violation. We all share a responsibility in making travel on Illinois roadways safe. Always wear your safety belt whether you are a driver or a passenger, make sure children are secured in properly installed safety seats, never drive while impaired or distracted, and always be aware of your surroundings and the need to drive safely at all times. We appreciate you traveling in Illinois, and I hope you will always make your primary goal while driving to arrive at your destination safely. Sincerely, Pat Quinn Governor

2 Welcome to Crash Facts for 2012, At the Illinois Department of Transportation, our mission is to provide safe, cost-effective transportation that enhances the quality of life, promotes economic prosperity and demonstrates respect for our environment. Among the many guiding principles that aid us in accomplishing this mission, safety is paramount. Click It or Ticket, Driver Sober or Get Pulled Over, Don t Text and Drive, Start Seeing Motorcycles and Operation Teen Safe Driving, are a few of our program slogans that help educate drivers and remind them of the importance of safety on Illinois roadways. With more than 140,000 miles of roads and streets in Illinois, along with the fifth busiest interstate system in the nation, improved safe-driving habits are increasingly important in keeping us safe. A Message From Secretary Schneider In 2012, a total of 956 fatalities resulted from motor vehicle crashes on Illinois public roadways. This total is down from the most recent five-year average, and 2012 marked the fourth consecutive year with traffic-related fatalities below 1,000. Meanwhile, reportable crashes and injuries due to crashes continued to decline. This publication 2012 Illinois Crash Facts & Statistics summarizes Illinois traffic safety experience and provides information pertaining to safety programs and key events in the state s history of traffic-safety related legislation. Ann L. Schneider, Secretary Whether you travel by motorized vehicle, bicycle or are just out for a walk, please be mindful of your surroundings, utilize available safety equipment, avoid distractions and be responsible. Working together, we can make Illinois a safer place to travel. Sincerely, Ann L. Schneider Secretary

3 The Illinois Department of Transportation s Division of Traffic Safety would like to express its appreciation to the local, county, and state law enforcement agencies for their assistance in investigating and reporting traffic crashes and to the County Coroners and the Medical Examiner of Cook County for providing pertinent information. Without their efforts and cooperation, this publication would not have been possible. Ann L. Schneider Secretary John A. Webber Interim Director Division of Traffic Safety Compiled by: Illinois Department of Transportation Division of Traffic Safety Crash Information Staff Crash Records Staff 3

4 IMPORTANT NOTE The law regarding the reporting threshold for property damage only crashes was amended, effective January 1, 2009, as follows: When all drivers involved in a crash are insured, the amount of damage to any one person s property that must be reported increased from $500 to $1,500. If any driver does not have insurance, the threshold remains at $500. The change did not affect the reporting of injury or fatal crashes. The noticeable decline in property damage crashes may have been influenced by IDOT s safety efforts; however, part of the decline is attributable to this change in the crash reporting threshold. There were 76,352 crashes reported in 2012 for which damage to any one person s property totaled between $501 and $1,500. 4

5 Table of Contents Crash Data Overview County Map Illinois Highway Safety Clock Crashes by Day of Week and Time of Day Fatal Crashes by Day of Week and Time of Day A Injury Crashes by Day of Week and Time of Day Crashes by Type of Roadway Crashes by Type of Collision Work Zone Crashes Large Trucks Involved in Work Zone Crashes by Crash Severity Fatal Work Zone Crashes by Time of Day and Day of Week Deer Crashes Pedestrian and Pedalcycle Crashes Train Crashes County Motor Vehicle Crash Statistics Person Data Overview County Map Illinois Fatalities and Vehicle Miles Traveled Drivers Involved in Crashes by Age and Crash Severity Drivers Involved in Fatal Crashes by Age and Location Injuries by Person Type, Age and Gender

6 Table of Contents A Injuries by Person Type, Age and Gender Fatalities by Person Type, Age and Gender Teen Fatalites by Age and Person Type Pedestrian Pedalcyclist Motorcyclist Occupant Restraint Usage for Persons Killed and Injured Alcohol-Related Fatal Crashes Overview Drivers Killed by Age and BAC Fatal Alcohol-Related Crashes by Time of Day and Day of Week Fatal Crashes During the Holidays Pedestrians and Pedalcyclists Killed by Age and BAC Vehicle Data Overview Registered Motor Vehicles by Type Motor Vehicles Involved in Crashes Tractor-Trailer Crashes School Bus Crashes Motorcycle Crashes Taxi Cabs Involved in Crashes by Collision Type and Crash Severity Division of Traffic Safety Programs Glossary

7 7

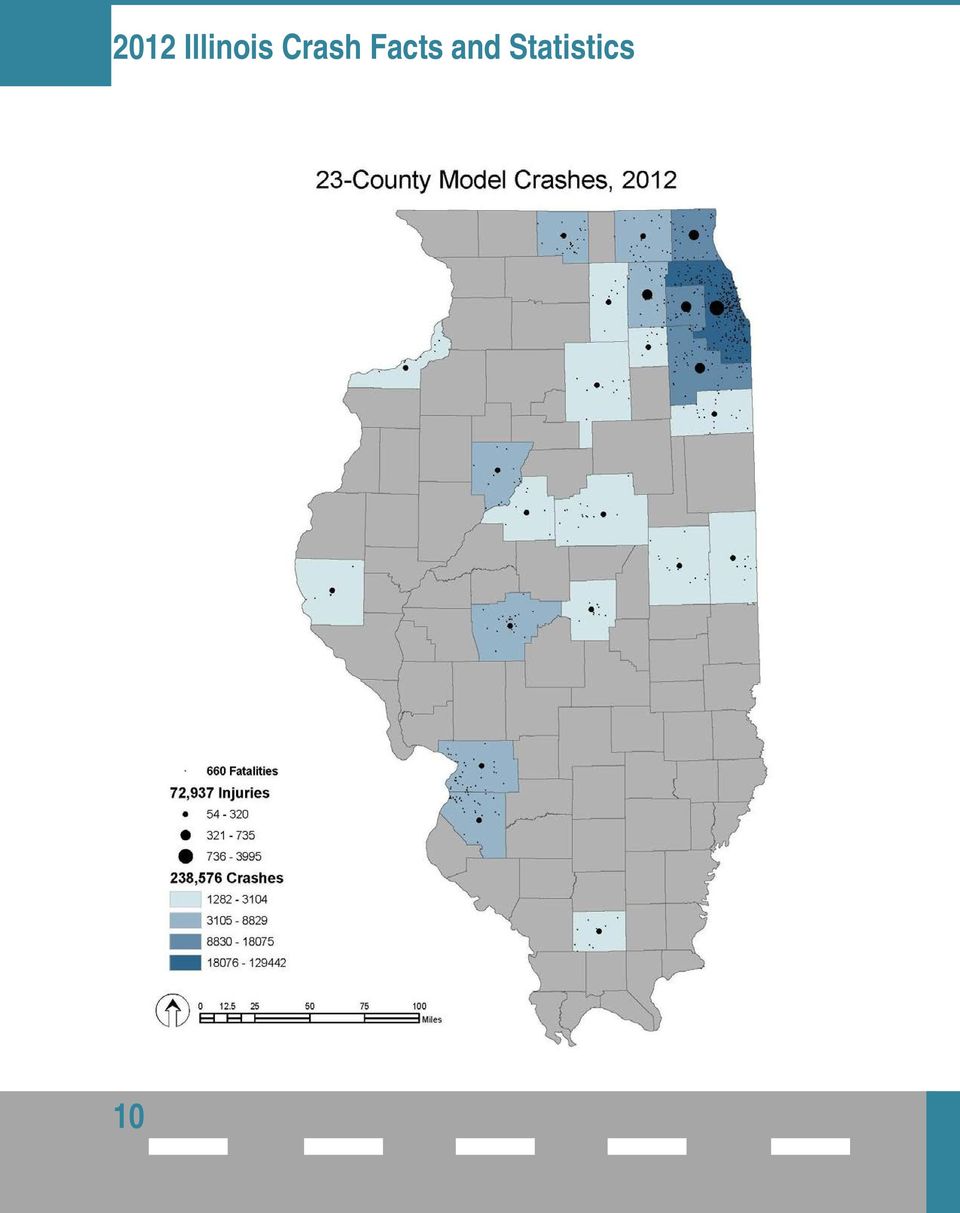
8 Crash Data Overview Each year, the Division of Traffic Safety (DTS) at IDOT identifies traffic safety problems using existing crash reports. The process used to identify traffic safety problems began initially by evaluating Illinois experience in each of the existing Illinois highway safety priority areas, such as seat belt and impaired driving. These two areas have been determined by the National Highway Traffic Safety Administration to be the most effective in reducing motor vehicle-related injuries and deaths. Consideration for other potential traffic safety problem areas came from analyzing survey data and other anecdotal information. During the last ten years, Illinois has used the 23-County Model to enhance the existing problem identification process. Under this model, Illinois selected the top 23 counties where 85 percent of the population resided. These 23 counties account for 87.0 percent of the total crashes, 87.3 percent of the injury crashes, 77.8 percent of the A-Injury crashes, and 70.1 percent of the fatal crashes in Table 1 below shows the breakdown of these 23 counties and their percentage of the overall crashes by severity. Table 1: Frequency and Percent Distributions of Total Crashes by Crash Severity within the 23 Counties A County Total % Fatal % Injury % Injury % Crashes Crashes Crashes Crashes Cook 131, % % 26, % 3, % DuPage 18, % % 4, % % Lake 11, % % 3, % % Will 11, % % 2, % % Kane 8, % % 2, % % Winnebago 5, % % 1, % % St. Clair 5, % % 1, % % Madison 5, % % 1, % % Peoria 4, % % 1, % % McHenry 4, % % 1, % % Sangamon 4, % % 1, % % McLean 3, % % % % Rock Island 3, % 8 0.9% % % Champaign 3, % % % % Tazewell 2, % 7 0.8% % % Macon 2, % 9 1.0% % % Kankakee 2, % % % % LaSalle 2, % % % % Williamson 1, % % % % Vermilion 1, % 8 0.9% % % Kendall 1, % % % % DeKalb 1, % 7 0.8% % % Adams 1, % 5 0.6% % % 23- County Total 238, % % 52, % 7, % Statewide 274, % % 60, % 9, % 8

9 Crash Overview There were 274,111 crashes involved motor vehicles in Illinois in Injury crashes account for 22.0 percent of these crashes (60,252), while fatal crashes (886) account for less than 1 percent of these overall crashes. Crashes involving an A injury account for 16.0 percent of the injury crashes statewide in Crashes involving pedestrians account for 1.7 percent of the overall crashes statewide. Pedestrian crashes within the 23 counties account for 94.1 percent of the total statewide pedestrian crashes, 94.4 percent of the total statewide pedestrian fatal crashes and 72.4 percent of the statewide pedestrian injury crashes in Crashes involving pedalcyclists account for 1.3 percent of the overall crashes statewide percent of the total pedalcyclist crashes, 93.0 percent of the fatal pedalcyclist crashes and 82.7 percent of the pedalcyclist injury crashes occurred within these 23 counties. Crashes involving speed account for 29.9 percent of the overall crashes, 24.5 percent of the fatal crashes, and 34.1 percent of the injury crashes in Crashes involving speed within these 23 counties account for 90.0 percent of these total statewide speed-related crashes, 67.3 percent of the fatal speed-related crashes and 87.4 percent of the speed-related crashes involving an injury. Crashes involving motorcycles account for 1.5 percent of the total crashes, 16.7 percent of the fatal crashes and 5.0 percent of the injury crashes statewide percent of these total crashes, 73.6 percent of the fatal crashes and 78.3 percent of the injury crashes occurred within these 23 counties. Crashes involving tractor-trailers account for 3.6 percent of the overall crashes, 9.1 percent of fatal crashes and 2.7 percent of the injury crashes statewide percent of the overall crashes, 55.6 percent of the fatal crashes and 79.4 percent of the injury crashes involving tractor-trailers occurred within these 23 counties. Crashes occurring in work zone account for 1.7 percent of the total crashes, 2.1 percent of fatal crashes, and 1.8 percent of the injury crashes statewide percent of the total work zone crashes, 63.2 percent of the fatal work zone crashes and 94.0 percent of the work zone injury crashes occurred within the 23 counties. 9

10 10
11 Registered Motor Vehicles 10,186,671 Licensed Drivers 8,840,976 Vehicle Miles Traveled 104,456,093,156 Total Crashes 274,111 Total Injuries 83,768 A Type Injuries* 12,401 Total Deaths 956 Mileage Death Rate 0.92 (Per Hundred Million Vehicle Miles Traveled) * A Type Injury (Incapacitating Injury) is any injury, other than a fatal injury, which prevents the injured person from walking, driving, or normally continuing the activities he/she was capable of performing before the injury occurred. Includes severe lacerations, broken limbs, skull or chest injuries, and abdominal injuries. Illinois Highway Safety Clock 751 traffic crashes occurred per day in Over 2 persons were killed per day in traffic crashes in ,111 crashes occurred on Illinois roadways in Over 9 persons were injured per hour in

12 Crashes by Day of Week 100,000 80,000 60,000 37,649 40,000 30,226 31,187 31,006 33,767 30,138 24,794 20,000 7,565 7,326 7,594 8,368 9,300 8,195 6,996 0 Monday Tuesday Wednesday Thursday Friday Saturday Sunday Rural Urban The greatest number of crashes occurred on Friday with 37,649 crashes in urban location and 9,300 crashes in rural locations. The second largest number of crashes occurred on Thursday. Crashes by Time of Day 100,000 80,000 58,503 59,222 60,000 40,229 40,000 21,516 25,320 20,000 4,670 13,977 8,234 7,974 10,591 14,714 9, :59 a.m. 4-7:59 a.m. 8-11:59 a.m. 12-3:59 p.m. 4-7:59 p.m. 8-11:59 p.m. Rural Urban percent of all crashes occurred between 8:00 a.m. and 7:59 p.m percent of these crashes occurred on urban roadways.

13 Fatal Crashes by Day of Week Monday Tuesday Wednesday Thursday Friday Saturday Sunday Rural Urban The greatest number of fatal crashes occurred on Sunday with 93 crashes in urban location and 82 crashes in rural locations. The second largest number of crashes occurred on Saturday. Fatal Crashes by Time of Day :59 a.m. 4-7:59 a.m. 8-11:59 a.m. 12-3:59 p.m. 4-7:59 p.m. 8-11:59 p.m. Rural Urban 57.1 percent of all fatal crashes occurred between 4:00 p.m. and 3:59 a.m percent of these crashes occurred on urban roadways (238 crashes). 13

14 "A" Injury Crashes by Day of Week 2,000 1,600 1, , Monday Tuesday Wednesday Thursday Friday Saturday Sunday Rural Urban The greatest number of A-injury crashes occurred on Friday with 1,003 crashes in urban location and 496 crashes in rural locations. The second largest number of A-injury crashes occurred on Saturday. "A" Injury Crashes by Time of Day 2,000 1,600 1,646 1,687 1, , :59 a.m. 4-7:59 a.m. 8-11:59 a.m. 12-3:59 p.m. 4-7:59 p.m. 8-11:59 p.m. Rural Urban percent of all A-injury crashes occurred between 4:00 p.m. and 3:59 a.m percent of these A-injury crashes occurred on urban roadways.

15 Crashes by Type of Roadway CRASH SEVERITY TYPE OF ROADWAY Fatal Injury A Injury Total URBAN State Highways ,936 1,921 53,995 Percent Interstate Type Roads 69 2, ,370 Percent City Streets and Roads ,074 4, ,401 Percent Unmarked State Routes Percent Urban Total ,836 6, ,767 Percent RURAL State Highways 133 2, ,933 Percent Interstate Type Roads ,325 Percent County and Local Roads 217 5,763 1,580 22,878 Percent Unmarked State Routes 16 4, ,208 Percent Rural Total ,416 3,161 55,344 Percent TOTAL ,252 9, ,111 Percent In 2012, there were 274,111 total crashes, 79.8 percent of these crashes occurred on urban roadways. By comparison, 79.4 percent of all injury crashes occurred on urban roadways. 15

16 Crashes by Type of Collision TYPE OF CRASH SEVERITY COLLISION Fatal Injury A Injury Total Vehicle Overturned 63 2, ,560 Pedestrian 134 4, ,762 Train Pedalcyclist 28 3, ,423 Animal ,259 Fixed Object 278 8,355 2,040 31,701 Other Object ,134 Other Noncollision ,288 Parked 16 1, ,249 Rear-End 63 17,462 1,612 79,680 Head-On ,045 Sideswipe-Same Direction 19 2, ,565 Sideswipe-Opposite Direction ,139 Angle 67 8,631 1,416 31,747 Turning 79 9,153 1,380 37,502 TOTAL ,252 9, ,111 Crashes involving fixed objects comprise the largest number of fatal crashes in Illinois and account for 31.4 percent of all fatal crashes in Rear-end collisions comprise the highest number of injury crashes, resulting in 29.0 percent of all injury crashes in Rear-end collisions, which are also responsible for the greatest number of property damage crashes, account for 29.1 percent of total crashes. 16

17 Work Zone Crashes A work zone is an area of a trafficway where construction, maintenance, or utility work activities are identified by warning signs/signals/indicators, including those on transport devices that mark the beginning and end of a construction, maintenance, or utility work activity. It extends from the first warning sign, signal or flashing lights to the END ROAD WORK sign or the last traffic control device pertinent for that work activity. Work zones also include roadway sections where there is ongoing, moving work activity such as lane line painting or roadside mowing only if the beginning of the ongoing, moving work activity is designated by warning signs or signals. A work zone crash is a motor vehicle traffic crash in which the first harmful event occurs within the boundaries of a work zone, or an approach to or exit from a work zone, resulting in activity, behavior, or control related to the movement of the traffic units through the work zone. CRASHES BY TYPE OF ROADWAY URBAN State Routes 1,038 Interstate Type Roads 764 City Streets and Roads 1,769 Unmarked Routes 0 Urban Total 3,571 RURAL State Routes 78 Interstate Type Roads 66 County and Local Roads 133 Unmarked Routes 916 Rural Total 1,193 Workers do not have to be present at the time of the crash to be considered a work zone crash. A INJURIES AND FATALITIES BY PERSON TYPE Total Crashes 4,764 Fatal Crashes 19 Injury Crashes 1,105 A Injury Crashes 172 Persons Killed 19 Persons Injured 1,586 Person Type A Injuries Fatalities Drivers Passengers 71 3 Workers 10 2 Pedestrians 8 1 Pedalcyclists

18 Large Trucks Involved in Work Zone Crashes By Crash Severity CRASH SEVERITY TRUCK TYPE Fatal Injury A Injury Property Damage Total Tractor with Semi Trailer Bob Tail Single Unit Straight Truck TOTAL Fatal Work Zone Crashes by Time of Day and Day of Week Time of Day Day of Week 8-11:59 a.m. 37% 12-3:59 p.m. 21% Tuesday 31% Thursday 21% 4-7:59 a.m. 16% 12-3:59 a.m. 5% 8-11:59 p.m. 10% 4-7:59 p.m. 10% Monday 11% Sunday 11% Saturday 5% Friday 21% There were no crashes occurring in work zones on a Wednesday in

19 Deer Crashes In 2012, there were 15,488 crashes involving deer. Deer crashes account for about 6.0 percent of the total crashes percent of deer crashes occurred during daylight hours; 68.8 percent occurred in darkness. Approximately 83.0 percent of deer crashes were on rural roadways, with 3,090 of these crashes on state routes. Total Crashes 15,488 Fatal Crashes 4 Injury Crashes 522 A Injury Crashes 95 Persons Killed 4 Persons Injured 608 CRASHES BY LIGHT CONDITION Daylight 3,065 Dawn 931 Dusk 635 Darkness 9,979 Darkness-Road Lighted 675 Unknown 203 TOTAL 15,488 A INJURIES AND FATALITIES BY TYPE OF ROADWAY Type of Roadway A Injuries Fatalities URBAN State Routes 2 0 Interstate Type Roads 6 0 City Streets and Roads 2 0 Unmarked Routes 0 0 Urban Total 10 0 RURAL State Routes 22 0 Interstate Type Roads 5 0 County and Local Roads 53 4 Unmarked Routes 20 0 Rural Total

20 Pedestrian and Pedalcycle Crashes PEDESTRIAN PEDALCYCLE Total Crashes 4,930 3,453 Fatal Crashes Injury Crashes 4,665 3,233 A Injury Crashes Property Damage Crashes Number of Crashes by Type of Roadway PEDESTRIAN PEDALCYCLE Crash Severity Crash Severity Fatal Injury A Injury Fatal Injury A Injury Urban State Routes Interstate Type Roads City Streets and Roads 74 3, , Unmarked Routes Urban Total 121 4, , Rural State Routes Interstate Type Roads County and Local Roads Unmarked Routes Rural Total Number of Crashes by Light Condition PEDESTRIAN PEDALCYCLE Crash Severity Crash Severity Fatal Injury A Injury Fatal Injury A Injury Light Condition Daylight 47 2, , Dawn Dusk Darkness Darkness-Road Lighted 54 1, Unknown TOTAL 139 4, ,

21 Train Crashes Train crashes are crashes in which motor vehicles are involved with trains. Pedestrians and pedalcyclists hit by trains are not included. Fatal crashes and A-injury crashes involving trains account for less than 1.0 percent of all fatal and A-Injury crashes combined in Crashes by Type of Traffic Control Fatal A Injury RR Gates 4 5 Other RR Crossing Device 2 5 Warning Sign 0 0 Stop Sign/Flasher 0 0 No Control 0 0 TOTAL 6 10 Total Crashes 57 Injury Crashes 20 A Injury Crashes 10 Fatal Crashes 6 Persons Killed 9 Persons Injured 30 Persons with A injuries 13 Fatalities and A Injuries by Type of Roadway Fatalities A Injuries Urban State Routes 0 0 City Streets and Roads 2 4 Urban Total 2 4 Rural State Routes 0 0 County and Local Roads 7 9 Rural Total
22 County Motor Vehicle Crash Statistics FATAL INJURY A INJURY COUNTY CRASHES CRASHES CRASHES CRASHES Adams 1, Alexander Bond Boone Brown Bureau Calhoun Carroll Cass Champaign 3, Christian Clark Clay Clinton Coles Cook 131, ,624 3,176 Crawford Cumberland DeKalb 1, DeWitt Douglas DuPage 18, , Edgar Edwards Effingham Fayette Ford Franklin Fulton Gallatin Greene Grundy Hamilton Hancock Hardin Henderson Henry Iroquois Jackson 1, Jasper Jefferson 1, Jersey JoDaviess Johnson Kane 8, , Kankakee 2, Kendall 1, Knox Lake 11, , LaSalle 2, Lawrence
23 County Statistics (continued) FATAL INJURY A INJURY COUNTY CRASHES CRASHES CRASHES CRASHES Lee Livingston Logan McDonough McHenry 4, , McLean 3, Macon 2, Macoupin Madison 5, , Marion Marshall Mason Massac Menard Mercer Monroe Montgomery Morgan Moultrie Ogle Peoria 4, , Perry Piatt Pike Pope Pulaski Putnam Randolph Richland Rock Island 3, St. Clair 5, , Saline Sangamon 4, , Schuyler Scott Shelby Stark Stephenson Tazewell 2, Union Vermilion 1, Wabash Warren Washington Wayne White Whiteside 1, Will 11, , Williamson 1, Winnebago 5, , Woodford TOTALS 274, ,252 9,648 23
24 24
25 Person Data During the last ten years, Illinois has used the 23-County Model to enhance the existing problem identification process. Under this model, Illinois selected the top 23 counties where 85 percent of the population resided. These 23 counties account for 87.1 percent of all injuries, 76.6 percent of all A-injuries, and 69.0 percent of the fatalities in Table 1 below shows the breakdown of these 23 counties and their percentage of the overall injuries by severity. Table 1: Frequency and Percent Distributions of Total Injuries and Total Fatalities by Injury Severity within the 23 Counties County Fatalities % Injuries % A -Injuries % Cook % 36, % 3, % DuPage % 5, % % Lake % 4, % % Will % 3, % % Kane % 3, % % Winnebago % 1, % % St. Clair % 1, % % Madison % 1, % % Peoria % 1, % % McHenry % 1, % % Sangamon % 1, % % McLean % 1, % % Rock Island 8 0.8% % % Champaign % % % Tazewell 7 0.7% % % Macon 9 0.9% % % Kankakee % % % LaSalle % % % Williamson % % % Vermilion 8 0.8% % % Kendall % % % DeKalb 7 0.7% % % Adams 6 0.6% % % 23- County Total % 72, % 9, % Statewide % 83, % 12, % 25
26 Person Overview There were 83,768 persons injured in motor vehicles crashes in 2012, of these 87.1 percent occurred within the 23 counties. 12,401 persons had A type injuries occurring from these crashes, with 76.6 percent of these A injuries in the 23 counties. 956 persons were fatally injured in crashes in 2012, 69.0 percent of these within the 23 counties. There were 599 drivers fatally injured in motor vehicles crashes in percent of these drivers were fatally injured in the 23 counties. 187 passengers of a motor vehicle were killed in percent of these passengers were within the 23 counties percent of the fatally injured pedestrians occurred in these 23 counties. 22 of the 29 pedalcyclists were fatally injured within these 23 counties. 110 of the 148 fatally injured motorcyclists, 74.3 percent, were killed within these 23 counties. 26
27 27
28 Illinois Fatalities and Vehicle Miles Traveled* Fatalities by Year 160 Vehicle Miles Traveled by Year Fatalities Vehicle Miles of Travel (in Billions) YEAR FATALITIES TRAVEL YEAR FATALITIES TRAVEL , , , , , , , , , , , , , , , , *Travel is stated in billions of miles.
29 Drivers Involved in Crashes By Age and Crash Severity TOTAL CRASH SEVERITY LICENSED AGE Fatal Rate Injury Rate A Injury Rate Total Rate DRIVERS 15 or Younger , , , , , , , , , , , , , , , , , , , , , , , , , , , , , , , , , , , , , , , , , , , , , , , , , , , , , , or Older , , ,742 Unknown , , TOTAL 1, , , , ,840,976 Rates are expressed as the number of drivers involved in a particular type of crash per 1,000 licensed drivers. 29
30 Drivers Involved in Fatal Crashes by Age and Location RURAL ROADWAYS URBAN ROADWAYS TOTAL AGE Drivers Drivers Drivers Involved Killed Involved Killed Involved Killed 15 or Younger Percent Percent Percent Percent Percent Percent Percent Percent Percent Percent Percent or Older Percent Unknown Percent TOTAL Percent
31 Injuries by Person Type, Age and Gender TOTAL OCCUPANT AGE DRIVERS PASSENGERS INJURIES Male Female Total % Male Female Total % Male Female Total % 4 or Younger , , , , ,111 1, ,118 1, ,394 2,784 5, ,260 1,996 3, ,654 4,780 8, ,646 3,775 7, ,191 1,592 2, ,837 5,367 10, ,382 5,805 11, ,321 1,782 3, ,703 7,587 14, ,505 4,590 9, ,273 2, ,254 5,863 11, ,500 4,495 8, ,391 2, ,163 5,886 11, ,337 3,235 6, ,129 1, ,707 4,364 8, ,532 1,520 3, ,715 2,158 3, or Older , ,129 1,508 2, Unknown TOTAL 26,353 27,239 53, ,587 13,404 21, ,940 40,643 75, TOTAL NON-OCCUPANT AGE PEDESTRIANS PEDALCYCLISTS INJURIES Male Female Total % Male Female Total % Male Female Total % 4 or Younger , , , , or Older Unknown TOTAL 2,540 2,191 4, , ,998 2,974 7, Note: The totals above do not include 28 drivers, 90 passengers, 39 pedestrians, and 9 pedalcyclists whose gender was unknown. An additional 47 occupants of non-motor vehicles were also injured. Occupant: Any person who is part of a transport vehicle Non-Occupant: Any person who is part of a pedalcycle in transport (pedalcyclist) or any person who is not an occupant (pedestrian). Drivers injured amount to 64.0 percent of all injuries for Passengers represent 26.4 percent of the total number of injuries in Pedestrians account for 5.7 percent of all injuries. Pedalcyclists account for 3.9 percent of all injuries. 31
32 A Injuries by Person Type, Age and Gender TOTAL OCCUPANT AGE DRIVERS PASSENGERS A INJURIES Male Female Total % Male Female Total % Male Female Total % 4 or Younger , , , , , , , , , , , , or Older Unknown TOTAL 4,556 3,499 8, ,201 1,784 2, ,757 5,283 11, TOTAL NON-OCCUPANT AGE PEDESTRIANS PEDALCYCLISTS A INJURIES Male Female Total % Male Female Total % Male Female Total % 4 or Younger or Older Unknown TOTAL , Note: The totals above do not include 8 drivers, 19 passengers, and 1 pedestrian whose gender was unknown. An additional 5 occupants of non-motor vehicles were also injured. Occupant: Any person who is part of a transport vehicle Non-Occupant: Any person who is part of a pedalcycle in transport (pedalcyclist) or any person who is not an occupant (pedestrian). Drivers injured amount to 65.0 percent of A type injuries for Passengers represent 24.2 percent of the total number of A injuries in Pedestrians account for 7.3 percent of A injuries. Pedalcyclists account for 3.4 percent of A injuries. 32
33 Fatalities by Person Type, Age and Gender TOTAL OCCUPANT AGE DRIVERS PASSENGERS FATALITIES Male Female Total % Male Female Total % Male Female Total % 4 or Younger or Older TOTAL TOTAL NON-OCCUPANT AGE PEDESTRIANS PEDALCYCLISTS FATALITIES Male Female Total % Male Female Total % Male Female Total % 4 or Younger or Older TOTAL Note: Two occupants of a non-motor vehicle were also killed in Occupant: Any person who is part of a transport vehicle Non-Occupant: Any person who is part of a pedalcycle in transport (pedalcyclist) or any person who is not an occupant (pedestrian). Drivers killed amount to 62.7 percent of all fatalities in Driver fatalities increased by 5.5 percent from 2011 to Passengers represent 19.6 percent of the total number of fatalities in Passengers killed increased by 2.2 percent from 2011 to Pedestrians account for 14.5 percent of all fatalities. They also increased by 3.0 percent from 2011 to Pedalcyclists, which account for 3.0 percent of all fatalities, increased by 7.4 percent from 2011 to
34 Teen Fatalities by Age and Person Type PERSON TYPE OCCUPANT OF AGE DRIVER OCCUPANT PEDESTRIAN PEDALCYCLIST NON-MOTOR TOTAL VEHICLE TOTAL Teen A Injuries by Age and Person Type PERSON TYPE OCCUPANT OF AGE DRIVER OCCUPANT PEDESTRIAN PEDALCYCLIST NON-MOTOR TOTAL VEHICLE TOTAL ,302 34
35 Pedestrian Pedestrians Injured 4,770 Pedestrians with A Injuries 902 Pedestrians Killed 139 PEDESTRIANS KILLED AND INJURED BY TYPE OF ROADWAY Killed A Injuries Injuries Urban State Routes Interstate Type Roads City Streets and Roads Unmarked Routes Urban Total Rural State Routes Interstate Type Roads County and Local Roads Unmarked Routes Rural Total PEDESTRIANS KILLED AND INJURED BY AGE Killed A Injuries Injured Age 4 or Younger or Older Unknown TOTAL ,770 35
36 Pedalcyclist Pedalcyclists Injured 3,250 Pedalcyclists with A Injuries 427 Pedalcyclists Killed 29 PEDALCYCLISTS KILLED AND INJURED BY TYPE OF ROADWAY Killed A Injuries Injured Urban State Routes Interstate Type Roads City Streets and Roads ,613 Unmarked Routes Urban Total ,143 Rural State Routes Interstate Type Roads County and Local Roads Unmarked Routes Rural Total PEDALCYCLISTS KILLED AND INJURED BY AGE Killed A Injuries Injured Age 4 or Younger or Older Unknown TOTAL ,250 36
37 Motorcyclist Motorcyclists Injured 3,312 Motorcyclists with A Injuries 1,177 Motorcyclists Killed 148 Non-Motorcyclists Killed 2 MOTORCYCLISTS KILLED AND INJURED BY TYPE OF ROADWAY Killed A Injuries Injuries Urban State Routes Interstate Type Roads City Streets and Roads ,378 Unmarked Routes Urban Total ,199 Rural State Routes Interstate Type Roads County and Local Roads Unmarked Routes Rural Total ,114 MOTORCYCLE OPERATORS KILLED AND INJURED BY AGE Killed A Injuries Injured Age 9 or Younger or Older ,215 Unknown TOTAL 141 1,030 2,978 37
38 Occupant Restraint Usage for Persons Killed and Injured* DRIVER PASSENGER TYPE OF RESTRAINT Fatal A Injury Injury Fatal A Injury Injury None Used/Not Applicable , ,313 Safety Belt Used 214 5,453 43, ,919 16,060 Child Restraint Used ,214 Safety Belt Used Improperly Child Restraint Used Improperly Unknown , ,187 TOTAL 446 6,937 50, ,736 20,844 Occupant Restraint Usage for Persons Killed by Age* AGE GROUPS TYPE OF RESTRAINT or Older None Used/Not Applicable Safety Belt Used Child Restraint Used Safety Belt Used Improperly Child Restraint Used Improperly Unknown TOTAL Occupant Restraint Usage for Persons with A Injuries by Age* AGE GROUPS TYPE OF RESTRAINT or Older None Used/Not Applicable Safety Belt Used ,091 5,950 Child Restraint Used Safety Belt Used Improperly Child Restraint Used Improperly Unknown TOTAL ,488 7,615 *Excludes buses, motorcycles and miscellaneous vehicles. 38
39 39
40 Alcohol-Related Fatal Crashes During the last ten years, Illinois has used the 23-County Model to enhance the existing problem identification process. Under this model, Illinois selected the top 23 counties where 85 percent of the population resided. These 23 counties account for 73.9 percent of the total alcohol-related fatal crashes and alcohol-related fatalities. Table 1 below shows the breakdown of these 23 counties and their percentage of the overall alcohol-related crashes and fatalities by severity. Table 1: Frequency and Percent Distributions of Total Fatal Alcohol-Related Crashes and Fatalities by their Severity within the 23 Counties Alcohol-Related Alcohol-Related County Fatal Crashes % Fatalities % Cook % % DuPage 8 2.4% 8 2.3% Lake % % Will % % Kane % % Winnebago 8 2.4% 8 2.3% St. Clair 8 2.4% 8 2.3% Madison % % Peoria 5 1.5% 5 1.5% McHenry % % Sangamon % % McLean 7 2.1% 7 2.1% Rock Island 5 1.5% 5 1.5% Champaign 6 1.8% 6 1.8% Tazewell 3 0.9% 3 0.9% Macon 3 0.9% 3 0.9% Kankakee 6 1.8% 6 1.8% LaSalle 5 1.5% 5 1.5% Williamson 5 1.5% 5 1.5% Vermilion 2 0.6% 2 0.6% Kendall 5 1.5% 5 1.5% DeKalb 3 0.9% 3 0.9% Adams 0 0.0% 0 0.0% 23- County Total % % Statewide % % 40
41 Alcohol Overview There were 886 fatal crashes in 2012, 37.2 percent of these crashes involved alcohol, with 73.9 percent of those crashes occurring within these 23 counties. 956 persons were killed in motor vehicle crashes in percent of these fatalities were alcohol-related, 73.9 percent of those alcohol-related fatalities occurred within the 23 counties. There were 599 drivers killed in motor vehicle crashes in of these drivers were tested, 45.3 percent tested positive with a BAC of 0.01 or greater. There were 139 pedestrians killed in of those pedestrians were tested for BAC, 43.8 percent tested positive with a BAC of 0.01 or greater. 29 pedalcyclists were fatally injured in motor vehicle crashes in percent of those fatally injured pedalcyclists were tested and had a positive BAC of 0.01 or greater. Motorcycle operators accounted for 14.7 percent of the fatalities in of these operators were tested and 46.5 percent tested positive with a BAC of 0.01 or greater. Teen Drivers account for almost 4 percent of the overall fatalities in There were 94.7 percent of these drivers tested for BAC with 11.1 percent of them testing positive with a BAC of 0.01 or greater. 41
42 Drivers Killed by Age and BAC NOT TESTED AGE BAC TEST RESULTS TOTAL OR UNKNOWN TOTAL Over 0.20 TESTED IF TESTED KILLED 15 or Younger or Older TOTAL Fatal Alcohol-Related Crashes by Time of Day and Day of Week Fatal alcohol-related crashes are fatal crashes in which at least one driver (surviving or deceased) had a Blood Alcohol Concentration(BAC) of 0.01 or greater. Time of Day Day of Week 8-11:59 p.m. 25% a.m. 33% Monday, 7% Tuesday, 8% Wednesday, 10% Thursday, 10% Friday, 9% 4-7:59 p.m. 18% 12-3:59 p.m. 8% 8-11:59 a.m. 3% 4-7:59 a.m. 13% Sunday, 29% Saturday, 26% 42
43 Fatal Crashes During the Holidays Total and Alcohol-Related* FATAL CRASHES FATALITIES HOLIDAY PERIODS NUMBER OF DAYS Alcohol-Related* Total Alcohol-Related* Total Memorial Day 6:00 p.m. on 05/25/ of 6 3 of 6 11:59 p.m. on 05/28/2012 Fourth of July 6:00 p.m. on 07/03/ of 3 2 of 4 11:59 p.m. on 07/04/2012 Labor Day 6:00 p.m. on 08/31/ of 14 6 of 15 11:59 p.m. on 09/03/2012 Thanksgiving 6:00 p.m. on 11/21/ of 8 3 of 9 11:59 p.m. on 11/25/2012 Christmas 6:00 p.m. on 12/21/ of 10 2 of 10 11:59 p.m. on 12/25/2012 New Year s 6:00 p.m. on 12/28/ of 6 3 of 7 11:59 p.m. on 01/01/2013 *Fatal Crashes or fatalities resulting from crashes in which at least one driver (surviving or deceased) had a Blood Alcohol Concentration of 0.01 or greater. 43
44 Pedestrians and Pedalcyclists Killed by Age and BAC BAC TEST RESULTS Not Tested AGE Over 0.20 Or Unknown Total If Tested Pedestrians 4 or Younger or Older TOTAL Pedalcyclists 4 or Younger or Older TOTAL
45 45
46 Vehicle Data During the last ten years, Illinois has used the 23-County Model to enhance the existing problem identification process. Under this model, Illinois selected the top 23 counties where 85 percent of the population resided. These 23 counties account for 71.1 percent of the passenger car registrations, 59.7 percent of the truck (B-Plates) registrations and 66.1 percent of the motorcycle registrations. Table 1 below shows the breakdown of these 23 counties and their percentage of the overall registrations Table 1: Frequency and Percent Distributions of Total Registrations within the 23 Counties County Passenger % Trucks % Motorcycle % Cars B-Plates Cook 1,619, % 123, % 47, % DuPage 657, % 56, % 22, % Lake 473, % 49, % 19, % Will 413, % 59, % 19, % Kane 306, % 43, % 13, % Winnebago 181, % 33, % 9, % St. Clair 154, % 38, % 8, % Madison 157, % 50, % 11, % Peoria 109, % 27, % 6, % McHenry 207, % 33, % 13, % Sangamon 118, % 32, % 7, % McLean 101, % 22, % 5, % Rock Island 88, % 22, % 5, % Champaign 98, % 21, % 5, % Tazewell 80, % 27, % 7, % Macon 62, % 19, % 4, % Kankakee 64, % 15, % 3, % LaSalle 66, % 22, % 5, % Williamson 33, % 15, % 3, % Vermilion 41, % 16, % 3, % Kendall 79, % 12, % 4, % DeKalb 57, % 12, % 4, % Adams 37, % 15, % 3, % 23- County Total 5,210, % 772, % 235, % Statewide 7,324, % 1,295, % 356, % 46
47 Motor Vehicles Involved in Crashes CRASH SEVERITY VEHICLE OCCUPANTS TYPE OF MOTOR VEHICLE Fatal Injury Total Killed A Injury Passenger Car , , ,798 Pickup Truck 166 8,503 39, ,165 Van 107 7,935 34, ,581 Other Single Unit Truck 29 1,099 6, Truck-Tractor with Semi-Trailer 91 1,714 10, Farm Tractor/Farm Equipment School Bus , Other Bus , Motorcycle (under 150 cc) Motorcycle (Over 150 cc) 155 2,669 3, ,127 Other or Unknown 24 1,725 21,
48 Tractor-Trailer Crashes There were 9,739 crashes involving tractor-trailers in Illinois in the year These tractor-trailer crashes account for 3.6 percent of the total crashes. Fatalities resulting from tractor-trailer crashes increased by 1.1 percent from 2011 to 2012, while the number of fatal crashes remained the same. Injury crashes involving tractor trailers account for 2.7 percent of all injury crashes. A injuries account for 20.0 percent of all injuries in tractor-trailer crashes. Total Crashes 9,739 Fatal Crashes 81 Injury Crashes 1,633 A Injury Crashes 346 Property Damage Crashes 8,025 Vehicle Miles Traveled (Millions) 6,372 CRASHES BY TYPE OF ROADWAY BY CRASH SEVERITY TYPE OF ROADWAY CRASH SEVERITY Fatal Injury A Injury URBAN State Routes Interstate Type Roads City Streets and Roads Unmarked Routes Urban Total 38 1, RURAL State Routes Interstate Type Roads County and Local Roads Unmarked Routes Rural Total PERSONS KILLED AND INJURED BY PERSON TYPE PERSON TYPE Killed Injured A Injury Tractor-Trailer Occupants Other Vehicle Occupants 74 1, Pedestrians Pedalcyclists TOTAL 94 2,
49 School Bus Crashes In 2012, there were 1,441 school bus crashes. These crashes account for less than 1.0 percent of the total crashes for the year. Injury crashes involving school buses decreased by 19.9 percent, from 276 in 2011 to 221 in 2012 however, the number of injuries increased by 0.7 percent. A injuries account for 15.7 percent of these injuries. Total Crashes 1,441 Fatal Crashes 3 Injury Crashes 221 A Injury Crashes 33 Property Damage Crashes 1,217 Urban Crashes 1,276 Rural Crashes 165 CRASHES BY TYPE OF ROADWAY BY CRASH SEVERITY TYPE OF ROADWAY CRASH SEVERITY Fatal Injury A Injury URBAN State Routes Interstate Type Roads City Streets and Roads Unmarked Routes Urban Total RURAL State Routes Interstate Type Roads County and Local Roads Unmarked Routes Rural Total PERSONS KILLED AND INJURED BY PERSON TYPE PERSON TYPE Killed Injured A Injury School Bus Drivers School Bus Passengers (School-Age)* Other School Bus Passengers Other Vehicle Occupants Pedestrians (School-Age)* Other Pedestrians Pedalcyclists TOTAL *School-Age = Children 5-19 years of age. School Bus = Type 1 or Type 2. 49
50 Motorcycle Motorcycle crashes accounted for 1.6 percent of all crashes in the year The number of motorcyclists killed increased by 2.1 percent, from 145 in 2011 to 148 in These motorcycle fatalities accounted for 15.5 percent of all fatalities in The number of motorcyclists injured increased by 9.7 percent in The figures below include motorcycles, motorscooters, motorbikes, and mopeds. Total Crashes 4,231 Fatal Crashes 148 Injury Crashes 3,036 A Injury Crashes 1,066 Motorcyclists Killed 148 Motorcyclists Injured 3,312 Motorcyclists with A Injuries 1,177 Non-Motorcyclists Killed 2 Non-Motorcyclists Injured 216 Non-Motorcyclists with A Injuries 38 MOTORCYCLES INVOLVED IN CRASHES BY TYPE OF MANEUVER Motorcycle Maneuver Motorcycles Involved Going Straight Ahead 2,258 Passing/Overtaking 96 Making Left Turn 186 Making Right Turn 125 Slow/Stopped in Traffic 400 Skidding/Control Loss 572 Changing Lanes 73 Other 467 Parked 149 TOTAL 4,326 MOTORCYCLES INVOLVED IN SINGLE VEHICLE AND MULTI-VEHICLE CRASHES BY CRASH SEVERITY Fatal Injury A Injury Single Vehicle Collisions 69 1, Multi Vehicle Collisions 90 1,
51 Taxi Cabs Involved in Crashes by Collision Type and Crash Severity TYPE OF CRASH SEVERITY COLLISION Fatal Injury A Injury Property Damage Total Vehicle Overturned Pedestrian Train Pedalcyclist Animal Fixed Object Other Object Other Non-Collision Parked Rear-End ,148 1,475 Head-On Sideswipe-Same Direction Sideswipe-Opposite Direction Angle Turning TOTAL ,465 4,467 51
52 52
53 Division of Traffic Safety Programs The Division of Traffic Safety offers a number of traffic safety programs and services which focus attention on specific areas of concern. Information on the programs listed below can be acquired by the calling the telephone number listed. You may also request the information by writing the Illinois Department of Transportation, Division of Traffic Safety, at 1340 No. 9 th Street, Springfield, IL 62702, or by visiting our website at Crash Information Highway Safety Programs (217) (217) Local Accident Reference System (LARS) program. Occupant Protection. State route crash data. Impaired Driving. Crash data, such as that found in this publication. Traffic Records. Fatality Analysis Reporting System (FARS), Traffic Law Enforcement. including alcohol and drug-related fatal crash data. Motorcycle Safety. Distracted Driving. Bicycle/Pedestrian Safety. Occupant Protection Survey Information Commercial Vehicle Safety (217) (217) Motor Carrier Safety. Hazardous Materials Transportation. Operation Teen Safe Driving (OTSD) Commercial Vehicle Safety Audits. (217) Periodic Vehicle Inspection. School Bus Safety Inspection. Cycle Rider Safety Training Program* A. Northern Illinois University C. University of Illinois NIU Outreach Motorcycle Rider Program 155 N. 3 rd Ave, Suite 408 #4 Gerty Drive DeKalb, IL Champaign, IL (800) (800) (inside Illinois) (815) (217) B. Illinois State University D. Southern Illinois University Carbondale 5221 Motorcycle Safety Motorcycle Rider Program Campus Box 5221 Safety Center-Mail Code 6731 Normal, IL Douglas Drive (800) Carbondale, IL (309) (800) (618) *For motorcycle training course enrollment and information on course starting dates, times, and locations, contact a Regional Center by telephone or visit our website at Link to Traffic-Related Key Events 2012 Key Events.pdf 53
54 BLOOD ALCOHOL CONCENTRATION On July 2, 1997, a BAC of 0.08 or greater became the level at which a driver considered legally intoxicated in Illinois. Prior to July 2, 1997 the level was CRASH An occurrence which takes place on a public roadways, involves a moving motor vehicle and produces death, injury, or damage in excess of $1,500 to any one person s property when all drivers in the crash are insured. If any driver does not have insurance, the threshold is $500. (The change in threshold was effective on January 1, 2009). DRIVER An occupant who is in actual physical control of a motor vehicle or, for an out-of-control vehicle, an occupant who was in control until control was lost. When the term driver is used, it includes drivers of all types of motor vehicles, including cars, van, pickup trucks, motorcycles, tractor-trailers, emergency vehicles, and buses. FATALITY VS. FATAL CRASH A fatality is a death that results from a traffic crash. A fatal crash is a motor vehicle crash (single or multiple) that results in the death of one or more persons. B INJURY (non-incapacitating injury) Any injury, other than a fatal or incapacitating injury, which is evident to observers at the scene of the crash. Includes lump on head, abrasions, bruises, minor lacerations. C INJURY (possible injury) Any injury reported or claimed which is not either an A or B injury, Includes momentary unconsciousness, claims of injuries not evident, limping, complaint of pain, nausea, hysteria. LOCATION (URBAN) Includes location in or adjacent to a municipality or other urban area of over 5,000 population. LOCATION (RURAL) Includes all locations not classified as urban. MILEAGE DEATH RATE Fatalities per 100 million vehicle miles of travel (VMT). MOTORCYCLIST Any occupant, either operator (driver) or passenger, of a motorcycle. PEDALCYCLIST Any occupant of a non-motorized vehicle which is propelled by pedaling. Included in this pedalcycle category are bicycles, unicycles, and big wheels. PEDESTRIAN Any person who is not in or on a vehicle. INJURY CRASH Any motor vehicle crash that results in one or more non-fatal injuries. TRACTOR-TRAILER Alternative term for semi-truck. TRAVEL Vehicle miles driven. A INJURY (incapacitating injury) Any injury, other than a fatal injury, which prevents WORK ZONE CRASHES the injured person from walking, driving or normally A motor vehicle traffic crash in which the first harmful event continuing the activities he/she was capable of occurs within the boundaries of a work zone or an approach performing before the injury occurred. Includes severe to or exit from a work zone, resulting from an activity, behavior, lacerations, broken limbs, skull or chest injuries, and or control related to the movement of the traffic units through the abdominal injuries. work zone. (For a full definition of a work zone, see page 24). 54
Average Illinois 2nd Lowest Cost Silver Plans Cost Less Than Projected $312. Chicago Peoria ASPE-Derived Estimates from CBO
 Rate Levels Rates for benchmark plans are more than 25 percent below U.S. Health and Human Services (HHS) estimates based on Congressional Budget Office (CBO) projections $450 $400 $350 Average Illinois
Low Income Weatherization
 September 2013 CUBFacts Low Income Weatherization LOW INCOME WEATHERIZATION PROGRAMS Illinois Home Weatherization Assistance Program (IHWAP) If you meet certain low-income requirements, you may be eligible
2015 Analysis of Illinois Qualified Health Plans
 2015 Analysis of Illinois Qualified Health Plans Highlights of the 2015 Get Covered Illinois Marketplace Increased Options Number of plans increase from 165 in 2014 to 410 in 2015* - More platinum plan
Illinois Long-Term Care Ombudsmen
 State of Illinois Illinois Department on Aging Illinois Long-Term Care Ombudsmen Office of the Illinois Long-Term Care Ombudsmen Sally Petrone Neyna Johnson State Long-Term Care Ombudsman Deputy State
TRAIL FAQs for All Retirees,Annuitants and Survivors
 STATE TRAIL FAQs for All Retirees,Annuitants and Survivors If I am currently enrolled in TRAIL, do I need to fill out the TRAIL Open Enrollment Form again this year? No. Once you are enrolled in one of
PROPERTY TAX REDUCTION DOESN T SAVE FARMLAND AND IS LITTLE HELP TO FARMERS
 Henry George School Research Note #2 November, 1998 PROPERTY TAX REDUCTION DOESN T SAVE FARMLAND AND IS LITTLE HELP TO S Special property tax reductions have been established in apparent hope of making
Missing Children Report
 State of Illinois Rod R. Blagojevich, Governor Illinois State Police Larry G. Trent, Director Missing Children Report Fiscal Year Illinois State Police Annual Report I. INTRODUCTION The I-SEARCH program
Introduction. All of the County Health Rankings are based upon this model of population health improvement:
 2011 Illinois Introduction Where we live matters to our health. The health of a community depends on many different factors, including quality of health care, individual behavior, education and jobs,
Methamphetamine: Quick Facts
 State of Illinois Rod R. Blagojevich, Governor Illinois Criminal Justice Information Authority Lori G. Levin, Executive Director Trends in Measures of Methamphetamine Activities in Illinois First Judicial
New Health Insurance Tax Credits in Illinois
 New Health Insurance Tax Credits in Illinois Families USA Help Is at Hand: New Health Insurance Tax Credits in Illinois April 2013 by Families USA This publication is available online at www.familiesusa.org.
,OOLQRLV'HSDUWPHQWRI3XEOL +HDOWK
 ,OOLQRLV'HSDUWPHQWRI3XEOL +HDOWK /R DO+HDOWK'HSDUWPHQW 3HUVRQQHO&RPSHQVDWLRQ 6XUYH\5HSRUW *HRUJH + 5\DQ *RYHUQRU -RKQ 5 /XPSNLQ 0' 03+ 'LUHFWRU 6CDNGQH%QPVGPVU INTRODUCTION...3 PROGRAMS...4 Home Health
THOSE WHO EXCEL. Education Awards Program 2015-2016 Application. Illinois TEACHER OF THE YEAR
 NAME CATEGORY SCHOOL DISTRICT NAME SCHOOL DISTRICT NUMBER THOSE WHO EXCEL Education Awards Program 2015-2016 Application Illinois TEACHER OF THE YEAR Illinois State Board of Education Public Information
How to file for the emancipation of a minor in Illinois Supplement. Updated: 3/16/05
 How to file for the emancipation of a minor in Illinois Supplement Updated: 3/16/05 This supplement includes a forms guide as well as forms. The forms guide is for use in filling out the forms. For more
Elder Abuse Provider Agencies
 State of Illinois Illinois Department on Aging John K. Holton, Director Elder Abuse Provider Agencies Area 1... 2 Boone, Carroll, DeKalb, JoDaviess, Lee, Ogle, Stephenson, Whiteside and Winnebago Counties
Adult Protective Services Provider Agencies
 State of Illinois Illinois Department on Aging John K. Holton, Director Adult Protective Services Provider Agencies Area 1... 2 Boone, Carroll, DeKalb, JoDaviess, Lee, Ogle, Stephenson, Whiteside and Winnebago
Aurora Region 280 East Indian Trail Aurora, Illinois 60505 1733 Counties served: DuPage, Kane, and Lake
 Child Support Services The Illinois child support program is run by the Illinois Department of Healthcare and Family Services. There are 102 counties in the State of Illinois. Child Support is set up in
NAME CATEGORY SCHOOL DISTRICT NAME SCHOOL DISTRICT NUMBER THOSE WHO EXCEL. Education Awards Program 2016-2017 Application.
 NAME CATEGORY SCHOOL DISTRICT NAME SCHOOL DISTRICT NUMBER THOSE WHO EXCEL Education Awards Program 2016-2017 Application Illinois TEACHER OF THE YEAR Illinois State Board of Education Public Information
Community Care Program Case Coordination Units
 State of Illinois Rod R. Blagojevich, Governor Illinois Department on Aging Charles D. Johnson, Director Community Care Program Case Coordination Units Illinois... 2 Area 1... 3 Boone, Carroll, DeKalb,
Overview of Caterpillar Healthcare Benefit Changes Healthcare Benefits Annual Enrollment
 2015 Overview of Caterpillar Healthcare Benefit Changes Healthcare Benefits Annual Enrollment November 17-28, 2014 (Active employees) November 10-21, 2014 (Retirees, Survivors and COBRA) Overview of 2015
Research Bulletin. Methamphetamine in Illinois: An examination of an emerging drug. Illinois Criminal Justice Information Authority
 Vol. 1, No. 2 January 2003 Methamphetamine in Illinois: An examination of an emerging drug By Robert W. Bauer ICJIA Senior Research Analyst The threat posed to the United States by methamphetamine lies
SEX OFFENDER REGISTRATION TION IN ILLINOIS. December 2003. Local Law Enforcement. Training. Courts/State s Attorney.
 SEX OFFENDER REGISTRATION TION IN ILLINOIS Local Law Enforcement Training Courts/State s Attorney Parole/Probation December 2003 Illinois State Police isp5-622 (2/04) A STUDY OF SEX OFFENDER REGISTRATION
INFORMATIONAL NOTICE. Care Coordination Enrollment for Children, Families and ACA Adults
 Pat Quinn, Governor Julie Hamos, Director 201 South Grand Avenue East Telephone: (217) 782-1200 Springfield, Illinois 62763-0002 TTY: (800) 526-5812 INFORMATIONAL NOTICE DATE: May 23, 2014 TO: RE: All
Your rights as a landlord or tenant in Illinois -- Supplement8
 Your rights as a landlord or tenant in Illinois -- Supplement8 This supplement includes a forms guide as well as forms. The forms guide is for use only in filling out the forms. For more information about
Colorectal Cancer in Illinois: An Overview of Key Statistics
 State of Illinois Illinois Department of Public Health Colorectal Cancer in Illinois: An Overview of Key Statistics Epidemiologic Report Series 11:04 June 2011 COLORECTAL CANCER IN ILLINOIS: AN OVERVIEW
If you have issues viewing or accessing this file contact us at NCJRS.gov.
 If you have issues viewing or accessing this file contact us at NCJRS.gov. DUI 1986 FACTBOOK 1986 Illinois DUI Arrest Rate Jim Edgar - Illinois Secretary of State -- U.S. Department of Justice Nalionallnstilute
OHIO. T r a f f i c C r a s h F a c t s. 01/01/2011 to 12/31/2011. All Counties. for the County(s)
") OHIO T r a f f i c C r a s h F a c t s 01/01/2011 to 12/31/2011 for the County(s) All Counties Ohio Department of Public Safety Traffic Crash Facts List of Tables Chapter 1 - General Statistics Table 1.01
OHIO T r a f f i c C r a s h F a c t s 01/01/2011 to 12/31/2011 for the County(s) All Counties Ohio Department of Public Safety Traffic Crash Facts List of Tables Chapter 1 - General Statistics Table 1.01
LOCAL IMPACT OF GOVERNOR RAUNER S PROPOSED FY 16 BUDGET ON CENTRAL ILLINOIS
 LOCAL IMPACT OF GOVERNOR RAUNER S PROPOSED FY 16 BUDGET ON CENTRAL ILLINOIS April 29, 2015 Background Despite warnings from bond houses that a failure to extend 2014 income tax rates would cause serious
Answers to your questions...page 2. Questions about the medical indemnity plan...page 4. Questions about the managed care plans...
 Table of Contents Answers to your questions...page 2 Questions about the medical indemnity plan...page 4 Questions about the managed care plans...page 5 Monthly premiums...page 7 Coverage Comparison Table...page
How To Know If You Can Ride A Motorcycle
 Motorcycle Safety Program Initiatives: Achievement and Challenges Mehdi Nassirpour Illinois Department of Transportation Division of Transportation Safety Objectives 1. General Statistics on Motorcycles
ILLINOIS VEHICLE INSPECTION REGULATIONS ILLINOIS DEPARTMENT OF TRANSPORTATION DIVISION OF TRAFFIC SAFETY BUREAU OF SAFETY PROGRAMS CONTENTS
 ILLINOIS VEHICLE INSPECTION REGULATIONS ILLINOIS DEPARTMENT OF TRANSPORTATION DIVISION OF TRAFFIC SAFETY BUREAU OF SAFETY PROGRAMS CONTENTS PART Part 446 Part 450 Part 451 Part 453 Part 454 Part 460 DESCRIPTION
MISSOURI EMERGENCY SERVICE VEHICLE CRASHES
 2004 MISSOURI EMERGENCY SERVICE VEHICLE CRASHES Principal Staff Researcher: Phyllis Emmel, Research Analyst MISSOURI STATE HIGHWAY PATROL STATISTICAL ANALYSIS CENTER 1510 East Elm Jefferson City, Missouri
Motorcycle Related Crash Victims (What the Statistics Say) Mehdi Nassirpour Illinois Department of Transportation Division of Transportation Safety
 Mehdi Nassirpour Illinois Department of Transportation Division of Transportation Safety") Motorcycle Related Crash Victims (What the Statistics Say) Mehdi Nassirpour Illinois Department of Transportation Division of Transportation Safety Illinois Highway Safety Program Areas Occupant Protection
Motorcycle Related Crash Victims (What the Statistics Say) Mehdi Nassirpour Illinois Department of Transportation Division of Transportation Safety Illinois Highway Safety Program Areas Occupant Protection
St. Louis Post- Dispatch
 A Division of Bankrate, Inc. Reach 1,000,000+ Missouri Readers St. Louis Post- Dispatch CD & Deposit Guide CD & Deposit Guide About Bankrate Print Offers flexibility to market your financial products on
Illinois Department of Revenue
 Illinois Department of Revenue Education Program PTAX-1032 (R-04/13) Page 2 Illinois Department of Revenue Education Program Table of Contents IDOR Education Program... 5 General information...5 CIAO designation
How to collect a money judgment in Illinois -- Supplement
 How to collect a money judgment in Illinois -- Supplement This supplement includes a forms guide as well as forms. The forms guide is for use only in filling out the forms. For more information about what
Understanding Where You Stand: A Simple Guide To Your FINANCIAL STATEMENTS
 Understanding Where You Stand: A Simple Guide To Your FINANCIAL STATEMENTS Illinois Small Business Development Centers "Experts, networks, and tools to transform your business" Illinois Small Business
Equip for Equality Special Education Clinic
 The goal of this toolkit is to provide the information and resources families need to recognize and utilize early childhood intervention programs in Illinois. It is made possible through the generous support
MISSOURI TRAFFIC SAFETY COMPENDIUM
 2010 MISSOURI TRAFFIC SAFETY COMPENDIUM MISSOURI STATE HIGHWAY PATROL STATISTICAL ANALYSIS CENTER 1510 East Elm Jefferson City, Missouri 65101 (573) 751-9000 CONTENTS PAGE EXECUTIVE SUMMARY INTRODUCTION...1
How To Improve Workers Compensation In Illinois
 15 MAJOR ILLINOIS WORKERS COMP REFORMS Of 2011.. hib1698 By lfrlorkcomp Chicago 1) CAUSATION CODIFIED: an employee bears the burden of showing, by a preponderance of the evidence, that he or she has sustained
Illinois Department of. Children & Family Services. Post Adoption and Guardianship Services
 Illinois Department of Children & Family Services Post Adoption and Guardianship Services 1 2 Post Adoption and Guardianship Services The Department of Children and Family Services (DCFS) realizes the
The Basics of the. Structure Contact Information Officers Committees Accomplishments Websites votervoice
 The Basics of the Structure Contact Information Officers Committees Accomplishments Websites votervoice Latest update by the Information Services Committee March 28, 2014 Mission Statement The Illinois
Road Safety Authority Provisional Review of Road Crashes 2013
 A review of 2013 fatal collision statistics December 31 st 2013 The following report summarises the main trends that have emerged in 2013. This has been prepared by the Road Safety Authority following
Census of Fatal Occupational. Injuries and Illnesses. Illinois, 1998
 Census of Fatal Occupational Injuries and Illnesses Illinois, 1998 A Publication of the Illinois Department of Public Health Division of Epidemiologic Studies Springfield, IL 62761 October 1999 This project
EMERGENCY CONTACT DATABASE
 A message from Secretary of State Jesse White 5 DUI Fact Book I am pleased to provide this 5 Illinois DUI Fact Book, which features factual information about Illinois efforts to combat drunk driving. Illinois
ALCOHOL, 2013 HIGHLIGHTS
 ALCOHOL, 2013 JUNE 2014 ISSUE 14-C08 HIGHLIGHTS During 2013, there were 114 fatal alcohol-impaired collisions in the state (16 percent of all fatal collisions). Alcohol-impaired fatal collisions decreased
New Mexico Traffic Crash Annual Report 2011
 New Mexico Traffic Crash Annual Report 2011 New Mexico Department of Transportation Planning and Traffic Safety Division New Mexico Department of Transportation Planning and Traffic Safety Division P.O.
Mine Subsidence Insurance. Required Disclosures. Assigning Claim Rights ILLINOIS MINE SUBSIDENCE INSURANCE FUND
 Buying or selling a home in Mine Subsidence Areas Mine Subsidence Insurance Required Disclosures Assigning Claim Rights ILLINOIS MINE SUBSIDENCE INSURANCE FUND OVERVIEW This information is intended to
Pedestrian and Bicycle Crash Data Analysis: 2005-2010
 MICHIGAN DEPARTMENT OF TRANSPORTATION Pedestrian and Bicycle Crash Data Analysis: 2005-2010 FINAL REPORT Prepared by: T.Y. Lin International and Western Michigan University 4/3/2012 TABLE OF CONTENTS List
Year Fatalities Injuries
 MOTORCYCLES, 2013 MAY 2014 ISSUE 14-C02 HIGHLIGHTS In 2013, the 113 Indiana fatal collisions involving motorcycles resulted in 118 fatalities. The 118 fatalities involved 81 motorcycle operators, 23 moped
DANGEROUS DRIVING, 2013
 DANGEROUS DRIVING, 2013 JUNE 2014 ISSUE 14-C06 HIGHLIGHTS In 2013, 24,768 of the 193,013 traffic collisions (13 percent) that occurred in Indiana involved one or more actions defined as dangerous driving.
Report Compiled by the Florida Department of Highway Safety and Motor Vehicles
 Report Compiled by the Florida Department of Highway Safety and Motor Vehicles 2009 Florida Quick Facts: Definitions: Bicycle A vehicle propelled solely by human power or a motorized bicycle propelled
OREGON TRAFFIC ACCIDENT AND INSURANCE REPORT
 DMV OREGON TRAFFIC ACCIDENT AND INSURANCE REPORT Tear this sheet off your report, read and carefully follow the directions. ONLY drivers involved in an accident resulting in any of the following MUST file
SHOULD I PURCHASE MINE SUBSIDENCE INSURANCE?
 SHOULD I PURCHASE MINE SUBSIDENCE INSURANCE? Understanding Mine Subsidence Determining Mine Locations Obtaining Mine Subsidence Insurance ILLINOIS MINE SUBSIDENCE INSURANCE FUND OVERVIEW This information
Speeding. Probability of death at different impact speeds
 Speeding CRASH FACTSHEET 2012 CRASH STATISTICS FOR THE YEAR ENDED 31 DECEMBER 2011 Prepared by the Ministry of Transport In this fact sheet speeding is defined as driving too fast for the conditions. The
Traffic Safety Facts. Children. 2003 Data. Motor vehicle crashes are the leading cause of death for children from 2 to 14 years old.
 Traffic Safety Facts 2003 Data DOT HS 809 762 Children Motor vehicle crashes are the leading cause of death for children from 2 to 14 years old. In 2003, there were more than 60 million children under
For further information contact: Alberta Transportation Office of Traffic Safety Main Floor, Twin Atria Building 4999 98 Avenue Edmonton, Alberta T6B
 Alberta Traffic Collision Statistics 2013 Alberta Traffic Collision Statistics 2013 For further information contact: Alberta Transportation Office of Traffic Safety Main Floor, Twin Atria Building 4999
DOT HS 809 360 October 2001
 U.S. Department of Transportation National Highway Traffic Safety Administration DOT HS 809 360 October 2001 Technical Report This document is available to the public from the National Technical Information
For further information contact: Alberta Transportation Office of Traffic Safety Main Floor, Twin Atria Building 4999 98 Avenue Edmonton, Alberta T6B
 Alberta Traffic Collision Statistics 2012 Alberta Traffic Collision Statistics 2012 For further information contact: Alberta Transportation Office of Traffic Safety Main Floor, Twin Atria Building 4999
DMV. OREGON TRAFFIC ACCIDENT AND INSURANCE REPORT Tear this sheet off your report, read and carefully follow the directions.
 OREGON TRAFFIC ACCIDENT AND INSURANCE REPORT Tear this sheet off your report, read and carefully follow the directions. ONLY drivers involved in an accident resulting in any of the following MUST file
Traffic Safety Facts 2008 Data
 Traffic Safety Facts 2008 Data Bicyclists and Other Cyclists DOT HS 811 156 Bicyclists and other cyclists include riders of two-wheel nonmotorized vehicles, tricycles, and unicycles powered solely by pedals.
TABLE OF CONTENTS INTRODUCTION ----------------------------------------------------------------------------------- 1
 TABLE OF CONTENTS INTRODUCTION ----------------------------------------------------------------------------------- 1 FIGURE 1 VEHICLES, DRIVERS AND FATALITY RATE, 1966-2010 ---------------------------------------------------
Kentucky Transportation Center
 Kentucky Transportation Center Research Report KTC-12-13/KSP2-11-1F ANALYSIS OF TRAFFIC CRASH DATA IN KENTUCKY (2007-2011) Our Mission We provide services to the transportation community through research,
Montana Traffic Safety Problem Identification FFY 2011
 Montana Traffic Safety Problem Identification FFY 2011 2009 Data State Highway Traffic Safety Office Montana Department of Transportation 2701 Prospect Avenue Helena, Montana 59620-1001 http://www.mdt.mt.gov/safety/safetyprg.shtml
INDIANA TRAFFIC SAFETY QUICK FACTS - 2011
 INDIANA TRAFFIC SAFETY QUICK FACTS - 2011 188,132 traffic collisions resulting in injury or property damage occurred, a 2.5 percent decrease from 2010. There were 674 fatal collisions in 2011 (resulting
DOT HS 812 101 December 2014. 2013 Motor Vehicle Crashes: Overview 6.00 50,000. Fatality Rate per 100M VMT
 TRAFFIC SAFETY FACTS Research Note DOT HS 812 101 December 2014 2013 Motor Vehicle Crashes: Overview After an increase in motor vehicle crash fatalities in 2012, fatalities on U.S. roadways in 2013 resumed
Indiana Department of Homeland Security July 2007 Statewide Amateur Radio Emergency Communications Test
 8OM 8OM 6 M 40 M 2 M 440 6 M FM ECHO LINK LOCAL NET CHECK-IN S Adams Yes Allen Bartholomew 7 Benton Blackford Boone Brown Carroll Cass Clark Clay Clinton Crawford Daviess Dearborn Decatur Dekalb Delaware
How To Know If A Cyclist Is Safe
 ATSB ROAD SAFETY REPORT July 2006 Deaths of cyclists due to road crashes ATSB ROAD SAFETY REPORT July 2006 Deaths of cyclists due to road crashes Published by: Australian Transport Safety Bureau Postal
GEICO produced DVD REAL TEEN DRIVING. 4 real teens in real driving situations in-car cameras no scripts it s all very, very real
 GEICO is: proud to be the nation s fastest growing auto insurer proud to serve more than 10 million policyholders proud to help spread the message on safe driving to new drivers and their families GEICO
DOT HS 812 018 April 2014
 TRAFFIC SAFETY FACTS 2012 Data DOT HS 812 018 April 2014 Bicyclists and Other Cyclists In 2012, 726 pedalcyclists were killed and an additional 49,000 were injured in motor vehicle traffic crashes. Pedalcyclist
State of Illinois. Emergency Alert System State Plan. June 2006. Post this plan at each control point with the F.C.C. EAS Handbook
 State of Illinois Emergency Alert System State Plan June 2006 Post this plan at each control point with the F.C.C. EAS Handbook Table of Contents Purpose... 3 Introduction... 3 General Considerations...
Drunk Driving Accident Statistics
 Drunk Driving Accident Statistics Drunk Driving Legal Resources Drunk Driving Laws by State Video - Rights of Injured Drivers Defective Car Products & Parts Steps to Take After a Car Crash Auto Accident
How To Be Safe
 TRAFFIC SAFETY FACTS 2011 Data DOT HS 811 743 April 2013 Bicyclists and Other Cyclists In 2011, 677 pedalcyclists were killed and an additional 48,000 were injured in motor vehicle traffic crashes. Pedalcyclist
How To Know How Many People Die In A Car Crash
 TRAFFIC SAFETY FACTS Research Note DOT HS 811 856 November 2013 2012 Motor Vehicle Crashes: Overview Motor vehicle crashes and fatalities increased in 2012 after six consecutive years of declining fatalities
HealthWorks Contacts
 HealthWorks Contacts AGENCY: Adams County Health Dept. COUNTIES SERVED: ADDRESS: 330 Vermont St., Quincy, IL 62301 Adams MAIN PHONE: 217-222-8440 Brown FAX: 217-277-2013 Calhoun Greene Alison Ketsenburg
the Ministry of Transport is attributed as the source of the material
 Disclaimer All reasonable endeavours are made to ensure the accuracy of the information in this report. However, the information is provided without warranties of any kind including accuracy, completeness,
NEWS October 2015. Molina Healthcare Secures New Transportation Vendor
 NEWS October 2015 Molina Healthcare Secures New Transportation Vendor On December 1, 2015 Molina Healthcare (Molina) will transition its transportation vendor from LogistiCare to Secure Transportation,
Kentucky Transportation Center
 Kentucky Transportation Center Research Report KTC -13-13/KSP2-11-1F Analysis of Traffic Crash Data in Kentucky (2008-2012) Our Mission We provide services to the transportation community through research,
 June 2006 Dear Traffic Safety Partners: The Wisconsin Department of Transportation, Bureau of Transportation Safety is pleased to provide you with a copy of the 2003 Wisconsin Alcohol Traffic Facts book.
Litigation Imbalance
 Civil Justice Study November 2005 Litigation Imbalance The Need For Venue Reform In Illinois A Ten-Year Analysis Of Venue Disparities In Illinois System of Civil Justice 1994-2003 A Study Conducted By:
DOT HS 811 870 December 2013
 TRAFFIC SAFETY FACTS 2012 Data DOT HS 811 870 December 2013 Alcohol-Impaired Driving Drivers are considered to be alcohol-impaired when their blood alcohol concentration (BAC) is.08 grams per deciliter
Psychiatry Practice Incentive Program Annual Report to the Illinois General Assembly. March 2016
 Psychiatry Practice Incentive Program Annual Report to the Illinois General Assembly March 2016 Illinois Department of Public Health Psychiatry Practice Incentive Program Report for Calendar Year 2015
Clinics Providing STD Diagnosis and Treatment in Illinois by County
 ADAMS FAMILY PLANNING-STD CLINIC 636 HAMPSHIRE ST. SUITE 201 QUINCY Tuesday through Friday 8:30 a.m. to 6:00 p.m. QUINCY 62301 217-224-6877 ALEXANDER SOUTHERN SEVEN HD 3014 ELM ST. CAIRO 8:30 a.m. to 4:30
Traffic Collision Statistics Report
 Traffic Collision Statistics Report 2012 EXECUTIVE SUMMARY Executive Summary 2012 Traffic Collision Statistics Report Executive Summary Motor vehicle collisions resulting in a fatality, injury or property
Traffic Safety Facts. Alcohol-Impaired Driving. 2013 Data. Overview. Key Findings
 Traffic Safety Facts 2013 Data December 2014 DOT HS 812 102 Alcohol-Impaired Driving Key Findings There were 10,076 fatalities in 2013 in crashes involving a driver with a BAC of.08 or higher; this was