Predicting Influentials in Online Social Networks
|
|
|
- Mercy Malone
- 10 years ago
- Views:
Transcription
1 Predicting Influentials in Online Social Networks Rumi Ghosh Kristina Lerman USC Information Sciences Institute

2 WHO is IMPORTANT? Characteristics Topology Dynamic Processes /Nature of flow What are the suitable METRICS that can be used to PREDICT influentials in social network? Characteristics Dynamic Process How do we EVALUATE predictive models of influence? Social Web

3 Contributions Prediction of Influence Classification of influence models : Conservative and Non-conservative The details of the underlying dynamic process on a network should match those of the influence model. Page Rank is not always the best! Evaluation of Influence Empirical Measure of Influence (Statistically Significant) Social News Aggregator Digg Dynamic Process-Information propagation First work evaluating predictive models of influence, using the actual dynamic process, occurring in a social network Mathematical formulation and analytical proofs Normalized -Centrality

4 Dynamic Processes Classification of Dynamic Processes on Networks Conservative Non-conservative

5 Conservative Process $ $ $ $ $ $ $ $ $ Blue Bags in the network=8 Social Web

6 Conservative Process Blue Bags in the network=8 $ $ $ $ $ $ Social Web $ $ $

7 Conservative Process Blue Bags in the network=8 $ $ $ $ $ $ $ Social Web $ $

8 Non-Conservative Process On Twitter Spain Win Posts in the network=1 Social Web

9 Non-Conservative Process On Twitter Spain Win On Twitter Spain Win Posts in the network=3 Social Web On Twitter Spain Win

10 Non-Conservative Process On Twitter Spain Win On Twitter Spain Win Posts in the network=5 On Twitter Spain Win On Twitter Spain Win Social Web On Twitter Spain Win

11 Quantifying Influence Exists empirical studies, structural models Two ways to quantify influence 1 Empirically measure online social behavior or dynamic processes to estimate influence [Lee,Cha] 2 Use influence models (centrality metrics) based on the structure of the underlying social network to predict influence. We evaluate predictive influence models using empirical measures of influence.

12 Predictive Influence Models Geodesic Path Based ranking measures Closeness centrality [Hakimi, Sabidussi, Wassermann et al, Lin] Graph centrality [Hage at al.] Betweenness centrality [Freeman] Topological ranking measures Markov Process Based Ranking Measures Page Rank[Brin et al.] Hubbel s Model Degree Centrality In-degree Out-degree Centrality Path-Based Ranking Measures -centrality [Bonacich] normalized -centrality Katz score [Katz] SenderRank [Kiss et al.] EigenVector centrality [Bonacich]
![] Betweenness centrality [Freeman] Topological ranking measures Markov Process Based Ranking Measures Page Rank[Brin et al.](/docs-images/43/6678080/images/page_12.jpg "] Hubbel s Model Degree Centrality In-degree Out-degree Centrality Path-Based Ranking Measures -centrality [Bonacich]")
13 Classification of Influence Models Non-Conservative Conservative Topological Ranking Measures Degree Centrality In-degree Centrality Out-degree Centrality Path-Based Ranking Measures -centrality Normalized -centrality Katz Score SenderRank Eigenvector Centrality Geodesic Path-Based Ranking Measures Closeness Centrality Graph Centrality Betweenness Centrality Topological Ranking Measures Markov Process Based Ranking Measures Page Rank Hubbel s Model

14 Page Rank C pr, (i) (1 ) 1 n j fan(i) C pr, (j) d j out Page Rank
 d j out Page")
15 Degree Centrality Degree centrality C d in(i) d in (i) C d out(i) d out (i) C d in out(i) d in (i) d out (i)
 d in (i) d out")
16 -centrality (Bonacich) C,k A A 2... n A n 1... all paths <=5 k i A i where 1 1 i 0 Parameter sets the length scale of interactions Mean path length=(1- ) -1

17 Normalized -centrality C,k k i 0 i A i 2 3 NC,k i, j 1 (C,k ) i, j C,k

18 Normalized -centrality -centrality Matrix: C,k C k t 0 t A t -centrality: vc,k v(i A) 1 where 1 1 NC,k n i, j Normalized -centrality: vc,k (C,k ) ij Simple Algorithm Does not depend on eigenvalue computation(unlike -centrality) We give analytical proofs and conditions for Equivalence of ranking due to normalized -centrality and -centrality Equivalence of ranking due to eigenvector centrality and normalized -centrality Convergence of normalized -centrality Criteria for parametric independence of normalized -centrality Other analytical proofs for limiting conditions and boundary values.

19 Which model best predicts influentials? Evaluation?

20 Information Flow on Digg Post submitter
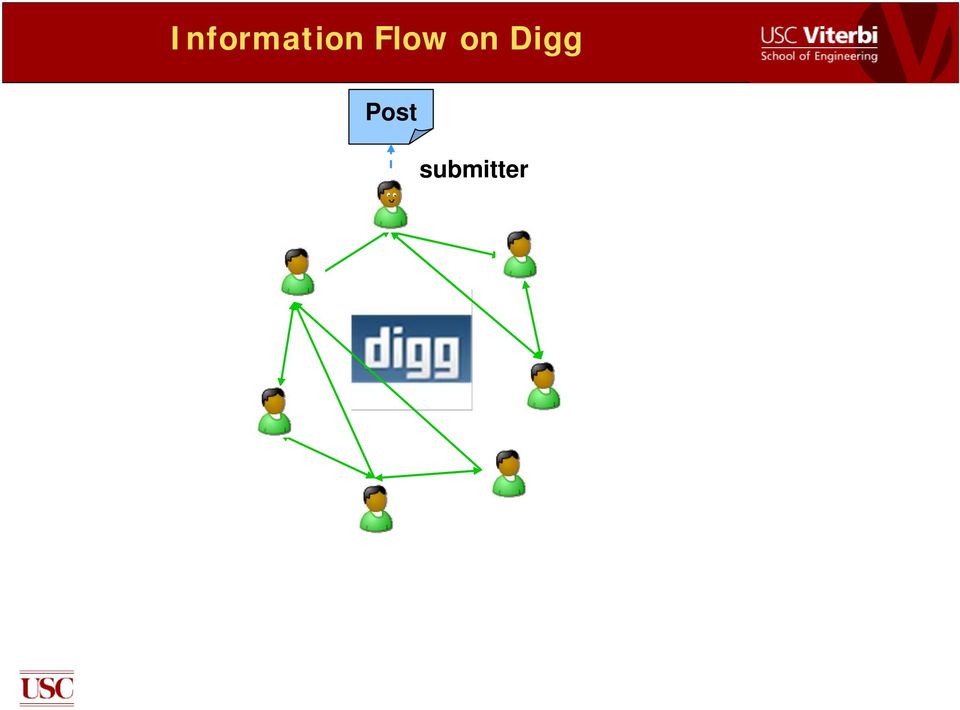
21 Information Flow on Digg Post submitter fan fan fan
22 Information Flow on Digg Post Post submitter Fan vote Post Fan vote
23 Information Flow on Digg Post Post submitter Post Non-Conservative Information Propagation on Digg Hypothesis: non-conservative influence model best predicts influentials
24 Data Collection-Digg Post Post submitter 3553 stories 587 distinct submitters 139,410 distinct voters Post Post Of 574 connected submitters belonging to the friendship network, 504 submitters received at least 1 fan vote in first 100 votes (in at least 1 story). Social network: voter connected to at one or more voters 69,524 connected voters 574 connected submitters 3489 stories
25 Estimation of Influence Probability of a fan vote Influence of Submitter Quality of the story Story Quality Random variable Average out by aggregating fan votes over all stories submitted by the same submitter 289 submitters at least 2 stories Estimate of Influence Average fan votes Rank Users
26 Statistical Significance of Fan Votes as a Measure of Influence fan Post submitter fan URN MODEL fan Users in OSN (N) Fans of submitter in OSN (K) No. of users who voted (n) No. of fans who voted (k) P(X k K,N,n) K N k k n k N n Balls in the urn (N) White balls in the urn (K) No. of balls picked (n) No of white balls picked (k) (Hypergeometric Dist.)
27 Statistical Significance (Results) r k 65 (1 e ( K ) 0.86 ) P(X k K 10,69524,100) Probability of <k> fan votes in first 100 votes, given the submitter has K fans, happening purely by chance is negligible
28 Evaluation of Influence Predictions Correlation with the empirical estimate of influence Avg. # of fan votes in first 100 votes =damping (attenuation factor) in PageRank, (normalized) -centrality, SenderRank
29 Evaluation of Influence Prediction Top 100 users Recall Recall 0 Normalized alpha In-degree emp(i) [1,100] pred(i) [169,524] R emp pred emp Page-Rank Betweenness
30 Results on Digg Results corroborate our hypothesis Since underlying non-conservative dynamic process of (normalized) -centrality most closely resembles the dynamic process of information propagation on Digg (normalized) -centrality is a better predictor of influential users on Digg than other influence models.
31 Conclusion How to choose Prediction Models? First work classifying influence models into conservative and nonconservative To get the best predictions choose that influence model whose the implicit dynamic process matches that on the network How to evaluate Influence Models? First work evaluating predictive models of influence using the empirical measurements obtained from the network itself Novel Method of evaluation Evaluate using influence score estimated empirically from the network Social News Aggregator Digg Dynamic Process-Information propagation Non-conservative influence models best predict influentials on Digg where the underlying dynamic process of information propagation is non-conservative in nature. Normalized -Centrality Mathematical formulation and analytical proofs
Dynamics of information spread on networks. Kristina Lerman USC Information Sciences Institute
 Dynamics of information spread on networks Kristina Lerman USC Information Sciences Institute Information spread in online social networks Diffusion of activation on a graph, where each infected (activated)
Social Media Mining. Network Measures
 Klout Measures and Metrics 22 Why Do We Need Measures? Who are the central figures (influential individuals) in the network? What interaction patterns are common in friends? Who are the like-minded users
Practical Graph Mining with R. 5. Link Analysis
 Practical Graph Mining with R 5. Link Analysis Outline Link Analysis Concepts Metrics for Analyzing Networks PageRank HITS Link Prediction 2 Link Analysis Concepts Link A relationship between two entities
Social and Technological Network Analysis. Lecture 3: Centrality Measures. Dr. Cecilia Mascolo (some material from Lada Adamic s lectures)
") Social and Technological Network Analysis Lecture 3: Centrality Measures Dr. Cecilia Mascolo (some material from Lada Adamic s lectures) In This Lecture We will introduce the concept of centrality and
Social and Technological Network Analysis Lecture 3: Centrality Measures Dr. Cecilia Mascolo (some material from Lada Adamic s lectures) In This Lecture We will introduce the concept of centrality and
Social Network Mining
 Social Network Mining Data Mining November 11, 2013 Frank Takes ([email protected]) LIACS, Universiteit Leiden Overview Social Network Analysis Graph Mining Online Social Networks Friendship Graph Semantics
Healthcare Analytics. Aryya Gangopadhyay UMBC
 Healthcare Analytics Aryya Gangopadhyay UMBC Two of many projects Integrated network approach to personalized medicine Multidimensional and multimodal Dynamic Analyze interactions HealthMask Need for sharing
Algorithms for representing network centrality, groups and density and clustered graph representation
 COSIN IST 2001 33555 COevolution and Self-organization In dynamical Networks Algorithms for representing network centrality, groups and density and clustered graph representation Deliverable Number: D06
Performance Metrics for Graph Mining Tasks
 Performance Metrics for Graph Mining Tasks 1 Outline Introduction to Performance Metrics Supervised Learning Performance Metrics Unsupervised Learning Performance Metrics Optimizing Metrics Statistical
Information Flow and the Locus of Influence in Online User Networks: The Case of ios Jailbreak *
 Information Flow and the Locus of Influence in Online User Networks: The Case of ios Jailbreak * Nitin Mayande & Charles Weber Department of Engineering and Technology Management Portland State University
Risk Mitigation Strategies for Critical Infrastructures Based on Graph Centrality Analysis
 Risk Mitigation Strategies for Critical Infrastructures Based on Graph Centrality Analysis George Stergiopoulos a, Panayiotis Kotzanikolaou b, Marianthi Theocharidou c, Dimitris Gritzalis a, a Information
Walk-Based Centrality and Communicability Measures for Network Analysis
 Walk-Based Centrality and Communicability Measures for Network Analysis Michele Benzi Department of Mathematics and Computer Science Emory University Atlanta, Georgia, USA Workshop on Innovative Clustering
Part 1: Link Analysis & Page Rank
 Chapter 8: Graph Data Part 1: Link Analysis & Page Rank Based on Leskovec, Rajaraman, Ullman 214: Mining of Massive Datasets 1 Exam on the 5th of February, 216, 14. to 16. If you wish to attend, please
SGL: Stata graph library for network analysis
 SGL: Stata graph library for network analysis Hirotaka Miura Federal Reserve Bank of San Francisco Stata Conference Chicago 2011 The views presented here are my own and do not necessarily represent the
Facebook Friend Suggestion Eytan Daniyalzade and Tim Lipus
 Facebook Friend Suggestion Eytan Daniyalzade and Tim Lipus 1. Introduction Facebook is a social networking website with an open platform that enables developers to extract and utilize user information
! E6893 Big Data Analytics Lecture 10:! Linked Big Data Graph Computing (II)
") E6893 Big Data Analytics Lecture 10: Linked Big Data Graph Computing (II) Ching-Yung Lin, Ph.D. Adjunct Professor, Dept. of Electrical Engineering and Computer Science Mgr., Dept. of Network Science and
E6893 Big Data Analytics Lecture 10: Linked Big Data Graph Computing (II) Ching-Yung Lin, Ph.D. Adjunct Professor, Dept. of Electrical Engineering and Computer Science Mgr., Dept. of Network Science and
1 o Semestre 2007/2008
 Departamento de Engenharia Informática Instituto Superior Técnico 1 o Semestre 2007/2008 Outline 1 2 3 4 5 Outline 1 2 3 4 5 Exploiting Text How is text exploited? Two main directions Extraction Extraction
Valuation of Network Effects in Software Markets
 Andreas Kemper Valuation of Network Effects in Software Markets A Complex Networks Approach Physica-Verlag Contents Part I Introduction ^x 1 Background and Motivation 3 1.1 Research Objectives 5 1.2 Research
Big Data Analytics of Multi-Relationship Online Social Network Based on Multi-Subnet Composited Complex Network
 , pp.273-284 http://dx.doi.org/10.14257/ijdta.2015.8.5.24 Big Data Analytics of Multi-Relationship Online Social Network Based on Multi-Subnet Composited Complex Network Gengxin Sun 1, Sheng Bin 2 and
How To Understand The Network Of A Network
 Roles in Networks Roles in Networks Motivation for work: Let topology define network roles. Work by Kleinberg on directed graphs, used topology to define two types of roles: authorities and hubs. (Each
Statistical Machine Learning
 Statistical Machine Learning UoC Stats 37700, Winter quarter Lecture 4: classical linear and quadratic discriminants. 1 / 25 Linear separation For two classes in R d : simple idea: separate the classes
Social Media Mining. Data Mining Essentials
 Introduction Data production rate has been increased dramatically (Big Data) and we are able store much more data than before E.g., purchase data, social media data, mobile phone data Businesses and customers
Content-Based Discovery of Twitter Influencers
 Content-Based Discovery of Twitter Influencers Chiara Francalanci, Irma Metra Department of Electronics, Information and Bioengineering Polytechnic of Milan, Italy [email protected] [email protected]
The PageRank Citation Ranking: Bring Order to the Web
 The PageRank Citation Ranking: Bring Order to the Web presented by: Xiaoxi Pang 25.Nov 2010 1 / 20 Outline Introduction A ranking for every page on the Web Implementation Convergence Properties Personalized
Search engines: ranking algorithms
 Search engines: ranking algorithms Gianna M. Del Corso Dipartimento di Informatica, Università di Pisa, Italy ESP, 25 Marzo 2015 1 Statistics 2 Search Engines Ranking Algorithms HITS Web Analytics Estimated
CI6227: Data Mining. Lesson 11b: Ensemble Learning. Data Analytics Department, Institute for Infocomm Research, A*STAR, Singapore.
 CI6227: Data Mining Lesson 11b: Ensemble Learning Sinno Jialin PAN Data Analytics Department, Institute for Infocomm Research, A*STAR, Singapore Acknowledgements: slides are adapted from the lecture notes
UCINET Visualization and Quantitative Analysis Tutorial
 UCINET Visualization and Quantitative Analysis Tutorial Session 1 Network Visualization Session 2 Quantitative Techniques Page 2 An Overview of UCINET (6.437) Page 3 Transferring Data from Excel (From
Model Combination. 24 Novembre 2009
 Model Combination 24 Novembre 2009 Datamining 1 2009-2010 Plan 1 Principles of model combination 2 Resampling methods Bagging Random Forests Boosting 3 Hybrid methods Stacking Generic algorithm for mulistrategy
Prediction of Stock Performance Using Analytical Techniques
 136 JOURNAL OF EMERGING TECHNOLOGIES IN WEB INTELLIGENCE, VOL. 5, NO. 2, MAY 2013 Prediction of Stock Performance Using Analytical Techniques Carol Hargreaves Institute of Systems Science National University
Social Networks and Social Media
 Social Networks and Social Media Social Media: Many-to-Many Social Networking Content Sharing Social Media Blogs Microblogging Wiki Forum 2 Characteristics of Social Media Consumers become Producers Rich
LABEL PROPAGATION ON GRAPHS. SEMI-SUPERVISED LEARNING. ----Changsheng Liu 10-30-2014
 LABEL PROPAGATION ON GRAPHS. SEMI-SUPERVISED LEARNING ----Changsheng Liu 10-30-2014 Agenda Semi Supervised Learning Topics in Semi Supervised Learning Label Propagation Local and global consistency Graph
Machine Learning and Pattern Recognition Logistic Regression
 Machine Learning and Pattern Recognition Logistic Regression Course Lecturer:Amos J Storkey Institute for Adaptive and Neural Computation School of Informatics University of Edinburgh Crichton Street,
A linear algebraic method for pricing temporary life annuities
 A linear algebraic method for pricing temporary life annuities P. Date (joint work with R. Mamon, L. Jalen and I.C. Wang) Department of Mathematical Sciences, Brunel University, London Outline Introduction
General Network Analysis: Graph-theoretic. COMP572 Fall 2009
 General Network Analysis: Graph-theoretic Techniques COMP572 Fall 2009 Networks (aka Graphs) A network is a set of vertices, or nodes, and edges that connect pairs of vertices Example: a network with 5
Identifying Leaders and Followers in Online Social Networks
 Identifying Leaders and Followers in Online Social Networks M. Zubair Shafiq, Student Member, IEEE, Muhammad U. Ilyas, Member, IEEE, Alex X. Liu, Member, IEEE, Hayder Radha, Fellow, IEEE Abstract Identifying
arxiv:1201.3120v3 [math.na] 1 Oct 2012
![arxiv:1201.3120v3 [math.na] 1 Oct 2012](/thumbs/27/11686935.jpg "arxiv:1201.3120v3 [math.na] 1 Oct 2012") RANKING HUBS AND AUTHORITIES USING MATRIX FUNCTIONS MICHELE BENZI, ERNESTO ESTRADA, AND CHRISTINE KLYMKO arxiv:1201.3120v3 [math.na] 1 Oct 2012 Abstract. The notions of subgraph centrality and communicability,
RANKING HUBS AND AUTHORITIES USING MATRIX FUNCTIONS MICHELE BENZI, ERNESTO ESTRADA, AND CHRISTINE KLYMKO arxiv:1201.3120v3 [math.na] 1 Oct 2012 Abstract. The notions of subgraph centrality and communicability,
An Overview of Data Mining: Predictive Modeling for IR in the 21 st Century
 An Overview of Data Mining: Predictive Modeling for IR in the 21 st Century Nora Galambos, PhD Senior Data Scientist Office of Institutional Research, Planning & Effectiveness Stony Brook University AIRPO
Network Architectures & Services
 Network Architectures & Services Fernando Kuipers ([email protected]) Multi-dimensional analysis Network peopleware Network software Network hardware Individual: Quality of Experience Friends: Recommendation
A SURVEY OF MODELS AND ALGORITHMS FOR SOCIAL INFLUENCE ANALYSIS
 Chapter 4 A SURVEY OF MODELS AND ALGORITHMS FOR SOCIAL INFLUENCE ANALYSIS Jimeng Sun IBM TJ Watson Research Center, USA [email protected] Jie Tang Tsinghua University, China [email protected] Abstract
Leveraging Ensemble Models in SAS Enterprise Miner
 ABSTRACT Paper SAS133-2014 Leveraging Ensemble Models in SAS Enterprise Miner Miguel Maldonado, Jared Dean, Wendy Czika, and Susan Haller SAS Institute Inc. Ensemble models combine two or more models to
Example: Credit card default, we may be more interested in predicting the probabilty of a default than classifying individuals as default or not.
 Statistical Learning: Chapter 4 Classification 4.1 Introduction Supervised learning with a categorical (Qualitative) response Notation: - Feature vector X, - qualitative response Y, taking values in C
3.2 Roulette and Markov Chains
 238 CHAPTER 3. DISCRETE DYNAMICAL SYSTEMS WITH MANY VARIABLES 3.2 Roulette and Markov Chains In this section we will be discussing an application of systems of recursion equations called Markov Chains.
A PARADIGM FOR DEVELOPING BETTER MEASURES OF MARKETING CONSTRUCTS
 A PARADIGM FOR DEVELOPING BETTER MEASURES OF MARKETING CONSTRUCTS Gilber A. Churchill (1979) Introduced by Azra Dedic in the course of Measurement in Business Research Introduction 2 Measurements are rules
Statistics 100A Homework 4 Solutions
 Chapter 4 Statistics 00A Homework 4 Solutions Ryan Rosario 39. A ball is drawn from an urn containing 3 white and 3 black balls. After the ball is drawn, it is then replaced and another ball is drawn.
CHOOSING A COLLEGE. Teacher s Guide Getting Started. Nathan N. Alexander Charlotte, NC
 Teacher s Guide Getting Started Nathan N. Alexander Charlotte, NC Purpose In this two-day lesson, students determine their best-matched college. They use decision-making strategies based on their preferences
Ensemble Methods. Knowledge Discovery and Data Mining 2 (VU) (707.004) Roman Kern. KTI, TU Graz 2015-03-05
 (707.004) Roman Kern. KTI, TU Graz 2015-03-05") Ensemble Methods Knowledge Discovery and Data Mining 2 (VU) (707004) Roman Kern KTI, TU Graz 2015-03-05 Roman Kern (KTI, TU Graz) Ensemble Methods 2015-03-05 1 / 38 Outline 1 Introduction 2 Classification
Ensemble Methods Knowledge Discovery and Data Mining 2 (VU) (707004) Roman Kern KTI, TU Graz 2015-03-05 Roman Kern (KTI, TU Graz) Ensemble Methods 2015-03-05 1 / 38 Outline 1 Introduction 2 Classification
Graph Theory and Complex Networks: An Introduction. Chapter 08: Computer networks
 Graph Theory and Complex Networks: An Introduction Maarten van Steen VU Amsterdam, Dept. Computer Science Room R4.20, [email protected] Chapter 08: Computer networks Version: March 3, 2011 2 / 53 Contents
Characterization and Modeling of Packet Loss of a VoIP Communication
 Characterization and Modeling of Packet Loss of a VoIP Communication L. Estrada, D. Torres, H. Toral Abstract In this work, a characterization and modeling of packet loss of a Voice over Internet Protocol
Efficient Identification of Starters and Followers in Social Media
 Efficient Identification of Starters and Followers in Social Media Michael Mathioudakis Department of Computer Science University of Toronto [email protected] Nick Koudas Department of Computer Science
HT2015: SC4 Statistical Data Mining and Machine Learning
 HT2015: SC4 Statistical Data Mining and Machine Learning Dino Sejdinovic Department of Statistics Oxford http://www.stats.ox.ac.uk/~sejdinov/sdmml.html Bayesian Nonparametrics Parametric vs Nonparametric
Roadmap to Data Analysis. Introduction to the Series, and I. Introduction to Statistical Thinking-A (Very) Short Introductory Course for Agencies
 Short Introductory Course for Agencies") Roadmap to Data Analysis Introduction to the Series, and I. Introduction to Statistical Thinking-A (Very) Short Introductory Course for Agencies Objectives of the Series Roadmap to Data Analysis Provide
Roadmap to Data Analysis Introduction to the Series, and I. Introduction to Statistical Thinking-A (Very) Short Introductory Course for Agencies Objectives of the Series Roadmap to Data Analysis Provide
Data Mining in CRM & Direct Marketing. Jun Du The University of Western Ontario [email protected]
 Data Mining in CRM & Direct Marketing Jun Du The University of Western Ontario [email protected] Outline Why CRM & Marketing Goals in CRM & Marketing Models and Methodologies Case Study: Response Model Case
Alabama Department of Postsecondary Education
 Date Adopted 1998 Dates reviewed 2007, 2011, 2013 Dates revised 2004, 2008, 2011, 2013, 2015 Alabama Department of Postsecondary Education Representing Alabama s Public Two-Year College System Jefferson
APPM4720/5720: Fast algorithms for big data. Gunnar Martinsson The University of Colorado at Boulder
 APPM4720/5720: Fast algorithms for big data Gunnar Martinsson The University of Colorado at Boulder Course objectives: The purpose of this course is to teach efficient algorithms for processing very large
Insurance Analytics - analýza dat a prediktivní modelování v pojišťovnictví. Pavel Kříž. Seminář z aktuárských věd MFF 4.
 Insurance Analytics - analýza dat a prediktivní modelování v pojišťovnictví Pavel Kříž Seminář z aktuárských věd MFF 4. dubna 2014 Summary 1. Application areas of Insurance Analytics 2. Insurance Analytics
Data Mining Methods: Applications for Institutional Research
 Data Mining Methods: Applications for Institutional Research Nora Galambos, PhD Office of Institutional Research, Planning & Effectiveness Stony Brook University NEAIR Annual Conference Philadelphia 2014
CLASSIFYING NETWORK TRAFFIC IN THE BIG DATA ERA
 CLASSIFYING NETWORK TRAFFIC IN THE BIG DATA ERA Professor Yang Xiang Network Security and Computing Laboratory (NSCLab) School of Information Technology Deakin University, Melbourne, Australia http://anss.org.au/nsclab
Social Media Mining. Graph Essentials
 Graph Essentials Graph Basics Measures Graph and Essentials Metrics 2 2 Nodes and Edges A network is a graph nodes, actors, or vertices (plural of vertex) Connections, edges or ties Edge Node Measures
The Importance of Bug Reports and Triaging in Collaborational Design
 Categorizing Bugs with Social Networks: A Case Study on Four Open Source Software Communities Marcelo Serrano Zanetti, Ingo Scholtes, Claudio Juan Tessone and Frank Schweitzer Chair of Systems Design ETH
Big Data Technology Motivating NoSQL Databases: Computing Page Importance Metrics at Crawl Time
 Big Data Technology Motivating NoSQL Databases: Computing Page Importance Metrics at Crawl Time Edward Bortnikov & Ronny Lempel Yahoo! Labs, Haifa Class Outline Link-based page importance measures Why
Hidden Markov Models
 8.47 Introduction to omputational Molecular Biology Lecture 7: November 4, 2004 Scribe: Han-Pang hiu Lecturer: Ross Lippert Editor: Russ ox Hidden Markov Models The G island phenomenon The nucleotide frequencies
Social Influence Analysis in Social Networking Big Data: Opportunities and Challenges. Presenter: Sancheng Peng Zhaoqing University
 Social Influence Analysis in Social Networking Big Data: Opportunities and Challenges Presenter: Sancheng Peng Zhaoqing University 1 2 3 4 35 46 7 Contents Introduction Relationship between SIA and BD
Risk Management for IT Security: When Theory Meets Practice
 Risk Management for IT Security: When Theory Meets Practice Anil Kumar Chorppath Technical University of Munich Munich, Germany Email: [email protected] Tansu Alpcan The University of Melbourne Melbourne,
AMS 5 CHANCE VARIABILITY
 AMS 5 CHANCE VARIABILITY The Law of Averages When tossing a fair coin the chances of tails and heads are the same: 50% and 50%. So if the coin is tossed a large number of times, the number of heads and
Statistical Analysis of Complete Social Networks
 Statistical Analysis of Complete Social Networks Introduction to networks Christian Steglich [email protected] median geodesic distance between groups 1.8 1.2 0.6 transitivity 0.0 0.0 0.5 1.0 1.5 2.0
Graph Algorithms and Graph Databases. Dr. Daisy Zhe Wang CISE Department University of Florida August 27th 2014
 Graph Algorithms and Graph Databases Dr. Daisy Zhe Wang CISE Department University of Florida August 27th 2014 1 Google Knowledge Graph -- Entities and Relationships 2 Graph Data! Facebook Social Network
Making Sense of the Mayhem: Machine Learning and March Madness
 Making Sense of the Mayhem: Machine Learning and March Madness Alex Tran and Adam Ginzberg Stanford University [email protected] [email protected] I. Introduction III. Model The goal of our research
Markov Chains. Chapter 4. 4.1 Stochastic Processes
 Chapter 4 Markov Chains 4 Stochastic Processes Often, we need to estimate probabilities using a collection of random variables For example, an actuary may be interested in estimating the probability that
DATA ANALYSIS II. Matrix Algorithms
 DATA ANALYSIS II Matrix Algorithms Similarity Matrix Given a dataset D = {x i }, i=1,..,n consisting of n points in R d, let A denote the n n symmetric similarity matrix between the points, given as where
Supervised Feature Selection & Unsupervised Dimensionality Reduction
 Supervised Feature Selection & Unsupervised Dimensionality Reduction Feature Subset Selection Supervised: class labels are given Select a subset of the problem features Why? Redundant features much or
Analytic Hierarchy Process, a Psychometric Approach. 1 Introduction and Presentation of the Experiment
 Analytic Hierarchy Process, a Psychometric Approach Christine Choirat and Raffaello Seri Dept. of Economics, Università dell Insubria Varese, Italy Abstract. The Analytic Hierarchy Process, or AHP for
OPTIMAL DESIGN OF A MULTITIER REWARD SCHEME. Amir Gandomi *, Saeed Zolfaghari **
 OPTIMAL DESIGN OF A MULTITIER REWARD SCHEME Amir Gandomi *, Saeed Zolfaghari ** Department of Mechanical and Industrial Engineering, Ryerson University, Toronto, Ontario * Tel.: + 46 979 5000x7702, Email:
STAT 35A HW2 Solutions
 STAT 35A HW2 Solutions http://www.stat.ucla.edu/~dinov/courses_students.dir/09/spring/stat35.dir 1. A computer consulting firm presently has bids out on three projects. Let A i = { awarded project i },
Predict Influencers in the Social Network
 Predict Influencers in the Social Network Ruishan Liu, Yang Zhao and Liuyu Zhou Email: rliu2, yzhao2, [email protected] Department of Electrical Engineering, Stanford University Abstract Given two persons
1 Nonzero sum games and Nash equilibria
 princeton univ. F 14 cos 521: Advanced Algorithm Design Lecture 19: Equilibria and algorithms Lecturer: Sanjeev Arora Scribe: Economic and game-theoretic reasoning specifically, how agents respond to economic
Exam 3 Review/WIR 9 These problems will be started in class on April 7 and continued on April 8 at the WIR.
 Exam 3 Review/WIR 9 These problems will be started in class on April 7 and continued on April 8 at the WIR. 1. Urn A contains 6 white marbles and 4 red marbles. Urn B contains 3 red marbles and two white
Security Optimization of Dynamic Networks with Probabilistic Graph Modeling and Linear Programming
 1 Security Optimization of Dynamic Networks with Probabilistic Graph Modeling and Linear Programming Hussain M.J. Almohri, Member, IEEE, Layne T. Watson, Danfeng (Daphne) Yao, Member, IEEE and Xinming
Experimental Design. Power and Sample Size Determination. Proportions. Proportions. Confidence Interval for p. The Binomial Test
 Experimental Design Power and Sample Size Determination Bret Hanlon and Bret Larget Department of Statistics University of Wisconsin Madison November 3 8, 2011 To this point in the semester, we have largely
Beating the MLB Moneyline
 Beating the MLB Moneyline Leland Chen [email protected] Andrew He [email protected] 1 Abstract Sports forecasting is a challenging task that has similarities to stock market prediction, requiring time-series
NEW VERSION OF DECISION SUPPORT SYSTEM FOR EVALUATING TAKEOVER BIDS IN PRIVATIZATION OF THE PUBLIC ENTERPRISES AND SERVICES
 NEW VERSION OF DECISION SUPPORT SYSTEM FOR EVALUATING TAKEOVER BIDS IN PRIVATIZATION OF THE PUBLIC ENTERPRISES AND SERVICES Silvija Vlah Kristina Soric Visnja Vojvodic Rosenzweig Department of Mathematics
Network Analysis of Project Communication Based on Graph Theory
 Proceedings of the 8th International Conference on Innovation & Management 481 Network Analysis of Project Communication Based on Graph Theory Naoki Ohshima 1, Akihito Kawashima 2 1 School of MOT, Yamaguchi
Designing Ranking Systems for Consumer Reviews: The Impact of Review Subjectivity on Product Sales and Review Quality
 Designing Ranking Systems for Consumer Reviews: The Impact of Review Subjectivity on Product Sales and Review Quality Anindya Ghose, Panagiotis G. Ipeirotis {aghose, panos}@stern.nyu.edu Department of
Gerry Hobbs, Department of Statistics, West Virginia University
 Decision Trees as a Predictive Modeling Method Gerry Hobbs, Department of Statistics, West Virginia University Abstract Predictive modeling has become an important area of interest in tasks such as credit
Applied Statistics. J. Blanchet and J. Wadsworth. Institute of Mathematics, Analysis, and Applications EPF Lausanne
 Applied Statistics J. Blanchet and J. Wadsworth Institute of Mathematics, Analysis, and Applications EPF Lausanne An MSc Course for Applied Mathematicians, Fall 2012 Outline 1 Model Comparison 2 Model
Holistic Information Security: Human Factor and Behavior Prediction using Social Media
 Holistic Information Security: Human Factor and Behavior Prediction using Social Media Dimitris Gritzalis January 2014 Holistic Information Security: Human Factor and Behavior Prediction using Social Media
Mining Metrics to Predict Component Failures
 Mining Metrics to Predict Component Failures Nachiappan Nagappan, Microsoft Research Thomas Ball, Microsoft Research Andreas Zeller, Saarland University Overview Introduction Hypothesis and high level