Cloud Detection for Sentinel 2. Curtis Woodcock, Zhe Zhu, Shixiong Wang and Chris Holden
|
|
|
- Eric Fields
- 8 years ago
- Views:
Transcription
1 Cloud Detection for Sentinel 2 Curtis Woodcock, Zhe Zhu, Shixiong Wang and Chris Holden

2 Background 3 primary spectral regions useful for cloud detection Optical Thermal Cirrus bands Legacy Landsats have thermal and optical Landsat 8 has all 3 Sentinel 2s have optical and cirrus Landsat 8 provides us the opportunity to test other alternatives

3 Outline Why cirrus cloud detection is important Fmask designed for Landsats 4-7, Landsat 8, and Sentinel 2 Cirrus cloud spectral effects Multitemporal approaches Preliminary results with Simulated Sentinel 2 data


4 Why is cirrus cloud detection important? Landsat 8 false color composite Landsat 8 Cirrus Band TOA reflectance Land cover classification map The land cover inside the red circles are mostly forest and barren, however, due to the presence of the transparent cirrus clouds, they are misclassified as herbaceous and mined field

 (from Chris")
5 The effect of cirrus clouds on spectral reflectance (cirrus pixels in pink) (from Chris Holden)
 (from")

6 The effect of cirrus clouds on spectral reflectance (cirrus pixels in pink)


7

8 What do cirrus cloud looks like? Band 4, 2, and 2 composites Thermal Band Amazon p233r61


9 The Cirrus Band Cirrus band TOA reflectance:


10 TM/ETM+ Fmask results Clear Cloud Shadow Snow/Ice Cloud

11 Sentinel 2 Fmask results Clear Cloud Shadow Snow/Ice Cloud


12 OLI/TIRS Fmask results Clear Cloud Shadow Snow/Ice Cloud

13 Places have been tested so far

14 Accuracies (%) Fmask results accuracies for all 7 locations between the Landsats 4-7 and the Sentinel 2 scenarios Landsats 4-7 Sentinel 2 Disagreements p199r26 p45r30 p233r61 p92r86 p135r25 p196r44 p7r5 Path/Row The blue bars are the overall accuracies for the Landsats 4-7 scenario and the red bars are the overall accuracies for the Sentinel 2 scenario. The green bars show the percent disagreement for Fmask results between the Landsats 4-7 and the Sentinel 2 scenarios.

15 Accuracies (%) Fmask results accuracies for all 7 locations between the Sentinel 2 and Landsat 8 scenarios Sentinel 2 Landsat 8 Disagreements p199r26 p45r30 p233r61 p92r86 p135r25 p196r44 p7r5 Path/Row The blue bars are the overall accuracies for the Sentinel 2 scenario and the red bars are the overall accuracies for the Landsat 8 scenario. The green bars show the percent disagreement for Fmask results between the Sentinel 2 and Landsat 8 scenarios.


16

17 Examples of clouds found with multitemporal approach
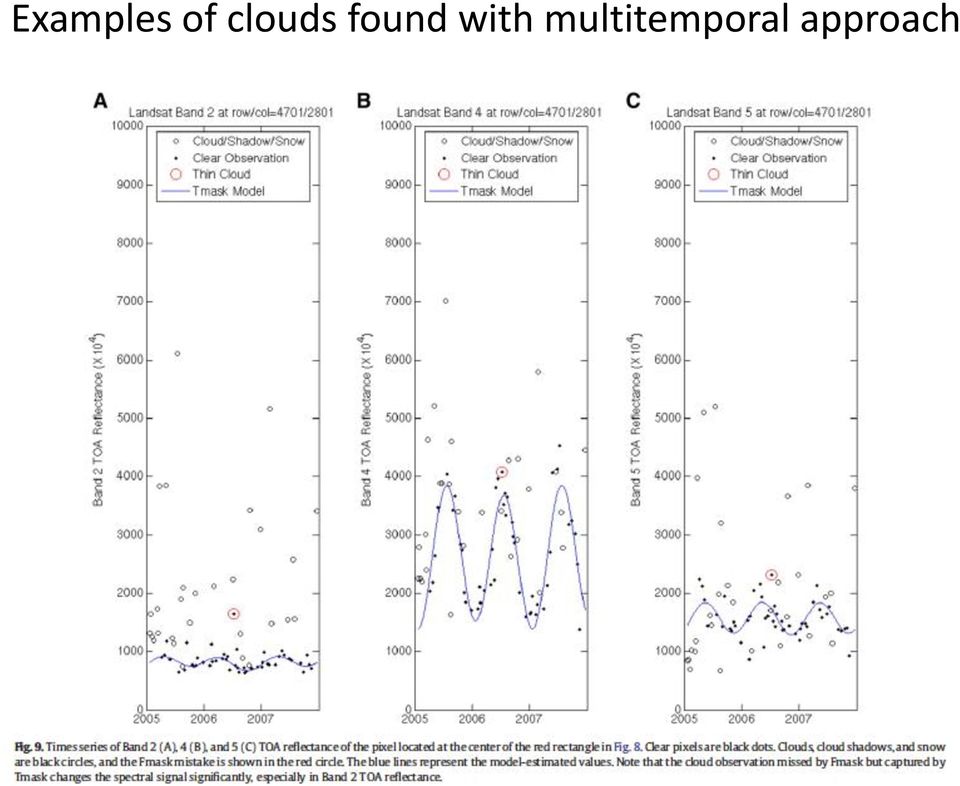

18 Multitemporal solution (Tmask) (This step does not use the thermal or cirrus bands) Fig. 8. Comparison of Fmask and Tmask results for a subset of Landsat images at Path 12 Row 31 acquired May 7 th 2006 a scenario where two algorithms disagree for extremely thin clouds (Tmask works and Fmask fails).. Note that the extremely thin clouds in the center of the red rectangle are missed by Fmask but captured by Tmask. Fig. 9. Times series of Bands 2 (Fig. 9A), 4 (Fig. 9B), and 5 (Fig. 9C) TOA reflectance of the pixel located at the center of the red rectangle in Fig. 8. Clear pixels are black dots. Clouds, cloud shadows, and snow are black circles, and the Fmask mistake is shown in the red circle. The blue lines represent the model-estimated values. Note that the cloud observation missed by Fmask but captured by Tmask changes the spectral signal significantly, especially in Band 2 TOA reflectance.
 TOA reflectance of the pixel located at the center of the red rectangle in Fig. 8. Clear pixels are black dots.")

19 Preliminary result with Simulated Sentinel 2 data Sentinel-2 simulation dataset was provided by Ferran Gascon that aggregates Hyperion bands to MSI bandpasses.

20 Fmask results were generated base on Zhe Zhu s Fmask algorithm with modifications according to Sentinel-2 specifications. Simulation data location: Bangor, Maine Acquisition date: 08/25/2002 Zone: Boreal Hyperion original product: EO1H PZ


21 Sentinel-2 4, 3, 2 composite Sentinel-2 Fmask result
22 Accuracy Assessment Clear land Clear water Cloud shadow Cloud Total Clear land Clear water Cloud shadow Cloud Total Overall Accuracy 262/ %
23 Conclusions 1. Fmask results comparison Landsat 8 > Sentinel 2 >> Landsats Fmask is not perfect, but Tmask can further improve the Fmask results. 3. Opportunity remaining to continue this work, would love to hear community priorities
24 Backup slides Fmask comparison for some other sites Some figures for Tmask algorithm that could be used for better illustrating the algorithm
25 Australia p92r86 Band 4, 2, and 2 composites Thermal Band
26 Cirrus Band Cirrus band TOA reflectance:
27 TM/ETM Fmask results Clear Cloud Shadow Snow/Ice Cloud
28 Sentinel Fmask results Clear Cloud Shadow Snow/Ice Cloud
29 OLI/TIRS Fmask results Clear Cloud Shadow Snow/Ice Cloud
30 Africa p196r44 Band 4, 2, and 2 composites Thermal Band
31 Cirrus Band Cirrus band TOA reflectance:
32 TM/ETM+ Fmask results Clear Cloud Shadow Snow/Ice Cloud

33 Sentinel Fmask results Clear Cloud Shadow Snow/Ice Cloud
34 OLI/TIRS Fmask results Clear Cloud Shadow Snow/Ice Cloud
35 Mongolia p135r25 Band 4, 2, and 2 composites Thermal Band
36 Cirrus Band Cirrus band TOA reflectance:
37 TM/ETM+ Fmask results Clear Cloud Shadow Snow/Ice Cloud
38 Sentinel Fmask results Clear Cloud Shadow Snow/Ice Cloud

39 OLI/TIRS Fmask results Clear Cloud Shadow Snow/Ice Cloud
40 Paris p199r26 Band 4, 2, and 2 composites Thermal Band


41 Cirrus Band Cirrus band TOA reflectance:
42 TM/ETM+ Fmask results Clear Cloud Shadow Snow/Ice Cloud
43 Sentinel Fmask results Clear Cloud Shadow Snow/Ice Cloud

44 OLI/TIRS Fmask results Clear Cloud Shadow Snow/Ice Cloud
45 North Polar p7r5 Band 5, 4, and 3 composites Thermal Band

46 Cirrus Band Cirrus band TOA reflectance:

47 TM/ETM+ Fmask results Clear Cloud Shadow Snow/Ice Cloud
48 Sentinel Fmask results Clear Cloud Shadow Snow/Ice Cloud
49 OLI/TIRS Fmask results Clear Cloud Shadow Snow/Ice Cloud
50 Oregon p45r30 Band 5, 4, and 3 composites Thermal Band

51 Cirrus Band Cirrus band TOA reflectance:
52 TM/ETM+ Fmask results Clear Cloud Shadow Snow/Ice Cloud
53 Sentinel Fmask results Clear Cloud Shadow Snow/Ice Cloud
54 OLI/TIRS Fmask results Clear Cloud Shadow Snow/Ice Cloud
55 Two-step cloud and cloud shadow detection Step one global algorithm : Single-date based cloud and cloud shadow masking (Fmask freely available) Step two pixel-based algorithm : Multitemporal cloud and cloud shadow masking based on robust fitting of the clear pixels clouds and shadows are ephemeral outliers 58
56 Part 1: Illustration of multitemporal approach a The presence of clouds and snow will make Landsat Band 2 brighter Cloud observation b Snow observation 59
57 Part 1: Illustration of multitemporal approach c The presence of cloud shadows and snow will make Landsat Band 5 darker Snow observation d Cloud shadow observation 60
58 Illustration of the two-step algorithm Landsat image Step 1 Step 2 61
Virtual constellations, time series, and cloud screening opportunities for Sentinel 2 and Landsat
 Virtual constellations, time series, and cloud screening opportunities for Sentinel 2 and Landsat Sentinel 2 for Science Workshop 20 22 May 2014 ESA ESRIN, Frascati (Rome), Italy 1 Part 1: Title: Towards
Cloud Masking and Cloud Products
 Cloud Masking and Cloud Products MODIS Operational Algorithm MOD35 Paul Menzel, Steve Ackerman, Richard Frey, Kathy Strabala, Chris Moeller, Liam Gumley, Bryan Baum MODIS Cloud Masking Often done with
Generation of Cloud-free Imagery Using Landsat-8
 Generation of Cloud-free Imagery Using Landsat-8 Byeonghee Kim 1, Youkyung Han 2, Yonghyun Kim 3, Yongil Kim 4 Department of Civil and Environmental Engineering, Seoul National University (SNU), Seoul,
Remote Sensing Method in Implementing REDD+
 Remote Sensing Method in Implementing REDD+ FRIM-FFPRI Research on Development of Carbon Monitoring Methodology for REDD+ in Malaysia Remote Sensing Component Mohd Azahari Faidi, Hamdan Omar, Khali Aziz
REDD+ for the Guiana Shield
 REDD+ for the Guiana Shield Technical and Regional Platform for the Development of REDD+ in the Guiana Shield Project Owner: Office National des Forêts (ONF) Partners: ONFI / GFC and OCC (Guyana) / IEF-AP
STAR Algorithm and Data Products (ADP) Beta Review. Suomi NPP Surface Reflectance IP ARP Product
 Beta Review. Suomi NPP Surface Reflectance IP ARP Product") STAR Algorithm and Data Products (ADP) Beta Review Suomi NPP Surface Reflectance IP ARP Product Alexei Lyapustin Surface Reflectance Cal Val Team 11/26/2012 STAR ADP Surface Reflectance ARP Team Member
STAR Algorithm and Data Products (ADP) Beta Review Suomi NPP Surface Reflectance IP ARP Product Alexei Lyapustin Surface Reflectance Cal Val Team 11/26/2012 STAR ADP Surface Reflectance ARP Team Member
TerraColor White Paper
 TerraColor White Paper TerraColor is a simulated true color digital earth imagery product developed by Earthstar Geographics LLC. This product was built from imagery captured by the US Landsat 7 (ETM+)
SAMPLE MIDTERM QUESTIONS
 Geography 309 Sample MidTerm Questions Page 1 SAMPLE MIDTERM QUESTIONS Textbook Questions Chapter 1 Questions 4, 5, 6, Chapter 2 Questions 4, 7, 10 Chapter 4 Questions 8, 9 Chapter 10 Questions 1, 4, 7
Application of Remotely Sensed Data and Technology to Monitor Land Change in Massachusetts
 Application of Remotely Sensed Data and Technology to Monitor Land Change in Massachusetts Sam Blanchard, Nick Bumbarger, Joe Fortier, and Alina Taus Advisor: John Rogan Geography Department, Clark University
MOD09 (Surface Reflectance) User s Guide
 User s Guide") MOD09 (Surface ) User s Guide MODIS Land Surface Science Computing Facility Principal Investigator: Dr. Eric F. Vermote Web site: http://modis-sr.ltdri.org Correspondence e-mail address: mod09@ltdri.org
MOD09 (Surface ) User s Guide MODIS Land Surface Science Computing Facility Principal Investigator: Dr. Eric F. Vermote Web site: http://modis-sr.ltdri.org Correspondence e-mail address: mod09@ltdri.org
Data Mining. Nonlinear Classification
 Data Mining Unit # 6 Sajjad Haider Fall 2014 1 Nonlinear Classification Classes may not be separable by a linear boundary Suppose we randomly generate a data set as follows: X has range between 0 to 15
Measurement of the effect of biomass burning aerosol on inhibition of cloud formation over the Amazon
 Supporting Online Material for Koren et al. Measurement of the effect of biomass burning aerosol on inhibition of cloud formation over the Amazon 1. MODIS new cloud detection algorithm The operational
The USGS Landsat Big Data Challenge
 The USGS Landsat Big Data Challenge Brian Sauer Engineering and Development USGS EROS bsauer@usgs.gov U.S. Department of the Interior U.S. Geological Survey USGS EROS and Landsat 2 Data Utility and Exploitation
Landsat Monitoring our Earth s Condition for over 40 years
 Landsat Monitoring our Earth s Condition for over 40 years Thomas Cecere Land Remote Sensing Program USGS ISPRS:Earth Observing Data and Tools for Health Studies Arlington, VA August 28, 2013 U.S. Department
LANDSAT 8 Level 1 Product Performance
 Réf: IDEAS-TN-10-QualityReport LANDSAT 8 Level 1 Product Performance Quality Report Month/Year: January 2016 Date: 26/01/2016 Issue/Rev:1/9 1. Scope of this document On May 30, 2013, data from the Landsat
Computer Vision: Machine Vision Filters. Computer Vision. Optical Filters. 25 August 2014
 Computer Vision Optical Filters 25 August 2014 Copyright 2001 2014 by NHL Hogeschool, Van de Loosdrecht Machine Vision BV and Klaas Dijkstra All rights reserved j.van.de.loosdrecht@nhl.nl, jaap@vdlmv.nl,
SPOT4 (Take 5) first validation and application results
 first validation and application results") SPOT4 (Take 5) first validation and application results O.Hagolle CESBIO/CNES, M.Huc CESBIO/CNRS, M.Kadiri CESBIO/THEIA ; J.Inglada CESBIO/CNES, C. Marais-Sicre CESBIO/CNRS, J.Osman CESBIO/CNES (PhD),
SPOT4 (Take 5) first validation and application results O.Hagolle CESBIO/CNES, M.Huc CESBIO/CNRS, M.Kadiri CESBIO/THEIA ; J.Inglada CESBIO/CNES, C. Marais-Sicre CESBIO/CNRS, J.Osman CESBIO/CNES (PhD),
Towards assimilating IASI satellite observations over cold surfaces - the cloud detection aspect
 Towards assimilating IASI satellite observations over cold surfaces - the cloud detection aspect Tuuli Perttula, FMI + Thanks to: Nadia Fourrié, Lydie Lavanant, Florence Rabier and Vincent Guidard, Météo
Modifying Colors and Symbols in ArcMap
 Modifying Colors and Symbols in ArcMap Contents Introduction... 1 Displaying Categorical Data... 3 Creating New Categories... 5 Displaying Numeric Data... 6 Graduated Colors... 6 Graduated Symbols... 9
VCS REDD Methodology Module. Methods for monitoring forest cover changes in REDD project activities
 1 VCS REDD Methodology Module Methods for monitoring forest cover changes in REDD project activities Version 1.0 May 2009 I. SCOPE, APPLICABILITY, DATA REQUIREMENT AND OUTPUT PARAMETERS Scope This module
MODIS IMAGES RESTORATION FOR VNIR BANDS ON FIRE SMOKE AFFECTED AREA
 MODIS IMAGES RESTORATION FOR VNIR BANDS ON FIRE SMOKE AFFECTED AREA Li-Yu Chang and Chi-Farn Chen Center for Space and Remote Sensing Research, National Central University, No. 300, Zhongda Rd., Zhongli
Comparison between current and future environmental satellite imagers on cloud classification using MODIS
 Remote Sensing of Environment 108 (2007) 311 326 www.elsevier.com/locate/rse Comparison between current and future environmental satellite imagers on cloud classification using MODIS Zhenglong Li a,, Jun
Authors: Thierry Phulpin, CNES Lydie Lavanant, Meteo France Claude Camy-Peyret, LPMAA/CNRS. Date: 15 June 2005
 Comments on the number of cloud free observations per day and location- LEO constellation vs. GEO - Annex in the final Technical Note on geostationary mission concepts Authors: Thierry Phulpin, CNES Lydie
CLOUD MASKING AND CLOUD PRODUCTS ROUNDTABLE EXPECTED PARTICIPANTS: ACKERMAN, HALL, WAN, VERMOTE, BARKER, HUETE, BROWN, GORDON, KAUFMAN, SCHAAF, BAUM
 CLOUD MASKING AND CLOUD PRODUCTS ROUNDTABLE EXPECTED PARTICIPANTS: ACKERMAN, HALL, WAN, VERMOTE, BARKER, HUETE, BROWN, GORDON, KAUFMAN, SCHAAF, BAUM NOMINAL PURPOSE: DISCUSSION OF TESTS FOR ACCURACY AND
Calculation of Minimum Distances. Minimum Distance to Means. Σi i = 1
 Minimum Distance to Means Similar to Parallelepiped classifier, but instead of bounding areas, the user supplies spectral class means in n-dimensional space and the algorithm calculates the distance between
Review for Introduction to Remote Sensing: Science Concepts and Technology
 Review for Introduction to Remote Sensing: Science Concepts and Technology Ann Johnson Associate Director ann@baremt.com Funded by National Science Foundation Advanced Technological Education program [DUE
Supervised Classification workflow in ENVI 4.8 using WorldView-2 imagery
 Supervised Classification workflow in ENVI 4.8 using WorldView-2 imagery WorldView-2 is the first commercial high-resolution satellite to provide eight spectral sensors in the visible to near-infrared
Selecting the appropriate band combination for an RGB image using Landsat imagery
 Selecting the appropriate band combination for an RGB image using Landsat imagery Ned Horning Version: 1.0 Creation Date: 2004-01-01 Revision Date: 2004-01-01 License: This document is licensed under a
Automatic land-cover map production of agricultural areas using supervised classification of SPOT4(Take5) and Landsat-8 image time series.
 and Landsat-8 image time series.") Automatic land-cover map production of agricultural areas using supervised classification of SPOT4(Take5) and Landsat-8 image time series. Jordi Inglada 2014/11/18 SPOT4/Take5 User Workshop 2014/11/18
Automatic land-cover map production of agricultural areas using supervised classification of SPOT4(Take5) and Landsat-8 image time series. Jordi Inglada 2014/11/18 SPOT4/Take5 User Workshop 2014/11/18
CALIPSO, CloudSat, CERES, and MODIS Merged Data Product
 CALIPSO, CloudSat, CERES, and MODIS Merged Data Product Seiji Kato 1, Sunny Sun-Mack 2, Walter F. Miller 2, Fred G. Rose 2, and Victor E. Sothcott 2 1 NASA Langley Research Center 2 Science and Systems
Land Use/Land Cover Map of the Central Facility of ARM in the Southern Great Plains Site Using DOE s Multi-Spectral Thermal Imager Satellite Images
 Land Use/Land Cover Map of the Central Facility of ARM in the Southern Great Plains Site Using DOE s Multi-Spectral Thermal Imager Satellite Images S. E. Báez Cazull Pre-Service Teacher Program University
Operational Space- Based Crop Mapping Protocols at AAFC A. Davidson, H. McNairn and T. Fisette.
 Operational Space- Based Crop Mapping Protocols at AAFC A. Davidson, H. McNairn and T. Fisette. Science & Technology Branch. Agriculture and Agri-Food Canada. 1. Introduction Space-Based Crop Mapping at
Darrel L. Williams 1, Samuel N. Goward 2, and Ta9ana Loboda 2
 Darrel L. Williams 1, Samuel N. Goward 2, and Ta9ana Loboda 2 1 Global Science & Technology, Inc., 7855 Walker Drive, Suite 200, Greenbelt, MD 20770 2 U. of Maryland College Park, Department of Geographical
Land Use/ Land Cover Mapping Initiative for Kansas and the Kansas River Watershed
 Land Use/ Land Cover Mapping Initiative for Kansas and the Kansas River Watershed Kansas Biological Survey Kansas Applied Remote Sensing Program April 2008 Previous Kansas LULC Projects Kansas LULC Map
Geospatial intelligence and data fusion techniques for sustainable development problems
 Geospatial intelligence and data fusion techniques for sustainable development problems Nataliia Kussul 1,2, Andrii Shelestov 1,2,4, Ruslan Basarab 1,4, Sergii Skakun 1, Olga Kussul 2 and Mykola Lavreniuk
Forest Service Southern Region Jess Clark & Kevin Megown USFS Remote Sensing Applications Center (RSAC)
") Hurricane Katrina Damage Assessment on Lands Managed by the Desoto National Forest using Multi-Temporal Landsat TM Imagery and High Resolution Aerial Photography Renee Jacokes-Mancini Forest Service Southern
Hurricane Katrina Damage Assessment on Lands Managed by the Desoto National Forest using Multi-Temporal Landsat TM Imagery and High Resolution Aerial Photography Renee Jacokes-Mancini Forest Service Southern
Multiscale Object-Based Classification of Satellite Images Merging Multispectral Information with Panchromatic Textural Features
 Remote Sensing and Geoinformation Lena Halounová, Editor not only for Scientific Cooperation EARSeL, 2011 Multiscale Object-Based Classification of Satellite Images Merging Multispectral Information with
How Landsat Images are Made
 How Landsat Images are Made Presentation by: NASA s Landsat Education and Public Outreach team June 2006 1 More than just a pretty picture Landsat makes pretty weird looking maps, and it isn t always easy
Received in revised form 24 March 2004; accepted 30 March 2004
 Remote Sensing of Environment 91 (2004) 237 242 www.elsevier.com/locate/rse Cloud detection in Landsat imagery of ice sheets using shadow matching technique and automatic normalized difference snow index
Methods for Monitoring Forest and Land Cover Changes and Unchanged Areas from Long Time Series
 Methods for Monitoring Forest and Land Cover Changes and Unchanged Areas from Long Time Series Project using historical satellite data from SACCESS (Swedish National Satellite Data Archive) for developing
EcoInformatics International Inc.
 1 von 10 03.08.2010 14:25 EcoInformatics International Inc. Home Services - solutions Projects Concepts Tools Links Contact EXPLORING BEAVER HABITAT AND DISTRIBUTION WITH GOOGLE EARTH: THE LONGEST BEAVER
The Big Shadow Trade
 The Big Shadow Trade This trade is called the big shadow, and soon you will see why. The big shadow is very similar to the kangaroo tail. However the pattern involves two price bars. Here is an example
Getting Started: Creating the Backdrop
 Adding ipad Animations to Green Screen Videos: Step 1 Getting Started: Creating the Backdrop 1. To start a new project: b. Select the + symbol on the top right of the screen. 2. To add a static background
Night Microphysics RGB Nephanalysis in night time
 Copyright, JMA Night Microphysics RGB Nephanalysis in night time Meteorological Satellite Center, JMA What s Night Microphysics RGB? R : B15(I2 12.3)-B13(IR 10.4) Range : -4 2 [K] Gamma : 1.0 G : B13(IR
ANALYSIS OF FOREST CHANGE IN FIRE DAMAGE AREA USING SATELLITE IMAGES
 ANALYSIS OF FOREST CHANGE IN FIRE DAMAGE AREA USING SATELLITE IMAGES Joon Mook Kang, Professor Joon Kyu Park, Ph.D Min Gyu Kim, Ph.D._Candidate Dept of Civil Engineering, Chungnam National University 220
Spectral Response for DigitalGlobe Earth Imaging Instruments
 Spectral Response for DigitalGlobe Earth Imaging Instruments IKONOS The IKONOS satellite carries a high resolution panchromatic band covering most of the silicon response and four lower resolution spectral
Big data and Earth observation New challenges in remote sensing images interpretation
 Big data and Earth observation New challenges in remote sensing images interpretation Pierre Gançarski ICube CNRS - Université de Strasbourg 2014 Pierre Gançarski Big data and Earth observation 1/58 1
Pixel-based and object-oriented change detection analysis using high-resolution imagery
 Pixel-based and object-oriented change detection analysis using high-resolution imagery Institute for Mine-Surveying and Geodesy TU Bergakademie Freiberg D-09599 Freiberg, Germany imgard.niemeyer@tu-freiberg.de
WATER BODY EXTRACTION FROM MULTI SPECTRAL IMAGE BY SPECTRAL PATTERN ANALYSIS
 WATER BODY EXTRACTION FROM MULTI SPECTRAL IMAGE BY SPECTRAL PATTERN ANALYSIS Nguyen Dinh Duong Department of Environmental Information Study and Analysis, Institute of Geography, 18 Hoang Quoc Viet Rd.,
Data Processing Flow Chart
 Legend Start V1 V2 V3 Completed Version 2 Completion date Data Processing Flow Chart Data: Download a) AVHRR: 1981-1999 b) MODIS:2000-2010 c) SPOT : 1998-2002 No Progressing Started Did not start 03/12/12
JACIE Science Applications of High Resolution Imagery at the USGS EROS Data Center
 JACIE Science Applications of High Resolution Imagery at the USGS EROS Data Center November 8-10, 2004 U.S. Department of the Interior U.S. Geological Survey Michael Coan, SAIC USGS EROS Data Center coan@usgs.gov
Moderate- and high-resolution Earth Observation data based forest and agriculture monitoring in Russia using VEGA Web-Service
 Moderate- and high-resolution Earth Observation data based forest and agriculture monitoring in Russia using VEGA Web-Service Sergey BARTALEV and Evgeny LOUPIAN Space Research Institute, Russian Academy
Introduction to Imagery and Raster Data in ArcGIS
 Esri International User Conference San Diego, California Technical Workshops July 25, 2012 Introduction to Imagery and Raster Data in ArcGIS Simon Woo slides Cody Benkelman - demos Overview of Presentation
CERES Edition 2 & Edition 3 Cloud Cover, Cloud Altitude and Temperature
 CERES Edition 2 & Edition 3 Cloud Cover, Cloud Altitude and Temperature S. Sun-Mack 1, P. Minnis 2, Y. Chen 1, R. Smith 1, Q. Z. Trepte 1, F. -L. Chang, D. Winker 2 (1) SSAI, Hampton, VA (2) NASA Langley
A KNOWLEDGE-BASED APPROACH FOR REDUCING CLOUD AND SHADOW ABSTRACT
 A KNOWLEDGE-BASED APPROACH FOR REDUCING CLOUD AND SHADOW Mingjun Song, Graduate Research Assistant Daniel L. Civco, Director Laboratory for Earth Resources Information Systems Department of Natural Resources
Finding and Downloading Landsat Data from the U.S. Geological Survey s Global Visualization Viewer Website
 January 1, 2013 Finding and Downloading Landsat Data from the U.S. Geological Survey s Global Visualization Viewer Website All Landsat data are available to the public at no cost from U.S. Geological Survey
Evaluation of VIIRS cloud top property climate data records and their potential improvement with CrIS
 Evaluation of VIIRS cloud top property climate data records and their potential improvement with CrIS Dr. Bryan A. Baum (PI) Space Science and Engineering Center University of Wisconsin-Madison Madison,
How to Create a Fun Circus Tent Icon. Final Image Preview. Tutorial Details. Step 1. By: Andrei Marius
 How to Create a Fun Circus Tent Icon By: Andrei Marius Roll up, roll up! In the following tutorial you will learn how to create a simple circus tent icon. You may discover some interesting things about
Open-File Report 2010 1076. By Daniel H. Knepper, Jr. U.S. Department of the Interior U.S. Geological Survey
 Distribution of Potential Hydrothermally Altered Rocks in Central Colorado Derived From Landsat Thematic Mapper Data: A Geographic Information System Data Set By Daniel H. Knepper, Jr. Open-File Report
and satellite image download with the USGS GloVis portal
 Tutorial: NDVI calculation with SPRING GIS and satellite image download with the USGS GloVis portal Content overview: Downloading data from GloVis: p 2 Using SPRING GIS: p 11 This document is meant to
Automated cloud cover assessment for Landsat TM images
 Automated cloud cover assessment for Landsat TM images Ben Hollingsworth Liqiang Chen Stephen E. Reichenbach Computer Science and Engineering Department University of Nebraska Lincoln, Lincoln, NE 68588-0115
Multiangle cloud remote sensing from
 Multiangle cloud remote sensing from POLDER3/PARASOL Cloud phase, optical thickness and albedo F. Parol, J. Riedi, S. Zeng, C. Vanbauce, N. Ferlay, F. Thieuleux, L.C. Labonnote and C. Cornet Laboratoire
Rapid Assessment of Annual Deforestation in the Brazilian Amazon Using MODIS Data
 Earth Interactions Volume 9 (2005) Paper No. 8 Page 1 Copyright 2005, Paper 09-008; 8,957 words, 5 Figures, 0 Animations, 7 Tables. http://earthinteractions.org Rapid Assessment of Annual Deforestation
Remote Sensing and Land Use Classification: Supervised vs. Unsupervised Classification Glen Busch
 Remote Sensing and Land Use Classification: Supervised vs. Unsupervised Classification Glen Busch Introduction In this time of large-scale planning and land management on public lands, managers are increasingly
Objectives. Raster Data Discrete Classes. Spatial Information in Natural Resources FANR 3800. Review the raster data model
 Spatial Information in Natural Resources FANR 3800 Raster Analysis Objectives Review the raster data model Understand how raster analysis fundamentally differs from vector analysis Become familiar with
Environmental Remote Sensing GEOG 2021
 Environmental Remote Sensing GEOG 2021 Lecture 4 Image classification 2 Purpose categorising data data abstraction / simplification data interpretation mapping for land cover mapping use land cover class
A remote sensing instrument collects information about an object or phenomenon within the
 Satellite Remote Sensing GE 4150- Natural Hazards Some slides taken from Ann Maclean: Introduction to Digital Image Processing Remote Sensing the art, science, and technology of obtaining reliable information
VIIRS-CrIS mapping. NWP SAF AAPP VIIRS-CrIS Mapping
 NWP SAF AAPP VIIRS-CrIS Mapping This documentation was developed within the context of the EUMETSAT Satellite Application Facility on Numerical Weather Prediction (NWP SAF), under the Cooperation Agreement
Pantone Matching System Color Chart PMS Colors Used For Printing
 Pantone Matching System Color Chart PMS Colors Used For Printing Use this guide to assist your color selection and specification process. This chart is a reference guide only. Pantone colors on computer
Outline. Multitemporal high-resolution image classification
 IGARSS-2011 Vancouver, Canada, July 24-29, 29, 2011 Multitemporal Region-Based Classification of High-Resolution Images by Markov Random Fields and Multiscale Segmentation Gabriele Moser Sebastiano B.
Scanners and How to Use Them
 Written by Jonathan Sachs Copyright 1996-1999 Digital Light & Color Introduction A scanner is a device that converts images to a digital file you can use with your computer. There are many different types
Closest Spectral Fit for Removing Clouds and Cloud Shadows
 Closest Spectral Fit for Removing Clouds and Cloud Shadows Qingmin Meng, Bruce E. Borders, Chris J. Cieszewski, and Marguerite Madden Abstract Completely cloud-free remotely sensed images are preferred,
Final Software Tools and Services for Traders
 Final Software Tools and Services for Traders TPO and Volume Profile Chart for NinjaTrader Trial Period The software gives you a 7-day free evaluation period starting after loading and first running the
ArcGIS Agricultural Land Use Maps from the Mississippi Cropland Data Layer
 ArcGIS Agricultural Land Use Maps from the Mississippi Cropland Data Layer Fred L. Shore, Ph.D. Mississippi Department of Agriculture and Commerce Jackson, MS, USA fred_shore@nass.usda.gov Rick Mueller
Green = 0,255,0 (Target Color for E.L. Gray Construction) CIELAB RGB Simulation Result for E.L. Gray Match (43,215,35) Equal Luminance Gray for Green
 CIELAB RGB Simulation Result for E.L. Gray Match (43,215,35) Equal Luminance Gray for Green") Red = 255,0,0 (Target Color for E.L. Gray Construction) CIELAB RGB Simulation Result for E.L. Gray Match (184,27,26) Equal Luminance Gray for Red = 255,0,0 (147,147,147) Mean of Observer Matches to Red=255
Red = 255,0,0 (Target Color for E.L. Gray Construction) CIELAB RGB Simulation Result for E.L. Gray Match (184,27,26) Equal Luminance Gray for Red = 255,0,0 (147,147,147) Mean of Observer Matches to Red=255
How To Color Print
 Pantone Matching System Color Chart PMS Colors Used For Printing Use this guide to assist your color selection and specification process. This chart is a reference guide only. Pantone colors on computer
Satellite Snow Monitoring Activities Project CRYOLAND
 Satellite Snow Monitoring Activities Project CRYOLAND Background material for participants to the Workshop on European Snow Monitoring Perspectives, Darmstadt, 4-5 December 2012. CryoLand provides Snow,
Object-Oriented Approach of Information Extraction from High Resolution Satellite Imagery
 IOSR Journal of Computer Engineering (IOSR-JCE) e-issn: 2278-0661,p-ISSN: 2278-8727, Volume 17, Issue 3, Ver. IV (May Jun. 2015), PP 47-52 www.iosrjournals.org Object-Oriented Approach of Information Extraction
SEMI-AUTOMATED CLOUD/SHADOW REMOVAL AND LAND COVER CHANGE DETECTION USING SATELLITE IMAGERY
 SEMI-AUTOMATED CLOUD/SHADOW REMOVAL AND LAND COVER CHANGE DETECTION USING SATELLITE IMAGERY A. K. Sah a, *, B. P. Sah a, K. Honji a, N. Kubo a, S. Senthil a a PASCO Corporation, 1-1-2 Higashiyama, Meguro-ku,
COLOR THEORY WORKSHEET
 COLOR THEORY WORKSHEET Use color pencils to complete the following exercises Name: Period Date PRIMARY COLORS cannot be made from any combination of colors. Fade intensity from top left to bottom right
Volcanic Ash Monitoring: Product Guide
 Doc.No. Issue : : EUM/TSS/MAN/15/802120 v1a EUMETSAT Eumetsat-Allee 1, D-64295 Darmstadt, Germany Tel: +49 6151 807-7 Fax: +49 6151 807 555 Date : 2 June 2015 http://www.eumetsat.int WBS/DBS : EUMETSAT
APPLICATION OF MULTITEMPORAL LANDSAT DATA TO MAP AND MONITOR LAND COVER AND LAND USE CHANGE IN THE CHESAPEAKE BAY WATERSHED
 APPLICATION OF MULTITEMPORAL LANDSAT DATA TO MAP AND MONITOR LAND COVER AND LAND USE CHANGE IN THE CHESAPEAKE BAY WATERSHED S. J. GOETZ Woods Hole Research Center Woods Hole, Massachusetts 054-096 USA
EO Information Services in support of West Africa Coastal vulnerability - Service Utility Review -
 EO Information Services in support of West Africa Coastal vulnerability - Service Utility Review - Christian Hoffmann, GeoVille World Bank HQ, Washington DC Date : 24 February 2012 Content - Project background
SAFNWC/MSG Cloud type/height. Application for fog/low cloud situations
 SAFNWC/MSG Cloud type/height. Application for fog/low cloud situations 22 September 2011 Hervé LE GLEAU, Marcel DERRIEN Centre de météorologie Spatiale. Lannion Météo-France 1 Fog or low level clouds?
Land Cover Mapping of the Comoros Islands: Methods and Results. February 2014. ECDD, BCSF & Durrell Lead author: Katie Green
 Land Cover Mapping of the Comoros Islands: Methods and Results February 2014 ECDD, BCSF & Durrell Lead author: Katie Green About the ECDD project The ECDD project was run by Bristol Conservation & Science
Resolutions of Remote Sensing
 Resolutions of Remote Sensing 1. Spatial (what area and how detailed) 2. Spectral (what colors bands) 3. Temporal (time of day/season/year) 4. Radiometric (color depth) Spatial Resolution describes how
Realization of a UV fisheye hyperspectral camera
 Realization of a UV fisheye hyperspectral camera Valentina Caricato, Andrea Egidi, Marco Pisani and Massimo Zucco, INRIM Outline Purpose of the instrument Required specs Hyperspectral technique Optical
Accuracy Assessment of Land Use Land Cover Classification using Google Earth
 American Journal of Environmental Protection 25; 4(4): 9-98 Published online July 2, 25 (http://www.sciencepublishinggroup.com/j/ajep) doi:.648/j.ajep.2544.4 ISSN: 228-568 (Print); ISSN: 228-5699 (Online)
Tour of the Pantograph Planner
 (714) 989-6891 Instructions for PANTOGRAPH PLANNER The Pantograph Planner helps to free the quilter from the frustrations of positioning the rows for edge to edge quilting. This document provides step
Lab #8: Introduction to ENVI (Environment for Visualizing Images) Image Processing
 Image Processing") Lab #8: Introduction to ENVI (Environment for Visualizing Images) Image Processing ASSIGNMENT: Display each band of a satellite image as a monochrome image and combine three bands into a color image, and
Lab #8: Introduction to ENVI (Environment for Visualizing Images) Image Processing ASSIGNMENT: Display each band of a satellite image as a monochrome image and combine three bands into a color image, and
Land-Cover and Imperviousness Data for Regional Areas near Denver, Colorado; Dallas- Fort Worth, Texas; and Milwaukee-Green Bay, Wisconsin - 2001
 U.S. Geological Survey Data Series Land-Cover and Imperviousness Data for Regional Areas near Denver, Colorado; Dallas- Fort Worth, Texas; and Milwaukee-Green Bay, Wisconsin - 2001 By James Falcone and
Name Class Date. spectrum. White is not a color, but is a combination of all colors. Black is not a color; it is the absence of all light.
 Exercises 28.1 The Spectrum (pages 555 556) 1. Isaac Newton was the first person to do a systematic study of color. 2. Circle the letter of each statement that is true about Newton s study of color. a.
DETECTING LANDUSE/LANDCOVER CHANGES ALONG THE RING ROAD IN PESHAWAR CITY USING SATELLITE REMOTE SENSING AND GIS TECHNIQUES
 ------------------------------------------------------------------------------------------------------------------------------- Full length Research Paper -------------------------------------------------------------------------------------------------------------------------------
Using Remote Sensing to Monitor Soil Carbon Sequestration
 Using Remote Sensing to Monitor Soil Carbon Sequestration E. Raymond Hunt, Jr. USDA-ARS Hydrology and Remote Sensing Beltsville Agricultural Research Center Beltsville, Maryland Introduction and Overview
Multi-Zone Adjustment
 Written by Jonathan Sachs Copyright 2008 Digital Light & Color Introduction Picture Window s 2-Zone Adjustment and3-zone Adjustment transformations are powerful image enhancement tools designed for images
RiMONITOR. Monitoring Software. for RIEGL VZ-Line Laser Scanners. Ri Software. visit our website www.riegl.com. Preliminary Data Sheet
 Monitoring Software RiMONITOR for RIEGL VZ-Line Laser Scanners for stand-alone monitoring applications by autonomous operation of all RIEGL VZ-Line Laser Scanners adaptable configuration of data acquisition
How to calculate reflectance and temperature using ASTER data
 How to calculate reflectance and temperature using ASTER data Prepared by Abduwasit Ghulam Center for Environmental Sciences at Saint Louis University September, 2009 This instructions walk you through
Lake Monitoring in Wisconsin using Satellite Remote Sensing
 Lake Monitoring in Wisconsin using Satellite Remote Sensing D. Gurlin and S. Greb Wisconsin Department of Natural Resources 2015 Wisconsin Lakes Partnership Convention April 23 25, 2105 Holiday Inn Convention
GOES-R AWG Cloud Team: ABI Cloud Height
 GOES-R AWG Cloud Team: ABI Cloud Height June 8, 2010 Presented By: Andrew Heidinger 1 1 NOAA/NESDIS/STAR 1 Outline Executive Summary Algorithm Description ADEB and IV&V Response Summary Requirements Specification
Change Detection In Satellite Observed Nightime Lights: 1992-2003
 Change Detection In Satellite Observed Nightime Lights: 1992-2003 Chris Elvidge, Earth Observation Group NOAA National Geophysical Data Center (NGDC). Boulder, Colorado chris.elvidge@noaa.gov Kim Baugh,