Degree Production and Cost Trends
|
|
|
- Marilyn Hicks
- 8 years ago
- Views:
Transcription
1 Degree Production and Cost Trends A National Analysis August 2010 A report from the State Higher Education Executive Officers utilizing the State Policy Resource Connection (SPRC) with support from Lumina Foundation for Education. The views expressed in this publication are those of the authors and do not necessarily represent those of Lumina Foundation for Education, their officers, or employees.

2 Tables of Contents Overview and Purpose.2 Methodology..3 National Trends in Enrollment, Degrees and Completions from State Level Growth Rates in Enrollment, Degrees and Completions from Degree Production Ratios (Degrees per 100 FTE) Among States in Conclusion.22 Appendix A Definitions.23 Appendix B Carnegie Classification Groupings.25 Appendix C Limitations in Data..26 1
 Among States in 2007.18 Conclusion.")
3 Overview and Purpose The international imperative for postsecondary education is growing, and the push for state and national action is acute. To remain globally competitive, the United States must expedite efforts to further develop a well educated citizenry. Recognizing this urgency, the President, several foundations, policy organizations, and states recently set bold college completion goals: President Obama called for the U.S. to be first in the world again in college attainment by Lumina Foundation for Education set a national goal for 60 percent of Americans to have a highquality degree or credential by The Bill & Melinda Gates Foundation aims to double the number of low-income adults who earn a postsecondary degree or credential with genuine value in the marketplace by age 26. Complete College America, along with their Alliance of 24 states, set a national goal that six out of 10 young adults in the U.S. will have a college degree or credential of value by Each state faces its own set of demographic and economic challenges. States and institutions operate in unique contexts of student populations, fiscal realities, and higher education governance structures, and undoubtedly will take different approaches to achieve their completion goals. Many states are experiencing dramatic demographic shifts requiring significant improvement in educational attainment among traditionally underrepresented populations. Others were especially hard hit by the recession and, in many cases, full recovery will require a more educated human capital in order to advance a more diverse economy. Despite these differences, however, the national focus must be the same - dramatically increasing the educational attainment of each state s citizens. Given the current and foreseeable fiscal constraints, the states and their public colleges and universities will need to work creatively and efficiently in order to meet this demand. In an effort to provide a context for state policymakers and institutional leaders, this report presents an overview and analysis of trends in degree and completion production, costs per degree and completion, and enrollment in public higher education. This report is the first in a series aimed at providing information to states that will help identify pertinent issues, challenges, and opportunities related to degree productivity. The database constructed by the Delta Cost Project is the principal source of data for this study, employing many of its metrics and calculations to build on previous reports. While our debt to the Delta Cost Project is great, close readers will note some modest technical differences. In order to maximize utility to SHEEO member agencies, and be consistent with other planned SHEEO studies, the analysis presented here includes some additional institutions data and employs slightly different institutional classifications. 2

4 Methodology For the purposes of this study, public postsecondary institutions were assembled into six groups based on their Carnegie 2005 classifications. No independent institutions were included in the analysis. These six groups include: 1. Associate s 1 2. Baccalaureate/Master s 2 3. Doctoral 4. Research, High Activity 5. Research, Very High Activity Because this study employs change over time, states that did not have data for a Carnegie group in both 1997 and 2007 were excluded from the analysis. These include Alaska, Connecticut, and Kentucky at the Associate s level and Nevada at the Baccalaureate and Master s level. These states had data in 2007 for the group, but not in Table A in Appendix B shows the original Carnegie 2005 classifications and the groupings used for this report. Institutions with no data for a Carnegie 2005 classification were excluded from the analysis. In some instances, the IPEDS reporting procedures have led to data for multiple institutions being grouped under a single institution name. The analysis used the following variables from the Delta Cost Project: full-time-equivalent enrollment, total degrees awarded total completions, and education and related expenses. Additionally, the Higher Education Cost Adjustment (HECA) used in the State Higher Education Finance Report was applied to state-level data to adjust for inflation. The glossary in Appendix A describes this element in more detail. 1. Full-Time Equivalent Enrollment (FTE): The Delta Cost Project uses the same formula employed by the U.S. Department of Education to produce Full-Time Equivalent enrollment data published annually in the Digest of Education Statistics. 2. Total Degrees Awarded: The sum total of Associate s degrees, Baccalaureate degrees, Master s degrees, Doctoral degrees and First Professional degrees as reported to IPEDS. 3. Completions: The sum total of degrees (see above) plus certificates (Post-Baccalaureate, Post- Master s and Post-Professional) and total awards (awards less than one year, equal to one year but less than two, and equal to two years but less than four) as reported to IPEDS. 1 Includes institutions classified as baccalaureate institutions that predominantly award Associate s degrees. Associate Institutions with a special Carnegie classification were omitted from the analysis as well. 2 Any institution that had a baccalaureate classification (with the exception of those that were included as Associate s Institutions) and any institution that had a Master s classification. 3

5 4. Education and Related Expenses: Total spending on direct education costs. Education and Related expenses include spending on instruction, student services, and the education share of central academic and administrative support and operations and maintenance. This is a Delta Cost Project variable derived from IPEDS reported data. It should be noted that these measures (annual spending divided by annual degree or completion production) are useful, but still quite crude indicators of the cost per degree or completion. Due to limitations in the data, there is still considerable research to be done in the area of different cost mechanisms related to different degree types and award levels. Please refer to Appendix C for more information on data limitations. 4
 are useful, but still quite crude indicators of the cost per degree or completion.")
6 National Trends in FTE Enrollment and Degrees and Completions: Table 1 examines the total number of FTE enrollments, degrees and completions, nationally and by institution type in 1997, 2002 and 2007, as well as the percent change in each category over time. FTE enrollments grew by 22 percent. Degrees and completions grew 26 percent and 30 percent respectively. Growth in degrees and completions exceeded enrollment growth in all Carnegie classes. Completions in the Associate s institutions grew by 41 percent. This is substantial growth compared to the 28 percent increase in FTE enrollment during the same time period. Degrees in the Associate s institutions grew by 30 percent. Table 1 also indicates that the most rapid growth in degrees awarded occurred during 2002 to 2007, the last five years of this ten-year period. Growth in degrees awarded logically lags a few years behind enrollment increases, which outpaced or equaled degree and completion growth in the first five years, so this finding is unsurprising. Enrollment growth accelerated, especially in Associate s institutions, during the recession beginning in 2001, and the surge of growth continued through The enrollment growth in this period would especially influence completions in 2007 and beyond. In a subsequent study, SHEEO plans to do further analysis on the growth of certificates and degrees, considering both disciplines and the award level. 5

7 Table 1 FTE, Degrees, and Completions by Carnegie Grouping (Public Institutions) % Change 1997 to 2002 % Change 2002 to 2007 % Change 1997 to FTE 2,809,147 3,268,622 3,591,949 16% 10% 28% All Degrees 389, , ,298 8% 21% 30% All Completions 570, , ,577 13% 25% 41% Baccalaureate/Master's FTE 1,852,521 1,995,645 2,221,606 8% 11% 20% All Degrees 398, , ,923 8% 17% 27% All Completions 403, , ,889 8% 18% 27% Doctoral FTE 295, , ,050 7% 7% 15% All Degrees 68,028 70,441 81,449 4% 16% 20% All Completions 69,428 72,143 83,647 4% 16% 20% Research, High Activity FTE 951,075 1,042,161 1,146,998 10% 10% 21% All Degrees 221, , ,005 6% 16% 24% All Completions 223, , ,748 7% 17% 25% Research, Very High Activity FTE 1,635,050 1,776,078 1,927,958 9% 9% 18% All Degrees 400, , ,359 7% 15% 23% All Completions 411, , ,780 6% 15% 22% All Sectors FTE 7,543,340 8,398,048 9,227,561 11% 10% 22% All Degrees 1,478,657 1,583,539 1,861,034 7% 18% 26% All Completions 1,678,938 1,828,137 2,184,641 9% 20% 30% 6

8 Table 2 examines the efficiency of degree production using a simple measure: degrees and completions per 100 FTE. The ratio of degrees and completions per 100 FTE was higher in 2007 than in Over that time period, there was a 3 percent increase in degrees per 100 FTE enrollment, and a 6 percent increase in completions per 100 FTE enrollment. In contrast, every sector but Baccalaureate/Master s institutions, however, shows the ratio of degrees and completions per 100 FTE was lower in 2002 than in While many factors may influence these statistics, it seems most likely that the sharp increase in enrollment in 2001 and 2002 is responsible for the dip in the ratio for those years and the spike in the ratio for the second five-year period of analysis. An analysis of the ratios between degrees and completions to enrollments at the state level rarely found substantial change from one year to another, but gradual increases in these ratios appear in many states. The growth in the ratio of degrees and completions to enrollment between 1997 and 2007 indicates increased degree production efficiency; future studies will indicate whether such increases in efficiency will be sustained. 7

9 Table 2 Degrees per 100 FTE and Completions per 100 FTE by Carnegie Grouping (Public Institutions) % Change 1997 to 2002 % Change 2002 to 2007 % Change 1997 to Degrees per 100 FTE % 10% 2% Completions per 100 FTE % 14% 10% Baccalaureate/Master's Degrees per 100 FTE % 5% 6% Completions per 100 FTE % 6% 6% Doctoral Degrees per 100 FTE % 8% 4% Completions per 100 FTE % 8% 5% Research, High Activity Degrees per 100 FTE % 6% 2% Completions per 100 FTE % 6% 3% Research, Very High Activity Degrees per 100 FTE % 6% 4% Completions per 100 FTE % 6% 3% All Sectors Degrees per 100 FTE % 7% 3% Completions per 100 FTE % 9% 6% 8

10 Table 3 shows national trends in cost per degree and completion with costs adjusted for inflation using HECA. Between 1997 and 2002, costs per degree and completion grew in every sector. The surge of enrollment beginning in 2001 tended to drive up spending before degree production caught up. While state funding stopped growing during the recession beginning in 2001, tuition revenues increased due to enrollment growth and price increases. Over the past decade, costs per degree and completion have been reasonably stable in every Carnegie grouping, with a modest amount of variation among the groupings. The cost per degree grew by 6 percent nationally in the first five years, and it declined by 6 percent in the last five years. This finding parallels trends in revenues per FTE student documented in SHEEO s annual State Higher Education Finance (SHEF) report 3. Fiscal year 2001 was the peak year of constant dollar per student funding for public higher education, before a dramatic decline ending in Funding levels recovered somewhat by 2007, but not to the level of Adjusted for inflation, funding per FTE student was similar in both 2007 and The SHEF report can be found online at 9

11 Table 3 Cost per Degree and Cost per Completion by Carnegie Grouping (Public Institutions) % Change 1997 to 2002 % Change 2002 to 2007 % Change 1997 to Cost per Degree $ 61,571 $ 70,485 $ 64,287 14% -9% 4% Cost per Completion $ 42,047 $ 45,899 $ 40,483 9% -12% -4% Baccalaureate/Masters Cost per Degree $ 50,774 $ 51,370 $ 48,875 1% -5% -4% Cost per Completion $ 50,149 $ 50,566 $ 47,929 1% -5% -4% Doctoral Cost per Degree $ 54,705 $ 55,749 $ 52,945 2% -5% -3% Cost per Completion $ 53,602 $ 54,433 $ 51,554 2% -5% -4% Research, High Activity Cost per Degree $ 53,058 $ 54,769 $ 53,057 3% -3% 0% Cost per Completion $ 52,628 $ 54,000 $ 52,154 3% -3% -1% Research, Very High Activity Cost per Degree $ 68,601 $ 71,490 $ 68,407 4% -4% 0% Cost per Completion $ 66,722 $ 70,108 $ 67,259 5% -4% 1% All Sectors Cost per Degree $ 58,970 $ 62,799 $ 59,048 6% -6% 0% Cost per Completion $ 51,935 $ 54,396 $ 50,301 5% -8% -3% 10

12 State Level Growth Rates in Enrollment and Degree Production: 1997 to 2007 Figure 1 displays the ten-year change ( ) in FTE enrollment and completions awarded at the Associate s institutions by state, ranked in descending order of growth in completions. The columns to the left of the graphic indicate the percentage of completions that were degrees in 1997 and 2007 respectively for each state. The right side of Figure 1 (bar chart) shows national completion growth exceeded (41 percent) FTE enrollment growth (28 percent) in Associate s institutions. Completions also grew faster than FTE in 29 states. Referencing the columns to the left of the bar chart (enumerated percent changes), national degree production as a percentage of completions in the Associate s sector decreased from 68 percent of completions in 1997 to 63 percent of completions in 2007, a significant shift, as discussed earlier. Interestingly, this trend was not consistent among states. In roughly half the states, degrees accounted for a larger percentage of total awards in 2007 when compared to 1997, and in many states the percentage of degrees to total completions did not change significantly over the ten-year period. Given the number of factors involved in these trends, closer examination of institutional and state data will be needed to understand the policies, practices, and demographic factors influencing these data. 11
 shows national completion growth exceeded (41 percent) FTE enrollment growth (28 percent) in Associate s institutions.")
13 12

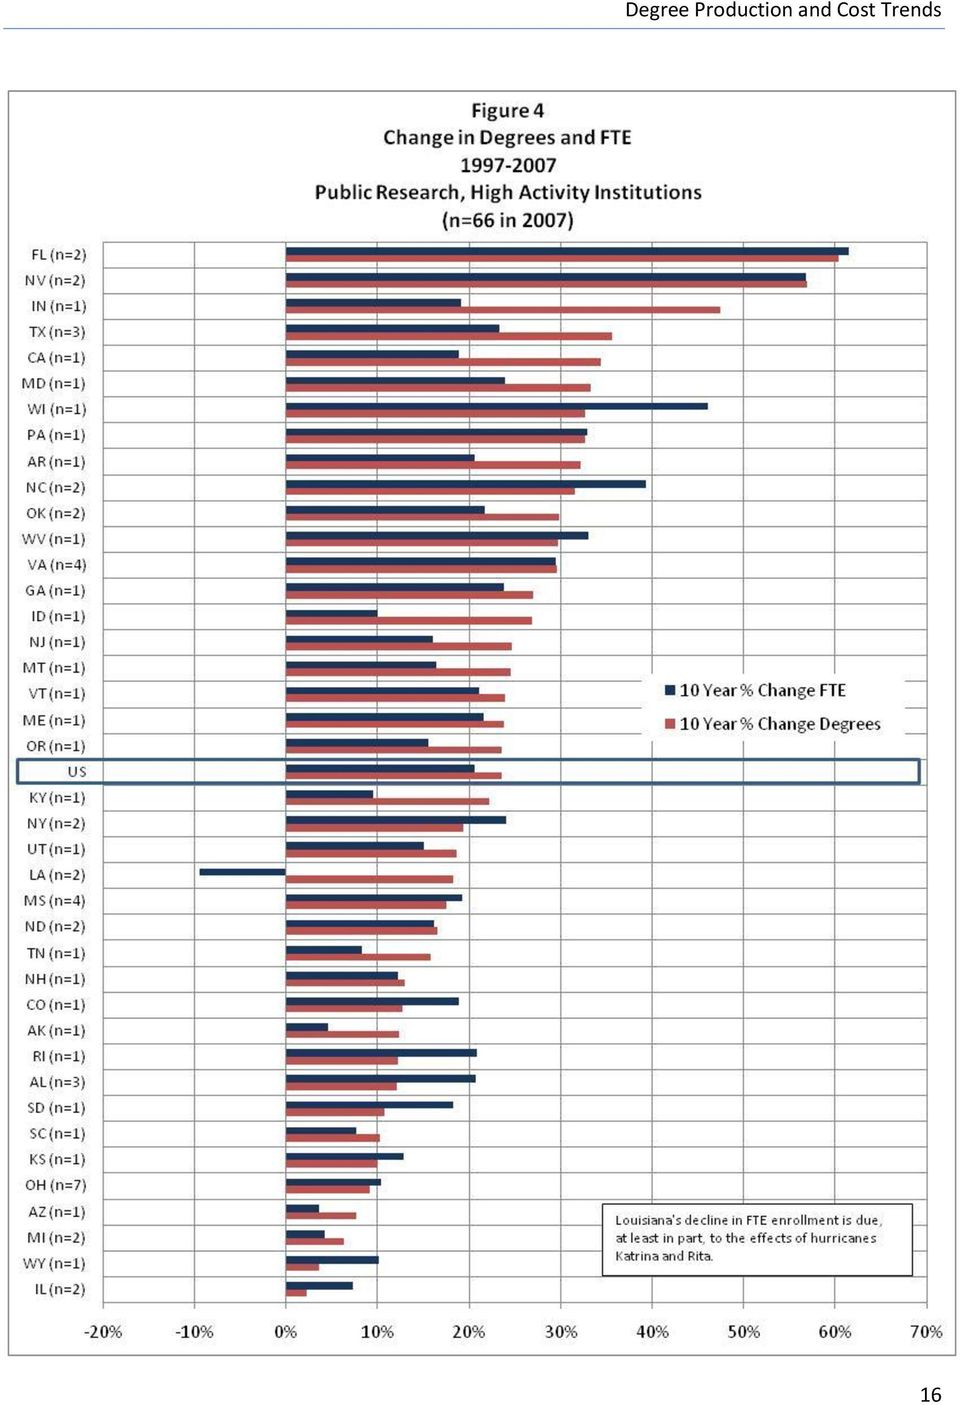
14 Figures 2 to 5 display the ten-year growth in enrollments and degrees granted for four-year degree granting institutions. Because approximately 98 percent of all completions in four-year institutions are degrees, completions are not highlighted for these groups. Nationally, enrollment in the 333 Baccalaureate and Master s institutions (Figure 2) grew by 20 percent compared to a 27 percent increase in degrees. Degree growth exceeded enrollment growth in 29 of 44 states and equaled it in one. The very rapid growth rate of enrollment and degrees in Florida and Arizona is due partly to the establishment of new institutions in this sector in these states. Nationally, enrollment in the 26 Doctoral institutions, those with relatively modest doctoral programs (Figure 3), grew by 15 percent and degrees grew by 20 percent. The rate of growth for degrees exceeded that for enrollment in 11 of the 19 states with such institutions. Since there are 19 states and 26 institutions in this classification, the data represent a single institution in many states. Nationally, enrollment in the 66 Research, High Activity institutions (Figure 4) grew by 21 percent and degrees by 24 percent. In 25 of 40 states, the growth rate for degrees exceeded that of enrollment. Nationally, the 60 public universities classified as Research, Very High Activity (Figure 5) experienced enrollment growth of 18 percent during this time period while degrees grew by 23 percent. In 26 of the 34 states with these institutions, degree production grew faster than enrollments. Since this analysis is based on just two data points for each state, these figures raise interesting questions and leave much to be explored. 13

15 14

16 15

17 16
18 17

19 Degree Production Ratios (Degrees per 100 FTE Enrollments) Among the States in 2007 Tables 5, 6, and 7 show the 2007 FTE enrollment, and degrees and completions 4 per FTE, for each Carnegie group as well as those statistics indexed to the United States average for that Carnegie group. As might be expected from Figures 1-5, there is great variation among the states on these variables. Table 5 displays data on enrollments, degrees, and all completions for Associate s institutions. In 2007, these institutions enrolled 3.6 million students and awarded 500,000 degrees plus an additional 300,000 awards and certificates. They awarded an average of 14 degrees and 22 awards for every 100 FTE. Among the states, enrollment growth from 1997 to 2007 for Associate s institutions ranges from a decrease of 4 percent to an increase of 99 percent. Some states are well below the national average in degrees per 100 FTE but, due to a large number of non-degree certificates, are above average in total completions. In other states, the opposite is true. These findings are an invitation to dig more deeply into other data in order to understand the factors driving differences among the states. Table 6 provides a similar analysis for four-year institutions with modest or no doctoral programs. These institutions (including both Baccalaureate and Master s as well as Doctoral institutions) enrolled 2.6 million students in 2007 and awarded 586,000 degrees. Across the country, Baccalaureate and Master s institutions awarded about 23 degrees for every 100 FTE, and the Doctoral institutions awarded about 24 degrees per 100 FTE. While there are differences among the states as well as within them, the variation in degree productivity ratios is somewhat lower than for Associate s institutions. Table 7 presents FTE enrollment and degree productivity ratios for High Activity and Very High Activity Research institutions. These universities in 2007 collectively enrolled 3.1 million FTE and awarded 767,000 degrees, an average of 25 degrees per 100 FTE. While many states fall between 90 percent and 110 percent of the national average on these indicators, some are quite a bit higher or lower than the national average. The number of transfer students may be a significant factor in explaining the differences among states in four-year degree production, but other factors should also be fully explored. Table 4 Degrees and Awards per 100 FTE, 2007 Sector Degrees/100 FTE Awards/100 FTE Associates 4 Baccalaureate/Masters Doctoral Research, High Activity Research, Very High Activity Completion data was only tracked for Associate s Institutions 18

20 FTE Table 5 FTE, Degrees, and Completions, 2007 Public Institutions Degrees per 100 FTE Completions per 100 FTE Year % Change 2007 Indexed to US 2007 Indexed to US AL 50,060 5% AR 35,724 73% AZ 100,717 29% CA 763,057 32% CO 43,075 8% DE 8,547 23% FL 209,228 21% GA 84,074 75% HI 15,161-4% IA 55,192 34% ID 7,709 28% IL 168,932 14% IN 44,152 99% KS 44,795 13% LA 34,845 27% MA 52,395 23% MD 66,477 53% ME 6,871 74% MI 127,624 25% MN 74,141 22% MO 54,385 33% MS 47,280 35% MT 4,518 27% NC 119,394 30% ND 5,423 8% NE 21,659 13% NH 7,321 40% NJ 103,141 31% NM 25,768 35% NV 26,971 54% NY 168,942 21% OH 96,262 33% OK 45,210 24% OR 46,204 8% PA 71,825 36% RI 9,567 15% SC 52,064 38% SD 4,624 30% TN 50,882 19% TX 293,546 38% UT 41,093 29% VA 87,672 35% VT 8,665 24% WA 120,022 4% WI 64,445 12% WV 10,342 16% WY 11,948 2% US 3,591,949 28%

21 Table 6 FTE and Degrees, 2007 Public Baccalaureate and Master's Institutions Public Doctoral Institutions FTE Degrees per 100 FTE FTE Degrees per 100 FTE Year % Change 2007 Indexed to US Year % Change 2007 Indexed to US AL 63,275 28% AR 8,842 15% AR 37,633 23% CO 11,670 14% AZ 10, % FL 18,693 23% CA 319,221 29% GA 14,642 12% CO 42,673 20% ID 10,043 4% CT 29,309 21% IL 18,851 7% DE 3,334 18% IN 27,147 2% FL 20, % LA 9,275 17% GA 77,386 28% MA 48,407 7% HI 3,599 30% MD 6,110 16% IA 11,009-6% MI 36,119 26% ID 17,046 28% NC 38,582 38% IL 50,573 11% OH 10,891-5% IN 43,982 19% OR 17,763 54% KS 23,218 21% PA 12,786 2% KY 58,498 17% SC 3,998-7% LA 58,885-9% SD 6,807 6% MA 34,184 12% TN 18,228 9% MD 59,091 41% TX 20,196 17% MI 77,110 26% US 339,050 15% MN 65,953 21% MO 58,254 9% MS 11,458 7% MT 7,344 0% NC 60,137 40% ND 3,578 11% NE 12,081-10% NJ 111,627 17% NM 9,660 14% NY 248,338 11% OH 16,373 8% OK 42,390 8% OR 13,129 11% PA 87,493 21% RI 6,875 8% SC 37,864 22% SD 6,740 6% TN 35,976 27% TX 128,220 26% UT 18,277 20% VA 50,880 18% WA 36,852 29% WI 77,908 10% WV 33,817 9% US 2,221,606 20%
22 Table 7 FTE and Degrees, 2007 Public Research, High Activity Institutions Public Research, Very High Activity Institutions FTE Degrees per 100 FTE FTE Degrees per 100 FTE Year % Change 2007 Indexed to US Year % Change 2007 Indexed to US AK 18,322 5% AL 13,369 11% AL 48,695 21% AZ 75,738 17% AR 15,263 21% CA 199,002 27% AZ 16,386 4% CO 65,390 21% CA 29,448 19% CT 24,761 36% CO 3,863 19% DE 18,652 4% FL 85,290 62% FL 117,143 33% GA 21,023 24% GA 47,927 23% ID 10,276 10% HI 16,788 13% IL 39,970 7% IA 48,729 4% IN 22,467 19% IL 65,613 10% KS 10,572 13% IN 73,188 13% KY 17,196 10% KS 43,520 12% LA 23,592-9% KY 23,500 15% MD 9,939 24% LA 28,015 16% ME 27,569 22% MD 31,823 12% MI 27,069 4% MI 103,847 13% MS 48,290 19% MN 41,474 20% MT 12,360 16% MO 51,632 23% NC 24,123 39% MT 10,562 2% ND 26,365 16% NC 51,454 18% NH 24,421 12% NE 31,347 0% NJ 6,663 16% NM 45,742 20% NV 35,093 57% NY 60,143 25% NY 15,128 24% OH 83,508 11% OH 143,723 10% OR 17,677 36% OK 42,165 22% PA 100,726 11% OR 18,851 16% SC 23,817 17% PA 29,106 33% TN 40,263 12% RI 13,033 21% TX 202,349 26% SC 15,977 8% UT 24,185 15% SD 9,428 18% VA 48,213 10% TN 16,458 8% WA 59,693 19% TX 81,050 23% WI 38,170 6% UT 17,985 15% US 1,927,958 18% VA 69,464 29% VT 10,685 21% WI 24,046 46% WV 25,036 33% WY 10,607 10% US 1,146,998 21%
23 Conclusion Issues of degree and cost productivity will continue to be at the forefront of state and national public agendas in higher education. While policymakers and educational leaders should be sensitive to the limitations of existing data as elaborated in Appendix C, the thoughtful analysis of available data can provide useful insights. This report provides a snapshot on national progress in the area of enrollment, degree, and completion growth over the past decade. Changes in FTE enrollment and awards (degrees and completions) are positive in the majority of states. In all Carnegie groupings, degree and completion productivity exceed FTE enrollment growth. While these trends are encouraging, this report is only the beginning of an extensive examination of degree and cost productivity. The variations among institutions warrant further and more-focused analysis of, the following: How do enrollment, degree, and completion growth vary by program discipline and length of program across the institutional sectors? What program disciplines tend to be more cost effective, yielding higher production rates? What policies, practices, and demographic features influence the variations across institutions, institutional sectors, and states? Additionally, future analysis needs to consider differences between institutional missions and program offerings as well as the use of a moving average of lag model cost calculation to improve alignment between enrollment, degree and completion production and the cost per degree and completion. These questions, while not exhaustive, provide a solid foundation upon which subsequent analysis will be based. It is of utmost importance the policymakers at the state and institutional levels continue to be aware of trends in and current levels of degree productivity. This is especially true in this era of changing demographics, increased focus on public higher education productivity, accountability, and limited resources. With continued studies such as these, policymakers will be well-equipped to address the degree productivity needs in their states. 22
24 Appendix A Definitions Cost Adjustments Employment Cost Index (ECI). A measure of the change in labor costs, outside the influence of employment shifts, among occupations and industries. The ECI for private industry white-collar occupations (excluding sales) accounts for 75 percent of the State Higher Education Executive Officers (SHEEO) Higher Education Cost Adjustment (HECA). HECA uses the compensation series that includes changes in wages and salaries plus employer costs for employee benefits. Sources: Bureau of Labor Statistics, U.S. Department of Labor. Gross Domestic Product Implicit Price Deflator (GDP IPD). Current dollar GDP divided by constant dollar GDP. This ratio is used to account for inflationary effects by reflecting both the change in the price of the bundle of goods comprising the GDP and the change to the bundle itself. The GDP IDP accounts for 25 percent of SHEEO HECA. Sources: Bureau of Economic Analysis, Office of Economic Policy, U.S. Department of Commerce. Higher Education Cost Adjustment (HECA). Measures price inflation experienced by colleges and universities. The HECA uses two external indices maintained by the federal government the ECI (accounts for 75 percent of the index) and the GDP IDP (accounts for the remainder). Source: SHEEO, SSDB. Delta Cost Project Variable Definitions (Source: Delta Cost Project Data Dictionary) Full-Time Equivalent Enrollment (FTE). Derived from the enrollment by race/ethnicity section of the fall enrollment survey. The FTE of an institution s part-time enrollment is estimated by multiplying part-time enrollment by factors that vary by control and level of institution and level of student; the estimated FTE of part-time enrollment is then added to the FTE of the institution. This formula is used by the U.S Department of Education to produce the full-time equivalent enrollment data published annually in the Digest of Education Statistics. Total Degrees Awarded. The total number of degrees conferred by a college, university, or other postsecondary education institution as official recognition for the successful completion of a program of studies. This is the sum of total Associate s Degrees, Baccalaureate Degrees, Master s Degrees, Doctoral Degrees, and First Professional Degrees. Total Completions. This annual component of IPEDS collects number of degrees and other formal awards (certificates) conferred. These data are reported by level, as well as by length of program for some. Institutions report all degrees and other awards conferred during an entire academic year, from July 1 of one calendar year through June 30 of the following year. This is the sum of total degrees (see above), total certificates (post-baccalaureate certificates, post-master s certificates, and first professional certificates) and total awards (total awards granted including less than one year, one to two year, and two to four year awards). 23
25 Education and Related Expenses. Total spending on direct educational costs. Education and related expenses includes spending on instruction, student services, and the education share of spending on central academic and administrative support, and operations and maintenance. The sum of education and related expenses, research and related expenses, public service and related expenses, and scholarships and fellowships totals to education and general expenses. This is a Delta Cost Project derived variable from collected IPEDS data. 24
26 Appendix B Carnegie Classification Groupings Table A Carnegie 2005 Classification and Groupings Carnegie 2005 Classification --Public Rural-serving Small --Public Rural-serving Medium --Public Rural-serving Large --Public Suburban-serving Single Campus --Public Suburban-serving Multi-campus --Public Urban-serving Single Campus --Public Urban-serving Multi-campus --Public Special Use* --Private Not-for-profit* --Private For-profit* --Public 2-year colleges under 4-year universities --Public 4-year Primarily --Private Not-for-profit 4-year Primarily * --Private For-profit 4-year Primarily * Research Universities (very high research activity) Research Universities (high research activity) Doctoral/Research Universities: Doctorate-granting Universities Master's Colleges and Universities (larger programs) Master's Colleges and Universities (medium programs) Master's Colleges and Universities (smaller programs) Baccalaureate Colleges--Arts & Sciences Baccalaureate Colleges--Diverse Fields Baccalaureate/ Colleges Special Focus Institutions--Theological seminaries, Bible colleges, and other faith-related institutions* Special Focus Institutions--Medical schools and medical centers* Special Focus Institutions--Other health professions schools* Special Focus Institutions--Schools of engineering* Special Focus Institutions--Other technology-related schools* Special Focus Institutions--Schools of business and management* Special Focus Institutions--Schools of art, music, and design* Special Focus Institutions--Schools of law* Special Focus Institutions--Other special-focus institutions* Tribal Colleges* Not classified* Not applicable, not in Carnegie universe (not accredited or nondegree-granting)* Grouped Carnegie Classification Special Research, Very High Activity Research, High Activity Doctoral Baccalaureate/Master's Baccalaureate/Master's Baccalaureate/Master's Baccalaureate/Master's Baccalaureate/Master's Special Special Special Special Special Special Special Special Special Special N/A Note: Classifications marked with an asterisk are not included in the report. Institutions classified with a special Carnegie Class in 2000 and reclassified in 2005 class were also excluded (i.e. Military institutions) N/A 25
27 Appendix C Limitations to Data It should be noted that these measures (annual spending divided by annual degree or completion production) are useful, but still quite crude indicators of the cost per degree or completion. The numbers in the denominator of these ratios (degrees and completions) vary substantially in the length of time required and the cost of instruction. Some completions are certificates requiring less than one year, and others are degrees involving two-year, four-year, or longer programs. Some completions are for relatively low cost programs (such as an associate of arts degree) and other awards are in higher cost programs such as technology, engineering, health professions, or graduate degrees. In addition, degrees awarded by a single institution often involve actual credit awarded by two or more institutions. Associate s institutions frequently provide instruction without awarding a degree to students who ultimately complete a degree at another institution. This factor tends to increase the cost per degree or completion in Associate s institutions, while the shorter length of associate and certificate programs should tend to decrease the cost. Also, four-year institutions accepting many transfer students will have a lower cost per degree than four-year institutions that have few transfer students. For these reasons, the differences in cost per degree or completion among different sectors of higher education would be strengthened with additional data on the length and program type of the degrees and certificates. Such data would make for richer analysis when examining sectors over time, or making comparisons among comparable institutions within a sector. 26
Certificate Production and the Race toward Higher Degree Attainment December 2010
 State Higher Education Executive Officers Certificate Production and the Race toward Higher Degree Attainment December 2010 ----- A report from the State Higher Education Executive Officers utilizing the
Degree Production Trends by Program Area
 Degree Production Trends by Program Area A National Analysis 2004 2009 August 2011 Chad Nash, Summer Fellow Katie Zaback, Policy Analyst with support from Chris Crumrine and Tanya I. Garcia State Higher
Regional Electricity Forecasting
 Regional Electricity Forecasting presented to Michigan Forum on Economic Regulatory Policy January 29, 2010 presented by Doug Gotham State Utility Forecasting Group State Utility Forecasting Group Began
2014-2015 Fact Sheet* Physical Therapist Assistant Education Programs October 2015
 Last updated: //0 Contact: accreditation@apta.org 04-0 Fact Sheet* Physical Therapist Assistant Education Programs October 0 *This fact sheet is in-progress and will be updated with new data sets & charts
How To Rate Plan On A Credit Card With A Credit Union
 Rate History Contact: 1 (800) 331-1538 Form * ** Date Date Name 1 NH94 I D 9/14/1998 N/A N/A N/A 35.00% 20.00% 1/25/2006 3/27/2006 8/20/2006 2 LTC94P I F 9/14/1998 N/A N/A N/A 35.00% 20.00% 1/25/2006 3/27/2006
U.S. Department of Housing and Urban Development: Weekly Progress Report on Recovery Act Spending
 U.S. Department of Housing and Urban Development: Weekly Progress Report on Recovery Act Spending by State and Program Report as of 3/7/2011 5:40:51 PM HUD's Weekly Recovery Act Progress Report: AK Grants
Enrollment Snapshot of Radiography, Radiation Therapy and Nuclear Medicine Technology Programs 2013
 Enrollment Snapshot of Radiography, Radiation Therapy and Nuclear Medicine Technology Programs 2013 A Nationwide Survey of Program Directors Conducted by the American Society of Radiologic Technologists
Enrollment Snapshot of Radiography, Radiation Therapy and Nuclear Medicine Technology Programs 2014
 Enrollment Snapshot of, Radiation Therapy and Nuclear Medicine Technology Programs 2014 January 2015 2015 ASRT. All rights reserved. Reproduction in any form is forbidden without written permission from
The Survey of Undergraduate and Graduate Programs in Communication. Sciences and Disorders has been conducted since 1982-83. Surveys were conducted in
 Introduction The Survey of Undergraduate and Graduate Programs in Communication Sciences and Disorders has been conducted since 1982-83. Surveys were conducted in 1982-83, 1983-84, 1984-85, 1985-86, 1986-87,
New York Public School Spending In Perspec7ve
 New York Public School Spending In Perspec7ve School District Fiscal Stress Conference Nelson A. Rockefeller Ins0tute of Government New York State Associa0on of School Business Officials October 4, 2013
State Corporate Income Tax-Calculation
 State Corporate Income Tax-Calculation 1 Because it takes all elements (a*b*c) to calculate the personal or corporate income tax, no one element of the corporate income tax can be analyzed separately from
The Economic Benefit of Postsecondary Degrees
 The Economic Benefit of Postsecondary A State and National Level Analysis December 2012 Katie Zaback Andy Carlson State Higher Education Executive Officers Matt Crellin National Center for Higher Education
ehealth Price Index Trends and Costs in the Short-Term Health Insurance Market, 2013 and 2014
 ehealth Price Index Trends and Costs in the Short-Term Health Insurance Market, 2013 and 2014 June 2015 1 INTRODUCTION In this report, ehealth provides an analysis of consumer shopping trends and premium
Federation of State Boards of Physical Therapy Jurisdiction Licensure Reference Guide Topic: License Renewal Who approves courses?
 Federation of State s of Physical The table below provides information on approval of continuing education/competence courses and for each jurisdiction. Summary Number of jurisdictions requiring approval
Standardized Pharmacy Technician Education and Training
 Standardized Pharmacy Technician Education and Training Kevin N. Nicholson, RPh, JD Vice President, Pharmacy Regulatory Affairs National Association of Chain Drug Stores May 19, 2009 Overview of how technicians
Enrollment Snapshot of Radiography, Radiation Therapy and Nuclear Medicine Technology Programs 2012
 Enrollment Snapshot of, and Nuclear Medicine Programs 2012 A Nationwide Survey of Program Directors Conducted by the American Society of Radiologic Technologists January 2013 2012 ASRT. All rights reserved.
States Future Economic Standing
 States Future Economic Standing if current education levels remain the same. Presentation by Joe Marks SREB Director of Data Services State Leaders Forum St. Petersburg, Florida November 17, 2004 1 The
Federation of State Boards of Physical Therapy Jurisdiction Licensure Reference Guide Topic: Continuing Competence
 This document reports CEU (continuing education units) and CCU (continuing competence units) requirements for renewal. It describes: Number of CEUs/CCUs required for renewal Who approves continuing education
Federation of State Boards of Physical Therapy Jurisdiction Licensure Reference Guide Topic: Continuing Competence
 This document reports CEU requirements for renewal. It describes: Number of required for renewal Who approves continuing education Required courses for renewal Which jurisdictions require active practice
ANTHONY P. CARNEVALE NICOLE SMITH JEFF STROHL
 State-Level Analysis HELP WANTED PROJECTIONS of JOBS and EDUCATION REQUIREMENTS Through 2018 JUNE 2010 ANTHONY P. CARNEVALE NICOLE SMITH JEFF STROHL Contents 1 Introduction 3 U.S. Maps: Educational concentrations
NHIS State Health insurance data
 State Estimates of Health Insurance Coverage Data from the National Health Interview Survey Eve Powell-Griner SHADAC State Survey Workshop Washington, DC, January 13, 2009 U.S. DEPARTMENT OF HEALTH AND
Florida Workers Comp Market
 Florida Workers Comp Market 10/5/10 Lori Lovgren 561-893-3337 Lori_Lovgren@ncci.com Florida Workers Compensation Rates 10-1-03 1-1-11 to 1-1-11* Manufacturing + 9.9% 57.8% Contracting + 7.3% 64.4 % Office
Table 11: Residual Workers Compensation Insurance Market By Jurisdiction
 Table 11: Residual Workers Market By AL Yes/NCCI 3 Two declination AK Yes/NCCI Two declination AZ Yes/NCCI Three declination, including one from the State Fund Agent/ ()/ Access? 4 Recommend NWCRP Recommend
Enrollment Snapshot of Radiography, Radiation Therapy and Nuclear Medicine Technology Programs 2015
 Enrollment Snapshot of, Radiation Therapy and Nuclear Medicine Technology Programs 2015 December 2015 2015 ASRT. All rights reserved. Reproduction in any form is forbidden without written permission from
TITLE POLICY ENDORSEMENTS BY STATE
 TITLE POLICY ENDORSEMENTS BY STATE State Endorsement ID Endorsement Description AK ARM ALTA 6 Adjustable (Variable) Rate AK BALLOON FNMA Balloon Endorsement AK CONDO ALTA 4 Condominium AK COPY FEE Copies
AGGREGATE PROGRAM DATA
 AGGREGATE PROGRAM DATA 2014 15 PHYSICAL THERAPIST EDUCATION PROGRAMS FACT SHEETS Beisner, Kathryn COMMISSION ON ACCREDITATION IN PHYSICAL THERAPY EDUCATION 1111 N. FAIRFAX ST. ALEXANDRIA, VA ACCREDITATION@APTA.ORG
NAAUSA Security Survey
 NAAUSA Security Survey 1. How would you rate the importance of each of the following AUSA security improvements. Very important Somewhat important Not too important Not at all important Secure parking
Table 12: Availability Of Workers Compensation Insurance Through Homeowner s Insurance By Jurisdiction
 AL No 2 Yes No See footnote 2. AK No Yes No N/A AZ Yes Yes Yes No specific coverage or rate information available. AR No Yes No N/A CA Yes No No Section 11590 of the CA State Insurance Code mandates the
Hourly Wages. For additional information, please contact:
 ` Hourly Wages For additional information, please contact: Jeanette Janota, Surveys & Analysis American Speech-Language-Hearing Association 2200 Research Boulevard Rockville, MD 20850-3289 800-498-2071,
COUNCIL OF GRADUATE PROGRAMS IN COMMUNICATION SCIENCES AND DISORDERS 1996-97 NATIONAL SURVEY OF UNDERGRADUATE AND GRADUATE PROGRAMS
 COUNCIL OF GRADUATE PROGRAMS IN COMMUNICATION SCIENCES AND DISORDERS 1996-97 NATIONAL SURVEY OF UNDERGRADUATE AND GRADUATE PROGRAMS Conducted by the Information Exchange Committee Linda Petrosino Bowling
Dashboard. Campaign for Action. Welcome to the Future of Nursing:
 Welcome to the Future of Nursing: Campaign for Action Dashboard About this Dashboard: These are graphic representations of measurable goals that the Campaign has selected to evaluate our efforts in support
U.S. Department of Education NCES 2011-460 NAEP. Tools on the Web
 U.S. Department of Education NCES 2011-460 NAEP Tools on the Web Whether you re an educator, a member of the media, a parent, a student, a policymaker, or a researcher, there are many resources available
2016 Individual Exchange Premiums updated November 4, 2015
 2016 Individual Exchange Premiums updated November 4, 2015 Within the document, you'll find insights across 50 states and DC with available findings (i.e., carrier participation, price leadership, gross
The Lincoln National Life Insurance Company Variable Life Portfolio
 The Lincoln National Life Insurance Company Variable Life Portfolio State Availability as of 12/14/2015 PRODUCTS AL AK AZ AR CA CO CT DE DC FL GA GU HI ID IL IN IA KS KY LA ME MP MD MA MI MN MS MO MT NE
The Economic Impact of Commercial Airports in 2010
 The Economic Impact of Commercial Airports in 2010 January 2012 Prepared for: Airports Council International North America Prepared by: CDM Smith 8805 Governor s Hill Drive Cincinnati, Ohio 45249 Table
Rates and Bills An Analysis of Average Electricity Rates & Bills in Georgia and the United States
 Rates and Bills An Analysis of Average Electricity Rates & Bills in Georgia and the United States During regulatory and public policy discussions of electricity costs for Georgia ratepayers, the conversation
The Case for Change The Case for Whopping Big Change
 TESTIMONY The California Assembly Higher Education Committee October 7, 2013 Presentation by: David Longanecker President, Western Interstate Commission for Higher Education (WICHE) FINANCING CALIFORNIA
LIMITED LIABILITY COMPANY ORGANIZATION CHART
 LIMITED LIABILITY COMPANY ORGANIZATION CHART The following Chart has been designed to allow you in a summary format, determine the minimum requirements to form a limited liability company in all 50 states
STATE HOMELESSNESS. The. An examination of homelessness, economic, housing, and demographic trends at the national and state levels.
 The STATE of HOMELESSNESS in America 2014 An examination of homelessness, economic, housing, and demographic trends at the national and state levels. The National Alliance to End Homelessness (Alliance)
Annual Survey of Public Pensions: State- and Locally- Administered Defined Benefit Data Summary Brief: 2015
 Annual Survey of Public Pensions: State- and Locally- Administered Defined Benefit Data Summary Brief: Economy-Wide Statistics Division Briefs: Public Sector Graphical Summary By Phillip Vidal Released
State Annual Report Due Dates for Business Entities page 1 of 10
 State Annual Report Due Dates for Business Entities page 1 of 10 If you form a formal business entity with the state, you may be required to file periodic reports on the status of your entity to preserve
The Future of Nursing Report
 The Future of Nursing Report Illinois Healthcare Action Coalition Strategic Planning Meeting June 16, 2011 Susan B. Hassmiller, PhD, RN, FAAN Campaign for Action Campaign Vision All Americans have access
Understanding Payroll Recordkeeping Requirements
 Understanding Payroll Recordkeeping Requirements 1 Presented by Sally Thomson, CPP Directory of Payroll Training American Payroll Association sthomson@americanpayroll.org 2 Agenda Recordkeeping Requirements
Vocational Rehabilitation
 Vocational Rehabilitation Senate Education Appropriations Committee October 7, 2015 Emily Sikes, Chief Legislative Analyst, OPPAGA oppaga THE FLORIDA LEGISLATURE S OFFICE OF PROGRAM POLICY ANALYSIS & GOVERNMENT
THE FUTURE OF HIGHER EDUCATION IN TEXAS
 THE FUTURE OF HIGHER EDUCATION IN TEXAS WOODY L. HUNT, CHAIRMAN HIGHER EDUCATION STRATEGIC PLANNING COMMITTEE September 17, 2015 1 Let s talk about higher education in Texas and the educational competitiveness
Return-to-Work Outcomes Among Social Security Disability Insurance (DI) Beneficiaries
 Beneficiaries") Return-to-Work Outcomes Among Social Security Disability Insurance (DI) Beneficiaries Yonatan Ben-Shalom Arif Mamun Presented at the CSDP Forum Washington, DC September 17, 2014 Acknowledgments The research
Return-to-Work Outcomes Among Social Security Disability Insurance (DI) Beneficiaries Yonatan Ben-Shalom Arif Mamun Presented at the CSDP Forum Washington, DC September 17, 2014 Acknowledgments The research
Final Expense Life Insurance
 Dignified Choice - Classic Series Final Expense Life Insurance Columbian Mutual Life Insurance Company Home Office: Binghamton, NY Administrative Service Office: Norcross, GA Columbian Life Insurance Company
Closing the College Attainment Gap between the U.S. and Most Educated Countries, and the Contributions to be made by the States
 National Center for Higher Education Management Systems Closing the College Attainment Gap between the U.S. and Most Educated Countries, and the Contributions to be made by the States Patrick J. Kelly
HEALTH INSURANCE PRICE INDEX REPORT FOR THE 2015
 HEALTH INSURANCE PRICE INDEX REPORT FOR THE 2015 OPEN ENROLLMENT PERIOD March 2015 ehealth 3.2015 Table of Contents Introduction... 3 Executive Summary and Highlights... 4 Nationwide Health Insurance Costs
What does Georgia gain. by investing in its
 What does Georgia gain by investing in its colleges and universities 2 A tremendous return: More economic prosperity. Less government spending. A stronger competitive advantage. A higher quality of life.
Federation of State Boards of Physical Therapy Jurisdiction Licensure Reference Guide Topic: PTA Supervision Requirements
 These tables provide information on what type of supervision is required for PTAs in various practice settings. Definitions Onsite Supervision General Supervision Indirect Supervision The supervisor is
Health Workforce Data Collection: Findings from a Survey of States
 Health Workforce Data Collection: Findings from a Survey of States Jean Moore, DrPH David Armstrong, PhD Health Workforce Technical Assistance Center School of Public Health University at Albany, SUNY
2014 APICS SUPPLY CHAIN COUNCIL OPERATIONS MANAGEMENT EMPLOYMENT OUTLOOK
 2014 APICS SUPPLY CHAIN COUNCIL OPERATIONS MANAGEMENT EMPLOYMENT OUTLOOK 1 ABOUT THIS REPORT APICS Supply Chain Council, in conjunction with the Cameron School of Business at the University of North Carolina-Wilmington,
INTRODUCTION. Figure 1. Contributions by Source and Year: 2012 2014 (Billions of dollars)
") Annual Survey of Public Pensions: State- and Locally- Administered Defined Benefit Data Summary Report: Economy-Wide Statistics Division Briefs: Public Sector By Phillip Vidal Released July 2015 G14-ASPP-SL
Annual Survey of Public Pensions: State- and Locally- Administered Defined Benefit Data Summary Report: Economy-Wide Statistics Division Briefs: Public Sector By Phillip Vidal Released July 2015 G14-ASPP-SL
Payroll Tax Chart Results
 Payroll Tax Chart Results Terminated Employee -- Involuntary Terminated Employee -- Vacation Pay Terminated Employee -- Voluntary Taxing Authority Federal Payment Date for Involuntary Termination No provision
Larry R. Kaiser, MD. President The University of Texas Health Science Center at Houston
 Larry R. Kaiser, MD President The University of Texas Health Science Center at Houston HealthCare Workforce: UTHealth Experience CHALLENGE To train the Healthcare Workforce of the 21 st Century SOLUTIONS:
Estimating college enrollment rates for Virginia public high school graduates
 ISSUES& ANSWERS REL 2011 No. 104 Estimating college enrollment rates for Virginia public high school graduates ISSUES& ANSWERS REL 2011 No. 104 Estimating college enrollment rates for Virginia public high
Wall Street & California s Student Debt Crisis
 ISSUE BRIEF Wall Street & California s Student Debt Crisis Center On Culture, Organizations and Politics Institute for Research on Labor and Employment University of California, Berkeley By Charlie Eaton
DEGREE QUALIFICATIONS PROFILE: A PRIMER FOR IR AND ASSESSMENT PROFESSIONALS
 DEGREE QUALIFICATIONS PROFILE: A PRIMER FOR IR AND ASSESSMENT PROFESSIONALS Natasha Jankowski, NILOA, Assistant Director George Kuh, NILOA, Director AIR May 28, 2014 The Plan Brief Introduction to DQP
Department of Business and Information Technology
 Department of Business and Information Technology College of Applied Science and Technology The University of Akron Summer 01 Graduation Survey Report 1. How would you rate your OVERALL EXPERIENCE at The
Life Settlements Source List
 BROKERS Ashar Group LLC - Life Settlement Specialists 407-772-1818 www.ashargroup.com Except AK NH VT Except AK NH VT Varies based on current market opportunities and groups that pass Ashar s due diligence
Oral Health Workforce for Low Income Children
 Oral Health Workforce for Low Income Children National Health Policy Forum April 20, 2007 Shelly Gehshan, Senior Program Director National Academy for State Health Policy National Academy for State Health
University of Florida
 T H E U N I V E R S I T Y O F F L O R I D A G O G R E AT E R University of Florida 1 THE NATION S GREAT PUBLIC RESEARCH UNIVERSITIES UNIVERSITY OF CALIFORNIA, BERKELEY UNIVERSITY OF CALIFORNIA, LOS ANGELES
REPORT: 2007-08 DEMOGRAPHIC SURVEY OF UNDERGRADUATE AND GRADUATE PROGRAMS IN COMMUNICATION SCIENCES AND DISORDERS
 1 Council of Academic Programs in Communication Sciences & Disorders (CAPCSD) REPORT: 2007-08 DEMOGRAPHIC SURVEY OF UNDERGRADUATE AND GRADUATE PROGRAMS IN COMMUNICATION SCIENCES AND DISORDERS Conducted
Trends in0. Trends Higher Education Series COLLEGE PRICING 2014
 Trends in0 1 Trends Higher Education Series COLLEGE PRICING 2014 See the Trends in Higher Education website at trends.collegeboard.org for the figures and tables in this report and for more information
LexisNexis Law Firm Billable Hours Survey Report
 LexisNexis Law Firm Billable Hours Survey Report Executive Summary Despite the critical impact on a firm s bottom line, it remains challenging for some attorneys and legal staff to efficiently capture
Florida 1/1/2015 Workers Compensation Rate Filing
 Florida 1/1/2015 Workers Compensation Rate Filing Kirt Dooley, FCAS, MAAA October 14, 2014 1 $ Billions 3.5 3.0 2.5 2.0 1.5 1.0 0.5 0.873 0.106 Florida s Workers Compensation Premium Volume 2.681 2.368
How To Know The Nursing Workforce
 FAST FACTS The Nursing Workforce 2014: Growth, Salaries, Education, Demographics & Trends RN Job Growth Rate (new and replacement) By State/Region, 2012-2022) 14 states project an annual growth rate of
In Utilization and Trend In Quality
 AHA Taskforce on Variation in Health Care Spending O Hare Hilton, Chicago February 10, 2010 Allan M. Korn, M.D., FACP Senior Vice President, Clinical Affairs and Chief Medical Officer Variation In Utilization
Nurse Practitioners and Physician Assistants in the United States: Current Patterns of Distribution and Recent Trends. Preliminary Tables and Figures
 Nurse Practitioners and Physician Assistants in the United States: Current Patterns of Distribution and Recent Trends Preliminary Tables and Figures Kevin M. Stange, PhD Assistant Professor Gerald R. Ford
Health Insurance Price Index Report for Open Enrollment and Q1 2014. May 2014
 Health Insurance Price Index Report for Open Enrollment and May 2014 ehealth 5.2014 Table of Contents Introduction... 3 Executive Summary and Highlights... 4 Nationwide Health Insurance Costs National
CINCINNATI HILLS CHRISTIAN ACADEMY COLLEGE QUESTIONNAIRE FOR STUDENTS
 CINCINNATI HILLS CHRISTIAN ACADEMY COLLEGE QUESTIONNAIRE FOR STUDENTS Complete & bring with you to your Junior College Planning Meeting. NAME: ADDRESS: EMAIL: BIRTHDATE: PHONE #: DATE: PLEASE READ BEFORE
Appendix: Data Supplement. This appendix contains supplementary information about the data and exhibits.
 Editor s Note: This online data supplement contains supplemental material that was not included with the published article by Denise A. Davis and Melanie D. Napier, Strategically Addressing the Nurse Shortage:
Download at www.iii.org/presentations
 Residual Markets, Uninsured Motorists and Competition in Maryland Auto Insurance Maryland Auto Insurance Plan Senate Hearing on Uninsured Motorists Annapolis, MD December 16, 2015 Download at www.iii.org/presentations
AN INSIDE LOOK AT SOCIAL RECRUITING IN THE USA
 AN INSIDE LOOK AT SOCIAL RECRUITING IN THE USA THE BULLHORN REACH RANKINGS REPORT TM WWW.BULLHORNREACH.COM @BULLHORNREACH JUNE 2012 COPYRIGHT 2012 BULLHORN, INC. ALL RIGHTS RESERVED. EXECUTIVE SUMMARY
STATUS OF ITEM FILINGS
 National Council on Compensation Insurance Regulatory Services JUNE 3, 2016 STATUS OF ITEM FILINGS IF-2016-06-01 ACTION NEEDED BACKGROUND IMPACT NCCI ACTION PERSON TO CONTACT Review changes in the Status
Ambulance Industry Receives Financial Relief Through the MMA
 Ambulance Industry Receives Financial Relief Through the MMA On June 25, 2004, the Centers for Medicare and Medicaid Services (CMS) issued Transmittal 220 to Medicare Contractors outlining changes to the
Preapproval Inspections for Manufacturing. Christy Foreman Deputy Director Division of Enforcement B Office of Compliance/CDRH
 Preapproval Inspections for Manufacturing Christy Foreman Deputy Director Division of Enforcement B Office of Compliance/CDRH Major Steps Review of the Quality System information Inspection requests generated
Broadband Technology Opportunities Program: Sustainable Broadband Adoption and Public Computer Centers
 Broadband Technology Opportunities Program: Sustainable Broadband Adoption and Public Computer Centers National Telecommunications and Information Agency (NTIA) U. S. Department of Commerce Funded by the
2014 Year in Review State Policies Impacting CTE. Catherine Imperatore, ACTE Andrea Zimmermann, NASDCTEc February 5, 2015
 2014 Year in Review State Policies Impacting CTE Catherine Imperatore, ACTE Andrea Zimmermann, NASDCTEc February 5, 2015 Background and Context Federal policies Perkins WIOA HEA Senate and Congressional
Kaiser Family Foundation/eHealthInsurance. August 2004
 AUGUST 2004 Revised Update on Individual Health Insurance Kaiser Family Foundation/eHealthInsurance August 2004 Revised Update on Individual Health Insurance B a c k g r o u n d In recent years, President
Surety Bond Requirements for Mortgage Brokers and Mortgage Bankers As of July 15, 2011
 Surety Bond Requirements for Mortgage Brokers and Mortgage Bankers As of July 15, 2011 State Mortgage Broker Bond Cancellation Mortgage Banker Bond Cancellation Notes & Citations AK $75,000 minimum for
Dental Therapist Initiatives, Access, and Changing State Practice Acts The ADHA Perspective: An Update
 Dental Therapist Initiatives, Access, and Changing State Practice Acts The ADHA Perspective: An Update Pam Quinones, RDH, BS President, ADHA April 29, 2012 I. The Dental Hygiene Workforce as a Partner
Workers Compensation: Practical Tips for Dealing With NCCI s Split Point Rating Change
 Workers Compensation: Practical Tips for Dealing With NCCI s Split Point Rating Change November 2012 Lockton Companies A key factor in your workers compensation premium is your experience mod. The e-mod
LexisNexis Law Firm Billable Hours Survey Top Line Report. June 11, 2012
 LexisNexis Law Firm Billable Hours Survey Top Line Report June 11, 2012 Executive Summary by Law Firm Size According to the survey, we found that attorneys were not billing all the time they worked. There
Foreign Language Enrollments in K 12 Public Schools: Are Students Prepared for a Global Society?
 Foreign Language s in K 2 Public Schools: Are Students Prepared for a Global Society? Section I: Introduction Since 968, the American Council on the Teaching of Foreign Languages (ACTFL) has conducted
Standardization of Technician Education Want it? Need it? Janet Teeters, M.S., R.Ph. Director of Accreditation Services ASHP
 Standardization of Technician Education Want it? Need it? Janet Teeters, M.S., R.Ph. Director of Accreditation Services ASHP Disclosure Director of Accreditation Services Standardized Technician Education
STATE INCOME TAX WITHHOLDING INFORMATION DOCUMENT
 STATE INCOME TAX WITHHOLDING INFORMATION DOCUMENT Zurich American Life Insurance Company (ZALICO) Administrative Offices: PO BOX 19097 Greenville, SC 29602-9097 800/449-0523 This document is intended to
Funding Your Technology and Archive Conversion Needs
 Funding Your Technology and Archive Conversion Needs Presented at the NACRC Legislative Conference March 5, 2011 Facilitators: Larry Burtness & Carol Foglesong Technology funding The question was asked
State Survey Results MULTI-LEVEL LICENSURE TITLE PROTECTION
 MULTI-LEVEL LICENSURE TITLE PROTECTION Prior AK MN TN MO AL MO KY VA AZ MS MO DC NYC NE HI ME OR IA RI PA IL TX VA KS WA LA WI MA WV Prior AK ME OR TN AL MI PA HI CO MS FL DC NC MN IA NE UT IL NV WA IN
HEALTH CARE IN RETIREMENT. GROWTH IN HEALTH CARE COSTS in the U.S. has significantly outpaced. Forces driving growth in health care spending
 HEALTH CARE IN RETIREMENT GROWTH IN HEALTH CARE COSTS in the U.S. has significantly outpaced overall inflation. From 1982 to 2013, spending on health care increased at an average of 5.1%, faster than all
AMFMM Benchmarking Data, 2010 11
 C APPENDIX AMFMM Benchmarking Data, 2010 11 Brian Iriye, MD, Chairman, AMFMM The data presented in this appendix are the results of the largest survey ever conducted to acquire facts that are specifically
ANALYSIS OF US AND STATE-BY-STATE CARBON DIOXIDE EMISSIONS AND POTENTIAL SAVINGS IN FUTURE GLOBAL TEMPERATURE AND GLOBAL SEA LEVEL RISE
 ANALYSIS OF US AND STATE-BY-STATE CARBON DIOXIDE EMISSIONS AND POTENTIAL SAVINGS IN FUTURE GLOBAL TEMPERATURE AND GLOBAL SEA LEVEL RISE by Paul Knappenberger SPPI ORIGINAL PAPER Updated April 2013 ANALYSIS
APICS OPERATIONS MANAGEMENT EMPLOYMENT OUTLOOK REPORT SUMMER 2013
 APICS OPERATIONS MANAGEMENT EMPLOYMENT OUTLOOK REPORT SUMMER 2013 1 ABOUT THIS REPORT APICS, in conjunction with the Cameron School of Business at the University of North Carolina Wilmington, is pleased
Moving TIM from Good to Great?
 FHWA Update: Traffic Incident Management Program Moving TIM from Good to Great? Iowa Traffic Safety Forum November 19, 2014 Mr. Jeff King (Retired Capt. AzDPS) Traffic Incident Management Public Safety
AmGUARD Insurance Company EastGUARD Insurance Company NorGUARD Insurance Company WestGUARD Insurance Company GUARD
 About Us For over 30 years, we have protected the interests of the small- to mid-sized businesses that insure with us. At Berkshire Hathaway Insurance Companies, we dedicate our efforts in the areas that
The Middle Market Power Index: Catalyzing U.S. Economic Growth
 The Power Index: Catalyzing U.S. Economic Growth In an exciting new collaboration, American Express and Dun & Bradstreet are combining forces to increase public understanding of the vital role that middle
The 80/20 Rule: How Insurers Spend Your Health Insurance Premiums
 SUMMARY The 80/20 Rule: How Insurers Spend Your Health Insurance Premiums The Affordable Care Act holds health insurers accountable to consumers and ensures that American families receive value for their
ADEA Survey of Dental School Seniors, 2014 Graduating Class Tables Report
 ADEA Survey of Dental School Seniors, 2014 Graduating Class Tables Report Published February 2015 Suggested Citation American Dental Education Association. (February 2015). ADEA Survey of Dental School
How To Regulate Rate Regulation
 Rate Regulation Introduction Concerns over the fairness and equity of insurer rating practices that attempt to charge higher premiums to those with higher actual and expected claims costs have increased