Performance Measures for Machine Learning
|
|
|
- Isaac Todd Goodman
- 10 years ago
- Views:
Transcription
1 Performance Measures for Machine Learning 1

2 Performance Measures Accuracy Weighted (Cost-Sensitive) Accuracy Lift Precision/Recall F Break Even Point ROC ROC Area 2

3 Accuracy Target: 0/1, -1/+1, True/False, Prediction = f(inputs) = f(x): 0/1 or Real Threshold: f(x) > thresh => 1, else => 0 threshold(f(x)): 0/1 #right / #total accuracy = Â i=1kn ( 1- (target i - threshold( f ( x r i )))) 2 p( correct ): p(threshold(f(x)) = target) N 3
))) 2 p( correct ):")
4 Confusion Matrix Predicted 1 Predicted 0 correct True 0 True 1 a c b d incorrect threshold accuracy = (a+d) / (a+b+c+d) 4
 /")
5 Prediction Threshold Predicted 1 Predicted 0 True 0 True 1 0 b 0 d threshold > MAX(f(x)) all cases predicted 0 (b+d) = total accuracy = %False = %0 s Predicted 1 Predicted 0 True 0 True 1 a 0 c 0 threshold < MIN(f(x)) all cases predicted 1 (a+c) = total accuracy = %True = %1 s 5
) all cases predicted 1 (a+c) = total accuracy = %True = %1")
6 optimal threshold 82% 0 s in data 18% 1 s in data 6

7 threshold demo 7
8 Problems with Accuracy Assumes equal cost for both kinds of errors cost(b-type-error) = cost (c-type-error) is 99% accuracy good? can be excellent, good, mediocre, poor, terrible depends on problem is 10% accuracy bad? information retrieval BaseRate = accuracy of predicting predominant class (on most problems obtaining BaseRate accuracy is easy) 8

9 Percent Reduction in Error 80% accuracy = 20% error suppose learning increases accuracy from 80% to 90% error reduced from 20% to 10% 50% reduction in error 99.90% to 99.99% = 90% reduction in error 50% to 75% = 50% reduction in error can be applied to many other measures 9

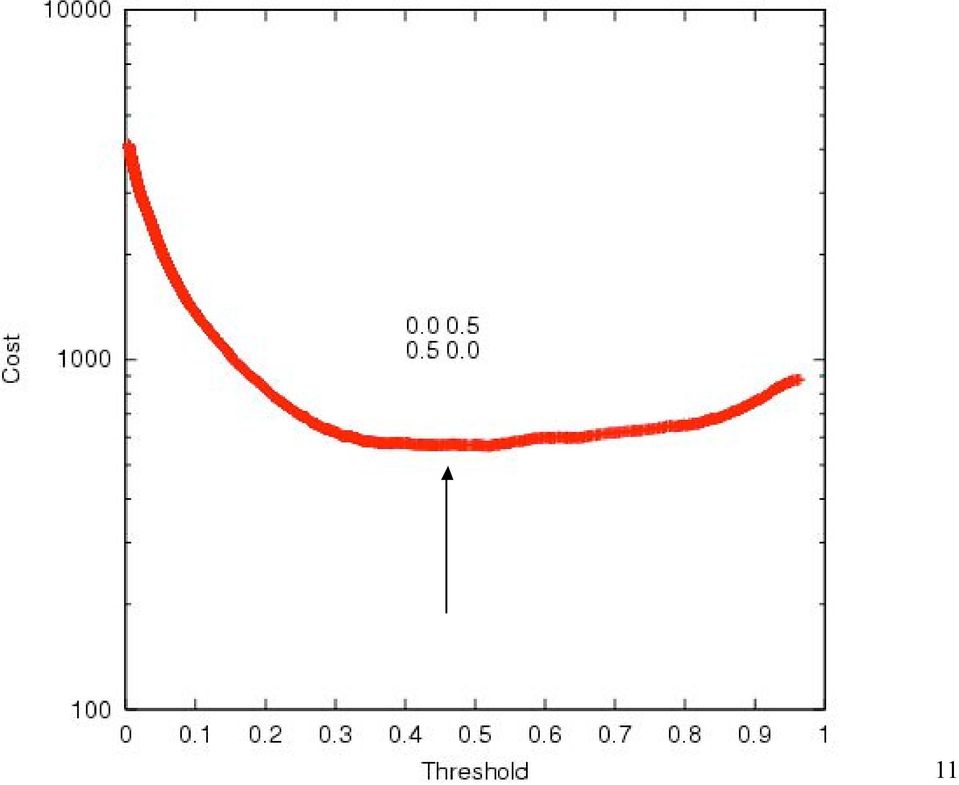
10 Costs (Error Weights) Predicted 1 Predicted 0 True 0 True 1 w a w c w b w d Often W a = W d = zero and W b W c zero 10

11 11
12 12

13 Lift not interested in accuracy on entire dataset want accurate predictions for 5%, 10%, or 20% of dataset don t care about remaining 95%, 90%, 80%, resp. typical application: marketing lift(threshold) = %positives > threshold % dataset > threshold how much better than random prediction on the fraction of the dataset predicted true (f(x) > threshold) 13

14 Lift Predicted 1 Predicted 0 True 0 True 1 a c b d lift = a (a + b) (a + c) (a + b + c + d) threshold 14
 (a + b + c + d)")
15 lift = 3.5 if mailings sent to 20% of the customers 15

16 Lift and Accuracy do not always correlate well Problem 1 Problem 2 (thresholds arbitrarily set at 0.5 for both lift and accuracy) 16
")
17 Precision and Recall typically used in document retrieval Precision: how many of the returned documents are correct precision(threshold) Recall: how many of the positives does the model return recall(threshold) Precision/Recall Curve: sweep thresholds 17
 Precision/Recall Curve: sweep")
18 Precision/Recall Predicted 1 Predicted 0 True 0 True 1 a c b d PRECISION = a /(a + c) RECALL = a /(a + b) threshold 18
 threshold")
19 19

20 Summary Stats: F & BreakEvenPt PRECISION = a /(a + c) RECALL = a /(a + b) harmonic average of precision and recall F = 2 * (PRECISION RECALL) (PRECISION + RECALL) BreakEvenPoint = PRECISION = RECALL 20
 BreakEvenPoint = PRECISION =")
21 better performance worse performance 21
22 F and BreakEvenPoint do not always correlate well Problem 1 Problem 2 22
23 Predicted 1 Predicted 0 Predicted 1 Predicted 0 True 0 True 1 true positive false positive false negative true negative True 0 True 1 TP FP FN TN Predicted 1 Predicted 0 Predicted 1 Predicted 0 True 0 True 1 hits false alarms misses correct rejections True 0 True 1 P(pr1 tr1) P(pr1 tr0) P(pr0 tr1) P(pr0 tr0) 23
24 ROC Plot and ROC Area Receiver Operator Characteristic Developed in WWII to statistically model false positive and false negative detections of radar operators Better statistical foundations than most other measures Standard measure in medicine and biology Becoming more popular in ML 24
25 ROC Plot Sweep threshold and plot TPR vs. FPR Sensitivity vs. 1-Specificity P(true true) vs. P(true false) Sensitivity = a/(a+b) = Recall = LIFT numerator 1 - Specificity = 1 - d/(c+d) 25
26 diagonal line is random prediction 26
27 Properties of ROC ROC Area: 1.0: perfect prediction 0.9: excellent prediction 0.8: good prediction 0.7: mediocre prediction 0.6: poor prediction 0.5: random prediction <0.5: something wrong! 27
28 Properties of ROC Slope is non-increasing Each point on ROC represents different tradeoff (cost ratio) between false positives and false negatives Slope of line tangent to curve defines the cost ratio ROC Area represents performance averaged over all possible cost ratios If two ROC curves do not intersect, one method dominates the other If two ROC curves intersect, one method is better for some cost ratios, and other method is better for other cost ratios 28
29 Problem 1 Problem 2 29
30 Problem 1 Problem 2 30
31 Problem 1 Problem 2 31
32 Summary the measure you optimize to makes a difference the measure you report makes a difference use measure appropriate for problem/community accuracy often is not sufficient/appropriate ROC is gaining popularity in the ML community only accuracy generalizes to >2 classes! 32
Evaluation & Validation: Credibility: Evaluating what has been learned
 Evaluation & Validation: Credibility: Evaluating what has been learned How predictive is a learned model? How can we evaluate a model Test the model Statistical tests Considerations in evaluating a Model
Performance Measures in Data Mining
 Performance Measures in Data Mining Common Performance Measures used in Data Mining and Machine Learning Approaches L. Richter J.M. Cejuela Department of Computer Science Technische Universität München
Knowledge Discovery and Data Mining
 Knowledge Discovery and Data Mining Lecture 15 - ROC, AUC & Lift Tom Kelsey School of Computer Science University of St Andrews http://tom.home.cs.st-andrews.ac.uk [email protected] Tom Kelsey ID5059-17-AUC
Health Care and Life Sciences
 Sensitivity, Specificity, Accuracy, Associated Confidence Interval and ROC Analysis with Practical SAS Implementations Wen Zhu 1, Nancy Zeng 2, Ning Wang 2 1 K&L consulting services, Inc, Fort Washington,
Data and Analysis. Informatics 1 School of Informatics, University of Edinburgh. Part III Unstructured Data. Ian Stark. Staff-Student Liaison Meeting
 Inf1-DA 2010 2011 III: 1 / 89 Informatics 1 School of Informatics, University of Edinburgh Data and Analysis Part III Unstructured Data Ian Stark February 2011 Inf1-DA 2010 2011 III: 2 / 89 Part III Unstructured
Data Mining Practical Machine Learning Tools and Techniques
 Credibility: Evaluating what s been learned Data Mining Practical Machine Learning Tools and Techniques Slides for Chapter 5 of Data Mining by I. H. Witten, E. Frank and M. A. Hall Issues: training, testing,
Overview. Evaluation Connectionist and Statistical Language Processing. Test and Validation Set. Training and Test Set
 Overview Evaluation Connectionist and Statistical Language Processing Frank Keller [email protected] Computerlinguistik Universität des Saarlandes training set, validation set, test set holdout, stratification
Quality and Complexity Measures for Data Linkage and Deduplication
 Quality and Complexity Measures for Data Linkage and Deduplication Peter Christen and Karl Goiser Department of Computer Science, Australian National University, Canberra ACT 0200, Australia {peter.christen,karl.goiser}@anu.edu.au
Business Case Development for Credit and Debit Card Fraud Re- Scoring Models
 Business Case Development for Credit and Debit Card Fraud Re- Scoring Models Kurt Gutzmann Managing Director & Chief ScienAst GCX Advanced Analy.cs LLC www.gcxanalyacs.com October 20, 2011 www.gcxanalyacs.com
Azure Machine Learning, SQL Data Mining and R
 Azure Machine Learning, SQL Data Mining and R Day-by-day Agenda Prerequisites No formal prerequisites. Basic knowledge of SQL Server Data Tools, Excel and any analytical experience helps. Best of all:
How To Cluster
 Data Clustering Dec 2nd, 2013 Kyrylo Bessonov Talk outline Introduction to clustering Types of clustering Supervised Unsupervised Similarity measures Main clustering algorithms k-means Hierarchical Main
Practical Data Science with Azure Machine Learning, SQL Data Mining, and R
 Practical Data Science with Azure Machine Learning, SQL Data Mining, and R Overview This 4-day class is the first of the two data science courses taught by Rafal Lukawiecki. Some of the topics will be
Performance Analysis of Naive Bayes and J48 Classification Algorithm for Data Classification
 Performance Analysis of Naive Bayes and J48 Classification Algorithm for Data Classification Tina R. Patil, Mrs. S. S. Sherekar Sant Gadgebaba Amravati University, Amravati [email protected], [email protected]
Online Performance Anomaly Detection with
 ΘPAD: Online Performance Anomaly Detection with Tillmann Bielefeld 1 1 empuxa GmbH, Kiel KoSSE-Symposium Application Performance Management (Kieker Days 2012) November 29, 2012 @ Wissenschaftszentrum Kiel
CSC574 - Computer and Network Security Module: Intrusion Detection
 CSC574 - Computer and Network Security Module: Intrusion Detection Prof. William Enck Spring 2013 1 Intrusion An authorized action... that exploits a vulnerability... that causes a compromise... and thus
An analysis of suitable parameters for efficiently applying K-means clustering to large TCPdump data set using Hadoop framework
 An analysis of suitable parameters for efficiently applying K-means clustering to large TCPdump data set using Hadoop framework Jakrarin Therdphapiyanak Dept. of Computer Engineering Chulalongkorn University
Mining the Software Change Repository of a Legacy Telephony System
 Mining the Software Change Repository of a Legacy Telephony System Jelber Sayyad Shirabad, Timothy C. Lethbridge, Stan Matwin School of Information Technology and Engineering University of Ottawa, Ottawa,
PREDICTING SUCCESS IN THE COMPUTER SCIENCE DEGREE USING ROC ANALYSIS
 PREDICTING SUCCESS IN THE COMPUTER SCIENCE DEGREE USING ROC ANALYSIS Arturo Fornés [email protected], José A. Conejero [email protected] 1, Antonio Molina [email protected], Antonio Pérez [email protected],
Performance Metrics. number of mistakes total number of observations. err = p.1/1
 p.1/1 Performance Metrics The simplest performance metric is the model error defined as the number of mistakes the model makes on a data set divided by the number of observations in the data set, err =
Data Mining Algorithms Part 1. Dejan Sarka
 Data Mining Algorithms Part 1 Dejan Sarka Join the conversation on Twitter: @DevWeek #DW2015 Instructor Bio Dejan Sarka ([email protected]) 30 years of experience SQL Server MVP, MCT, 13 books 7+ courses
Leak Detection Theory: Optimizing Performance with MLOG
 Itron White Paper Water Loss Management Leak Detection Theory: Optimizing Performance with MLOG Rich Christensen Vice President, Research & Development 2009, Itron Inc. All rights reserved. Introduction
Fraud Detection for Online Retail using Random Forests
 Fraud Detection for Online Retail using Random Forests Eric Altendorf, Peter Brende, Josh Daniel, Laurent Lessard Abstract As online commerce becomes more common, fraud is an increasingly important concern.
Artificial Neural Network, Decision Tree and Statistical Techniques Applied for Designing and Developing E-mail Classifier
 International Journal of Recent Technology and Engineering (IJRTE) ISSN: 2277-3878, Volume-1, Issue-6, January 2013 Artificial Neural Network, Decision Tree and Statistical Techniques Applied for Designing
T-61.3050 : Email Classification as Spam or Ham using Naive Bayes Classifier. Santosh Tirunagari : 245577
 T-61.3050 : Email Classification as Spam or Ham using Naive Bayes Classifier Santosh Tirunagari : 245577 January 20, 2011 Abstract This term project gives a solution how to classify an email as spam or
Data Mining - The Next Mining Boom?
 Howard Ong Principal Consultant Aurora Consulting Pty Ltd Abstract This paper introduces Data Mining to its audience by explaining Data Mining in the context of Corporate and Business Intelligence Reporting.
Big Data in Education
 Big Data in Education Alex J. Bowers, Ph.D. Associate Professor of Education Leadership Teachers College, Columbia University April 24, 2014 Schutt, R., & O'Neil, C. (2013). Doing Data Science: Straight
Data Mining Application in Direct Marketing: Identifying Hot Prospects for Banking Product
 Data Mining Application in Direct Marketing: Identifying Hot Prospects for Banking Product Sagarika Prusty Web Data Mining (ECT 584),Spring 2013 DePaul University,Chicago [email protected] Keywords:
A Two-Pass Statistical Approach for Automatic Personalized Spam Filtering
 A Two-Pass Statistical Approach for Automatic Personalized Spam Filtering Khurum Nazir Junejo, Mirza Muhammad Yousaf, and Asim Karim Dept. of Computer Science, Lahore University of Management Sciences
ROC Graphs: Notes and Practical Considerations for Data Mining Researchers
 ROC Graphs: Notes and Practical Considerations for Data Mining Researchers Tom Fawcett Intelligent Enterprise Technologies Laboratory HP Laboratories Palo Alto HPL-23-4 January 7 th, 23* E-mail: [email protected]
ROC Curve, Lift Chart and Calibration Plot
 Metodološki zvezki, Vol. 3, No. 1, 26, 89-18 ROC Curve, Lift Chart and Calibration Plot Miha Vuk 1, Tomaž Curk 2 Abstract This paper presents ROC curve, lift chart and calibration plot, three well known
2013 MBA Jump Start Program. Statistics Module Part 3
 2013 MBA Jump Start Program Module 1: Statistics Thomas Gilbert Part 3 Statistics Module Part 3 Hypothesis Testing (Inference) Regressions 2 1 Making an Investment Decision A researcher in your firm just
An Approach to Detect Spam Emails by Using Majority Voting
 An Approach to Detect Spam Emails by Using Majority Voting Roohi Hussain Department of Computer Engineering, National University of Science and Technology, H-12 Islamabad, Pakistan Usman Qamar Faculty,
1. Classification problems
 Neural and Evolutionary Computing. Lab 1: Classification problems Machine Learning test data repository Weka data mining platform Introduction Scilab 1. Classification problems The main aim of a classification
Discovering Criminal Behavior by Ranking Intelligence Data
 UNIVERSITY OF AMSTERDAM Faculty of Science Discovering Criminal Behavior by Ranking Intelligence Data by 5889081 A thesis submitted in partial fulfillment for the degree of Master of Science in the field
Keywords Data mining, Classification Algorithm, Decision tree, J48, Random forest, Random tree, LMT, WEKA 3.7. Fig.1. Data mining techniques.
 International Journal of Emerging Research in Management &Technology Research Article October 2015 Comparative Study of Various Decision Tree Classification Algorithm Using WEKA Purva Sewaiwar, Kamal Kant
The Relationship Between Precision-Recall and ROC Curves
 Jesse Davis [email protected] Mark Goadrich [email protected] Department of Computer Sciences and Department of Biostatistics and Medical Informatics, University of Wisconsin-Madison, 2 West Dayton Street,
Lecture 5: Evaluation
 Lecture 5: Evaluation Information Retrieval Computer Science Tripos Part II Simone Teufel Natural Language and Information Processing (NLIP) Group [email protected] 1 Overview 1 Recap/Catchup
Evaluation of Diagnostic Tests
 Biostatistics for Health Care Researchers: A Short Course Evaluation of Diagnostic Tests Presented ed by: Siu L. Hui, Ph.D. Department of Medicine, Division of Biostatistics Indiana University School of
A General Framework for Mining Concept-Drifting Data Streams with Skewed Distributions
 A General Framework for Mining Concept-Drifting Data Streams with Skewed Distributions Jing Gao Wei Fan Jiawei Han Philip S. Yu University of Illinois at Urbana-Champaign IBM T. J. Watson Research Center
E-discovery Taking Predictive Coding Out of the Black Box
 E-discovery Taking Predictive Coding Out of the Black Box Joseph H. Looby Senior Managing Director FTI TECHNOLOGY IN CASES OF COMMERCIAL LITIGATION, the process of discovery can place a huge burden on
Performance Metrics for Graph Mining Tasks
 Performance Metrics for Graph Mining Tasks 1 Outline Introduction to Performance Metrics Supervised Learning Performance Metrics Unsupervised Learning Performance Metrics Optimizing Metrics Statistical
Bayes Theorem & Diagnostic Tests Screening Tests
 Bayes heorem & Screening ests Bayes heorem & Diagnostic ests Screening ests Some Questions If you test positive for HIV, what is the probability that you have HIV? If you have a positive mammogram, what
Consolidated Tree Classifier Learning in a Car Insurance Fraud Detection Domain with Class Imbalance
 Consolidated Tree Classifier Learning in a Car Insurance Fraud Detection Domain with Class Imbalance Jesús M. Pérez, Javier Muguerza, Olatz Arbelaitz, Ibai Gurrutxaga, and José I. Martín Dept. of Computer
NCSS Statistical Software Principal Components Regression. In ordinary least squares, the regression coefficients are estimated using the formula ( )
") Chapter 340 Principal Components Regression Introduction is a technique for analyzing multiple regression data that suffer from multicollinearity. When multicollinearity occurs, least squares estimates
Chapter 340 Principal Components Regression Introduction is a technique for analyzing multiple regression data that suffer from multicollinearity. When multicollinearity occurs, least squares estimates
Using Random Forest to Learn Imbalanced Data
 Using Random Forest to Learn Imbalanced Data Chao Chen, [email protected] Department of Statistics,UC Berkeley Andy Liaw, andy [email protected] Biometrics Research,Merck Research Labs Leo Breiman,
Using Static Code Analysis Tools for Detection of Security Vulnerabilities
 Using Static Code Analysis Tools for Detection of Security Vulnerabilities Katerina Goseva-Popstajanova & Andrei Perhinschi Lane Deptartment of Computer Science and Electrical Engineering West Virginia
Enhancing Quality of Data using Data Mining Method
 JOURNAL OF COMPUTING, VOLUME 2, ISSUE 9, SEPTEMBER 2, ISSN 25-967 WWW.JOURNALOFCOMPUTING.ORG 9 Enhancing Quality of Data using Data Mining Method Fatemeh Ghorbanpour A., Mir M. Pedram, Kambiz Badie, Mohammad
Chapter 6. The stacking ensemble approach
 82 This chapter proposes the stacking ensemble approach for combining different data mining classifiers to get better performance. Other combination techniques like voting, bagging etc are also described
Section 12.6: Directional Derivatives and the Gradient Vector
 Section 26: Directional Derivatives and the Gradient Vector Recall that if f is a differentiable function of x and y and z = f(x, y), then the partial derivatives f x (x, y) and f y (x, y) give the rate
Statistical Validation and Data Analytics in ediscovery. Jesse Kornblum
 Statistical Validation and Data Analytics in ediscovery Jesse Kornblum Administrivia Silence your mobile Interactive talk Please ask questions 2 Outline Introduction Big Questions What Makes Things Similar?
You buy a TV for $1000 and pay it off with $100 every week. The table below shows the amount of money you sll owe every week. Week 1 2 3 4 5 6 7 8 9
 Warm Up: You buy a TV for $1000 and pay it off with $100 every week. The table below shows the amount of money you sll owe every week Week 1 2 3 4 5 6 7 8 9 Money Owed 900 800 700 600 500 400 300 200 100
Problem Set #3 Answer Key
 Problem Set #3 Answer Key Economics 305: Macroeconomic Theory Spring 2007 1 Chapter 4, Problem #2 a) To specify an indifference curve, we hold utility constant at ū. Next, rearrange in the form: C = ū
IDENTIFIC ATION OF SOFTWARE EROSION USING LOGISTIC REGRESSION
 http:// IDENTIFIC ATION OF SOFTWARE EROSION USING LOGISTIC REGRESSION Harinder Kaur 1, Raveen Bajwa 2 1 PG Student., CSE., Baba Banda Singh Bahadur Engg. College, Fatehgarh Sahib, (India) 2 Asstt. Prof.,
Data Mining. Nonlinear Classification
 Data Mining Unit # 6 Sajjad Haider Fall 2014 1 Nonlinear Classification Classes may not be separable by a linear boundary Suppose we randomly generate a data set as follows: X has range between 0 to 15
MACHINE LEARNING IN HIGH ENERGY PHYSICS
 MACHINE LEARNING IN HIGH ENERGY PHYSICS LECTURE #1 Alex Rogozhnikov, 2015 INTRO NOTES 4 days two lectures, two practice seminars every day this is introductory track to machine learning kaggle competition!
Model Building and Gains from Trade
 Model Building and Gains from Trade Previously... Economics is the study of how people allocate their limited resources to satisfy their nearly unlimited wants. Scarcity refers to the limited nature of
A Data Mining-Based Response Model for Target Selection in Direct Marketing
 I.J. Information Technology and Computer Science, 2012, 1, 9-18 Published Online February 2012 in MECS (http://www.mecs-press.org/) DOI: 10.5815/ijitcs.2012.01.02 A Data Mining-Based Response Model for
CS 5410 - Computer and Network Security: Intrusion Detection
 CS 5410 - Computer and Network Security: Intrusion Detection Professor Kevin Butler Fall 2015 Locked Down You re using all the techniques we will talk about over the course of the semester: Strong access
Lecture 8: Signal Detection and Noise Assumption
 ECE 83 Fall Statistical Signal Processing instructor: R. Nowak, scribe: Feng Ju Lecture 8: Signal Detection and Noise Assumption Signal Detection : X = W H : X = S + W where W N(, σ I n n and S = [s, s,...,
Measuring Intrusion Detection Capability: An Information-Theoretic Approach
 Measuring Intrusion Detection Capability: An Information-Theoretic Approach Guofei Gu, Prahlad Fogla, David Dagon, Boris Škorić Wenke Lee Philips Research Laboratories, Netherlands Georgia Institute of
Pearson's Correlation Tests
 Chapter 800 Pearson's Correlation Tests Introduction The correlation coefficient, ρ (rho), is a popular statistic for describing the strength of the relationship between two variables. The correlation
How To Understand The Impact Of A Computer On Organization
 International Journal of Research in Engineering & Technology (IJRET) Vol. 1, Issue 1, June 2013, 1-6 Impact Journals IMPACT OF COMPUTER ON ORGANIZATION A. D. BHOSALE 1 & MARATHE DAGADU MITHARAM 2 1 Department
Despite its emphasis on credit-scoring/rating model validation,
 RETAIL RISK MANAGEMENT Empirical Validation of Retail Always a good idea, development of a systematic, enterprise-wide method to continuously validate credit-scoring/rating models nonetheless received
Detecting Credit Card Fraud
 Case Study Detecting Credit Card Fraud Analysis of Behaviometrics in an online Payment environment Introduction BehavioSec have been conducting tests on Behaviometrics stemming from card payments within
GRADES 7, 8, AND 9 BIG IDEAS
 Table 1: Strand A: BIG IDEAS: MATH: NUMBER Introduce perfect squares, square roots, and all applications Introduce rational numbers (positive and negative) Introduce the meaning of negative exponents for
How To Prevent Network Attacks
 Ali A. Ghorbani Wei Lu Mahbod Tavallaee Network Intrusion Detection and Prevention Concepts and Techniques )Spri inger Contents 1 Network Attacks 1 1.1 Attack Taxonomies 2 1.2 Probes 4 1.2.1 IPSweep and
Ensemble Methods. Knowledge Discovery and Data Mining 2 (VU) (707.004) Roman Kern. KTI, TU Graz 2015-03-05
 (707.004) Roman Kern. KTI, TU Graz 2015-03-05") Ensemble Methods Knowledge Discovery and Data Mining 2 (VU) (707004) Roman Kern KTI, TU Graz 2015-03-05 Roman Kern (KTI, TU Graz) Ensemble Methods 2015-03-05 1 / 38 Outline 1 Introduction 2 Classification
Ensemble Methods Knowledge Discovery and Data Mining 2 (VU) (707004) Roman Kern KTI, TU Graz 2015-03-05 Roman Kern (KTI, TU Graz) Ensemble Methods 2015-03-05 1 / 38 Outline 1 Introduction 2 Classification
Supervised Learning (Big Data Analytics)
") Supervised Learning (Big Data Analytics) Vibhav Gogate Department of Computer Science The University of Texas at Dallas Practical advice Goal of Big Data Analytics Uncover patterns in Data. Can be used
Supervised Learning (Big Data Analytics) Vibhav Gogate Department of Computer Science The University of Texas at Dallas Practical advice Goal of Big Data Analytics Uncover patterns in Data. Can be used
Example: Credit card default, we may be more interested in predicting the probabilty of a default than classifying individuals as default or not.
 Statistical Learning: Chapter 4 Classification 4.1 Introduction Supervised learning with a categorical (Qualitative) response Notation: - Feature vector X, - qualitative response Y, taking values in C
Measurement in ediscovery
 Measurement in ediscovery A Technical White Paper Herbert Roitblat, Ph.D. CTO, Chief Scientist Measurement in ediscovery From an information-science perspective, ediscovery is about separating the responsive
FRAUD DETECTION IN ELECTRIC POWER DISTRIBUTION NETWORKS USING AN ANN-BASED KNOWLEDGE-DISCOVERY PROCESS
 FRAUD DETECTION IN ELECTRIC POWER DISTRIBUTION NETWORKS USING AN ANN-BASED KNOWLEDGE-DISCOVERY PROCESS Breno C. Costa, Bruno. L. A. Alberto, André M. Portela, W. Maduro, Esdras O. Eler PDITec, Belo Horizonte,
Anomaly detection. Problem motivation. Machine Learning
 Anomaly detection Problem motivation Machine Learning Anomaly detection example Aircraft engine features: = heat generated = vibration intensity Dataset: New engine: (vibration) (heat) Density estimation
Mining Repositories to Assist in Project Planning and Resource Allocation
 Mining Repositories to Assist in Project Planning and Resource Allocation Tim Menzies Department of Computer Science, Portland State University, Portland, Oregon [email protected] Justin S. Di Stefano, Chris
Detection Sensitivity and Response Bias
 Detection Sensitivity and Response Bias Lewis O. Harvey, Jr. Department of Psychology University of Colorado Boulder, Colorado The Brain (Observable) Stimulus System (Observable) Response System (Observable)
Proactive Fault Management
 Proactive Fault Management Felix Salfner 7.7.2010 www.rok.informatik.hu-berlin.de/members/salfner Contents Introduction Variable Selection Online Failure Prediction Overview Four Online Failure Prediction
ISSN: 2321-7782 (Online) Volume 2, Issue 10, October 2014 International Journal of Advance Research in Computer Science and Management Studies
 Volume 2, Issue 10, October 2014 International Journal of Advance Research in Computer Science and Management Studies") ISSN: 2321-7782 (Online) Volume 2, Issue 10, October 2014 International Journal of Advance Research in Computer Science and Management Studies Research Article / Survey Paper / Case Study Available online
ISSN: 2321-7782 (Online) Volume 2, Issue 10, October 2014 International Journal of Advance Research in Computer Science and Management Studies Research Article / Survey Paper / Case Study Available online
Irrational Numbers. A. Rational Numbers 1. Before we discuss irrational numbers, it would probably be a good idea to define rational numbers.
 Irrational Numbers A. Rational Numbers 1. Before we discuss irrational numbers, it would probably be a good idea to define rational numbers. Definition: Rational Number A rational number is a number that
UNDERSTANDING THE EFFECTIVENESS OF BANK DIRECT MARKETING Tarun Gupta, Tong Xia and Diana Lee
 UNDERSTANDING THE EFFECTIVENESS OF BANK DIRECT MARKETING Tarun Gupta, Tong Xia and Diana Lee 1. Introduction There are two main approaches for companies to promote their products / services: through mass
Abstract. 1. Introduction. 1.1. Methodology
 Fingerprint Recognition System Performance in the Maritime Environment Hourieh Fakourfar 1, Serge Belongie 2* 1 Department of Electrical and Computer Engineering, and 2 Department of Computer Science and
Detecting Flooding Attacks Using Power Divergence
 Detecting Flooding Attacks Using Power Divergence Jean Tajer IT Security for the Next Generation European Cup, Prague 17-19 February, 2012 PAGE 1 Agenda 1- Introduction 2- K-ary Sktech 3- Detection Threshold
Lesson 20. Probability and Cumulative Distribution Functions
 Lesson 20 Probability and Cumulative Distribution Functions Recall If p(x) is a density function for some characteristic of a population, then Recall If p(x) is a density function for some characteristic
Dynamic Predictive Modeling in Claims Management - Is it a Game Changer?
 Dynamic Predictive Modeling in Claims Management - Is it a Game Changer? Anil Joshi Alan Josefsek Bob Mattison Anil Joshi is the President and CEO of AnalyticsPlus, Inc. (www.analyticsplus.com)- a Chicago
Risk and Risk Management in the Credit Card Industry*
 Risk and Risk Management in the Credit Card Industry* Florentin Butaru 1, Qingqing Chen 1, Brian Clark 1,4, Sanmay Das 2, Andrew W. Lo 3, Akhtar Siddique 1 This Revision: 14 June 2015 Abstract Using account
CALIBRATION PRINCIPLES
 1 CALIBRATION PRINCIPLES After completing this chapter, you should be able to: Define key terms relating to calibration and interpret the meaning of each. Understand traceability requirements and how they
Part 2: Analysis of Relationship Between Two Variables
 Part 2: Analysis of Relationship Between Two Variables Linear Regression Linear correlation Significance Tests Multiple regression Linear Regression Y = a X + b Dependent Variable Independent Variable
BUILDING CLASSIFICATION MODELS FROM IMBALANCED FRAUD DETECTION DATA
 BUILDING CLASSIFICATION MODELS FROM IMBALANCED FRAUD DETECTION DATA Terence Yong Koon Beh 1, Swee Chuan Tan 2, Hwee Theng Yeo 3 1 School of Business, SIM University 1 [email protected], 2 [email protected],
Machine Learning Final Project Spam Email Filtering
 Machine Learning Final Project Spam Email Filtering March 2013 Shahar Yifrah Guy Lev Table of Content 1. OVERVIEW... 3 2. DATASET... 3 2.1 SOURCE... 3 2.2 CREATION OF TRAINING AND TEST SETS... 4 2.3 FEATURE
CCNY. BME I5100: Biomedical Signal Processing. Linear Discrimination. Lucas C. Parra Biomedical Engineering Department City College of New York
 BME I5100: Biomedical Signal Processing Linear Discrimination Lucas C. Parra Biomedical Engineering Department CCNY 1 Schedule Week 1: Introduction Linear, stationary, normal - the stuff biology is not
Slope and Rate of Change
 Chapter 1 Slope and Rate of Change Chapter Summary and Goal This chapter will start with a discussion of slopes and the tangent line. This will rapidly lead to heuristic developments of limits and the
Benchmarking default prediction models: pitfalls and remedies in model validation
 Journal of Risk Model Validation (77 113) Volume 1/Number 1, Spring 2007 Benchmarking default prediction models: pitfalls and remedies in model validation Roger M. Stein Moody s Investors Service, 99 Church
Data Mining Classification: Basic Concepts, Decision Trees, and Model Evaluation. Lecture Notes for Chapter 4. Introduction to Data Mining
 Data Mining Classification: Basic Concepts, Decision Trees, and Model Evaluation Lecture Notes for Chapter 4 Introduction to Data Mining by Tan, Steinbach, Kumar Tan,Steinbach, Kumar Introduction to Data
Compute the derivative by definition: The four step procedure
 Compute te derivative by definition: Te four step procedure Given a function f(x), te definition of f (x), te derivative of f(x), is lim 0 f(x + ) f(x), provided te limit exists Te derivative function
Choosing the Best Classification Performance Metric for Wrapper-based Software Metric Selection for Defect Prediction
 Choosing the Best Classification Performance Metric for Wrapper-based Software Metric Selection for Defect Prediction Huanjing Wang Western Kentucky University [email protected] Taghi M. Khoshgoftaar