Post-processing and Visualization with Open-Source Tools. Journée Scientifique Centre Image April 9, Julien Jomier
|
|
|
- Dominic Waters
- 8 years ago
- Views:
Transcription
1 Post-processing and Visualization with Open-Source Tools Journée Scientifique Centre Image April 9, Julien Jomier

2 Kitware - Leader in Open Source Software for Scientific Computing Software Development company Over 110 employees worldwide 30% annual growth 1998 Kitware Inc USA 2010 Kitware SAS Europe 80% staff With Masters & PhDs in scientic domains


3 Kitware - Solutions based on Open-Source Software Consulting Training Hosting Deployment Development Maintenance Custom Algorithms Custom Software Open-Source Platforms

4 Kitware - Fields of Expertise


5 Kitware Open Source Projects


6 Challenges of Visualization

7 Challenges of Visualization Heterogeneous data Large/many/big data Distributed data Computing resources Domain-specific User-specific Heterogeneous devices Uncertainties

8 TOOLS CAN HELP OVERCOME THESE CHALLENGES

9 The Visualization Toolkit (VTK) Started in 1993 at GE Visualization Library Written in C++ (+8.2 million LOC) BSD License Automatic binding for Java, Python, C#, TCL Portable by design: Linux, Windows, Mac OSX, Solaris Very active community: users on the mailing list


10 What can VTK do for me? Scientific Visualization 2D to 4D data processing and (volume) rendering Image processing Information Visualization Charting/plotting Application support GUI support, Widgets Toolkit Meant to be integrated

11 Design Philosophy Underlying theme is to process data Find the salient features Produce imagery that conveys meaning An open-ended architecture used to construct programs These programs usually give interactive controls to the user Let the end user do the searching, visually Modular architecture Modules implemented in Object-Oriented Classes Pipeline: Data flows through modules in a pipeline Lazy evaluation: Only process what is changed (for big data)

12 VTK Main Components Data structures How VTK stores/provides access to arbitrary data Algorithms/filtering pipeline Manipulate data Readers, sources, filters, writers Rendering classes Display that data on the screen Mappers, actors, lights, cameras, renderers Interaction classes Events, interactors, widgets Application support Views, representations, Qt and MFC interfaces, wrapping

13 VTK Main Components 140 Readers STL, EnSight, TecPlot, BMP, JPEG 150 Filters Contour, Subdivision, Delaunay, Elevation Statistics, Parallel, Geometry, FlowPaths, Extraction 40 Widgets Distance, Angle, Plane, Seed, Checkerboard Application domains Geo visualization Chemistry Imaging


14 2D: Graphs and Charts

15 Interactive Widgets

16 Example Code #!/usr/bin/env python import vtk # Load an STL File reader = vtk.vtkstlreader() reader.setfilename("myfile.stl") # Visualization Pipeline mapper = vtk.vtkpolydatamapper() mapper.setinputconnection(reader.get OutputPort()) actor = vtk.vtkactor() actor.setmapper(mapper) # Create a rendering window and renderer ren = vtk.vtkrenderer() renwin = vtk.vtkrenderwindow() renwin.addrenderer(ren) # Create a renderwindowinteractor iren = vtk.vtkrenderwindowinteractor() iren.setrenderwindow(renwin) # Assign actor to the renderer ren.addactor(actor) # Enable user interface interactor iren.initialize() renwin.render() iren.start()
 # Create a renderwindowinteractor iren = vtk.vtkrenderwindowinteractor() iren.setrenderwindow(renwin) # Assign actor to the renderer ren.")
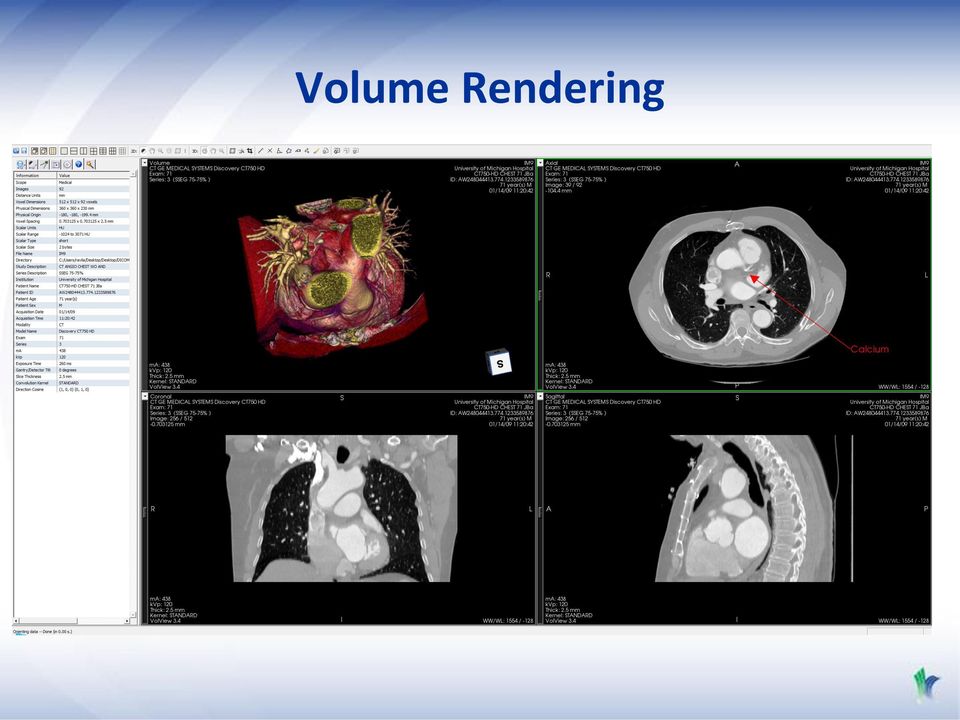
17 Volume Rendering
18 LARGE DATA VISUALIZATION

19 ParaView OpenSource (BSD) Based on VTK C++/Qt Cross-platform: Linux, Mac, Windows Python support Very active community (HPC Wire Award) Multi-core support (MPI) Co-processing (in-situ) More than 50 data readers
 Multi-core support (MPI) Co-processing")

20 EnSight ParaView VisIt FieldView TecPlot General Purpose Tools

21 ParaView An application and an architecture to visualize and analyze massive datasets A turn-key visualization application 1 billion cell asteroid detonation simulation ½ billion cell weather simulation Fire simulation

22
23 ParaView is a Framework ParaView extends VTK to provide: Client-server computing State management Python modules Application/GUI framework ParaView framework can be used to develop other applications ParaView can be embedded in other applications and frameworks

24 ParaView Architecture
25 Large Data - Unstructured CFD simulation million elements Load balancing source: Swiss supercomputing center
26 Large Data - Unstructured Fire simulation 150 million elements source: Sandia National Labs
27 Large-scale AMR
28 ESA - Rosetta
29 ParaView in Use: Immersive Visualization
30 In-Situ : Access to More/Richer Data Post-Processing (every 100 time steps) In-situ (every time step) Note: Reflections and shadows added in post-processing
31 Co-Processing/InSitu with ParaView Catalyst


32
33 OTHER VISUALIZATION TOOLS
34 ParaViewWeb - Collaboration


35 Web Visualization vtkweb/paraviewweb No plugin Works on all devices and browsers Instant visualization (fast loading) Fully interactive visualization


36 ParaView - Cinema Batch Explorat ion Helpers
37 Mobile Visualization: VES/VTK
38 Tangelo htttp://tangelo.kitware.com Web framework HTML5 web architecture Packages several other frameworks too Bootstrap, D3, Vega,MongoDB Facilitates development & deployment of web apps
39 Visualization of large 2D images Digital Pathology:
40 Open Chemistry

41 VTKWeb and Open Chemistry
42 Benefits of Open-Source Extended support The Visualization Toolkit: ~$140M Active maintenance Community-supported Training Access to expertise Reduce costs Development Maintenance Evolution No licensing fee
43 Thank You! Kitware Europe 26 rue Louis Guérin Villeurbanne France
Scientific Visualization with Open Source Tools. HM 2014 Julien Jomier julien.jomier@kitware.com
 Scientific Visualization with Open Source Tools HM 2014 Julien Jomier julien.jomier@kitware.com Visualization is Communication Challenges of Visualization Challenges of Visualization Heterogeneous data
Open source, open science
 Open source, open science Kitware, open-source platforms Jérôme Velut jerome.velut@kitware.com Science 250 years ago, d Alembert (Discours préliminaire de l'encyclopédie, 1759) : reduction, systematic
Visualization and Post Processing of OpenFOAM results a Brie. a Brief Introduction to VTK
 Visualization and Post Processing of OpenFOAM results a Brief Introduction to VTK December 13:th 2007 OpenFOAM Introdutory Course Chalmers University of Technology Post Processing in OF No built in post
HPC & Visualization. Visualization and High-Performance Computing
 HPC & Visualization Visualization and High-Performance Computing Visualization is a critical step in gaining in-depth insight into research problems, empowering understanding that is not possible with
A Hybrid Visualization System for Molecular Models
 A Hybrid Visualization System for Molecular Models Charles Marion, Joachim Pouderoux, Julien Jomier Kitware SAS, France Sébastien Jourdain, Marcus Hanwell & Utkarsh Ayachit Kitware Inc, USA Web3D Conference
Visualization with ParaView
 Visualization with ParaView Before we begin Make sure you have ParaView 4.1.0 installed so you can follow along in the lab section http://paraview.org/paraview/resources/software.php Background http://www.paraview.org/
Visualization with ParaView. Greg Johnson
 Visualization with Greg Johnson Before we begin Make sure you have 3.8.0 installed so you can follow along in the lab section http://paraview.org/paraview/resources/software.html http://www.paraview.org/
MayaVi: A free tool for CFD data visualization
 MayaVi: A free tool for CFD data visualization Prabhu Ramachandran Graduate Student, Dept. Aerospace Engg. IIT Madras, Chennai, 600 036. e mail: prabhu@aero.iitm.ernet.in Keywords: Visualization, CFD data,
Introduction to Visualization with VTK and ParaView
 Introduction to Visualization with VTK and ParaView R. Sungkorn and J. Derksen Department of Chemical and Materials Engineering University of Alberta Canada August 24, 2011 / LBM Workshop 1 Introduction
A Steering Environment for Online Parallel Visualization of Legacy Parallel Simulations
 A Steering Environment for Online Parallel Visualization of Legacy Parallel Simulations Aurélien Esnard, Nicolas Richart and Olivier Coulaud ACI GRID (French Ministry of Research Initiative) ScAlApplix
VisIVO, a VO-Enabled tool for Scientific Visualization and Data Analysis: Overview and Demo
 Claudio Gheller (CINECA), Marco Comparato (OACt), Ugo Becciani (OACt) VisIVO, a VO-Enabled tool for Scientific Visualization and Data Analysis: Overview and Demo VisIVO: Visualization Interface for the
Visualization and Data Analysis
 Working Group Outbrief Visualization and Data Analysis James Ahrens, David Rogers, Becky Springmeyer Eric Brugger, Cyrus Harrison, Laura Monroe, Dino Pavlakos Scott Klasky, Kwan-Liu Ma, Hank Childs LLNL-PRES-481881
The Visualization Pipeline
 The Visualization Pipeline Conceptual perspective Implementation considerations Algorithms used in the visualization Structure of the visualization applications Contents The focus is on presenting the
Facts about Visualization Pipelines, applicable to VisIt and ParaView
 Facts about Visualization Pipelines, applicable to VisIt and ParaView March 2013 Jean M. Favre, CSCS Agenda Visualization pipelines Motivation by examples VTK Data Streaming Visualization Pipelines: Introduction
Distributed Visualization Parallel Visualization Large data volumes
 Distributed Visualization Parallel Visualization Large data volumes Dr. Jean M. Favre Head of Scientific Visualisation Outline Historical perspective Some strategies to deal with large data How do VTK
James Ahrens, Berk Geveci, Charles Law. Technical Report
 LA-UR-03-1560 Approved for public release; distribution is unlimited. Title: ParaView: An End-User Tool for Large Data Visualization Author(s): James Ahrens, Berk Geveci, Charles Law Submitted to: Technical
How is EnSight Uniquely Suited to FLOW-3D Data?
 How is EnSight Uniquely Suited to FLOW-3D Data? July 5, 2011 figure 1. FLOW-3D model of Dam visualized with EnSight If you would like to know how CEI s EnSight offers you more power than other postprocessors
CHAPTER FIVE RESULT ANALYSIS
 CHAPTER FIVE RESULT ANALYSIS 5.1 Chapter Introduction 5.2 Discussion of Results 5.3 Performance Comparisons 5.4 Chapter Summary 61 5.1 Chapter Introduction This chapter outlines the results obtained from
Parallel Analysis and Visualization on Cray Compute Node Linux
 Parallel Analysis and Visualization on Cray Compute Node Linux David Pugmire, Oak Ridge National Laboratory and Hank Childs, Lawrence Livermore National Laboratory and Sean Ahern, Oak Ridge National Laboratory
Using open source and commercial visualization packages for analysis and visualization of large simulation dataset
 Using open source and commercial visualization packages for analysis and visualization of large simulation dataset Simon Su, Werner Benger, William Sherman, Eliot Feibush, Curtis Hillegas Princeton University,
JavaFX Session Agenda
 JavaFX Session Agenda 1 Introduction RIA, JavaFX and why JavaFX 2 JavaFX Architecture and Framework 3 Getting Started with JavaFX 4 Examples for Layout, Control, FXML etc Current day users expect web user
Open Source CFD Solver - OpenFOAM
 Open Source CFD Solver - OpenFOAM Wang Junhong (HPC, Computer Centre) 1. INTRODUCTION The OpenFOAM (Open Field Operation and Manipulation) Computational Fluid Dynamics (CFD) Toolbox is a free, open source
VisIVO, an open source, interoperable visualization tool for the Virtual Observatory
 Claudio Gheller (CINECA) 1, Ugo Becciani (OACt) 2, Marco Comparato (OACt) 3 Alessandro Costa (OACt) 4 VisIVO, an open source, interoperable visualization tool for the Virtual Observatory 1: c.gheller@cineca.it
Collaborative modelling and concurrent scientific data analysis:
 Collaborative modelling and concurrent scientific data analysis: Application case in space plasma environment with the Keridwen/SPIS- GEO Integrated Modelling Environment B. Thiebault 1, J. Forest 2, B.
VisIt Visualization Tool
 The Center for Astrophysical Thermonuclear Flashes VisIt Visualization Tool Randy Hudson hudson@mcs.anl.gov Argonne National Laboratory Flash Center, University of Chicago An Advanced Simulation and Computing
OMIQ srl. Advanced Post-Processing of Flow3D Calculations using Ensight. Federico Monterosso. Ingegneria di componenti e sistemi industriali
 OMIQ srl Ingegneria di componenti e sistemi industriali Advanced Post-Processing of Flow3D Calculations using Ensight Federico Monterosso Agenda A brief introduction of OMIQ A not-so-brief introduction
Visualizing Electromagnetic Fields: The Visualization Toolkit. Michael Selvanayagam
 Visualizing Electromagnetic Fields: The Visualization Toolkit Michael Selvanayagam Visualization What is the purpose of visualizing electromagnetic (EM) Fields? Visualization 1. Understand the geometry
S ECOND PROTOTYPE. Activity: Lead Partner: Document classification:
 S ECOND PROTOTYPE I N C L U D I N G M E C H A N I S M S U S E D F O R D E F I N I T I O N O F T A S K F L O W, D E V E L O P E D V I S U A L I Z A T I O N T O O L S A N D G R I D C O M E N H A N C E M
bluecape s Official Website
 bluecfdcore {tab=introduction} bluecape is proud to present bluecfd Core, a freely available software package, of a high quality build of OpenFOAM for uptodate Windows 7, 8, 8.1 and 10 64bit, fully compilable
Why are we teaching you VisIt?
 VisIt Tutorial Why are we teaching you VisIt? Interactive (GUI) Visualization and Analysis tool Multiplatform, Free and Open Source The interface looks the same whether you run locally or remotely, serial
MEng, BSc Applied Computer Science
 School of Computing FACULTY OF ENGINEERING MEng, BSc Applied Computer Science Year 1 COMP1212 Computer Processor Effective programming depends on understanding not only how to give a machine instructions
Cassandra 2.0: Tutorial
 Cassandra 2.0 Tutorial V1.0 Sébastien Jourdain, Fatiha Zeghir 2005/06/01 1 / 16 Abstract Cassandra is a generic VTK data viewer written in Java which provides native multiplatform support. Cassandra is
CMake/CTest/CDash OSCON 2009
 CMake/CTest/CDash OSCON 2009 Open Source Tools to build, test, and install software Bill Hoffman bill.hoffman@kitware.com Overview Introduce myself and Kitware Automated Testing About CMake Building with
USE OF PYTHON AS A SATELLITE OPERATIONS AND TESTING AUTOMATION LANGUAGE
 USE OF PYTHON AS A SATELLITE OPERATIONS AND TESTING AUTOMATION LANGUAGE Gonzalo Garcia VP of Operations, USA Property of GMV All rights reserved INTRODUCTION Property of GMV All rights reserved INTRODUCTION
HPC technology and future architecture
 HPC technology and future architecture Visual Analysis for Extremely Large-Scale Scientific Computing KGT2 Internal Meeting INRIA France Benoit Lange benoit.lange@inria.fr Toàn Nguyên toan.nguyen@inria.fr
The Design and Implement of Ultra-scale Data Parallel. In-situ Visualization System
 The Design and Implement of Ultra-scale Data Parallel In-situ Visualization System Liu Ning liuning01@ict.ac.cn Gao Guoxian gaoguoxian@ict.ac.cn Zhang Yingping zhangyingping@ict.ac.cn Zhu Dengming mdzhu@ict.ac.cn
Visualisatie BMT. Introduction, visualization, visualization pipeline. Arjan Kok Huub van de Wetering (h.v.d.wetering@tue.nl)
") Visualisatie BMT Introduction, visualization, visualization pipeline Arjan Kok Huub van de Wetering (h.v.d.wetering@tue.nl) 1 Lecture overview Goal Summary Study material What is visualization Examples
Visualisatie BMT Introduction, visualization, visualization pipeline Arjan Kok Huub van de Wetering (h.v.d.wetering@tue.nl) 1 Lecture overview Goal Summary Study material What is visualization Examples
Last lecture... Computer Graphics:
 Last lecture... Computer Graphics: Visualisation can be greatly enhanced through the Introduction to the Visualisation use of 3D computer graphics Toolkit Visualisation Lecture 2 toby.breckon@ed.ac.uk
Integration of C++ digital processing libraries and VTK through Tcl/Tk dynamic loadable extensions
 Visualization Development Environments 2000 Proceedings Integration of C++ digital processing libraries and VTK through Tcl/Tk dynamic loadable extensions Javier Suárez-Quirós, Daniel Gayo-Avello, Juán
The Mantid Project. The challenges of delivering flexible HPC for novice end users. Nicholas Draper SOS18
 The Mantid Project The challenges of delivering flexible HPC for novice end users Nicholas Draper SOS18 What Is Mantid A framework that supports high-performance computing and visualisation of scientific
LA-UR- Title: Author(s): Intended for: Approved for public release; distribution is unlimited.
: Intended for: Approved for public release; distribution is unlimited.") LA-UR- Approved for public release; distribution is unlimited. Title: Author(s): Intended for: Los Alamos National Laboratory, an affirmative action/equal opportunity employer, is operated by the Los Alamos
LA-UR- Approved for public release; distribution is unlimited. Title: Author(s): Intended for: Los Alamos National Laboratory, an affirmative action/equal opportunity employer, is operated by the Los Alamos
The Ultra-scale Visualization Climate Data Analysis Tools (UV-CDAT): A Vision for Large-Scale Climate Data
: A Vision for Large-Scale Climate Data") The Ultra-scale Visualization Climate Data Analysis Tools (UV-CDAT): A Vision for Large-Scale Climate Data Lawrence Livermore National Laboratory? Hank Childs (LBNL) and Charles Doutriaux (LLNL) September
The Ultra-scale Visualization Climate Data Analysis Tools (UV-CDAT): A Vision for Large-Scale Climate Data Lawrence Livermore National Laboratory? Hank Childs (LBNL) and Charles Doutriaux (LLNL) September
MEng, BSc Computer Science with Artificial Intelligence
 School of Computing FACULTY OF ENGINEERING MEng, BSc Computer Science with Artificial Intelligence Year 1 COMP1212 Computer Processor Effective programming depends on understanding not only how to give
Open Source UAS Software Toolkits. Keith Fieldhouse Technical Lead, Kitware Inc. keith.fieldhouse@kitware.com
 Open Source UAS Software Toolkits Keith Fieldhouse Technical Lead, Kitware Inc. keith.fieldhouse@kitware.com 1 Best known for open source toolkits and applications Collaborative software R&D: Algorithms
AVS/Express - an object-oriented visual development tool
 AVS/Express - an object-oriented visual development tool Bruno Proix Advanced Visual Systems, Clichy, France Abstract This paper describes a new generation of software dedicated to the development of applications
Lawrence Tarbox, Ph.D. Washington University in St. Louis School of Medicine Mallinckrodt Institute of Radiology, Electronic Radiology Lab
 Washington University in St. Louis School of Medicine Mallinckrodt Institute of Radiology, Electronic Radiology Lab APPLICATION HOSTING 12/5/2008 1 Disclosures The presenter s work on Application Hosting
LSCFD: Meshing Tools for Open Source CFD A Practical Point of View
 LSCFD: Meshing Tools for Open Source CFD A Practical Point of View Juha Kortelainen Report: Meshing Tools for Open Source CFD A Practical Point of View LSCFD Tools for Large Scale
In-situ Visualization: State-of-the-art and Some Use Cases
 Available online at www.prace-ri.eu Partnership for Advanced Computing in Europe In-situ Visualization: State-of-the-art and Some Use Cases Marzia Rivi a, *, Luigi Calori a, Giuseppa Muscianisi a, Vladimir
A Modular Approach to Teaching Mobile APPS Development
 2014 Hawaii University International Conferences Science, Technology, Engineering, Math & Education June 16, 17, & 18 2014 Ala Moana Hotel, Honolulu, Hawaii A Modular Approach to Teaching Mobile APPS Development
A Contract Based System For Large Data Visualization
 A Contract Based System For Large Data Visualization Hank Childs University of California, Davis/Lawrence Livermore National Laboratory Eric Brugger, Kathleen Bonnell, Jeremy Meredith, Mark Miller, and
IDL. Get the answers you need from your data. IDL
 Get the answers you need from your data. IDL is the preferred computing environment for understanding complex data through interactive visualization and analysis. IDL Powerful visualization. Interactive
VISUALIZING DATA AT NORTHWESTERN UNIVERSITY. Matt McCrory Lead Visualization Engineer
 VISUALIZING DATA AT NORTHWESTERN UNIVERSITY Matt McCrory Lead Visualization Engineer MATT MCCRORY Lead Visualization Engineer - Lighting Artist/Tech Director at DreamWorks Animation - Visualization Engineer
Scientific visualization of HPC simulation data introduction and overview on MPG projects
 Scientific visualization of HPC simulation data introduction and overview on MPG projects Elena Erastova, Markus Rampp, Klaus Reuter visualization@mpcdf.mpg.de Max Planck Computing and Data Facility (MPCDF)
Introduction to MeVisLab Visual Programming Image Processing / VIsualization Examples VTK / ITK Integration MeVisLab SDK Features GUI Scripting
 Felix Ritter, MeVis Research Bremen, Germany Introduction to MeVisLab Visual Programming Image Processing / VIsualization Examples VTK / ITK Integration MeVisLab SDK Features GUI Scripting 2 Innovation
Avizo AvizoFire - The 3D visualization Software for NDT & Materials Science
 Avizo AvizoFire - The 3D visualization Software for NDT & Materials Science Peter Westenberger Application Enginieer May 7, 2010 Avizo Visualize to Understand Avizo software is a powerful, multifaceted
Petascale Visualization: Approaches and Initial Results
 Petascale Visualization: Approaches and Initial Results James Ahrens Li-Ta Lo, Boonthanome Nouanesengsy, John Patchett, Allen McPherson Los Alamos National Laboratory LA-UR- 08-07337 Operated by Los Alamos
IT Infrastructure: Hardware and Software
 Chapter 4 IT Infrastructure: Hardware and Software 4.1 Copyright 2011 Pearson Education, Inc STUDENT LEARNING OBJECTIVES What are the components of IT infrastructure? What are the major computer hardware,
CrossPlatform ASP.NET with Mono. Daniel López Ridruejo daniel@bitrock.com
 CrossPlatform ASP.NET with Mono Daniel López Ridruejo daniel@bitrock.com About me Open source: Original author of mod_mono, Comanche, several Linux Howtos and the Teach Yourself Apache 2 book Company:
An interactive 3D visualization system for displaying fieldmonitoring
 icccbe 2010 Nottingham University Press Proceedings of the International Conference on Computing in Civil and Building Engineering W Tizani (Editor) An interactive 3D visualization system for displaying
salome-platform.org SALOME7 THE OPEN SOURCE INTEGRATION PLATFORM FOR NUMERICAL SIMULATION
 salome-platform.org SALOME7 THE OPEN SOURCE INTEGRATION PLATFORM FOR NUMERICAL SIMULATION SALOME7 PLATFORM The SALOME software platform is an open framework that can integrate scientific solvers for modelling
HOW TO VISUALIZE YOUR GPU-ACCELERATED SIMULATION RESULTS. Peter Messmer, NVIDIA
 HOW TO VISUALIZE YOUR GPU-ACCELERATED SIMULATION RESULTS Peter Messmer, NVIDIA RANGE OF ANALYSIS AND VIZ TASKS Analysis: Focus quantitative Visualization: Focus qualitative Monitoring, Steering TRADITIONAL
VisIt: A Tool for Visualizing and Analyzing Very Large Data. Hank Childs, Lawrence Berkeley National Laboratory December 13, 2010
 VisIt: A Tool for Visualizing and Analyzing Very Large Data Hank Childs, Lawrence Berkeley National Laboratory December 13, 2010 VisIt is an open source, richly featured, turn-key application for large
Unlocking the True Value of Hadoop with Open Data Science
 Unlocking the True Value of Hadoop with Open Data Science Kristopher Overholt Solution Architect Big Data Tech 2016 MinneAnalytics June 7, 2016 Overview Overview of Open Data Science Python and the Big
MeshLab and Arc3D: Photo-Reconstruction and Processing of 3D meshes
 MeshLab and Arc3D: Photo-Reconstruction and Processing of 3D meshes P. Cignoni, M Corsini, M. Dellepiane, G. Ranzuglia, (Visual Computing Lab, ISTI - CNR, Italy) M. Vergauven, L. Van Gool (K.U.Leuven ESAT-PSI
Data analysis and visualization topics
 Data analysis and visualization topics Sergei MAURITS, ARSC HPC Specialist maurits@arsc.edu Content Day 1 - Visualization of 3-D data - basic concepts - packages - steady graphics formats and compression
Visualization Plugin for ParaView
 Alexey I. Baranov Visualization Plugin for ParaView version 1.3 Springer Contents 1 Visualization with ParaView..................................... 1 1.1 ParaView plugin installation.................................
Parallel Large-Scale Visualization
 Parallel Large-Scale Visualization Aaron Birkland Cornell Center for Advanced Computing Data Analysis on Ranger January 2012 Parallel Visualization Why? Performance Processing may be too slow on one CPU
ParaView s Comparative Viewing, XY Plot, Spreadsheet View, Matrix View
 ParaView s Comparative Viewing, XY Plot, Spreadsheet View, Matrix View Dublin, March 2013 Jean M. Favre, CSCS Motivational movie Supercomputing 2011 Movie Gallery Accepted at Supercomputing 11 Visualization
OpenFOAM postprocessing and advanced running options
 OpenFOAM postprocessing and advanced running options Tommaso Lucchini Department of Energy Politecnico di Milano The post processing tool: parafoam The main post-processing tool provided with OpenFOAM
Introduction to Paraview. H.D.Rajesh
 Introduction to Paraview H.D.Rajesh 1.Introduction 2.file formats 3.How to use Brief Overview Info: www.paraview.org http://www.paraview.org/wiki/paraview Open source,multi-platform application (Linux,
Parallel Visualization of Petascale Simulation Results from GROMACS, NAMD and CP2K on IBM Blue Gene/P using VisIt Visualization Toolkit
 Available online at www.prace-ri.eu Partnership for Advanced Computing in Europe Parallel Visualization of Petascale Simulation Results from GROMACS, NAMD and CP2K on IBM Blue Gene/P using VisIt Visualization
Efficiency Considerations of PERL and Python in Distributed Processing
 Efficiency Considerations of PERL and Python in Distributed Processing Roger Eggen (presenter) Computer and Information Sciences University of North Florida Jacksonville, FL 32224 ree@unf.edu 904.620.1326
Remote & Collaborative Visualization. Texas Advanced Compu1ng Center
 Remote & Collaborative Visualization Texas Advanced Compu1ng Center So6ware Requirements SSH client VNC client Recommended: TigerVNC http://sourceforge.net/projects/tigervnc/files/ Web browser with Java
SUMMER SCHOOL ON ADVANCES IN GIS
 SUMMER SCHOOL ON ADVANCES IN GIS Six Workshops Overview The workshop sequence at the UMD Center for Geospatial Information Science is designed to provide a comprehensive overview of current state-of-the-art
ENVI Services Engine: Scientific Data Analysis and Image Processing for the Cloud
 ENVI Services Engine: Scientific Data Analysis and Image Processing for the Cloud Bill Okubo, Greg Terrie, Amanda O Connor, Patrick Collins, Kevin Lausten The information contained in this document pertains
f o r d e m a n d i n g C F D pre- & post-processing ANSA μετα p i o n e e r i n g software systems www.beta-cae.gr
 ANSA μετα p i o n e e r i n g software systems f o r d e m a n d i n g C F D pre- & post-processing TM www.beta-cae.gr ANSA with its powerful functionality provides high efficiency solutions for CFD applications.
A FRAMEWORK FOR THE INTERACTIVE VISUALIZATION OF ENGINEERING MODELS
 17 th International Conference on the Application of Computer Science and Mathematics in Architecture and Civil Engineering K. Gürlebeck and C. Könke (eds.) Weimar, Germany, 12 14 July 2006 A FRAMEWORK
School Presentation. Raffaele Ponzini r.ponzini@cineca.it SuperComputing Applications and Innovation Department
 School Presentation Raffaele Ponzini r.ponzini@cineca.it SuperComputing Applications and Innovation Department OUTLINE General info s Analysis of student background and interests School timeline Lecturers
Analytic Modeling in Python
 Analytic Modeling in Python Why Choose Python for Analytic Modeling A White Paper by Visual Numerics August 2009 www.vni.com Analytic Modeling in Python Why Choose Python for Analytic Modeling by Visual
HPC Wales Skills Academy Course Catalogue 2015
 HPC Wales Skills Academy Course Catalogue 2015 Overview The HPC Wales Skills Academy provides a variety of courses and workshops aimed at building skills in High Performance Computing (HPC). Our courses
Processing Data with rsmap3d Software Services Group Advanced Photon Source Argonne National Laboratory
 Processing Data with rsmap3d Software Services Group Advanced Photon Source Argonne National Laboratory Introduction rsmap3d is an application for producing 3D reciprocal space maps from x-ray diffraction
The Lattice Project: A Multi-Model Grid Computing System. Center for Bioinformatics and Computational Biology University of Maryland
 The Lattice Project: A Multi-Model Grid Computing System Center for Bioinformatics and Computational Biology University of Maryland Parallel Computing PARALLEL COMPUTING a form of computation in which
Why this lecture exists ITK Lecture 12: Open Source & Cross Platform Software Development
 Why this lecture exists ITK Lecture 12: Open Source & Cross Platform Software Development Methods in Image Analysis CMU Robotics Institute 16-725 U. Pitt Bioengineering 2630 Spring Term, 2006 Successfully
Discover the framework and make your first steps with it.
 Computer assisted medical intervention toolkit Discover the framework and make your first steps with it. Nicolas SAUBAT Vincent LEAL 1/31 Simple plan: 1. General presentation of 2. Case studies: users,
 First Prev Next Last MayaVi: A Free Tool for 3D/2D Data Visualization Prabhu Ramachandran October, 25, 2002 Abstract MayaVi (http://mayavi.sf.net) is an easy to use tool for interactive 3D/2D data visualization
Visualization Infrastructure and Services at the MPCDF
 Visualization Infrastructure and Services at the MPCDF Markus Rampp & Klaus Reuter Max Planck Computing and Data Facility (MPCDF) (visualization@mpcdf.mpg.de) Interdisciplinary Cluster Workshop on Visualization
Science Gateways and services/tools for application areas: filling the gap between scientists and HPC/HTC platforms
 2014.11.12 Poznan Supercomputing and Networking Center Science Gateways and services/tools for application areas: filling the gap between scientists and HPC/HTC platforms Tomasz Piontek piontek@man.poznan.pl
Fully Automatic Hex Dominant Mesher. Paul Gilfrin Sharc Ltd
 Fully Automatic Hex Dominant Mesher Paul Gilfrin Sharc Ltd Sharc Ltd UK About Sharc Developer of Harpoon Founded in 1997 Distributors of Ensight Engineers with CFD/FEA experience Specialise in the integration
Challenge. Solution. Key Results
 Signal Processing for Medical Data Analysis A Case Study on Algorithm Development and Research by Rawzor Technologies, India. Challenge Signal processing for a portable battery less blood glucose monitor
Evaluation of Load/Stress tools for Web Applications testing
 May 14, 2008 Whitepaper Evaluation of Load/Stress tools for Web Applications testing CONTACT INFORMATION: phone: +1.301.527.1629 fax: +1.301.527.1690 email: whitepaper@hsc.com web: www.hsc.com PROPRIETARY
Google Web Toolkit. Introduction to GWT Development. Ilkka Rinne & Sampo Savolainen / Spatineo Oy
 Google Web Toolkit Introduction to GWT Development Ilkka Rinne & Sampo Savolainen / Spatineo Oy GeoMashup CodeCamp 2011 University of Helsinki Department of Computer Science Google Web Toolkit Google Web
All About Android WHAT IS ANDROID?
 All About Android WHAT IS ANDROID? Android specifically refers to a mobile operating system (based on Linux) that is developed by Google. It is open-source software, meaning that anyone can download the
Postprocessing with Python
 Postprocessing with Python Boris Dintrans (CNRS & University of Toulouse) dintrans@ast.obs-mip.fr Collaborator: Thomas Gastine (PhD) Outline Outline Introduction - what s Python and why using it? - Installation
Workshop on Android and Applications Development
 Workshop on Android and Applications Development Duration: 2 Days (8 hrs/day) Introduction: With over one billion devices activated, Android is an exciting space to make apps to help you communicate, organize,
OpenWalnut An Open-Source Visualization System
 An Open-Source Visualization System 1 Alexander Wiebel 3 Mario Hlawitschka 2 Gerik Scheuermann 1 1 Abteilung für Bild- und Signalverarbeitung, Institut für Informatik, Universität Leipzig, Germany 2 Institute
High Performance Computing
 High Parallel Computing Hybrid Program Coding Heterogeneous Program Coding Heterogeneous Parallel Coding Hybrid Parallel Coding High Performance Computing Highly Proficient Coding Highly Parallelized Code
Provenance for Visualizations
 V i s u a l i z a t i o n C o r n e r Editors: Claudio Silva, csilva@cs.utah.edu Joel E. Tohline, tohline@rouge.phys.lsu.edu Provenance for Visualizations Reproducibility and Beyond By Claudio T. Silva,
Sentaurus Workbench Comprehensive Framework Environment
 Data Sheet Comprehensive Framework Environment Overview is a complete graphical environment for creating, managing, executing, and analyzing TCAD simulations. Its intuitive graphical user interface allows
Create Cool Lumira Visualization Extensions with SAP Web IDE Dong Pan SAP PM and RIG Analytics Henry Kam Senior Product Manager, Developer Ecosystem
 Create Cool Lumira Visualization Extensions with SAP Web IDE Dong Pan SAP PM and RIG Analytics Henry Kam Senior Product Manager, Developer Ecosystem 2015 SAP SE or an SAP affiliate company. All rights
Real-Time Analytics on Large Datasets: Predictive Models for Online Targeted Advertising
 Real-Time Analytics on Large Datasets: Predictive Models for Online Targeted Advertising Open Data Partners and AdReady April 2012 1 Executive Summary AdReady is working to develop and deploy sophisticated