Ekornes ASA. 4 th QUARTER 2013
|
|
|
- Emmeline Cole
- 8 years ago
- Views:
Transcription
1 Ekornes ASA 4 th QUARTER 2013

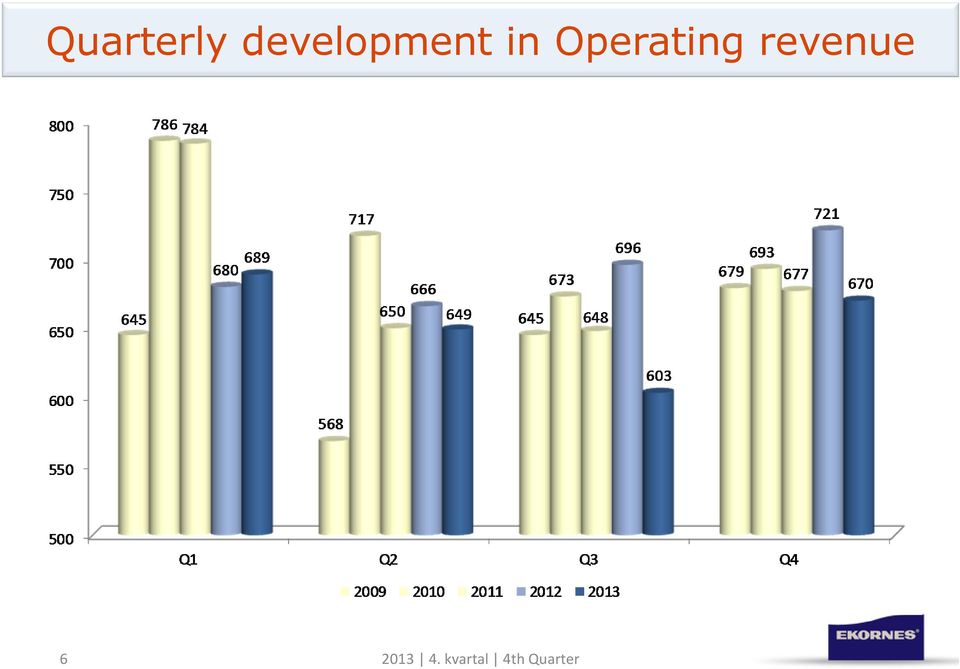
2 Ekornes Q4 Headlines: Operating revenue: Q4: NOK 670 Mill. (down 7.1% ). YTD : NOK Mill. (down 5.5%) Operating margin (EBIT) Q4: 14.4% (15.8%). YTD: 12.0% (14.4%) Dividend: The Board is proposing NOK 5.50 per share. In general, markets are challenging and uncertain. Consumers seem cautious in most markets. Norway and Central Europe slowing down. Signs of improvement in Germany into start USA slowly resuming. Order intake in total down. However, improving through Q4 and January Order book satisfactory and at last year s level. New Stressless chairs with metal base launched autumn Introduction well received by retailers. Selling well in in shops where displayed. Production Stressless YTD: 1,629 seats per day (YTD 2012: 1,725 seats) Q4: 1,534 seats per day (Q4 2012: 1,708 seats) Production capacity approx. 1,650 seats into 2014 (depending on mix). Svane down 10%. Norway, Sweden, Finland down. Denmark stable and CE up. Figures small in markets outside Norway. Improvement program continuing focus on cost savings and improving market position. Full capacity utilization expected in Q in all production plants (at planned capacity level). Some disruptions through December and January due to the implementing of SAP. Foreign exchange position good. Raw material prices trend stable but at a high level. Signals uncertain. Ekornes reverting to using the IFRS principles of Hedge Accounting as from Q Letter of intent signed with IMG in December. DD through Q kvartal 4 th Quarter

3 News 3


4 Development in Turnover 4


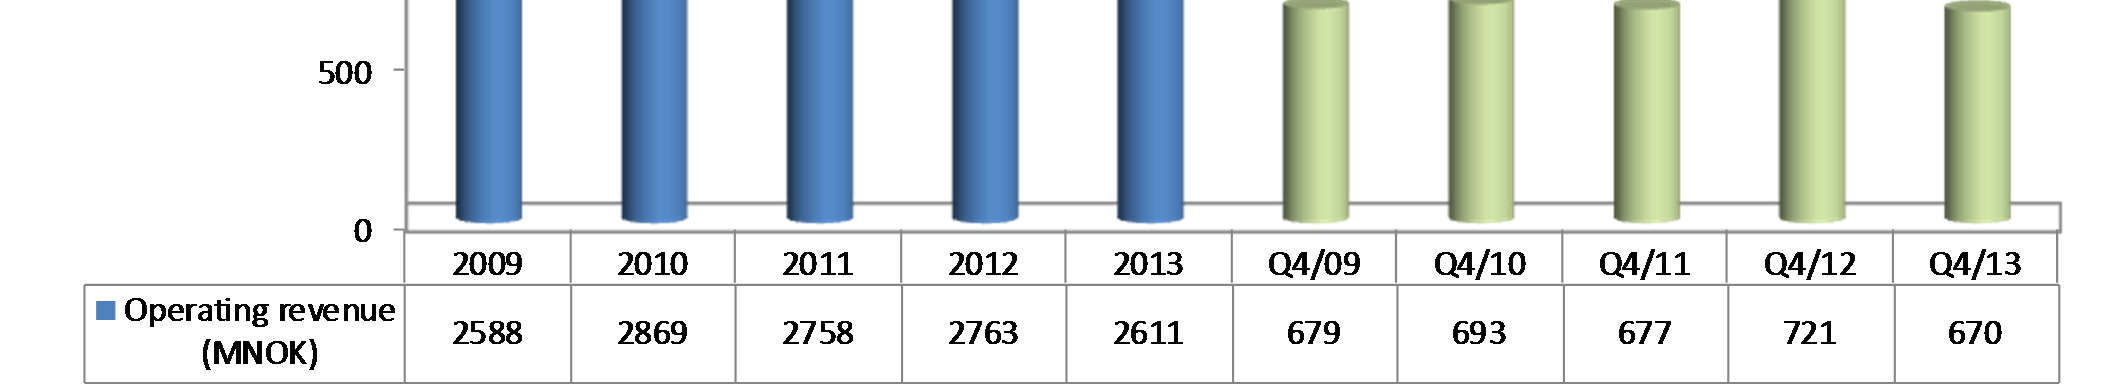
5 Development in Operating Revenue 5

6 Quarterly development in Operating revenue 6
7 Operating revenue by product area YTD 7


8 Operating revenues: Product area Sofas - YTD 8

9 Operating revenue by product area Q4 9


10 Operating revenues: Product area Sofas - Q4 10

11 Contribution margin by product area 11

12 Development in direct costs 12

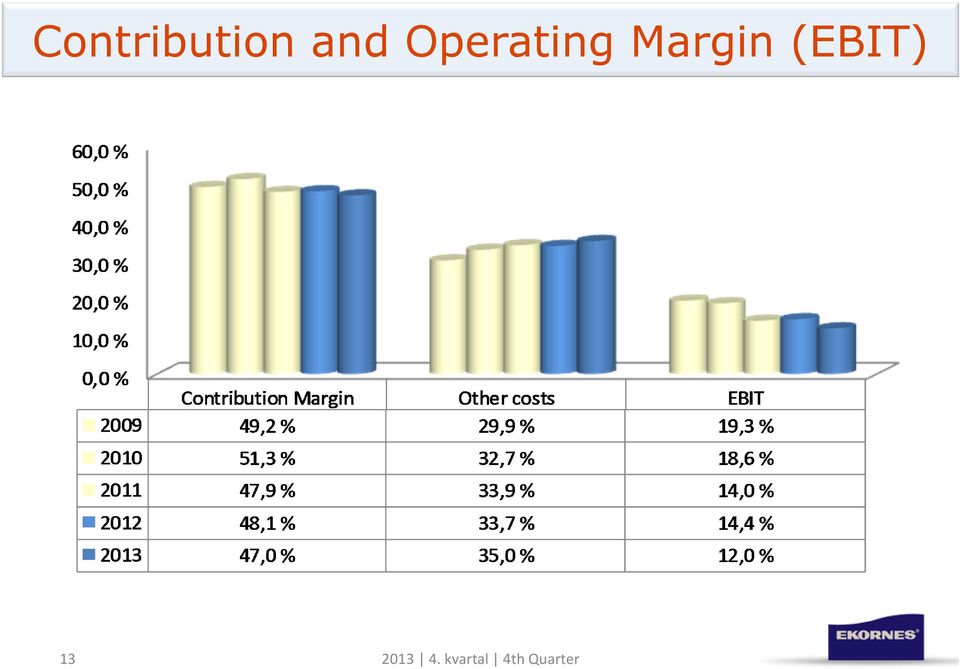
13 Contribution and Operating Margin (EBIT) 13
14 Development in Operating result (EBIT) and Pre-tax margin (EBT): 30,0 % 25,0 % 24,4 % 22,7 % 20,0 % 20,1 % 18,7 % 18,9 % 19,4 % 18,7 % 15,0 % 10,0 % 16,8 % 17,0 % 14,9 % 15,5 % 14,0 % 17,1 % 14,7 % 10,7 % 15,3 % 14,4 % 12,9 % 12,1 % 15,8 % 13,1 % 12,1 % 14,3 % 8,0 % 5,0 % 0,0 % Q1/08 Q2/08 Q3/08 Q4/08 Q1/09 Q2/09 Q3/09 Q4/09 Q1/10 Q2/10 Q3/10 Q4/10 Q1/11 Q2/11 Q3/11 Q4/11 Q1/12 Q2/12 Q3/12 Q4/12 Q1/13 Q2/13 Q3/13 Q4/13 EBIT individual quarter EBT individual quarter kvartal 4 th Quarter

15 Development in Operating result (EBIT) and Pre-tax margin (EBT) - Year to Date Q4 24,0 % 22,0 % 21,9 % 20,0 % 20,6 % 19,9 % 19,3 % 20,0 % 18,0 % 18,5 % 18,6 % 17,3 % 17,8 % 18,7 % EBIT YTD EBT YTD 16,0 % 14,0 % 14,0 % 14,4 % 12,0 % 12,0 % 10,0 %

16 Development EPS fully diluted (Figures in NOK) 16

17 Income Statement (Mill. NOK) Operating revenues 2611,3 100,0 % 2762, % Materials 648,2 24,8 % 691,8 25,0 % Salaries and social costs 782,4 30,0 % 793,0 28,7 % Other operating expenses 734,0 28,1 % 753,8 27,3 % Depreciation 133,8 5,1 % 125,1 4,5 % Total operating costs 2 298,4 88,0 % 2 363,7 85,6 % Operating result 312,9 12,0 % 399,0 14,4 % Net financial income/expenses -1,4-0,1 % -3,2-0,1 % Profit/loss currency exchange 22,5 0,9 % -21,9-0,8 % Ordinary result before taxes 334,0 12,8 % 373,9 13,5 % Calculated taxes ordinary result -111,7-4,3 % -118,1-4,3 % Ordinary result after taxes 222,3 8,5 % 255,8 9,3 % EPS 6,04 6,95 17

18 Income Statement (Mill. NOK) Q4/13 Q4/12 Operating revenues 670, % 721, % Materials 174,3 26,0 % 190,7 26,4 % Salaries and social costs 197,4 29,5 % 203,8 28,2 % Other operating expenses 167,7 25,0 % 181,4 25,1 % Depreciation 34,4 5,1 % 31,7 4,4 % Total operating costs 573,8 85,6 % 607,6 84,2 % Operating result 96,2 14,4 % 113,9 15,8 % Net financial income/expenses -0,6-0,1 % -0,3 0,0 % Profit/loss currency exchange 1,7 0,3 % -10,9-1,5 % Ordinary result before taxes 97,3 14,5 % 102,7 14,2 % Calculated taxes ordinary result -40,2-6,0 % -39,4-5,5 % Ordinary result after taxes 57,1 8,5 % 63,3 8,8 % EPS 1,56 1,72 18

19 Balance Sheet (Mill. NOK) Total Long Term Assets 948,1 932,7 Inventories 305,0 315,9 Trade Debtors 331,7 354,5 Other Current Assets 45,6 52,4 Value of forward contracts 16,3 258,2 Cash and Bank Deposits 328,4 273,3 Total Current Assets 1 027, ,3 TOTAL ASSETS 1 975, ,0 Total Equity 1 566, ,7 Provisions, commitments, deferred tax 16,1 78,2 Trade Creditors 118,0 95,3 Taxes, VAT and national insurance 96,4 123,7 Value of forward contracts - - Bank loans Other current liabilities 177,8 185,1 Total Liabilities 408,3 482,3 TOTAL EQUITY AND LIABILITIES 1 975, ,0 19

20 Balance Sheet (Mill. NOK) Q4/13 Q3/13 Total Fixed Assets 948,1 944,8 Inventory 305,0 317,0 Trade Debtors 331,7 410,9 Other Current Assets 45,6 46,8 Value of forward contracts 16,3 68,7 Cash and Bank Deposits 328,4 134,6 Total Current Assets 1 027,0 978,0 TOTAL ASSETS 1 975, ,8 Total Equity 1 566, ,4 Provisions, commitments, deferred tax 16,1 25,4 Trade Creditors 118,0 106,2 Taxes, VAT and national insurance 96,4 58,1 Value of forward contracts - Bank loans - Other current liabilities 177,8 187,7 Total Liabilities 408,3 377,4 TOTAL EQUITY AND LIABILITIES 1 975, ,8 20

21 Statement of Cash Flow (Mill. NOK) Net cash flow from: Operating activities 405,7 332,0 330,3 435,8 Investing activities -148,1-79,9-142,8-112,4 Financing activities -202,5-276,2-331,4-257,5 Net change in cash and cash equivalents 55,1-24,1-143,9 65,9 Cash and cash equivalents at the beginning of period Cash and cash equivalents at the end of period 273,3 297,4 441,3 375,4 328,4 273,3 297,4 441,3 21
22 Development in Total Capital, Net-working Capital and Equity (Mill. NOK) Total capital 1 975, , , ,3 Net-working capital* 618,5 592,0 588,5 667,1 Equity 1 566, , , ,5 Equity ratio 79,3 % 77,9 % 79,0 % 77,0 % *Not included the market value of forward contracts. 22
23 Non Hedge Accounting Figures 2013 according to IFRS Non Hedge Accounting 23
24 Year end figures- NOT using Hedge Accounting (Tall i NOK mill.) (Figures in NOK mill.) Hele året Whole year Driftsinntekter Operating revenues 2 561, ,4 Driftsresultat Operating result 262,9 348,7 Finansielle poster: Financial items: Gevinst/tap valuta-vekslinger Profit/Loss foreign currency exchange 50,0 50,3 Gevinst/tap urealiserte terminkontrakter Profit/Loss unrealised forward contracts -241,9 110,1 Netto agio balansejusteringer Net balance sheet adjustments 22,5-21,9 Netto andre finansielle poster Net other financial items -1,4-3,2 Netto finansposter Net financial items -170,8 135,3 Ordinært resultat før skattekostnad Ordinary result before taxes 92,1 484,0 Skattekostnad Tax on ordinary result -43,8-149,0 Årets resultat Profit for the year 48,3 335,0 24
25 Statement of comprehensive income (Tall i NOK mill.) (Figures in NOK mill.) År/Year None Hedge Acc. Resultat etter skatt Profit after taxes 48,3 222,3 Andre inntekter og kostnader: Aktuarmessige gevinster på ytelsesbaserte pensjonsordninger Other comprehensive income: Actuarial gains on defined benefit plans Endring utsatt skatt pensjoner Change in deferred tax pensions Endring verdi kontantstrømsikring Change in value cash-flow hedging -241,9 Endring utsatt skatt - kontantstrømsikring Change in deferred tax cash-flow hedging 67,9 Omregningsdifferanse Translation differences 10,1 10,1 Omregningsdifferanse - netto finansiering datterselskap Translation differences net financing subsidiaries 8,5 8,5 Endring utsatt skatt - netto finansiering datterselskap Change in deferred tax - net financing subsidiaries -2,3-2,3 Sum andre inntekter og kostnader Total other comprehensive income 16,3-157,7 Totalresultat Total comprehensive income 64,6 64,6 25
26 Change in order influx per market (%) (in local currency) 26

27 Operating revenue per market Year (Mill. NOK) 27
28 Operating revenue per market 4 th quarter (Mill. NOK) 28
29 Turnover per market (Mill. NOK) 29
30 Turnover per market (Mill. NOK) 30
31 Turnover per market (Mill. NOK) 31
32 Turnover per market (Mill. NOK) 32
33 Turnover per market (Mill. NOK) 33
34 Turnover per market (Mill. NOK) 34
35 Financial Calendar 2014 Coming events: 12 May st Quarter Result May 2014 Ordinary General Assembly. 13 May 2014 Presentation 1 st Quarter 2014, Hotel Continental, Oslo at a.m. 14 August nd Quarter Result August 2014 Presentation 2 nd Quarter 2014, with Webcast, Hotel Continental, Oslo at a.m. 12 November rd Quarter Result November 2014 Presentation 3 rd Quarter Result 2014, Hotel Continental, Oslo - at a.m. 35
36 Largest shareholders ( ): Shareholders Country Percentage 1. Nordstjernan AB SWE 15,45 % 2. Folketrygdfondet NOR 10,46 % 3. J.P. Morgan Chase Ba Nordea RE:NON-TREATY GBR 5,61 % 4. Pareto aksje Norge NOR 4,74 % 5. J.P. Morgan Chase Ba SPECIAL TREATY LENDI GBR 4,12 % 6. Odin Norge NOR 3,89 % 7. State Street Bank AN A/C Client Omnibus F USA 3,14 % 8. Berit Vigdis Ekornes Unhjem NOR 2,91 % 9. Gunnhild Ekornes Mertens NOR 2,88 % 10. Vind LV AS NOR 2,40 % Other shareholders approx. 2,349 44,40 % Proportion Norwegian shareholders 51,10 % Non-Norwegian shareholders 48,90 % 36

37 Board of Directors Group Management Olav Kjell Holtan Chairman Kjersti Kleven Vice Chairman Bjørn Gulden Stian Ekornes Nora Förisdal Larssen CEO: Nils-Fredrik Drabløs Phone: Mobile: CFO: Robert Svendsen Phone: Mobile: Employee Representatives: Wenche Elvegård Tone Helen Hanken Sveinung Utgård 37
1. kvartal st Quarter. EKORNES ASA 1 st Quarter 2002
 EKORNES ASA 1 2002 1 BUSINESS IDEA Ekornes supplies home furniture products for the domestic Norwegian and international markets. The furniture products will have one of the following brands: Ekornes,
Q3 2015. EKORNES ASA November 16 th 2015
 Q3 215 EKORNES ASA November 16 th 215 Agenda Highlights Operational review Financial review Summary & outlook Highlights Stable development in underlying operating revenue and margin Stressless Q3 revenue
A natural choice in fish and seafood. 2nd quarter 2006
 A natural choice in fish and seafood 2nd quarter 2006 By the end of Q2 operating revenue amounted to MNOK 827,6, compared with MNOK 710,4 last year. EBITDA was MNOK 9,5 compared with MNOK 28,1 and EBIT
How To Make Money From Fishing
 A natural choice in fish and seafood QUARTERLY REPORT 4th quarter 2005 Preliminary annual results 2005 The group s operating revenue by the end of Q4 amounted to MNOK 1.731,9 compared with MNOK 1.494,6
A natural choice in fish and seafood. 4th quarter 2006
 A natural choice in fish and seafood 4th quarter 2006 By the end of Q4 2006 operating revenue amounted to MNOK 718,6, compared with MNOK 627,8 last year. EBITDA was MNOK 36,5 compared with MNOK 24,3 and
WE SIMPLIFY YOUR BUSINESS
 WE SIMPLIFY YOUR BUSINESS Visma ASA Biskop Gunnerusgt. 6, Postboks 774 Sentrum, NO-0106 OSLO, Norway, tel +47 46 40 40 00, fax +47 23 15 81 58, www.visma.com 4 QUARTER 2005 PRINTED ON 23. JANUARY 2006
Net operating revenues 85,1 100,0 EBITDA -1,3 5,4 EBIT -3,1 3,2 Operating margin -3,6 % 3,2 % Group
 1st quarter 2008 Group The Group s operating revenues in Q1 2008 were MNOK 263,1 compared to proforma MNOK 252,7 last year. EBITDA was MNOK 0,0 compared to proforma MNOK 4,6 last year, and EBIT MNOK -8,9
Equity per share (NOK) 147 123 131 Equity ratio 39 % 38 % 36 % Non-current net asset value per share (NOK) (EPRA NNNAV) 2) 184 152 165
 147 123 131 Equity ratio 39 % 38 % 36 % Non-current net asset value per share (NOK) (EPRA NNNAV) 2) 184 152 165") REPORT FOR Q2 AND THE FIRST 6 MONTHS OF 2015 KEY FIGURES Amounts in NOK million Q2 2015 Q2 2014 30.06.15 30.06.14 2014 Net rental income 501 450 1 005 904 1 883 Fair value adjustments in investment properties
REPORT FOR Q2 AND THE FIRST 6 MONTHS OF 2015 KEY FIGURES Amounts in NOK million Q2 2015 Q2 2014 30.06.15 30.06.14 2014 Net rental income 501 450 1 005 904 1 883 Fair value adjustments in investment properties
Equity per share (NOK) 135 123 131 Equity ratio 37 % 39 % 36 % Non-current net asset value per share (NOK) (EPRA NNNAV) 2) 170 153 165
 135 123 131 Equity ratio 37 % 39 % 36 % Non-current net asset value per share (NOK) (EPRA NNNAV) 2) 170 153 165") REPORT Q1/2015 KEY FIGURES Amounts in NOK million Q1 2015 Q1 2014 31.12.14 Net rental income 503 454 1 883 Fair value adjustments in investment properties and interest rate derivatives 1 294-9 281 Profit
REPORT Q1/2015 KEY FIGURES Amounts in NOK million Q1 2015 Q1 2014 31.12.14 Net rental income 503 454 1 883 Fair value adjustments in investment properties and interest rate derivatives 1 294-9 281 Profit
Third quarter results 2015
 1 Third quarter results 2015 30 October 2015 Peter A. Ruzicka, President & CEO Improved performance in the third quarter 2.3% organic growth 1 15% EBIT (adj.) 2 growth in BCG 57% increase in EPS 2 1 Reported
Net operating revenues 271,0 95,6 499,0 354,6 EBITDA 104,9-4,9 125,1 14,1 EBIT 99,1-8,8 113,5 4,7 Operating margin 36,6 % -9,2 % 22,7 % 1,3 %
 2nd quarter 2007 The group s operating revenue in Q2 amounted to MNOK 498,6 compared with MNOK 337,9 last year. EBITDA was MNOK 99,1 mill. compared with MNOK -8,0 last year and EBIT MNOK 86,7 compared
INTERIM REPORT 2015 SECOND QUARTER (Q2)
") INTERIM REPORT 2015 SECOND QUARTER (Q2) Summary - Revenue in the second quarter came to 519 million kroner, 122 million kroner higher than the second quarter of 2014 - Higher revenue was a result of increased
INTERIM REPORT 2015 SECOND QUARTER (Q2) Summary - Revenue in the second quarter came to 519 million kroner, 122 million kroner higher than the second quarter of 2014 - Higher revenue was a result of increased
WE SIMPLIFY YOUR BUSINESS. Report for the 1st quarter of 2006
 WE SIMPLIFY YOUR BUSINESS Report for the 1st quarter of 2006 Oslo, April 9, 2006 In the first quarter of 2006, Visma achieved revenues of MNOK 587 (468). The total revenue growth of 25,5% was achieved
quarterly report 04-2011
 quarterly report 04-2011 highlights as at the 4th quarter 2011 The Group s operating revenues in 2011 were NOK 10 716 million (9 345) according to IFRS. The main reasons for the increase were higher revenues
NORWAY ROYA L S A L M ON PRESENTATION Q2 2015. Oslo, 26 August 2015 Charles Høstlund, CEO Ola Loe, CFO
 PRESENTATION Q2 2015 Oslo, 26 August 2015 Charles Høstlund, CEO Ola Loe, CFO AGENDA: Highlights for the period Segment information Group financials Markets Outlook 2 Highlights in Q2 2015 NORWAY ROYA L
Increasing market share in a receding market
 Interim report for the first quarter of the financial year 2008/2009 Increasing market share in a receding market First quarter (September November 2008) KappAhl s net sales (excluding VAT) for the period
Grieg Seafood ASA Q3 2015. Andreas Kvame CEO. Atle Harald Sandtorv CFO. 6 November 2015. griegseafood.com
 Grieg Seafood ASA Q3 2015 Andreas Kvame CEO Atle Harald Sandtorv CFO 6 November 2015 1 Agenda Highlights Business Units (Regions) Financials Outlook 2 HIGHLIGHTS Q3 2015 3 Highlights Q3 2015 Operational
INTERIM REPORT 2014 SECOND QUARTER (Q2)
") INTERIM REPORT 2014 SECOND QUARTER (Q2) Summary - Revenue in the second quarter came to 397 million kroner, 35 million kroner lower than the second quarter of 2013 - Lower revenue was a result of decreased
INTERIM REPORT 2014 SECOND QUARTER (Q2) Summary - Revenue in the second quarter came to 397 million kroner, 35 million kroner lower than the second quarter of 2013 - Lower revenue was a result of decreased
2 ND QUARTER 2016 RESULTS ANNOUNCEMENT
 2 ND QUARTER 2016 RESULTS ANNOUNCEMENT TOMRA SYSTEMS ASA 2 nd Quarter Results 19.07.2016 HIGHLIGHTS FROM THE QUARTER Revenues Gross margin Operating expenses EBITA Cashflow TOMRA Collection TOMRA Sorting
FIRST QUARTER 2005. Highlights from first quarter 2005 include: Operating profit 10 MNOK (42 MNOK last year)
") FIRST QUARTER 2005 Highlights from first quarter 2005 include: Revenues 599 MNOK (+1 percent relative to first quarter 2004) Operating profit 10 MNOK (42 MNOK last year) Acquisition of Orwak Group completed
FIRST QUARTER 2005 Highlights from first quarter 2005 include: Revenues 599 MNOK (+1 percent relative to first quarter 2004) Operating profit 10 MNOK (42 MNOK last year) Acquisition of Orwak Group completed
Oslo Børs VPS Holding ASA 2nd Quarter 2015
 Oslo Børs VPS Holding ASA 2nd Quarter 215 12 August 215 2nd quarter at a glance Good level of trading and settlement activity continued in the quarter Continuing strong interest in admission of both shares
NORWEGIAN AIR SHUTTLE ASA
 NORWEGIAN AIR SHUTTLE ASA SECOND QUARTER AND FIRST HALF REPORT 2009 HIGHLIGHTS First half revenue up by 24.5% to MNOK 3,287.8, quarterly revenue up by 22.5 % to MNOK 1,900.5 (1,551.2). Earnings before
RESULTATREGNSKAP / INCOME STATEMENT
 Fourth Quarter 2005 RESULTATREGNSKAP / INCOME STATEMENT Q4 2005 Q4 2004 31.12.2005 31.12.2004 IFRS IFRS IFRS IFRS NOK 000' NOK 000' NOK 000' NOK 000' Driftsinntekter/operating Income Salgsinntekter / Revenue
First step in future global sourcing. Extended partnership with Telenor: Strategic wins Application Services:
 EDB Business Partner > slide 1 ENTERING 2007 AT HIGH SPEED First step in future global sourcing Acquiring Infopulse Ukraine with 300 employees Extended partnership with Telenor: IT Operations in Sweden;
FOURTH QUARTER 2005. Highlights from fourth quarter 2005 include:
 FOURTH QUARTER 2005 Highlights from fourth quarter 2005 include: Revenues of 675 MNOK (+2% percent relative to fourth quarter 2004, +6% after adjusting for currency effects and acquisitions/disposals)
Oslo Børs Holding ASA first quarter 2005
 Oslo Børs Holding ASA first quarter 25 First quarter in brief: Operating revenues: NOK 79. (71.) million Operating profit: NOK 37. (29.1) million Earnings for the period: NOK 34.9 (21.5) million Earnings
Interim report Q3 2015
 Interim report Q3 2015 Interim report Q3 2015 Dear Shareholders 2 November 2015 marked a milestone in the history of Kid when the company's shares were listed on the Oslo Stock Exchange. Over the last
About Komplett Bank ASA. Outlook. Developments to date
 Interim report 3 rd quarter 2015 About Komplett Bank ASA Komplett Bank ASA started banking operations on 21 March 2014 when the company received its banking licence from the Norwegian authorities. Komplett
EDB Business Partner ASA FIRST QUARTER 2005 INTERIM REPORT
 - 1 - EDB Business Partner ASA FIRST QUARTER 2005 INTERIM REPORT Growth in revenues and profit as a consequence of acquisitions Successful integration of acquired businesses and subsequent cost reductions
Fourth quarter report 2009. Quarterly report. Nr 4 2009
 Fourth quarter report 2009 Quarterly report Nr 4 2009 Highlights Operating revenue in 4Q was 143 MNOK which is 25 % lower than the same period last year. The period s EBITDA showed a loss of 16.1 MNOK.
FINANCIAL REPORT Q3 2014
 CRAYON GROUP HOLDING AS FINANCIAL REPORT Management commentary Financials Accumulated gross profit as of September was MNOK 578.1 compared to MNOK 542.3 for the same period in (7% YoY growth). Accumulated
Quarterly report Nr 2 2010. Second quarter report 2010
 Quarterly report Nr 2 2010 Second quarter report 2010 Highlights Operating revenues in 2Q were 176.3 MNOK versus 164.3 MNOK last year. Year to date operating revenues were 334.3 MNOK versus 316.7 MNOK
Oslo Børs VPS Holding ASA 1st Quarter 2015
 Oslo Børs VPS Holding ASA 1st Quarter 215 3 April 215 1st quarter at a glance Good level of trading activity continued in the first quarter Share trading volume up by 16% from the first quarter of Continuing
Tables. Standard symbols:. Category not applicable.. Data not available... Data not yet available Nil 0 Less than half the 0.0 final digit shown
 Tables 1. Norges Bank. Balance sheet. In millions of NOK 2. Norges Bank. Investments for Government Pension Fund - Global. In millions of NOK 3. Banks. Balance sheet. In millions of NOK 4. Banks. Loans
Quarterly report. 2nd quarter 2013
 Quarterly report 2nd quarter 2013 Group The Group s operating revenues in Q2 2013 were MNOK 121.2 compared to MNOK 107.1 last year. EBITDA was MNOK 4.7 compared to MNOK 3.3 last year. EBIT was MNOK 1.8
About Komplett Bank ASA. Outlook. Developments to date
 Interim report 4th quarter 2015 About Komplett Bank ASA Komplett Bank ASA started banking operations on 21 March 2014 when the company received its banking licence from the Norwegian authorities. Komplett
Oslo Børs VPS Holding ASA 1st Quarter 2011
 Oslo Børs VPS Holding ASA 1st Quarter 2011 28 April 2011 Overview First quarter highlights Increased market activity compared to last quarter Operating revenues: NOK 243.0 million (246.1) Operating profit
Photo: Bjørn Morgan / August 2014
 Norwegian Air Shuttle ASA Q3 2014 Presentation Photo: Bjørn Morgan / August 2014 Double digit revenue growth in Q3 driven by International Group revenues of MNOK 6,337 in Q3 2014 +30 % 6 000 5 000 4 000
Oslo Børs Holding ASA fourth quarter 2004
 Oslo Børs Holding ASA fourth quarter 24 Fourth quarter highlights: Continuing very high level of market activity Operating revenues NOK 7.4m (62.2m) Profit NOK 2.5m (1.9m) Earnings per share NOK 4.1 (2.19)
Condensed consolidated income statement
 RESTATED AND PREVIOUSLY COMMUNICATED (OLD) QUARTERLY INFORMATION FOR Fortum signed the agreement to sell its Swedish distribution business on 13 March 2015, which concludes Fortum s divestment of its electricity
Oslo Børs VPS Holding ASA 4th Quarter 2010
 Oslo Børs VPS Holding ASA 4th Quarter 2010 17 February 2011 Overview Fourth quarter highlights Increased market activity compared to last quarter Proposed dividend of NOK 8,- per share Operating revenues:
Net operating revenues 93,3 74,6 316,0 292,9 EBITDA 5,1-14,4 6,5-17,7 EBIT 4,0-16,2 1,5-25,2 Operating margin 4,3 % -21,7 % 0,5 % -8,6 %
 4th quarter 2009 Group The Group s operating revenues in Q4 2009 was MNOK 156,6 compared to MNOK 138,1 proforma last year. EBITDA was MNOK 10,0 compared to MNOK -13,2 proforma last year. EBIT was MNOK
TELIO HOLDING ASA QUARTERLY REPORT Q1 2007
 TELIO HOLDING ASA QUARTERLY REPORT Q1 2007 Q1 Revenues NOK 88.4 million up 34% vs Q1 06, EBITDA of 18% of revenues, and operating profits of NOK 4.1 million, best ever. Strong customer growth in Denmark
Oslo Børs Holding ASA
 Oslo Børs Holding ASA 3rd Quarter 2007 25 October 2007 Overview Third quarter highlights Continuing high level of market activity Operating revenues: NOK 143.6 million (110.4) Operating profit: NOK 88.4
Oslo Børs VPS Holding ASA 2nd Quarter 2012
 Oslo Børs VPS Holding ASA 2nd Quarter 15 August 2nd quarter at a glance Continued good level of activity in the fixed income market Challenging conditions in the primary and secondary equities and derivatives
INTERIM REPORT for the period January 1 June 30, 2006
 ICA AB, corporate identity number 556582-1559 INTERIM REPORT for the period January 1 June 30, 2006 Strong development for ICA Group during first half year Stockholm, August 15, 2006 Net sales during the
Words from the President and CEO 3 Financial highlights 4 Highlights 5 Export lending 5 Local government lending 6 Funding 6 Results 6 Balance sheet
 Words from the President and CEO 3 Financial highlights 4 Highlights 5 Export lending 5 Local government lending 6 Funding 6 Results 6 Balance sheet 7 Events after the balance sheet date 8 Income statement
Ability Group ASA. 2 nd quarter 2006. Side 1 av 14
 Ability Group ASA 2 nd quarter 2006 Side 1 av 14 The recent acquisitions of Drilling Production Technology AS (DPT), Triangle Technology AS (Triangle), Reservoir Evaluation (RES), Peak Group (Holdings)
Quarterly Financial Results for the Fiscal Year Ending September 30, 2016 (J-GAAP)
") February 10, 2016 Quarterly Financial Results for the Fiscal Year Ending September 30, 2016 (J-GAAP) (1st Quarter / October 1, 2015 December 31, 2015) Company Name Hosokawa Micron Corporation Stock Exchange
February 10, 2016 Quarterly Financial Results for the Fiscal Year Ending September 30, 2016 (J-GAAP) (1st Quarter / October 1, 2015 December 31, 2015) Company Name Hosokawa Micron Corporation Stock Exchange
NORWAY ROYA L S A L M ON PRESENTATION Q1 2016. Oslo, 4 May 2016 Charles Høstlund, CEO Ola Loe, CFO 1
 PRESENTATION Q1 2016 Oslo, 4 May 2016 Charles Høstlund, CEO Ola Loe, CFO 1 AGENDA: Highlights for the period Segment information Green licenses Group financials Markets Outlook 2 Highlights in Q1 2016
Ratio Analysis. A) Liquidity Ratio : - 1) Current ratio = Current asset Current Liability
 Liquidity Ratio : - 1) Current ratio = Current asset Current Liability") A) Liquidity Ratio : - Ratio Analysis 1) Current ratio = Current asset Current Liability 2) Quick ratio or Acid Test ratio = Quick Asset Quick liability Quick Asset = Current Asset Stock Quick Liability
A) Liquidity Ratio : - Ratio Analysis 1) Current ratio = Current asset Current Liability 2) Quick ratio or Acid Test ratio = Quick Asset Quick liability Quick Asset = Current Asset Stock Quick Liability
Interim Report January 1 st March 31 st, 2003
 Interim Report January 1 st March 31 st, 2003 First Quarter 2003 Earnings before taxes increased by 23 per cent to 70 MSEK. Earnings after taxes increased by 36 per cent to 45 MSEK. Earnings per share
INTERIM REPORT 2013 SECOND QUARTER (Q2)
") INTERIM REPORT 2013 SECOND QUARTER (Q2) Summary - Revenue in the second quarter came to 432 million kroner, 39 million kroner higher than the second quarter of 2012 - Higher revenue was a result of increased
INTERIM REPORT 2013 SECOND QUARTER (Q2) Summary - Revenue in the second quarter came to 432 million kroner, 39 million kroner higher than the second quarter of 2012 - Higher revenue was a result of increased
Nordic Energy Summit 2014. CFO Arne Johan Dale 20.03.14
 Nordic Energy Summit 2014 CFO Arne Johan Dale 20.03.14 Highlights 2013 Signed contracts 2.9 billion Contract coverage for 2014 cover expenses Contract backlog 3.5 billion Bank financing with maturity in
Lerøy Seafood Group. Quarterly report Third quarter 2009. November 12th 2009. Helge Singelstad. Ivan Vindheim CEO CFO
 Lerøy Seafood Group Quarterly report Third quarter 2009 November 12th 2009 Helge Singelstad CEO Ivan Vindheim CFO 1 Agenda 1. 1 Considerations 2. 2 Key financial figures Q3 2009 3. 3 Lerøy at a glance
Havila Shipping ASA 2 nd quarter 2013 accounts 23.07.13
 Havila Shipping ASA 2 nd quarter 2013 accounts 23.07.13 Highlights Year to date Havila Harmony Extension of existing contract for four years firm with two optional periods of one year each Will keep the
Consolidated balance sheet
 83 Consolidated balance sheet December 31 Non-current assets Goodwill 14 675.1 978.4 Other intangible assets 14 317.4 303.8 Property, plant, and equipment 15 530.7 492.0 Investment in associates 16 2.5
EDB Business Partner ASA FOURTH QUARTER 2003 INTERIM REPORT
 - 1 - EDB Business Partner ASA FOURTH QUARTER 2003 INTERIM REPORT Summary The EDB group reports its best quarterly earnings since the fourth quarter of 2001 All business areas report improved operating
Havila Shipping ASA 4 th quarter 2013 accounts Preliminary 2013 accounts
 Havila Shipping ASA 4 th quarter 2013 accounts Preliminary 2013 accounts CEO Njål Sævik CFO Arne Johan Dale 31.01.14 Highlights Signed contracts 2.9 billion Contract coverage for 2014 cover expenses Contract
Investeringsselskabet. Nasdaq OMX Copenhagen A/S Announcement No 7 Nikolaj Plads 6 page 1 of 19 PO Box 1040 date 27 August 2015
 Investeringsselskabet LUXOR Frederiksborggade 50, 1360 København K Telefon 33 32 50 15 Telefax 33 12 41 70 CVR-nr. 49 63 99 10 Nasdaq OMX Copenhagen A/S Announcement No 7 Nikolaj Plads 6 page 1 of 19 PO
Q4 2014 Highlights. 22% revenue growth y.o.y. Unit cost (CASK) increased by 3% y.o.y to NOK 0.43. NOK 0.5 bn loss related to hedges for 2015
 increased by 3% y.o.y to NOK 0.43. NOK 0.5 bn loss related to hedges for 2015") Norwegian Air Shuttle ASA Q4 2014 Presentation Q4 2014 Highlights 22% revenue growth y.o.y Driven by long-haul expansion Received three new 737-800 s in Q4 replacing older aircraft 45% growth in ancillary
Norwegian Air Shuttle ASA Q4 2014 Presentation Q4 2014 Highlights 22% revenue growth y.o.y Driven by long-haul expansion Received three new 737-800 s in Q4 replacing older aircraft 45% growth in ancillary
Visual Management 4Q01. From 150 to 1500 employees in 12 months
 Visual Management Visual Management 4Q01 From 150 to 1500 employees in 12 months Liinos 93,6% of shareholders have accepted offer by Visma! Recap from 3Q presentation in October We expected improvements
Interim Report for the period 1 January 31 March 2015
 Interim Report for the period 1 January 31 March 2015 ALL FIGURES IN THIS REPORT ARE EXPRESSED IN SEK, UNLESS STATED OTHERWISE. FIGURES IN PARENTHESES REFER TO THE CORRESPONDING FIGURES FOR THE PREVIOUS
Interim Report. 4th quarter 2008
 Interim Report 4th quarter 2008 Nordic Semiconductor ASA 4th quarter 2008 Revenue in Q4 68.9 MNOK, an increase of 40% over Q4 2007 of 49.2 MNOK. A stronger USD rated contributed NOK 14 relative to Q4 2007.
Grieg Seafood ASA Q1 2014. Morten Vike CEO. Atle Harald Sandtorv CFO. 15 May 2014. griegseafood.com
 Grieg Seafood ASA Q1 2014 Morten Vike CEO Atle Harald Sandtorv CFO 15 May 2014 1 Agenda Highlights Business Units (Regions) Financials Outlook 2 HIGHLIGHTS Q1 2014 3 Highlights Q1 2014 First quarter results
Link Mobility Group ASA
 Link Mobility Group ASA Financial Result First quarter 2015 1 Highlights Q1 2015 Solid quarter The mobile B2B service business is traditionally experiencing a slow start of the year, this year however
Consolidated Statement of Profit or Loss (in million Euro)
") Consolidated Statement of Profit or Loss (in million Euro) Q3 2014 Q3 2015 % change 9m 2014 9m 2015 % change Revenue 636 661 3.9% 1,909 1,974 3.4% Cost of sales (440) (453) 3.0% (1,324) (1,340) 1.2% Gross
Consolidated Statement of Profit or Loss (in million Euro) Q3 2014 Q3 2015 % change 9m 2014 9m 2015 % change Revenue 636 661 3.9% 1,909 1,974 3.4% Cost of sales (440) (453) 3.0% (1,324) (1,340) 1.2% Gross
Pfeiffer Vacuum announces results for FY 2014
 PRESS RELEASE Pfeiffer Vacuum announces results for FY 2014 Total sales of 406,6 million EBIT margin at 11,0 percent Dividend proposal of 2.65 euros Asslar, Germany, March 26, 2015. Total sales for FY
Oslo Børs Holding ASA 4 th quarter 2001
 Oslo Børs Holding ASA 4 th quarter 2001 Highlights in the 4 th quarter Pre-tax earnings 4 th quarter: MNOK 11.5 for 2001: MNOK 61 Earnings per share 4 th quarter: NOK 1.56 for 2001: NOK 9.95 Proposed ordinary
Presented by CEO Øyvind Isaksen and CFO Roar Østbø (1) 18-08-11
 18-08-11") Presented by CEO Øyvind Isaksen and CFO Roar Østbø (1) 18-08-11 2 Agenda Q2-11 Highlights Key Figures Regional market update Financial review Outlook Q&A (2) 18-08-11 3 Q2-2011 Highlights Acceptable quarter
Presented by CEO Øyvind Isaksen and CFO Roar Østbø (1) 18-08-11 2 Agenda Q2-11 Highlights Key Figures Regional market update Financial review Outlook Q&A (2) 18-08-11 3 Q2-2011 Highlights Acceptable quarter
Oslo Børs Holding ASA second quarter 2005
 Oslo Børs Holding ASA second quarter 25 Second quarter highlights: Energy sector continues to strengthen 15 new companies admitted to listing in the quarter Operating revenues: NOK 86.6 (64.8) million
Interim report for the 3rd quarter of 2008. Glitnir Bank ASA
 Interim report for the 3rd quarter of 2008 Glitnir Bank ASA contents Report of the Directors...3 Consolidated Income Statement...5 Consolidated Balance Sheet...6 Consolidated Statement of Changes in Equity...7
Presentation 1 st Quarter 2011
 Presentation 1 st Quarter 2011 This is Havila Shipping ASA Head-office in Fosnavåg, Norway. Partnership with PACC Offshore in Singapore A fleet of 28 vessels included a new-building program of 1 modern
SECOND QUARTER 2006. Highlights from second quarter 2006 include: Strong performance in all business areas
 SECOND QUARTER 2006 Highlights from second quarter 2006 include: Strong performance in all business areas Revenues of 1,021 MNOK (+72 percent relative to 593 MNOK in second quarter 2005) Operating profit
Quarterly Report 3/2003
 Quarterly Report 3/2003 Residential repair and maintenence demand close to normal level. Slower construction market in Norway and Sweden. Revenues and profit after nine months on same level as last year.
Abbey plc ( Abbey or the Company ) Interim Statement for the six months ended 31 October 2007
 Interim Statement for the six months ended 31 October 2007") Abbey plc ( Abbey or the Company ) Interim Statement for the six months ended 31 October 2007 The Board of Abbey plc reports a profit before taxation of 18.20m which compares with a profit of 22.57m for
Abbey plc ( Abbey or the Company ) Interim Statement for the six months ended 31 October 2007 The Board of Abbey plc reports a profit before taxation of 18.20m which compares with a profit of 22.57m for
Brief Report on Closing of Accounts (connection) for the Term Ended March 31, 2007
 for the Term Ended March 31, 2007") MARUHAN Co., Ltd. Brief Report on Closing of (connection) for the Term Ended March 31, 2007 (Amounts less than 1 million yen omitted) 1.Business Results for the term ended on March, 2007 (From April 1,
MARUHAN Co., Ltd. Brief Report on Closing of (connection) for the Term Ended March 31, 2007 (Amounts less than 1 million yen omitted) 1.Business Results for the term ended on March, 2007 (From April 1,
SUMMARY INTERIM REPORT 1Q2015
 1st QUARTER REPORT 2015 1 SUMMARY INTERIM REPORT 1Q2015 The result for Norwegian Hull Club (NHC) in the first quarter of 2015 is minus USD 9.3 million. Technical result of insurance operations is minus
Herzogenaurach, Germany, July 27, 2004 PUMA AG announces its consolidated nd
 P Quarter P Half-Year For immediate release MEDIA CONTACT: INVESTOR CONTACT: U.S.A.: Lisa Beachy, Tel. +1 617 488 2945 Europe: Ulf Santjer, Tel. +49 9132 81 2489 Dieter Bock, Tel. +49 9132 81 2261 Herzogenaurach,
INTERIM REPORT H1 2015/16
 I C GR OUP Company Announcement no. 4 /2016 INTERIM REPORT Consolidated revenue for amounted to DKK 1,446 million (DKK 1,426 million) corresponding to an increase of 1.4%, or 2.3% measured in local currency,
PONSSE PLC, STOCK EXCHANGE RELEASE, 26 OCTOBER 2010, 9:00 a.m. PONSSE S INTERIM REPORT FOR 1 JANUARY 30 SEPTEMBER 2010
 PONSSE PLC, STOCK EXCHANGE RELEASE, 26 OCTOBER 2010, 9:00 a.m. PONSSE S INTERIM REPORT FOR 1 JANUARY 30 SEPTEMBER 2010 - Net sales were EUR 171.8 (Q1-Q3/2009 EUR 98.9) million. - Q3 net sales were EUR
I D E A S M E A N D Y N A M I C F O R C E
 I D E A S M E A N D Y N A M I C F O R C E INTERIM REPORT I/27 D Y N A M I C F O R C E M E A N S P R O G R E S S KEY FIGURES (HGB) Group 31/3/27 31/3/26 Revenue EUR millions 2.4 17.6 Foreign share % 68.1
Note 2 SIGNIFICANT ACCOUNTING
 Note 2 SIGNIFICANT ACCOUNTING POLICIES BASIS FOR THE PREPARATION OF THE FINANCIAL STATEMENTS The consolidated financial statements have been prepared in accordance with International Financial Reporting
Consolidated balance sheet
 Consolidated balance sheet Non current assets 31/12/2009 31/12/2008 (*) 01/01/2008 (*) Property, plant and equipment 1,352 1,350 1,144 Investment property 7 11 11 Fixed assets held under concessions 13,089
Q3 2015. Oslo 12 November 2015 Baard Schumann, CEO Sverre Molvik, CFO
 Q3 2015 Oslo 12 November 2015 Baard Schumann, CEO Sverre Molvik, CFO Agenda Highlights Operational update Financial update Market Outlook and summary 2 HIGHLIGHTS Highlights Q3 2015 Continued strong margins
Oslo Børs Holding ASA third quarter 2006
 Oslo Børs Holding ASA third quarter 2006 Third quarter highlights: Continuing high level of trading activity Operating revenues: NOK 110.4 million (91.2) Operating profit: NOK 53.6 million (52.9) Earnings
NORWEGIAN AIR SHUTTLE ASA QUARTERLY REPORT THIRD QUARTER 2005 [This document is a translation from the original Norwegian version]
![NORWEGIAN AIR SHUTTLE ASA QUARTERLY REPORT THIRD QUARTER 2005 [This document is a translation from the original Norwegian version]](/thumbs/40/21604770.jpg "NORWEGIAN AIR SHUTTLE ASA QUARTERLY REPORT THIRD QUARTER 2005 [This document is a translation from the original Norwegian version]") NORWEGIAN AIR SHUTTLE ASA QUARTERLY REPORT THIRD QUARTER 2005 THIRD QUARTER IN BRIEF The operating revenue has increased by 78 % to MNOK 589,9 compared to MNOK 331,7 in the same period last year. The total
NORWEGIAN AIR SHUTTLE ASA QUARTERLY REPORT THIRD QUARTER 2005 THIRD QUARTER IN BRIEF The operating revenue has increased by 78 % to MNOK 589,9 compared to MNOK 331,7 in the same period last year. The total
NOTES NOTE 1 SUBSIDIARIES NOTE 2 RECEIVABLES. Cash flow statement
 Blueway annual report 2010 Blueway AS Notes to the Accounts 47 Taxes related to paid group contributions which is booked as an increase of the cost price of the related shares, and taxes related to received
interim report 1st kvartal 2008 BN Boligkreditt AS
 interim report 1st kvartal 2008 BN Boligkreditt AS innhold Styrets beretning...3 Resultatregnskap...4 Balanse...4 Endring i egenkapital...5 Kontantstrømanalyse...5 Noter...6 [ 2 ] BN Boligkreditt Accounting
CENIT AG Systemhaus. Industriestraße 52-54 D-70565 Stuttgart Tel: + 49 711 7825-30 Fax: + 49 711 7825-4000 Internet: http://www.cenit.
 9 Months Report 2007 CENIT AG Systemhaus Industriestraße 52-54 D-70565 Stuttgart Tel: + 49 711 7825-30 Fax: + 49 711 7825-4000 Internet: http://www.cenit.de Investor Relations: ISIN:DE0005407100 Fabian
CONSOLIDATED STATEMENT OF INCOME
 CONSOLIDATED STATEMENT OF INCOME 4 th quarter (a) 3 rd quarter 4 th quarter 2009 Sales 40,157 40,180 36,228 Excise taxes (4,397) (4,952) (4,933) Revenues from sales 35,760 35,228 31,295 Purchases, net
For Immediate Release Toronto Stock Exchange Symbol: RC
 For Immediate Release Toronto Stock Exchange Symbol: RC RDM Corporation Reports Third Quarter Financial Results Payment Processing Services Revenue grows 15% year over year WATERLOO, ON, July 26, 2012
FINANCIAL REPORT H1 2014
 FINANCIAL REPORT H1 2014 HIGH SPEED BY PASSION 02_Key Figures 03_Group Status Report 05_Consolidated Financial Statements 10_Notes 11_Declaration of the Legal Representatives 02 PANKL KEY FIGURES EARNING
Consolidated Financial Results for the nine months of Fiscal Year 2010
 Consolidated Financial Results for the nine months of Fiscal Year 2010 (Fiscal Year 2010: Year ending March 31, 2010) Noritake Co., Limited Company Name Stock Exchange Listings Tokyo, Nagoya Code Number
INTERIM REPORT 2012 FOURTH QUARTER (Q4)
") INTERIM REPORT 2012 FOURTH QUARTER (Q4) Summary - In January 2013 Norway Seafoods entered into an agreement to sell most of the company s Farming operations in France - Revenue in the fourth quarter came
INTERIM REPORT 2012 FOURTH QUARTER (Q4) Summary - In January 2013 Norway Seafoods entered into an agreement to sell most of the company s Farming operations in France - Revenue in the fourth quarter came
Summary of Consolidated Financial Results for the Year Ended March 31, 2016 (Based on Japanese GAAP)
") Translation Notice: This document is an excerpt translation of the original Japanese document and is only for reference purposes. In the event of any discrepancy between this translated document and the
Translation Notice: This document is an excerpt translation of the original Japanese document and is only for reference purposes. In the event of any discrepancy between this translated document and the
Consolidated Statement of Profit or Loss (in million Euro)
") Consolidated Statement of Profit or Loss (in million Euro) Q2 2012 Q2 2013 % H1 2012 H1 2013 % Restated * change Restated * change Revenue 779 732-6.0% 1,513 1,437-5.0% Cost of sales (553) (521) -5.8%
Consolidated Statement of Profit or Loss (in million Euro) Q2 2012 Q2 2013 % H1 2012 H1 2013 % Restated * change Restated * change Revenue 779 732-6.0% 1,513 1,437-5.0% Cost of sales (553) (521) -5.8%
Interim presentation Second quarter 2015
 Interim presentation Second quarter 2015 Sverre Hurum. CEO Erik Stubø. CFO 27 August 2015 Highlights in the second quarter Revenues and EBIT Operating revenues increased by 14.3 percent to NOK 315.7 million
4th Quarter 2009 Results Presentation. A challenging quarter
 4th Quarter 2009 Results Presentation A challenging quarter Contents Headlines Financial results Operations and market Going forward Q4 09 Headlines Challenging quarter for Simtronics Results affected
3. CONSOLIDATED QUARTERLY FINANCIAL STATEMENTS
 3. CONSOLIDATED QUARTERLY FINANCIAL STATEMENTS (1) Consolidated Quarterly Balance Sheets September 30, 2014 and March 31, 2014 Supplementary Information 2Q FY March 2015 March 31, 2014 September 30, 2014