Statistical Considerations in Magnetic Resonance Imaging of Brain Function
|
|
|
- Dustin Waters
- 8 years ago
- Views:
Transcription
1 Statistical Considerations in Magnetic Resonance Imaging of Brain Function Brian D. Ripley Professor of Applied Statistics University of Oxford ripley

2 Acknowledgements Most of the computations were done by Jonathan Marchini (EPSRC-funded D.Phil student). Data, background and advice provided by Peter Styles (MRC Biochemical and Clinical Magnetic Resonance Spectroscopy Unit) and Stephen Smith (Oxford Centre for Functional Magnetic Resonance Imaging of the Brain).
 and Stephen Smith (Oxford")
3 Functional Imaging Functional PET and MRI are used for studies of brain function: give a subject a task and see which area(s) of the brain light up. Functional studies were done with PET in the late 1980s and early 1990s, now fmri is becoming possible (needs powerful magnets that in Oxford is 3 Tesla). PET has lower resolution, say mm voxels at best. So although (say) grids might be used, this is done by subsampling. Comparisons are made between PET images in two states (e.g. rest and stimulus ) and analysis is made on the difference image. PET images are very noisy, and results are averaged across several subjects. fmri has a higher spatial resolution, and temporal resolution of around one second. So stimuli are applied for a period of about 30 secs, images taken around every 3 secs, with several repeats of the stimulus being available for one subject.

4 The commonly addressed statistical issue is has the brain state changed, andifsowhere?

5 Neurological Change A longer-term view of function is in the change of tissue state and neurological function after traumatic events such as a stroke or tumour growth and removal. The aim here is to identify tissue as normal, impaired or dead, and to compare images from a patient taken over a period of several months. In MRI can trade temporal, spatial and spectral resolution. In MR spectroscopy the aim is a more detailed chemical analysis at a fairly low spatial resolution. In principle chemical shift imaging provides a spectroscopic view at each of a limited number of voxels: in practice certain aspects of the chemical composition are concentrated on.

6 Pilot Study Our initial work has been exploring T1 and T2 images (the conventional MRI measurements) to classify brain tissue automatically, with the aim of developing ideas to be applied to spectroscopic measurements at lower resolutions. Consider image to be made up of white matter, grey matter, CSF (cerebro spinal fluid) and skull. Initial aim is reliable automatic segmentation.
 and skull.")
7 Some Data T1 (left) and T2 (right) MRI sections of a normal human brain. This slice is of pixels.

8 Data from the same image in T1 T2 space.

9 Imaging Imperfections The clusters in the T1 T2 plot were surprising diffuse. Known imperfections were: (a) Mixed voxel / partial volume effects. The tissue within a voxel may not be all of one class. (b) A bias field in which the mean intensity from a tissue type varies across the image. This effect is thought to vary approximately multiplicatively and to consist of a radial component plus a linear component, the latter varying from day to day. (c) The point spread function. Because of bandwidth limitations in the Fourier domain in which the image is acquired, the true observed image is convolved with a spatial point spread function of sinc (sin x/x) form. The effect can sometimes be seen at sharp interfaces (most often the skull / tissue interface) as a rippling effect, but is thought to be small.
 form.")
10 Bias Fields There is an extensive literature on bias field correction. One approach uses a stochastic process prior for the bias field, and is thus another re-invention of the ideas known as kriging in the geostatistical literature. Based on experience with the difficulty of choosing the degree of smoothing and the lack of resistance to outliers (kriging is based on assumptions of Gaussian processes) we prefer methods with more statistical content and control. Our basic model is log Y ij = µ + β class(ij) + s(i, j)+ɛ ij for the intensity at voxel (i, j), studied independently for each of the T1 and T2 responses. Here s(x, y) is a spatially smooth function. Of course, the equation depends on the classification, which will itself depend on the predicted bias field. This circularity is solved by iterative procedure, starting with no bias field.
 + s(i, j)+ɛ ij for the intensity at voxel (i, j), studied independently for each of the T1 and T2 responses.")
11 Estimation If the classification were known we would use a robust method that fits a long-tailed distribution for ɛ ij, unconstrained terms α j for each class, and a smooth function s. We cope with unknown class in two ways. In the early stages of the process we only include data points whose classification is nearly certain, and later we use log Y ij = µ + β c p(c Y ij )+s(i, j)+ɛ ij class c that is, we average the class term over the posterior probabilities for the current classification. For the smooth term s we initially fitted a linear trend plus a spline model in the distance from the central axis of the magnet, but this did not work well, so we switched to loess. Loess is based on fitting a linear surface locally plus approximation techniques to avoid doing for the order of fits.

12 Fits of bias fields Fitted bias fields for T1 (left) and T2 (right) images. The bias fields for these images are not large and change intensity by 5 10%.

13 Clustering model Our model is that for the bias-corrected images (Y ij /ŝ(i, j)) T1andT2 measurements jointly follow a mixture of six distributions. The bivariate distributions for the six classes will have elliptical contours. We have experimented with normal and bivariate t distributions: the latter are often desirable as the normal density decays extremely rapidly. These should correspond to white matter, grey matter, CSF, two types of skull (the distribution of skull seems to split into two ellipses) and outlier, a diffuse distribution picking up the isolated points. Our fitting approach is unsupervised, but the initial locations of the cluster are taken from a reference model whose clusters were labelled by interactive visualization.
 and outlier, a diffuse distribution picking up")
14 Fitting the model There is an extensive literature on fitting mixtures of densities, and using them as a model for classification. There are two distinct approaches in the literature, and the one we have taken is Bayesian rather than maximum likelihood in character. That is, we estimate the parameters in a finite mixture model 6 p(t 1,T2) = π i p i (T 1,T2; φ i ) and then use the posterior probabilities for a soft classification. i=1 This in contrast to, e.g. Banfield & Raftery (1993), who simultaneously maximize over the parameters and the classification of the observations. Fitting the parameters (π i ) and (φ i ) is currently by maximum-likelihood, although we will investigate using Markov Chain Monte Carlo methods for a full Bayesian scheme with linked hyperpriors.
, who simultaneously maximize over the parameters and the classification of the observations.")
15 Unsupervised Approach Banfield & Raftery (1993) Biometrics T1, T2 and PD images of an MRI brain slice with voxels.

16 They claim to find seven clusters:

17 Spatial locations of the 7 clusters, labelled in retrospect as A: Bone, B: Air: C: White matter, D: Fluids, E: Muscle, F: Fat and G: Grey matter.

18 Our Results Classified image and T1 T2 plot showing the classification with normally-distributed clusters.

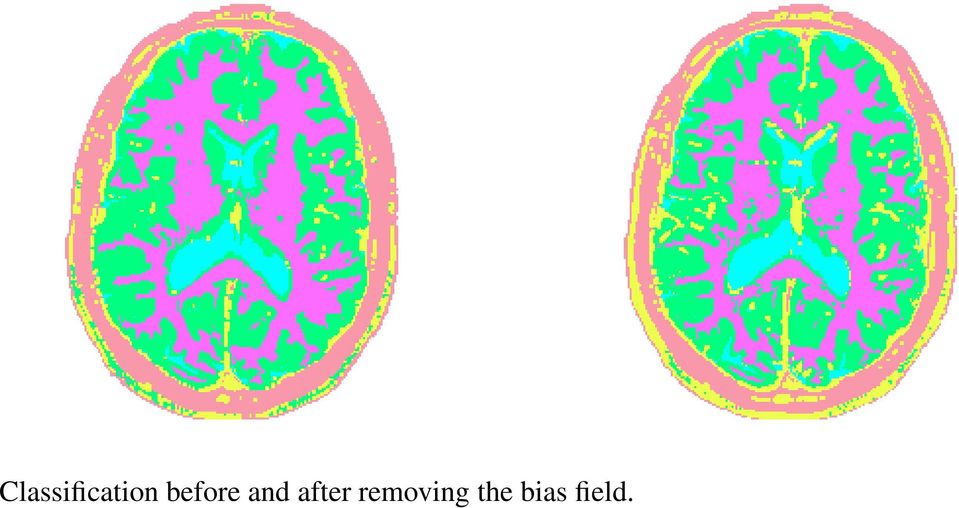
19 Classification before and after removing the bias field.
20 Raw T1 and T2 images. A Second Dataset

21 Second data set: before bias-field correction.
22 Second data set: after bias-field correction.
23 Outliers and anomalies We have found our scheme to be quite robust to variation in imaging conditions and to different normal subjects. The background class helps greatly in achieving this robustness as it mops up the observations which do not agree with the model. However, outliers can be more extreme:
24 T1 T2 plot of a brain slice of a brain with a pathology.
25 This illustrates the dangers of classifying all the points. This is a particularly common mistake when neural networks are used for classification, and we have seen MRI brain scans classified by neural networks where common sense suggested an outlier report was the appropriate one. The procedure presented here almost entirely ignores the spatial nature of the image. For some purposes this would be a severe criticism, as contextual classification would be appropriate. However, our interest in these images is not a pretty picture but is indeed in the anomalies, and for that we prefer to stay close to the raw data. The other interest is in producing summary measures that can be compared across time.
26 Part 2: Statistics of fmri Data
27 SPM Statistical Parametric Mapping is a widely used program and methodology of Friston and co-workers, originating with PET. The idea is to map tstatistic images, and to set a threshold for statistical significance. The t-statistic is in PET of a comparison between states over a number of subjects, voxel by voxel. Thus the numerator is an average over subjects of the difference in response in the two states, and the denominator is an estimate of the standard error of the numerator. The details differ widely between studies, in particular if a pixel-by-pixel or global estimate of variance is used.
28 Example PET Statistics Images From Holmes et al (1996). Mean difference image. Voxel-wise variance image.
29 Voxel-wise t statistic image. Smoothed variance image. Resulting t statistic image.
30 Multiple comparisons Finding the voxel(s) with highest SPM values should detect the areas of the brain with most change, but does not say they are significant changes. The t distribution might apply at one voxel, but it does not apply to the voxel with the largest response. Conventional multiple comparison methods (e.g. Bonferroni) will greatly over-compensate as the voxel values are far from independent, so the effective number of observations is far fewer that the number of voxels (which might themselves represent sub-sampling).
31 Three main approaches: 1. (High) level crossings of Gaussian stochastic processes (Worsley et al). 2. Randomization-based analysis (Holmes et al). 3. Variability within the time series at a voxel. Clearly components of variance need to be considered carefully (and have not been). Issue: do we want the voxels of highest values, or do we want regions of high value?
32 Euler Characteristics The Worsley et al approach is based on modelling the SPM image X ijk as a Gaussian (later relaxed) stochastic process in continuous space with a Gaussian autocorrelation function (possibly geometrically anisotropic). The autocorrelation function must be estimated from the data, but to some considerable extent is imposed by low-pass filtering. For such processes there are results (Hasofer, Adler) on the level sets {x : X(x) >x 0 }. These will be made up of components, themselves containing holes. The results are on the expected Euler characteristic (number of sets minus holes) as function of x 0, but for large x 0 there is a negligible probability of a hole, and the number is approximately Poisson distributed. Thus we can choose x 0 such that under the null hypothesis P (X(x) >x 0 for any x A) 5% Note that this is based on variability within a single image to address the multiple comparisons point.
33 Randomization-based Statistics Classical statistical inference of designed experiments is based on the uncertainly introduced by the randomization, and not on any natural variability. (Approach associated with Fisher and Yates.) A typical fpet or fmri experiment compares two states, say A and B. If there is no difference between the states we can flip the labels within each pair (for each subject in PET, for each repetition subject in fmri). If there are n pairs, there are 2 n possible A B or B A labellings. If there is no difference, these all give equally likely values of an observed statistic, so compared observed statistic to the permutation distribution. Can choose any statistic one can compute fairly easily.
34 The permutation distribution is often remarkably well approximated by a t distribution. Classic example (Box, Hunter & Hunter, 1977) Empirical and Hypothesized t CDFs Permutation dsn t_9 cdf diff solid line is the empirical d.f.
35 Time-Series-based Statistics The third component of variability is within the time series at each voxel. Suppose there were no difference between A and B. Then we have a stationary autocorrelated time series, and we want to estimate its mean and the standard error of that mean. This is a well-known problem in the output analysis of (discrete-event) simulations. More generally, we want the mean of the A and B phases, and there will be a delayed response (approximately known) giving a cross-over effect. Instead, use a matched filter (sin wave?) to extract effect, and estimated autocorrelations (like Hannan estimation) or spectral theory to estimate variability. For a sin wave the theory is particularly easy: the log absolute value of response has a Gumbel distribution with location depending on the true activation.
36 fmri Example Data on grid of voxels. (Illustrations omit top and bottom slices and front and back slices, all of which show considerable activity, probably due to registration effects.) A series of 100 images at 3 sec intervals: a visual stimulus was applied after 30 secs for 30 secs, and the A B pattern repeated 5 times. Conventionally the images are filtered in both space and time, both highpass filtering to remove trends and low-pass filtering to reduce noise (and maketheeulercharacteristicresultsvalid). Theresultingt statistics images are shown on the next slide. These have variances estimated for each voxel based on the time series at that voxel.
37 slice 1 slice 2 slice 3 slice 4 slice 5 slice 6 slice 7 slice 8 slice 9 slice 10 slice 11 slice 12 Conventional t statistic images
38 Alternative Analyses We also worked with the raw data, and matched a filter to the expected pattern of response (square wave input, modified by the haemodynamic response). This produced much more extreme deviations from the background variation, and much more compact areas of response Histogram of log abs filtered response log abs filtered response
39 slice 1 slice 2 slice 3 slice 4 slice 5 slice 6 slice 7 slice 8 slice 9 slice 10 slice 11 slice 12 Log abs filtered response, with small values coloured as background.
Mining Information from Brain Images
 Mining Information from Brain Images Brian D. Ripley Professor of Applied Statistics University of Oxford ripley@stats.ox.ac.uk http://www.stats.ox.ac.uk/ ripley/talks.html Outline Part 1: Characterizing
Data Mining: Large Databases and Methods. or... Finding Needles in Haystacks: Finding unusual patterns in large data sets. Data Mining & Data Dredging
 Data Mining & Data Dredging Data Mining: Large Databases and Methods Brian D. Ripley or... Professor of Applied Statistics University of Oxford Fifteen years ago data mining was a pejorative phrase amongst
The Wondrous World of fmri statistics
 Outline The Wondrous World of fmri statistics FMRI data and Statistics course, Leiden, 11-3-2008 The General Linear Model Overview of fmri data analysis steps fmri timeseries Modeling effects of interest
2. MATERIALS AND METHODS
 Difficulties of T1 brain MRI segmentation techniques M S. Atkins *a, K. Siu a, B. Law a, J. Orchard a, W. Rosenbaum a a School of Computing Science, Simon Fraser University ABSTRACT This paper looks at
Validating cluster size inference: random field and permutation methods
 NeuroImage 20 (2003) 2343 2356 www.elsevier.com/locate/ynimg Validating cluster size inference: random field and permutation methods Satoru Hayasaka and Thomas E. Nichols* Department of Biostatistics,
Geostatistics Exploratory Analysis
 Instituto Superior de Estatística e Gestão de Informação Universidade Nova de Lisboa Master of Science in Geospatial Technologies Geostatistics Exploratory Analysis Carlos Alberto Felgueiras cfelgueiras@isegi.unl.pt
Volume visualization I Elvins
 Volume visualization I Elvins 1 surface fitting algorithms marching cubes dividing cubes direct volume rendering algorithms ray casting, integration methods voxel projection, projected tetrahedra, splatting
STA 4273H: Statistical Machine Learning
 STA 4273H: Statistical Machine Learning Russ Salakhutdinov Department of Statistics! rsalakhu@utstat.toronto.edu! http://www.cs.toronto.edu/~rsalakhu/ Lecture 6 Three Approaches to Classification Construct
Norbert Schuff Professor of Radiology VA Medical Center and UCSF Norbert.schuff@ucsf.edu
 Norbert Schuff Professor of Radiology Medical Center and UCSF Norbert.schuff@ucsf.edu Medical Imaging Informatics 2012, N.Schuff Course # 170.03 Slide 1/67 Overview Definitions Role of Segmentation Segmentation
Spatial smoothing of autocorrelations to control the degrees of freedom in fmri analysis
 Spatial smoothing of autocorrelations to control the degrees of freedom in fmri analysis K.J. Worsley March 1, 25 Department of Mathematics and Statistics, McGill University, 85 Sherbrooke St. West, Montreal,
Thresholding of Statistical Maps in Functional Neuroimaging Using the False Discovery Rate 1
 NeuroImage 15, 870 878 (2002) doi:10.1006/nimg.2001.1037, available online at http://www.idealibrary.com on Thresholding of Statistical Maps in Functional Neuroimaging Using the False Discovery Rate 1
HT2015: SC4 Statistical Data Mining and Machine Learning
 HT2015: SC4 Statistical Data Mining and Machine Learning Dino Sejdinovic Department of Statistics Oxford http://www.stats.ox.ac.uk/~sejdinov/sdmml.html Bayesian Nonparametrics Parametric vs Nonparametric
Tutorial 5: Hypothesis Testing
 Tutorial 5: Hypothesis Testing Rob Nicholls nicholls@mrc-lmb.cam.ac.uk MRC LMB Statistics Course 2014 Contents 1 Introduction................................ 1 2 Testing distributional assumptions....................
Environmental Remote Sensing GEOG 2021
 Environmental Remote Sensing GEOG 2021 Lecture 4 Image classification 2 Purpose categorising data data abstraction / simplification data interpretation mapping for land cover mapping use land cover class
Image Registration and Fusion. Professor Michael Brady FRS FREng Department of Engineering Science Oxford University
 Image Registration and Fusion Professor Michael Brady FRS FREng Department of Engineering Science Oxford University Image registration & information fusion Image Registration: Geometric (and Photometric)
Data Preparation and Statistical Displays
 Reservoir Modeling with GSLIB Data Preparation and Statistical Displays Data Cleaning / Quality Control Statistics as Parameters for Random Function Models Univariate Statistics Histograms and Probability
How To Understand The Theory Of Probability
 Graduate Programs in Statistics Course Titles STAT 100 CALCULUS AND MATR IX ALGEBRA FOR STATISTICS. Differential and integral calculus; infinite series; matrix algebra STAT 195 INTRODUCTION TO MATHEMATICAL
EXPLORING SPATIAL PATTERNS IN YOUR DATA
 EXPLORING SPATIAL PATTERNS IN YOUR DATA OBJECTIVES Learn how to examine your data using the Geostatistical Analysis tools in ArcMap. Learn how to use descriptive statistics in ArcMap and Geoda to analyze
Obtaining Knowledge. Lecture 7 Methods of Scientific Observation and Analysis in Behavioral Psychology and Neuropsychology.
 Lecture 7 Methods of Scientific Observation and Analysis in Behavioral Psychology and Neuropsychology 1.Obtaining Knowledge 1. Correlation 2. Causation 2.Hypothesis Generation & Measures 3.Looking into
Machine Learning for Medical Image Analysis. A. Criminisi & the InnerEye team @ MSRC
 Machine Learning for Medical Image Analysis A. Criminisi & the InnerEye team @ MSRC Medical image analysis the goal Automatic, semantic analysis and quantification of what observed in medical scans Brain
Medical Image Processing on the GPU. Past, Present and Future. Anders Eklund, PhD Virginia Tech Carilion Research Institute andek@vtc.vt.
 Medical Image Processing on the GPU Past, Present and Future Anders Eklund, PhD Virginia Tech Carilion Research Institute andek@vtc.vt.edu Outline Motivation why do we need GPUs? Past - how was GPU programming
Spatial sampling effect of laboratory practices in a porphyry copper deposit
 Spatial sampling effect of laboratory practices in a porphyry copper deposit Serge Antoine Séguret Centre of Geosciences and Geoengineering/ Geostatistics, MINES ParisTech, Fontainebleau, France ABSTRACT
Data Mining and Visualization
 Data Mining and Visualization Jeremy Walton NAG Ltd, Oxford Overview Data mining components Functionality Example application Quality control Visualization Use of 3D Example application Market research
Institute of Actuaries of India Subject CT3 Probability and Mathematical Statistics
 Institute of Actuaries of India Subject CT3 Probability and Mathematical Statistics For 2015 Examinations Aim The aim of the Probability and Mathematical Statistics subject is to provide a grounding in
Probabilistic Latent Semantic Analysis (plsa)
") Probabilistic Latent Semantic Analysis (plsa) SS 2008 Bayesian Networks Multimedia Computing, Universität Augsburg Rainer.Lienhart@informatik.uni-augsburg.de www.multimedia-computing.{de,org} References
Probabilistic Latent Semantic Analysis (plsa) SS 2008 Bayesian Networks Multimedia Computing, Universität Augsburg Rainer.Lienhart@informatik.uni-augsburg.de www.multimedia-computing.{de,org} References
Multisensor Data Fusion and Applications
 Multisensor Data Fusion and Applications Pramod K. Varshney Department of Electrical Engineering and Computer Science Syracuse University 121 Link Hall Syracuse, New York 13244 USA E-mail: varshney@syr.edu
INTRODUCTION TO GEOSTATISTICS And VARIOGRAM ANALYSIS
 INTRODUCTION TO GEOSTATISTICS And VARIOGRAM ANALYSIS C&PE 940, 17 October 2005 Geoff Bohling Assistant Scientist Kansas Geological Survey geoff@kgs.ku.edu 864-2093 Overheads and other resources available
Subjects: Fourteen Princeton undergraduate and graduate students were recruited to
 Supplementary Methods Subjects: Fourteen Princeton undergraduate and graduate students were recruited to participate in the study, including 9 females and 5 males. The mean age was 21.4 years, with standard
Direct Volume Rendering Elvins
 Direct Volume Rendering Elvins 1 Principle: rendering of scalar volume data with cloud-like, semi-transparent effects forward mapping object-order backward mapping image-order data volume screen voxel
Component Ordering in Independent Component Analysis Based on Data Power
 Component Ordering in Independent Component Analysis Based on Data Power Anne Hendrikse Raymond Veldhuis University of Twente University of Twente Fac. EEMCS, Signals and Systems Group Fac. EEMCS, Signals
Least Squares Estimation
 Least Squares Estimation SARA A VAN DE GEER Volume 2, pp 1041 1045 in Encyclopedia of Statistics in Behavioral Science ISBN-13: 978-0-470-86080-9 ISBN-10: 0-470-86080-4 Editors Brian S Everitt & David
Advanced Signal Processing and Digital Noise Reduction
 Advanced Signal Processing and Digital Noise Reduction Saeed V. Vaseghi Queen's University of Belfast UK WILEY HTEUBNER A Partnership between John Wiley & Sons and B. G. Teubner Publishers Chichester New
Introduction to Time Series Analysis. Lecture 1.
 Introduction to Time Series Analysis. Lecture 1. Peter Bartlett 1. Organizational issues. 2. Objectives of time series analysis. Examples. 3. Overview of the course. 4. Time series models. 5. Time series
Lecture 2: Descriptive Statistics and Exploratory Data Analysis
 Lecture 2: Descriptive Statistics and Exploratory Data Analysis Further Thoughts on Experimental Design 16 Individuals (8 each from two populations) with replicates Pop 1 Pop 2 Randomly sample 4 individuals
How To Calculate A Multiiperiod Probability Of Default
 Mean of Ratios or Ratio of Means: statistical uncertainty applied to estimate Multiperiod Probability of Default Matteo Formenti 1 Group Risk Management UniCredit Group Università Carlo Cattaneo September
COST AID ASL post- processing Workshop
 COST AID ASL post- processing Workshop This workshop runs thought the post- processing of ASL data using tools from the FMRIB Software Library (www.fmrib.ox.ac.uk.uk/fsl), we will primarily focus on the
Neural Networks Lesson 5 - Cluster Analysis
 Neural Networks Lesson 5 - Cluster Analysis Prof. Michele Scarpiniti INFOCOM Dpt. - Sapienza University of Rome http://ispac.ing.uniroma1.it/scarpiniti/index.htm michele.scarpiniti@uniroma1.it Rome, 29
GE Medical Systems Training in Partnership. Module 8: IQ: Acquisition Time
 Module 8: IQ: Acquisition Time IQ : Acquisition Time Objectives...Describe types of data acquisition modes....compute acquisition times for 2D and 3D scans. 2D Acquisitions The 2D mode acquires and reconstructs
Statistics Graduate Courses
 Statistics Graduate Courses STAT 7002--Topics in Statistics-Biological/Physical/Mathematics (cr.arr.).organized study of selected topics. Subjects and earnable credit may vary from semester to semester.
> plot(exp.btgpllm, main = "treed GP LLM,", proj = c(1)) > plot(exp.btgpllm, main = "treed GP LLM,", proj = c(2)) quantile diff (error)
) > plot(exp.btgpllm, main = treed GP LLM,, proj = c(2)) quantile diff (error)") > plot(exp.btgpllm, main = "treed GP LLM,", proj = c(1)) > plot(exp.btgpllm, main = "treed GP LLM,", proj = c(2)) 0.4 0.2 0.0 0.2 0.4 treed GP LLM, mean treed GP LLM, 0.00 0.05 0.10 0.15 0.20 x1 x1 0.4
> plot(exp.btgpllm, main = "treed GP LLM,", proj = c(1)) > plot(exp.btgpllm, main = "treed GP LLM,", proj = c(2)) 0.4 0.2 0.0 0.2 0.4 treed GP LLM, mean treed GP LLM, 0.00 0.05 0.10 0.15 0.20 x1 x1 0.4
Service courses for graduate students in degree programs other than the MS or PhD programs in Biostatistics.
 Course Catalog In order to be assured that all prerequisites are met, students must acquire a permission number from the education coordinator prior to enrolling in any Biostatistics course. Courses are
Auxiliary Variables in Mixture Modeling: 3-Step Approaches Using Mplus
 Auxiliary Variables in Mixture Modeling: 3-Step Approaches Using Mplus Tihomir Asparouhov and Bengt Muthén Mplus Web Notes: No. 15 Version 8, August 5, 2014 1 Abstract This paper discusses alternatives
A Statistical Framework for Operational Infrasound Monitoring
 A Statistical Framework for Operational Infrasound Monitoring Stephen J. Arrowsmith Rod W. Whitaker LA-UR 11-03040 The views expressed here do not necessarily reflect the views of the United States Government,
Normality Testing in Excel
 Normality Testing in Excel By Mark Harmon Copyright 2011 Mark Harmon No part of this publication may be reproduced or distributed without the express permission of the author. mark@excelmasterseries.com
Calculation of Minimum Distances. Minimum Distance to Means. Σi i = 1
 Minimum Distance to Means Similar to Parallelepiped classifier, but instead of bounding areas, the user supplies spectral class means in n-dimensional space and the algorithm calculates the distance between
Handling attrition and non-response in longitudinal data
 Longitudinal and Life Course Studies 2009 Volume 1 Issue 1 Pp 63-72 Handling attrition and non-response in longitudinal data Harvey Goldstein University of Bristol Correspondence. Professor H. Goldstein
Dirichlet forms methods for error calculus and sensitivity analysis
 Dirichlet forms methods for error calculus and sensitivity analysis Nicolas BOULEAU, Osaka university, november 2004 These lectures propose tools for studying sensitivity of models to scalar or functional
Annealing Techniques for Data Integration
 Reservoir Modeling with GSLIB Annealing Techniques for Data Integration Discuss the Problem of Permeability Prediction Present Annealing Cosimulation More Details on Simulated Annealing Examples SASIM
PATTERN RECOGNITION AND MACHINE LEARNING CHAPTER 4: LINEAR MODELS FOR CLASSIFICATION
 PATTERN RECOGNITION AND MACHINE LEARNING CHAPTER 4: LINEAR MODELS FOR CLASSIFICATION Introduction In the previous chapter, we explored a class of regression models having particularly simple analytical
Neural Network Add-in
 Neural Network Add-in Version 1.5 Software User s Guide Contents Overview... 2 Getting Started... 2 Working with Datasets... 2 Open a Dataset... 3 Save a Dataset... 3 Data Pre-processing... 3 Lagging...
Constrained Tetrahedral Mesh Generation of Human Organs on Segmented Volume *
 Constrained Tetrahedral Mesh Generation of Human Organs on Segmented Volume * Xiaosong Yang 1, Pheng Ann Heng 2, Zesheng Tang 3 1 Department of Computer Science and Technology, Tsinghua University, Beijing
Data Mining - Evaluation of Classifiers
 Data Mining - Evaluation of Classifiers Lecturer: JERZY STEFANOWSKI Institute of Computing Sciences Poznan University of Technology Poznan, Poland Lecture 4 SE Master Course 2008/2009 revised for 2010
Fairfield Public Schools
 Mathematics Fairfield Public Schools AP Statistics AP Statistics BOE Approved 04/08/2014 1 AP STATISTICS Critical Areas of Focus AP Statistics is a rigorous course that offers advanced students an opportunity
Cognitive Neuroscience. Questions. Multiple Methods. Electrophysiology. Multiple Methods. Approaches to Thinking about the Mind
 Cognitive Neuroscience Approaches to Thinking about the Mind Cognitive Neuroscience Evolutionary Approach Sept 20-22, 2004 Interdisciplinary approach Rapidly changing How does the brain enable cognition?
A simple and fast technique for on-line fmri data analysis
 Magnetic Resonance Imaging 20 (2002) 207 23 Technical note A simple and fast technique for on-line fmri data analysis Stefano Salvador a, Andrea Brovelli b, Renata Longo a, * a Dipartimento di Fisica,
Two Topics in Parametric Integration Applied to Stochastic Simulation in Industrial Engineering
 Two Topics in Parametric Integration Applied to Stochastic Simulation in Industrial Engineering Department of Industrial Engineering and Management Sciences Northwestern University September 15th, 2014
Bayesian Statistics: Indian Buffet Process
 Bayesian Statistics: Indian Buffet Process Ilker Yildirim Department of Brain and Cognitive Sciences University of Rochester Rochester, NY 14627 August 2012 Reference: Most of the material in this note
Morphological analysis on structural MRI for the early diagnosis of neurodegenerative diseases. Marco Aiello On behalf of MAGIC-5 collaboration
 Morphological analysis on structural MRI for the early diagnosis of neurodegenerative diseases Marco Aiello On behalf of MAGIC-5 collaboration Index Motivations of morphological analysis Segmentation of
Geography 4203 / 5203. GIS Modeling. Class (Block) 9: Variogram & Kriging
 9: Variogram & Kriging") Geography 4203 / 5203 GIS Modeling Class (Block) 9: Variogram & Kriging Some Updates Today class + one proposal presentation Feb 22 Proposal Presentations Feb 25 Readings discussion (Interpolation) Last
Geography 4203 / 5203 GIS Modeling Class (Block) 9: Variogram & Kriging Some Updates Today class + one proposal presentation Feb 22 Proposal Presentations Feb 25 Readings discussion (Interpolation) Last
NCSS Statistical Software Principal Components Regression. In ordinary least squares, the regression coefficients are estimated using the formula ( )
") Chapter 340 Principal Components Regression Introduction is a technique for analyzing multiple regression data that suffer from multicollinearity. When multicollinearity occurs, least squares estimates
Chapter 340 Principal Components Regression Introduction is a technique for analyzing multiple regression data that suffer from multicollinearity. When multicollinearity occurs, least squares estimates
Joint models for classification and comparison of mortality in different countries.
 Joint models for classification and comparison of mortality in different countries. Viani D. Biatat 1 and Iain D. Currie 1 1 Department of Actuarial Mathematics and Statistics, and the Maxwell Institute
Lecture 14. Point Spread Function (PSF)
") Lecture 14 Point Spread Function (PSF), Modulation Transfer Function (MTF), Signal-to-noise Ratio (SNR), Contrast-to-noise Ratio (CNR), and Receiver Operating Curves (ROC) Point Spread Function (PSF) Recollect
Lecture 14 Point Spread Function (PSF), Modulation Transfer Function (MTF), Signal-to-noise Ratio (SNR), Contrast-to-noise Ratio (CNR), and Receiver Operating Curves (ROC) Point Spread Function (PSF) Recollect
COMMENTS AND CONTROVERSIES Why Voxel-Based Morphometry Should Be Used
 NeuroImage 14, 1238 1243 (2001) doi:10.1006/nimg.2001.0961, available online at http://www.idealibrary.com on COMMENTS AND CONTROVERSIES Why Voxel-Based Morphometry Should Be Used John Ashburner 1 and
Diffusione e perfusione in risonanza magnetica. E. Pagani, M. Filippi
 Diffusione e perfusione in risonanza magnetica E. Pagani, M. Filippi DW-MRI DIFFUSION-WEIGHTED MRI Principles Diffusion results from a microspic random motion known as Brownian motion THE RANDOM WALK How
Why Taking This Course? Course Introduction, Descriptive Statistics and Data Visualization. Learning Goals. GENOME 560, Spring 2012
 Why Taking This Course? Course Introduction, Descriptive Statistics and Data Visualization GENOME 560, Spring 2012 Data are interesting because they help us understand the world Genomics: Massive Amounts
Spatial Statistics Chapter 3 Basics of areal data and areal data modeling
 Spatial Statistics Chapter 3 Basics of areal data and areal data modeling Recall areal data also known as lattice data are data Y (s), s D where D is a discrete index set. This usually corresponds to data
Iterative Solvers for Linear Systems
 9th SimLab Course on Parallel Numerical Simulation, 4.10 8.10.2010 Iterative Solvers for Linear Systems Bernhard Gatzhammer Chair of Scientific Computing in Computer Science Technische Universität München
Appendix 1: Time series analysis of peak-rate years and synchrony testing.
 Appendix 1: Time series analysis of peak-rate years and synchrony testing. Overview The raw data are accessible at Figshare ( Time series of global resources, DOI 10.6084/m9.figshare.929619), sources are
Linear Threshold Units
 Linear Threshold Units w x hx (... w n x n w We assume that each feature x j and each weight w j is a real number (we will relax this later) We will study three different algorithms for learning linear
Stock Option Pricing Using Bayes Filters
 Stock Option Pricing Using Bayes Filters Lin Liao liaolin@cs.washington.edu Abstract When using Black-Scholes formula to price options, the key is the estimation of the stochastic return variance. In this
Classic EEG (ERPs)/ Advanced EEG. Quentin Noirhomme
/ Advanced EEG. Quentin Noirhomme") Classic EEG (ERPs)/ Advanced EEG Quentin Noirhomme Outline Origins of MEEG Event related potentials Time frequency decomposition i Source reconstruction Before to start EEGlab Fieldtrip (included in spm)
Classic EEG (ERPs)/ Advanced EEG Quentin Noirhomme Outline Origins of MEEG Event related potentials Time frequency decomposition i Source reconstruction Before to start EEGlab Fieldtrip (included in spm)
Imputing Values to Missing Data
 Imputing Values to Missing Data In federated data, between 30%-70% of the data points will have at least one missing attribute - data wastage if we ignore all records with a missing value Remaining data
Leveraging Ensemble Models in SAS Enterprise Miner
 ABSTRACT Paper SAS133-2014 Leveraging Ensemble Models in SAS Enterprise Miner Miguel Maldonado, Jared Dean, Wendy Czika, and Susan Haller SAS Institute Inc. Ensemble models combine two or more models to
BayesX - Software for Bayesian Inference in Structured Additive Regression
 BayesX - Software for Bayesian Inference in Structured Additive Regression Thomas Kneib Faculty of Mathematics and Economics, University of Ulm Department of Statistics, Ludwig-Maximilians-University Munich
COMPARISON OF OBJECT BASED AND PIXEL BASED CLASSIFICATION OF HIGH RESOLUTION SATELLITE IMAGES USING ARTIFICIAL NEURAL NETWORKS
 COMPARISON OF OBJECT BASED AND PIXEL BASED CLASSIFICATION OF HIGH RESOLUTION SATELLITE IMAGES USING ARTIFICIAL NEURAL NETWORKS B.K. Mohan and S. N. Ladha Centre for Studies in Resources Engineering IIT
Enhanced LIC Pencil Filter
 Enhanced LIC Pencil Filter Shigefumi Yamamoto, Xiaoyang Mao, Kenji Tanii, Atsumi Imamiya University of Yamanashi {daisy@media.yamanashi.ac.jp, mao@media.yamanashi.ac.jp, imamiya@media.yamanashi.ac.jp}
More details on the inputs, functionality, and output can be found below.
 Overview: The SMEEACT (Software for More Efficient, Ethical, and Affordable Clinical Trials) web interface (http://research.mdacc.tmc.edu/smeeactweb) implements a single analysis of a two-armed trial comparing
Understanding Purposeful Human Motion
 M.I.T Media Laboratory Perceptual Computing Section Technical Report No. 85 Appears in Fourth IEEE International Conference on Automatic Face and Gesture Recognition Understanding Purposeful Human Motion
Multiphysics Software Applications in Reverse Engineering
 Multiphysics Software Applications in Reverse Engineering *W. Wang 1, K. Genc 2 1 University of Massachusetts Lowell, Lowell, MA, USA 2 Simpleware, Exeter, United Kingdom *Corresponding author: University
Image Segmentation and Registration
 Image Segmentation and Registration Dr. Christine Tanner (tanner@vision.ee.ethz.ch) Computer Vision Laboratory, ETH Zürich Dr. Verena Kaynig, Machine Learning Laboratory, ETH Zürich Outline Segmentation
Automated Stellar Classification for Large Surveys with EKF and RBF Neural Networks
 Chin. J. Astron. Astrophys. Vol. 5 (2005), No. 2, 203 210 (http:/www.chjaa.org) Chinese Journal of Astronomy and Astrophysics Automated Stellar Classification for Large Surveys with EKF and RBF Neural
Practical Tour of Visual tracking. David Fleet and Allan Jepson January, 2006
 Practical Tour of Visual tracking David Fleet and Allan Jepson January, 2006 Designing a Visual Tracker: What is the state? pose and motion (position, velocity, acceleration, ) shape (size, deformation,
5 Factors Affecting the Signal-to-Noise Ratio
 5 Factors Affecting the Signal-to-Noise Ratio 29 5 Factors Affecting the Signal-to-Noise Ratio In the preceding chapters we have learned how an MR signal is generated and how the collected signal is processed
Neuroimaging module I: Modern neuroimaging methods of investigation of the human brain in health and disease
 1 Neuroimaging module I: Modern neuroimaging methods of investigation of the human brain in health and disease The following contains a summary of the content of the neuroimaging module I on the postgraduate
DYNAMIC RANGE IMPROVEMENT THROUGH MULTIPLE EXPOSURES. Mark A. Robertson, Sean Borman, and Robert L. Stevenson
 c 1999 IEEE. Personal use of this material is permitted. However, permission to reprint/republish this material for advertising or promotional purposes or for creating new collective works for resale or
TINA Demo 003: The Medical Vision Tool
 TINA Demo 003 README TINA Demo 003: The Medical Vision Tool neil.thacker(at)manchester.ac.uk Last updated 6 / 10 / 2008 (a) (b) (c) Imaging Science and Biomedical Engineering Division, Medical School,
Quantitative Methods for Finance
 Quantitative Methods for Finance Module 1: The Time Value of Money 1 Learning how to interpret interest rates as required rates of return, discount rates, or opportunity costs. 2 Learning how to explain
7 Time series analysis
 7 Time series analysis In Chapters 16, 17, 33 36 in Zuur, Ieno and Smith (2007), various time series techniques are discussed. Applying these methods in Brodgar is straightforward, and most choices are
Comparison of Non-linear Dimensionality Reduction Techniques for Classification with Gene Expression Microarray Data
 CMPE 59H Comparison of Non-linear Dimensionality Reduction Techniques for Classification with Gene Expression Microarray Data Term Project Report Fatma Güney, Kübra Kalkan 1/15/2013 Keywords: Non-linear
How to Get More Value from Your Survey Data
 Technical report How to Get More Value from Your Survey Data Discover four advanced analysis techniques that make survey research more effective Table of contents Introduction..............................................................2
Introduction to Mobile Robotics Bayes Filter Particle Filter and Monte Carlo Localization
 Introduction to Mobile Robotics Bayes Filter Particle Filter and Monte Carlo Localization Wolfram Burgard, Maren Bennewitz, Diego Tipaldi, Luciano Spinello 1 Motivation Recall: Discrete filter Discretize
1 Maximum likelihood estimation
 COS 424: Interacting with Data Lecturer: David Blei Lecture #4 Scribes: Wei Ho, Michael Ye February 14, 2008 1 Maximum likelihood estimation 1.1 MLE of a Bernoulli random variable (coin flips) Given N
Magnetic Resonance Imaging
 Magnetic Resonance Imaging What are the uses of MRI? To begin, not only are there a variety of scanning methodologies available, but there are also a variety of MRI methodologies available which provide
Time Series Analysis
 JUNE 2012 Time Series Analysis CONTENT A time series is a chronological sequence of observations on a particular variable. Usually the observations are taken at regular intervals (days, months, years),
NCSS Statistical Software
 Chapter 06 Introduction This procedure provides several reports for the comparison of two distributions, including confidence intervals for the difference in means, two-sample t-tests, the z-test, the
Simultaneous or Sequential? Search Strategies in the U.S. Auto. Insurance Industry
 Simultaneous or Sequential? Search Strategies in the U.S. Auto Insurance Industry Elisabeth Honka 1 University of Texas at Dallas Pradeep Chintagunta 2 University of Chicago Booth School of Business September
Monitoring of Internet traffic and applications
 Monitoring of Internet traffic and applications Chadi BARAKAT INRIA Sophia Antipolis, France Planète research group ETH Zurich October 2009 Email: Chadi.Barakat@sophia.inria.fr WEB: http://www.inria.fr/planete/chadi
From the help desk: Bootstrapped standard errors
 The Stata Journal (2003) 3, Number 1, pp. 71 80 From the help desk: Bootstrapped standard errors Weihua Guan Stata Corporation Abstract. Bootstrapping is a nonparametric approach for evaluating the distribution
Data Mining: An Overview. David Madigan http://www.stat.columbia.edu/~madigan
 Data Mining: An Overview David Madigan http://www.stat.columbia.edu/~madigan Overview Brief Introduction to Data Mining Data Mining Algorithms Specific Eamples Algorithms: Disease Clusters Algorithms:
Simple Linear Regression Inference
 Simple Linear Regression Inference 1 Inference requirements The Normality assumption of the stochastic term e is needed for inference even if it is not a OLS requirement. Therefore we have: Interpretation